Blennerhassett, WV Map & Demographics
Blennerhassett Map
Blennerhassett Overview
$34,495
PER CAPITA INCOME
$82,198
AVG FAMILY INCOME
$80,783
AVG HOUSEHOLD INCOME
22.2%
WAGE / INCOME GAP [ % ]
77.8¢/ $1
WAGE / INCOME GAP [ $ ]
0.36
INEQUALITY / GINI INDEX
3,564
TOTAL POPULATION
1,596
MALE POPULATION
1,968
FEMALE POPULATION
81.10
MALES / 100 FEMALES
123.31
FEMALES / 100 MALES
40.7
MEDIAN AGE
3.4
AVG FAMILY SIZE
3.0
AVG HOUSEHOLD SIZE
1,609
LABOR FORCE [ PEOPLE ]
58.8%
PERCENT IN LABOR FORCE
5.0%
UNEMPLOYMENT RATE
Income in Blennerhassett
Income Overview in Blennerhassett
Per Capita Income in Blennerhassett is $34,495, while median incomes of families and households are $82,198 and $80,783 respectively.
| Characteristic | Number | Measure |
| Per Capita Income | 3,564 | $34,495 |
| Median Family Income | 950 | $82,198 |
| Mean Family Income | 950 | $103,663 |
| Median Household Income | 1,181 | $80,783 |
| Mean Household Income | 1,181 | $96,506 |
| Income Deficit | 950 | $0 |
| Wage / Income Gap (%) | 3,564 | 22.24% |
| Wage / Income Gap ($) | 3,564 | 77.76¢ per $1 |
| Gini / Inequality Index | 3,564 | 0.36 |
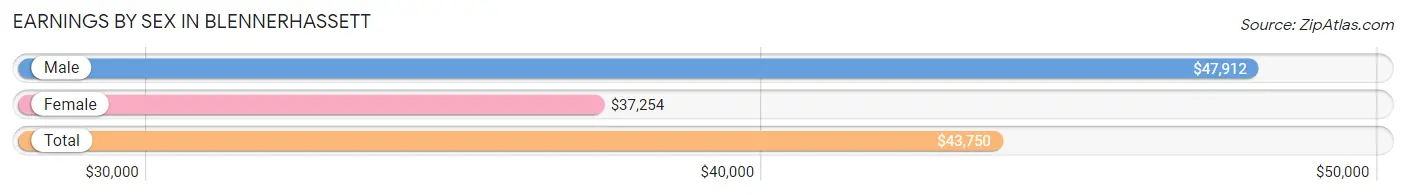
Earnings by Sex in Blennerhassett
Average Earnings in Blennerhassett are $43,750, $47,912 for men and $37,254 for women, a difference of 22.2%.
| Sex | Number | Average Earnings |
| Male | 849 (50.7%) | $47,912 |
| Female | 826 (49.3%) | $37,254 |
| Total | 1,675 (100.0%) | $43,750 |
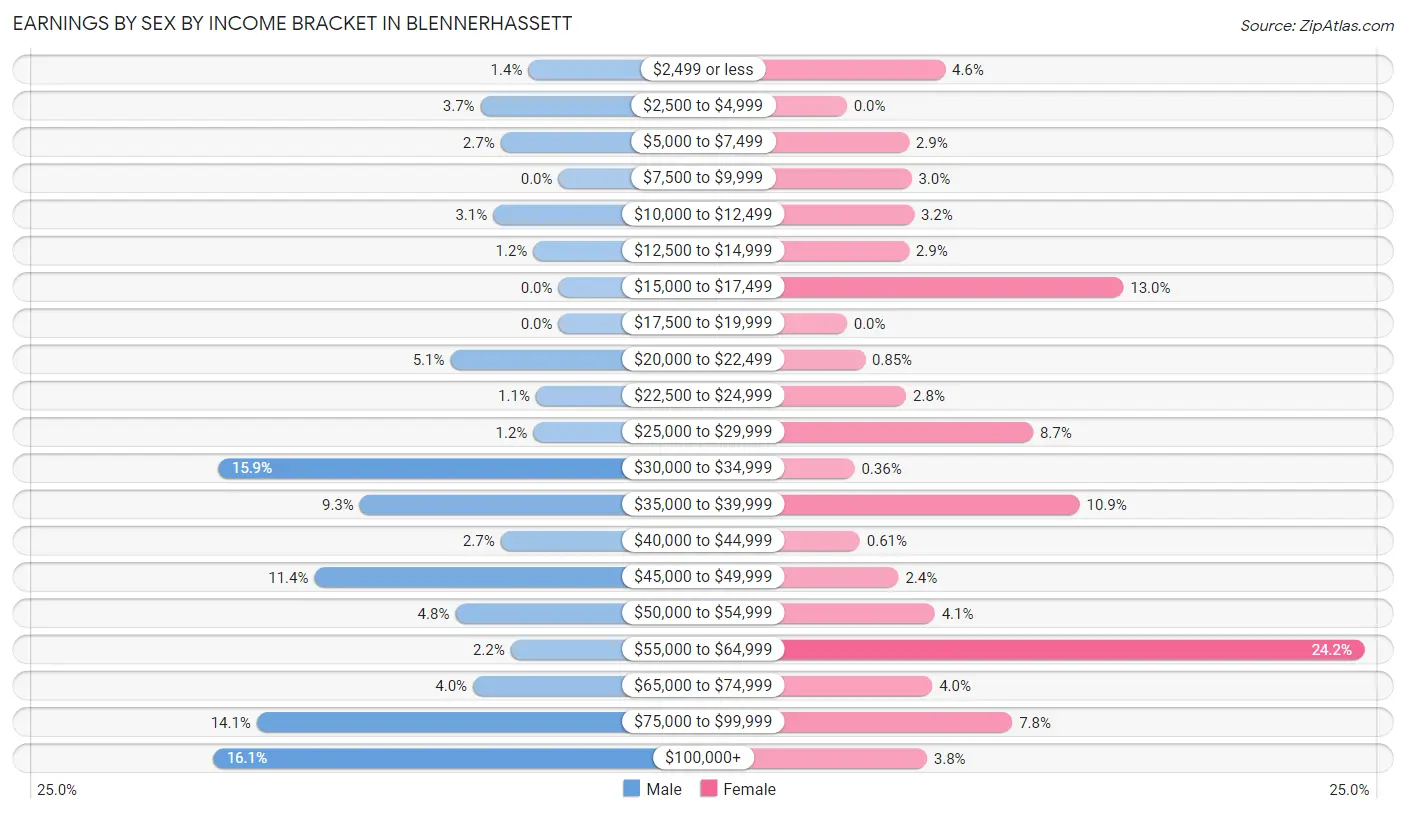
Earnings by Sex by Income Bracket in Blennerhassett
The most common earnings brackets in Blennerhassett are $100,000+ for men (137 | 16.1%) and $55,000 to $64,999 for women (200 | 24.2%).
| Income | Male | Female |
| $2,499 or less | 12 (1.4%) | 38 (4.6%) |
| $2,500 to $4,999 | 31 (3.6%) | 0 (0.0%) |
| $5,000 to $7,499 | 23 (2.7%) | 24 (2.9%) |
| $7,500 to $9,999 | 0 (0.0%) | 25 (3.0%) |
| $10,000 to $12,499 | 26 (3.1%) | 26 (3.2%) |
| $12,500 to $14,999 | 10 (1.2%) | 24 (2.9%) |
| $15,000 to $17,499 | 0 (0.0%) | 107 (13.0%) |
| $17,500 to $19,999 | 0 (0.0%) | 0 (0.0%) |
| $20,000 to $22,499 | 43 (5.1%) | 7 (0.9%) |
| $22,500 to $24,999 | 9 (1.1%) | 23 (2.8%) |
| $25,000 to $29,999 | 10 (1.2%) | 72 (8.7%) |
| $30,000 to $34,999 | 135 (15.9%) | 3 (0.4%) |
| $35,000 to $39,999 | 79 (9.3%) | 90 (10.9%) |
| $40,000 to $44,999 | 23 (2.7%) | 5 (0.6%) |
| $45,000 to $49,999 | 97 (11.4%) | 20 (2.4%) |
| $50,000 to $54,999 | 41 (4.8%) | 34 (4.1%) |
| $55,000 to $64,999 | 19 (2.2%) | 200 (24.2%) |
| $65,000 to $74,999 | 34 (4.0%) | 33 (4.0%) |
| $75,000 to $99,999 | 120 (14.1%) | 64 (7.7%) |
| $100,000+ | 137 (16.1%) | 31 (3.7%) |
| Total | 849 (100.0%) | 826 (100.0%) |
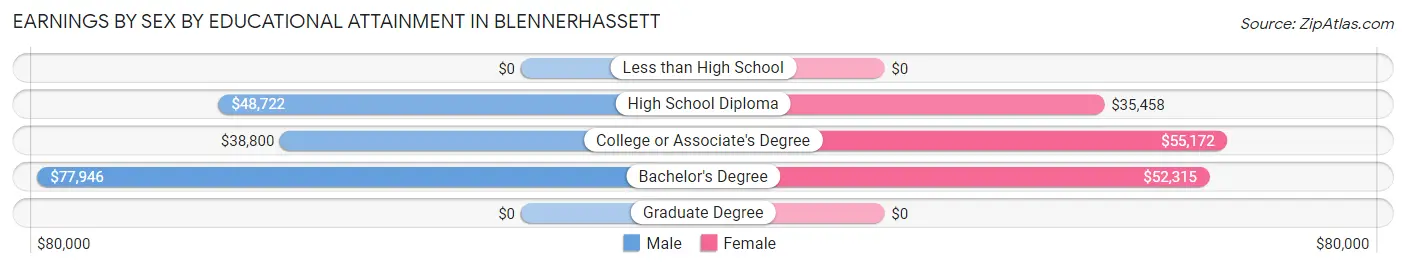
Earnings by Sex by Educational Attainment in Blennerhassett
Average earnings in Blennerhassett are $48,807 for men and $45,500 for women, a difference of 6.8%. Men with an educational attainment of bachelor's degree enjoy the highest average annual earnings of $77,946, while those with college or associate's degree education earn the least with $38,800. Women with an educational attainment of college or associate's degree earn the most with the average annual earnings of $55,172, while those with high school diploma education have the smallest earnings of $35,458.
| Educational Attainment | Male Income | Female Income |
| Less than High School | - | - |
| High School Diploma | $48,722 | $35,458 |
| College or Associate's Degree | $38,800 | $55,172 |
| Bachelor's Degree | $77,946 | $52,315 |
| Graduate Degree | - | - |
| Total | $48,807 | $45,500 |
Family Income in Blennerhassett
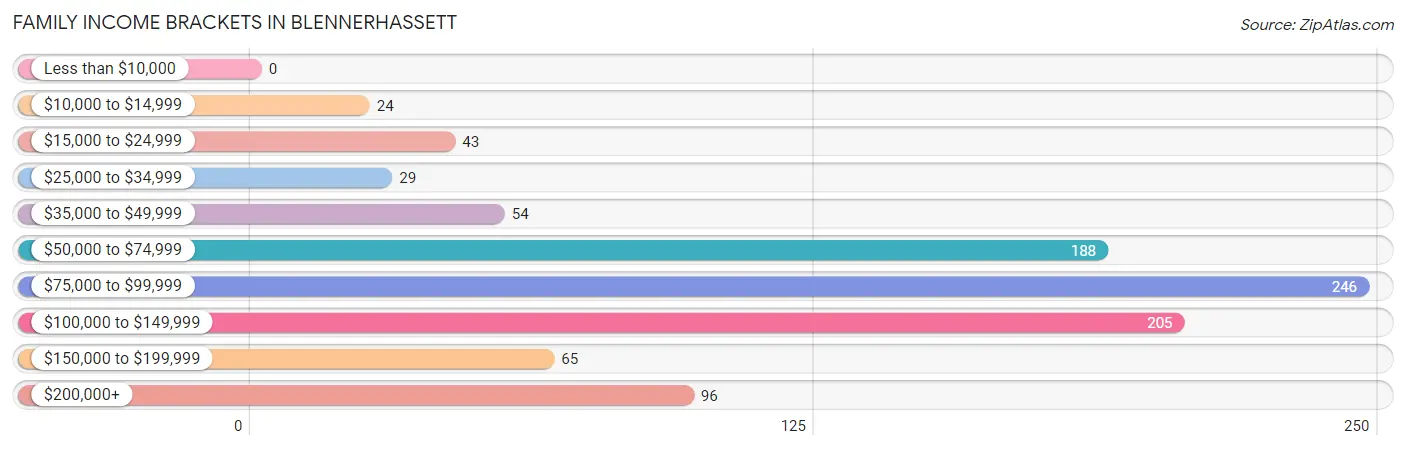
Family Income Brackets in Blennerhassett
According to the Blennerhassett family income data, there are 246 families falling into the $75,000 to $99,999 income range, which is the most common income bracket and makes up 25.9% of all families.
| Income Bracket | # Families | % Families |
| Less than $10,000 | 0 | 0.0% |
| $10,000 to $14,999 | 24 | 2.5% |
| $15,000 to $24,999 | 43 | 4.5% |
| $25,000 to $34,999 | 29 | 3.1% |
| $35,000 to $49,999 | 54 | 5.7% |
| $50,000 to $74,999 | 188 | 19.8% |
| $75,000 to $99,999 | 246 | 25.9% |
| $100,000 to $149,999 | 205 | 21.6% |
| $150,000 to $199,999 | 65 | 6.8% |
| $200,000+ | 96 | 10.1% |
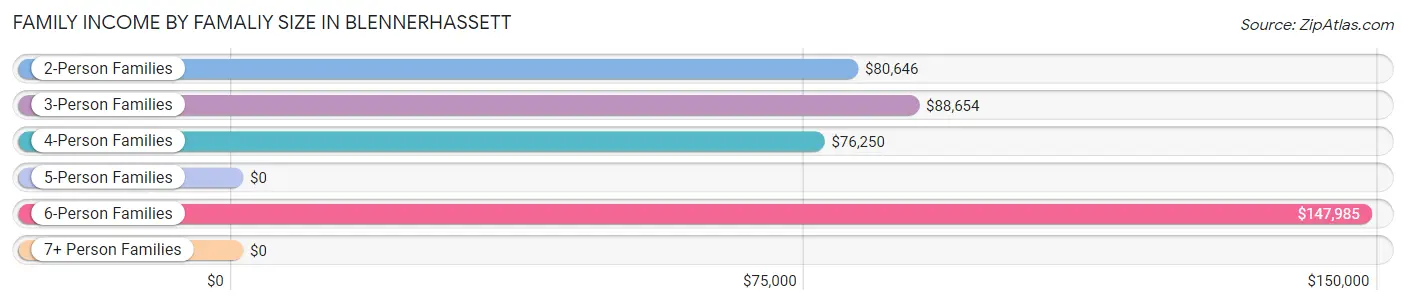
Family Income by Famaliy Size in Blennerhassett
6-person families (79 | 8.3%) account for the highest median family income in Blennerhassett with $147,985 per family, while 2-person families (491 | 51.7%) have the highest median income of $40,323 per family member.
| Income Bracket | # Families | Median Income |
| 2-Person Families | 491 (51.7%) | $80,646 |
| 3-Person Families | 190 (20.0%) | $88,654 |
| 4-Person Families | 97 (10.2%) | $76,250 |
| 5-Person Families | 83 (8.7%) | $0 |
| 6-Person Families | 79 (8.3%) | $147,985 |
| 7+ Person Families | 10 (1.1%) | $0 |
| Total | 950 (100.0%) | $82,198 |
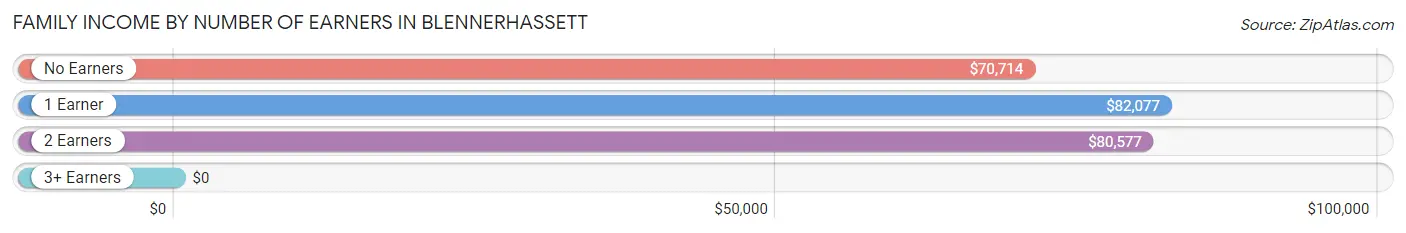
Family Income by Number of Earners in Blennerhassett
| Number of Earners | # Families | Median Income |
| No Earners | 172 (18.1%) | $70,714 |
| 1 Earner | 314 (33.1%) | $82,077 |
| 2 Earners | 326 (34.3%) | $80,577 |
| 3+ Earners | 138 (14.5%) | $0 |
| Total | 950 (100.0%) | $82,198 |
Household Income in Blennerhassett
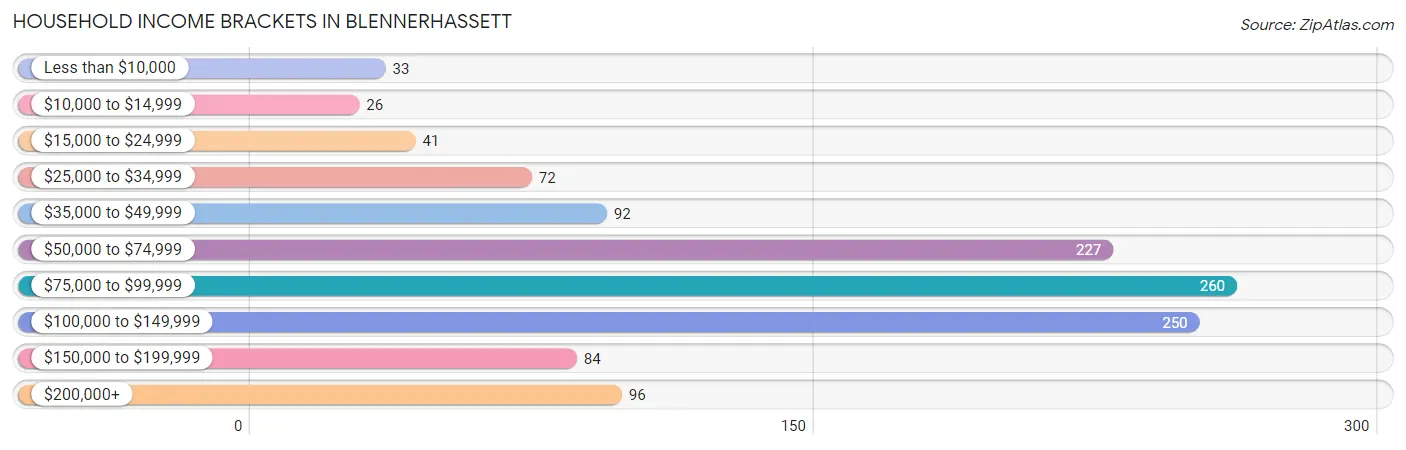
Household Income Brackets in Blennerhassett
With 260 households falling in the category, the $75,000 to $99,999 income range is the most frequent in Blennerhassett, accounting for 22.0% of all households. In contrast, only 26 households (2.2%) fall into the $10,000 to $14,999 income bracket, making it the least populous group.
| Income Bracket | # Households | % Households |
| Less than $10,000 | 33 | 2.8% |
| $10,000 to $14,999 | 26 | 2.2% |
| $15,000 to $24,999 | 41 | 3.5% |
| $25,000 to $34,999 | 72 | 6.1% |
| $35,000 to $49,999 | 92 | 7.8% |
| $50,000 to $74,999 | 227 | 19.2% |
| $75,000 to $99,999 | 260 | 22.0% |
| $100,000 to $149,999 | 250 | 21.2% |
| $150,000 to $199,999 | 84 | 7.1% |
| $200,000+ | 96 | 8.1% |
Household Income by Householder Age in Blennerhassett
The median household income in Blennerhassett is $80,783, with the highest median household income of $96,125 found in the 45 to 64 years age bracket for the primary householder. A total of 375 households (31.8%) fall into this category.
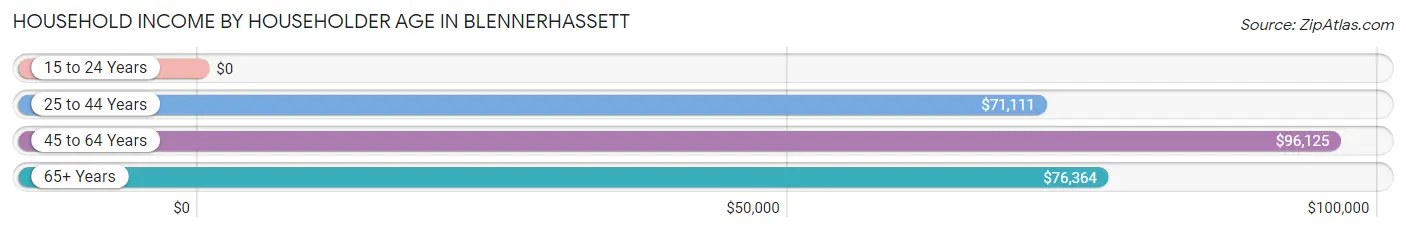
| Income Bracket | # Households | Median Income |
| 15 to 24 Years | 0 (0.0%) | $0 |
| 25 to 44 Years | 318 (26.9%) | $71,111 |
| 45 to 64 Years | 375 (31.8%) | $96,125 |
| 65+ Years | 488 (41.3%) | $76,364 |
| Total | 1,181 (100.0%) | $80,783 |
Poverty in Blennerhassett
Income Below Poverty by Sex and Age in Blennerhassett
With 12.3% poverty level for males and 4.8% for females among the residents of Blennerhassett, 6 to 11 year old males and 25 to 34 year old females are the most vulnerable to poverty, with 96 males (47.5%) and 49 females (19.7%) in their respective age groups living below the poverty level.
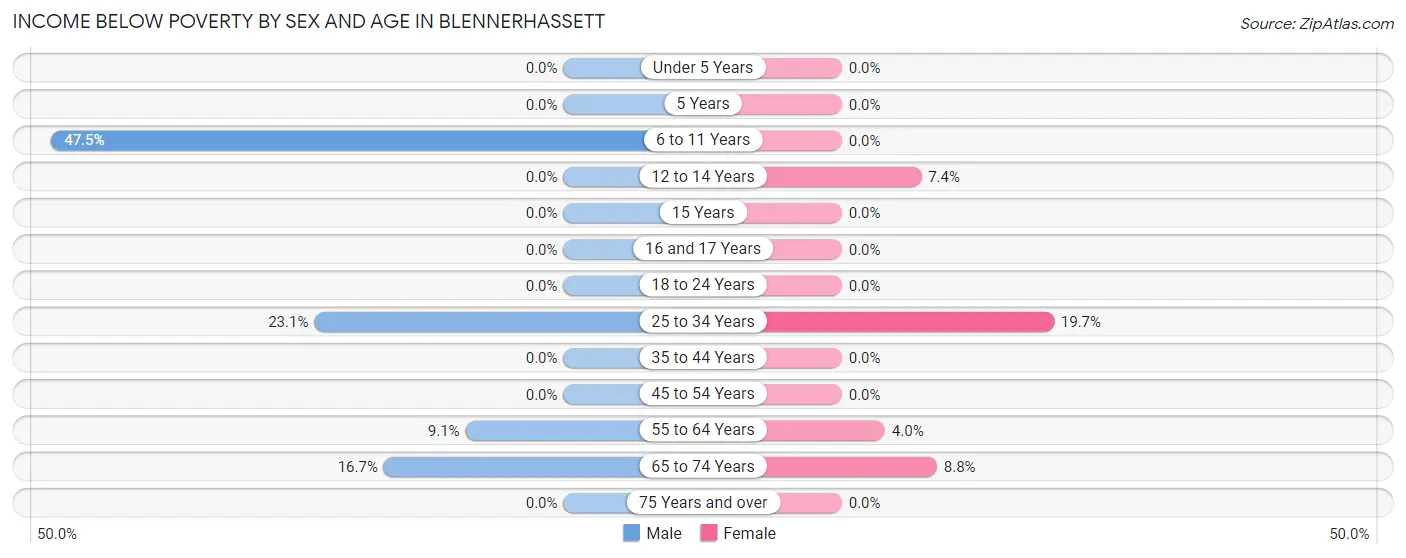
| Age Bracket | Male | Female |
| Under 5 Years | 0 (0.0%) | 0 (0.0%) |
| 5 Years | 0 (0.0%) | 0 (0.0%) |
| 6 to 11 Years | 96 (47.5%) | 0 (0.0%) |
| 12 to 14 Years | 0 (0.0%) | 14 (7.4%) |
| 15 Years | 0 (0.0%) | 0 (0.0%) |
| 16 and 17 Years | 0 (0.0%) | 0 (0.0%) |
| 18 to 24 Years | 0 (0.0%) | 0 (0.0%) |
| 25 to 34 Years | 43 (23.1%) | 49 (19.7%) |
| 35 to 44 Years | 0 (0.0%) | 0 (0.0%) |
| 45 to 54 Years | 0 (0.0%) | 0 (0.0%) |
| 55 to 64 Years | 21 (9.1%) | 16 (4.0%) |
| 65 to 74 Years | 36 (16.7%) | 15 (8.8%) |
| 75 Years and over | 0 (0.0%) | 0 (0.0%) |
| Total | 196 (12.3%) | 94 (4.8%) |
Income Above Poverty by Sex and Age in Blennerhassett
According to the poverty statistics in Blennerhassett, males aged under 5 years and females aged under 5 years are the age groups that are most secure financially, with 100.0% of males and 100.0% of females in these age groups living above the poverty line.
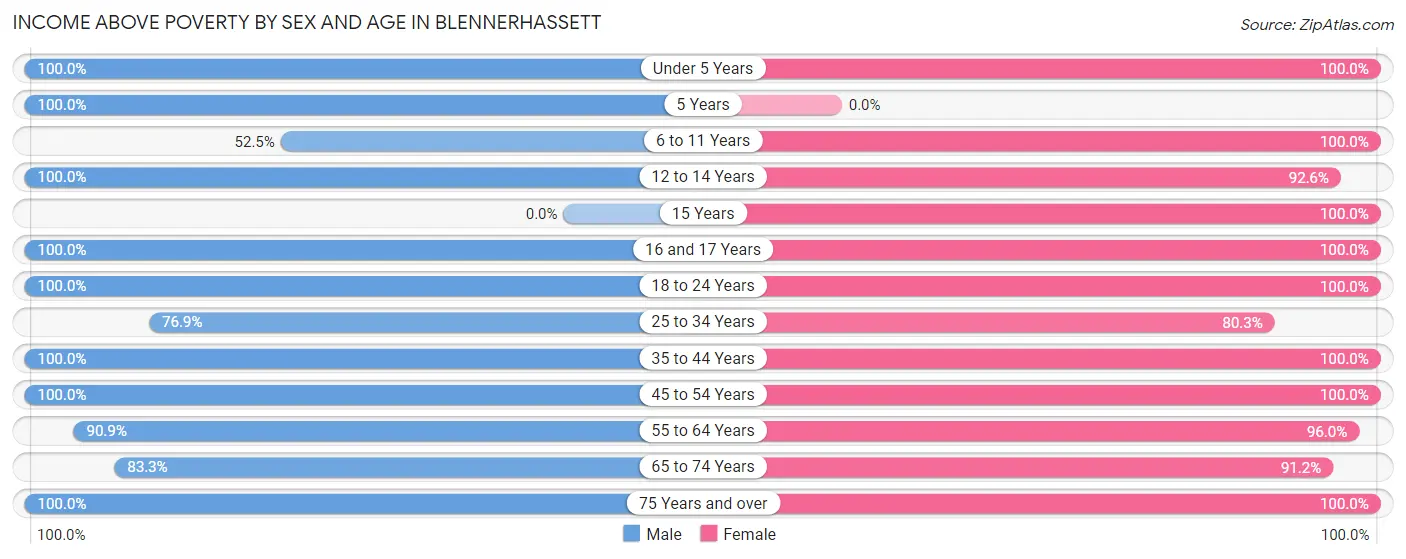
| Age Bracket | Male | Female |
| Under 5 Years | 30 (100.0%) | 21 (100.0%) |
| 5 Years | 19 (100.0%) | 0 (0.0%) |
| 6 to 11 Years | 106 (52.5%) | 240 (100.0%) |
| 12 to 14 Years | 93 (100.0%) | 176 (92.6%) |
| 15 Years | 0 (0.0%) | 25 (100.0%) |
| 16 and 17 Years | 17 (100.0%) | 6 (100.0%) |
| 18 to 24 Years | 106 (100.0%) | 101 (100.0%) |
| 25 to 34 Years | 143 (76.9%) | 200 (80.3%) |
| 35 to 44 Years | 288 (100.0%) | 141 (100.0%) |
| 45 to 54 Years | 90 (100.0%) | 142 (100.0%) |
| 55 to 64 Years | 210 (90.9%) | 384 (96.0%) |
| 65 to 74 Years | 180 (83.3%) | 155 (91.2%) |
| 75 Years and over | 118 (100.0%) | 271 (100.0%) |
| Total | 1,400 (87.7%) | 1,862 (95.2%) |
Income Below Poverty Among Married-Couple Families in Blennerhassett
The poverty statistics for married-couple families in Blennerhassett show that 1.7% or 13 of the total 750 families live below the poverty line. Families with no children have the highest poverty rate of 2.8%, comprising of 13 families. On the other hand, families with 1 or 2 children have the lowest poverty rate of 0.0%, which includes 0 families.
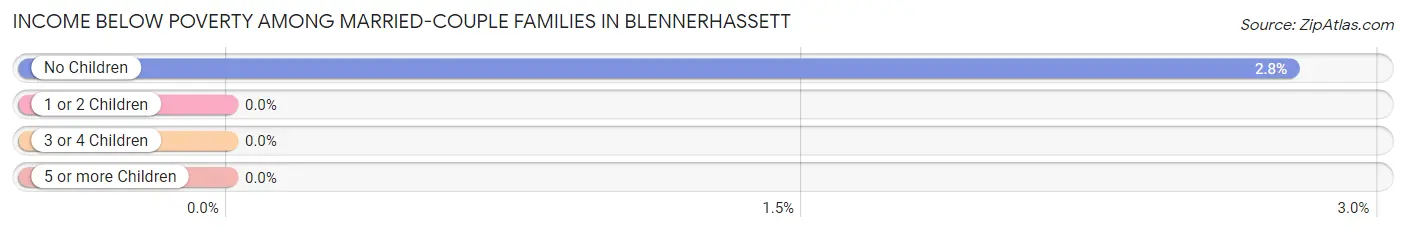
| Children | Above Poverty | Below Poverty |
| No Children | 456 (97.2%) | 13 (2.8%) |
| 1 or 2 Children | 247 (100.0%) | 0 (0.0%) |
| 3 or 4 Children | 29 (100.0%) | 0 (0.0%) |
| 5 or more Children | 5 (100.0%) | 0 (0.0%) |
| Total | 737 (98.3%) | 13 (1.7%) |
Income Below Poverty Among Single-Parent Households in Blennerhassett
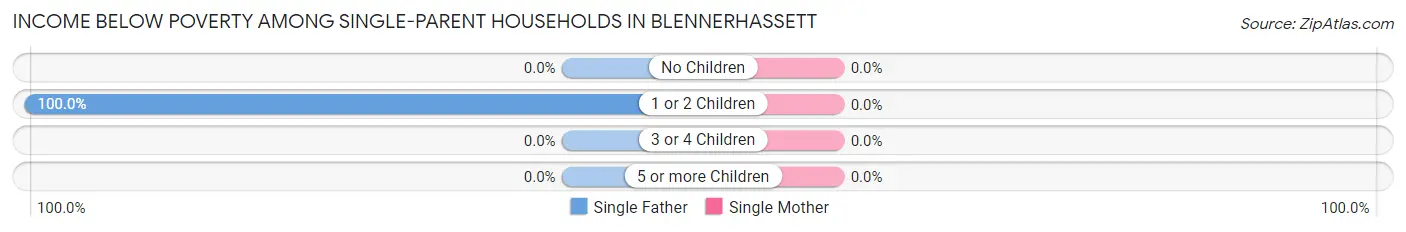
| Children | Single Father | Single Mother |
| No Children | 0 (0.0%) | 0 (0.0%) |
| 1 or 2 Children | 54 (100.0%) | 0 (0.0%) |
| 3 or 4 Children | 0 (0.0%) | 0 (0.0%) |
| 5 or more Children | 0 (0.0%) | 0 (0.0%) |
| Total | 54 (85.7%) | 0 (0.0%) |
Income Below Poverty Among Married-Couple vs Single-Parent Households in Blennerhassett
The poverty data for Blennerhassett shows that 13 of the married-couple family households (1.7%) and 54 of the single-parent households (27.0%) are living below the poverty level. Within the married-couple family households, those with no children have the highest poverty rate, with 13 households (2.8%) falling below the poverty line. Among the single-parent households, those with 1 or 2 children have the highest poverty rate, with 54 household (54.5%) living below poverty.
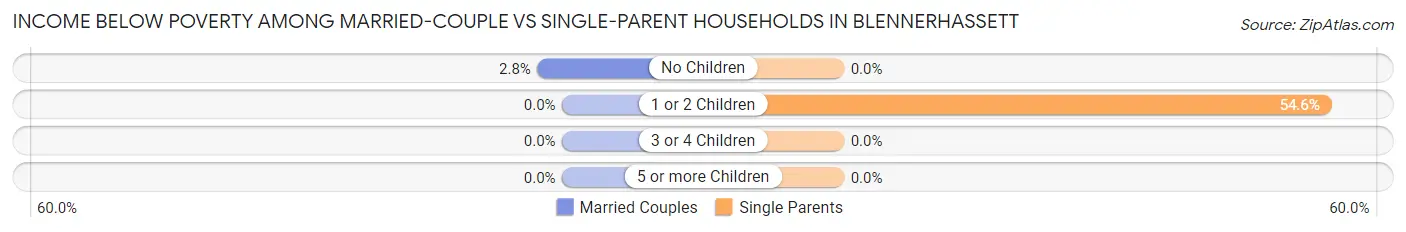
| Children | Married-Couple Families | Single-Parent Households |
| No Children | 13 (2.8%) | 0 (0.0%) |
| 1 or 2 Children | 0 (0.0%) | 54 (54.5%) |
| 3 or 4 Children | 0 (0.0%) | 0 (0.0%) |
| 5 or more Children | 0 (0.0%) | 0 (0.0%) |
| Total | 13 (1.7%) | 54 (27.0%) |
Race in Blennerhassett
The most populous races in Blennerhassett are White / Caucasian (3,486 | 97.8%), Hispanic or Latino (79 | 2.2%), and Two or more Races (42 | 1.2%).
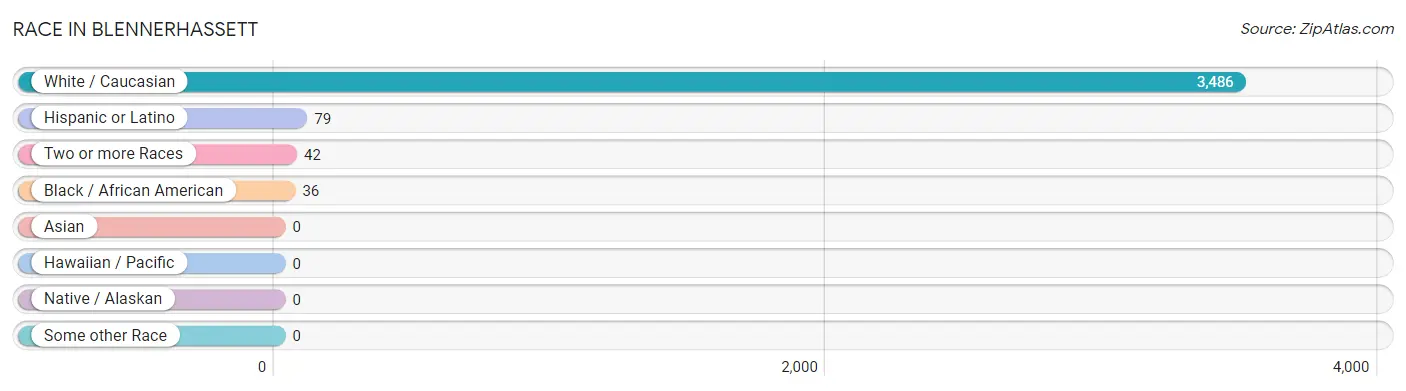
| Race | # Population | % Population |
| Asian | 0 | 0.0% |
| Black / African American | 36 | 1.0% |
| Hawaiian / Pacific | 0 | 0.0% |
| Hispanic or Latino | 79 | 2.2% |
| Native / Alaskan | 0 | 0.0% |
| White / Caucasian | 3,486 | 97.8% |
| Two or more Races | 42 | 1.2% |
| Some other Race | 0 | 0.0% |
| Total | 3,564 | 100.0% |
Ancestry in Blennerhassett
The most populous ancestries reported in Blennerhassett are English (1,063 | 29.8%), Irish (472 | 13.2%), German (329 | 9.2%), American (302 | 8.5%), and European (75 | 2.1%), together accounting for 62.9% of all Blennerhassett residents.
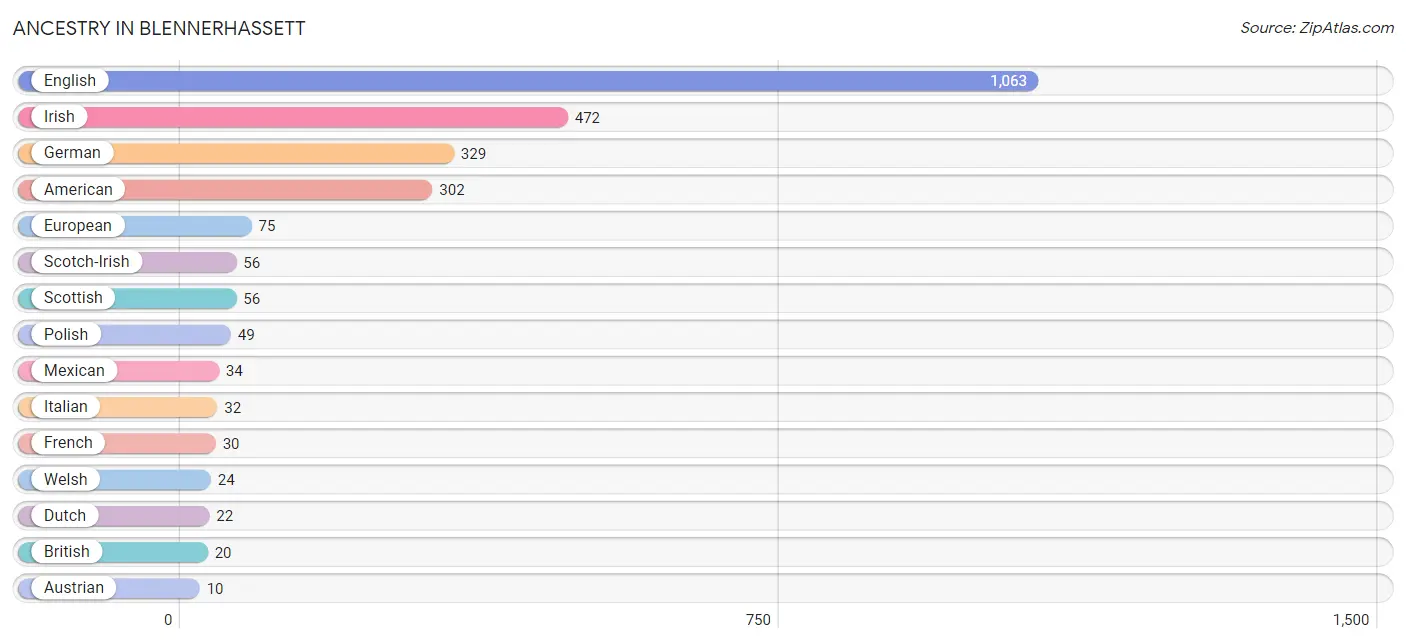
| Ancestry | # Population | % Population |
| American | 302 | 8.5% |
| Austrian | 10 | 0.3% |
| British | 20 | 0.6% |
| Croatian | 9 | 0.3% |
| Dutch | 22 | 0.6% |
| English | 1,063 | 29.8% |
| European | 75 | 2.1% |
| French | 30 | 0.8% |
| German | 329 | 9.2% |
| Irish | 472 | 13.2% |
| Italian | 32 | 0.9% |
| Mexican | 34 | 0.9% |
| Nigerian | 10 | 0.3% |
| Polish | 49 | 1.4% |
| Scandinavian | 10 | 0.3% |
| Scotch-Irish | 56 | 1.6% |
| Scottish | 56 | 1.6% |
| Subsaharan African | 10 | 0.3% |
| Swiss | 10 | 0.3% |
| Welsh | 24 | 0.7% | View All 20 Rows |
Immigrants in Blennerhassett
The most numerous immigrant groups reported in Blennerhassett came from Central America (23 | 0.6%), Latin America (23 | 0.6%), and Mexico (23 | 0.6%), together accounting for 1.9% of all Blennerhassett residents.

| Immigration Origin | # Population | % Population |
| Central America | 23 | 0.6% |
| Latin America | 23 | 0.6% |
| Mexico | 23 | 0.6% | View All 3 Rows |
Sex and Age in Blennerhassett
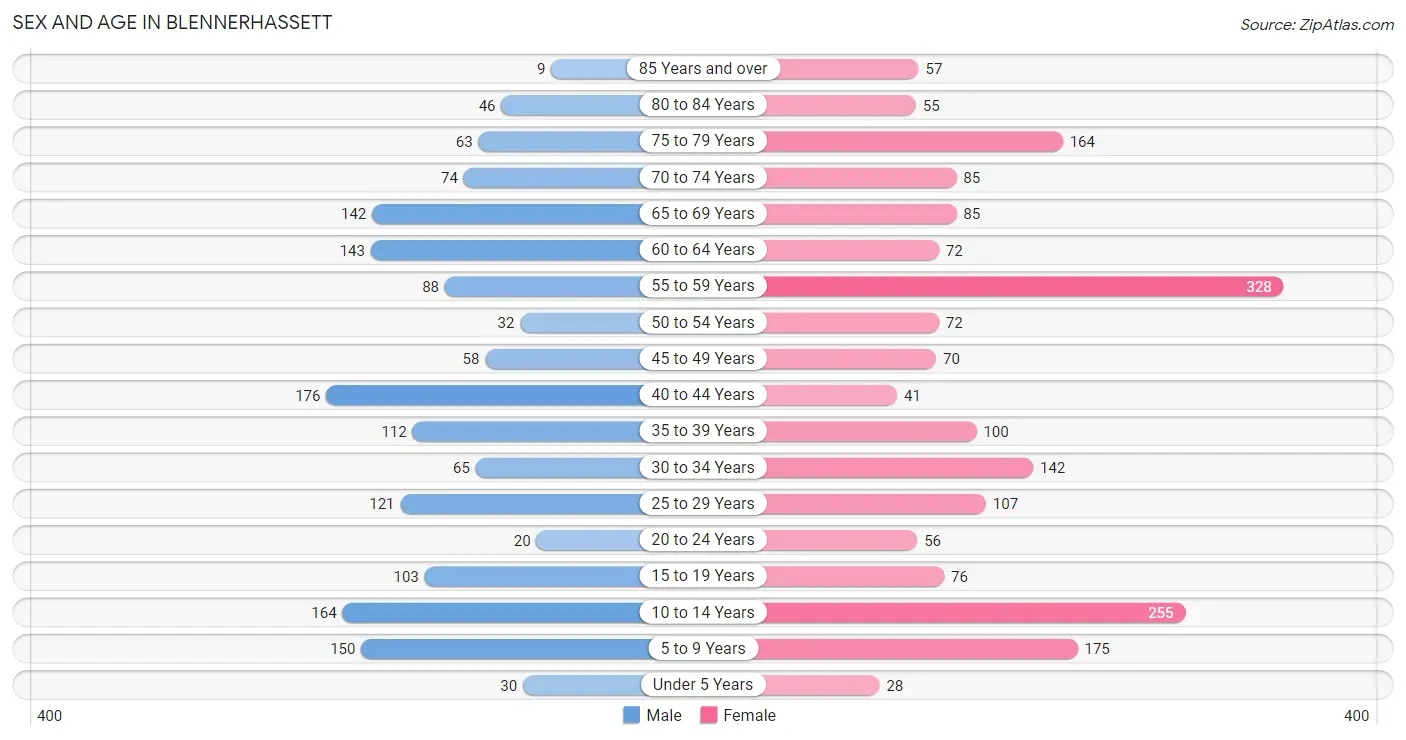
Sex and Age in Blennerhassett
The most populous age groups in Blennerhassett are 40 to 44 Years (176 | 11.0%) for men and 55 to 59 Years (328 | 16.7%) for women.
| Age Bracket | Male | Female |
| Under 5 Years | 30 (1.9%) | 28 (1.4%) |
| 5 to 9 Years | 150 (9.4%) | 175 (8.9%) |
| 10 to 14 Years | 164 (10.3%) | 255 (13.0%) |
| 15 to 19 Years | 103 (6.5%) | 76 (3.9%) |
| 20 to 24 Years | 20 (1.3%) | 56 (2.9%) |
| 25 to 29 Years | 121 (7.6%) | 107 (5.4%) |
| 30 to 34 Years | 65 (4.1%) | 142 (7.2%) |
| 35 to 39 Years | 112 (7.0%) | 100 (5.1%) |
| 40 to 44 Years | 176 (11.0%) | 41 (2.1%) |
| 45 to 49 Years | 58 (3.6%) | 70 (3.6%) |
| 50 to 54 Years | 32 (2.0%) | 72 (3.7%) |
| 55 to 59 Years | 88 (5.5%) | 328 (16.7%) |
| 60 to 64 Years | 143 (9.0%) | 72 (3.7%) |
| 65 to 69 Years | 142 (8.9%) | 85 (4.3%) |
| 70 to 74 Years | 74 (4.6%) | 85 (4.3%) |
| 75 to 79 Years | 63 (4.0%) | 164 (8.3%) |
| 80 to 84 Years | 46 (2.9%) | 55 (2.8%) |
| 85 Years and over | 9 (0.6%) | 57 (2.9%) |
| Total | 1,596 (100.0%) | 1,968 (100.0%) |
Families and Households in Blennerhassett
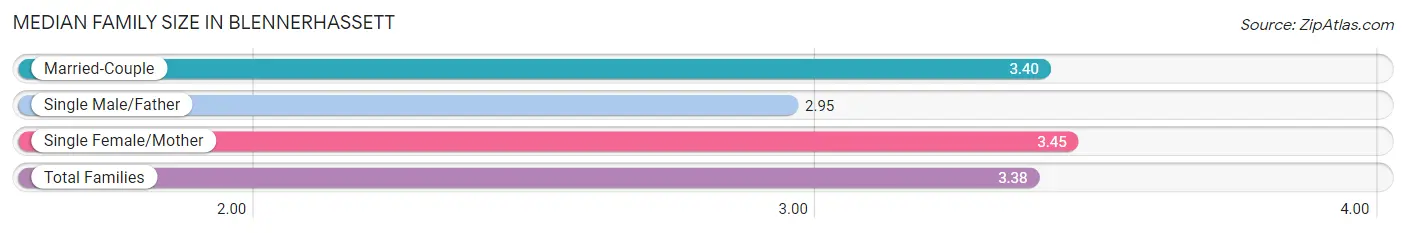
Median Family Size in Blennerhassett
The median family size in Blennerhassett is 3.38 persons per family, with single female/mother families (137 | 14.4%) accounting for the largest median family size of 3.45 persons per family. On the other hand, single male/father families (63 | 6.6%) represent the smallest median family size with 2.95 persons per family.
| Family Type | # Families | Family Size |
| Married-Couple | 750 (78.9%) | 3.40 |
| Single Male/Father | 63 (6.6%) | 2.95 |
| Single Female/Mother | 137 (14.4%) | 3.45 |
| Total Families | 950 (100.0%) | 3.38 |
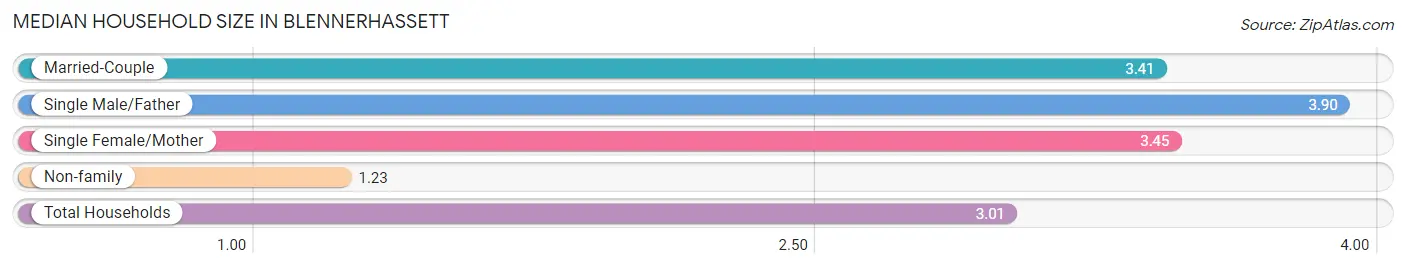
Median Household Size in Blennerhassett
The median household size in Blennerhassett is 3.01 persons per household, with single male/father households (63 | 5.3%) accounting for the largest median household size of 3.9 persons per household. non-family households (231 | 19.6%) represent the smallest median household size with 1.23 persons per household.
| Household Type | # Households | Household Size |
| Married-Couple | 750 (63.5%) | 3.41 |
| Single Male/Father | 63 (5.3%) | 3.90 |
| Single Female/Mother | 137 (11.6%) | 3.45 |
| Non-family | 231 (19.6%) | 1.23 |
| Total Households | 1,181 (100.0%) | 3.01 |
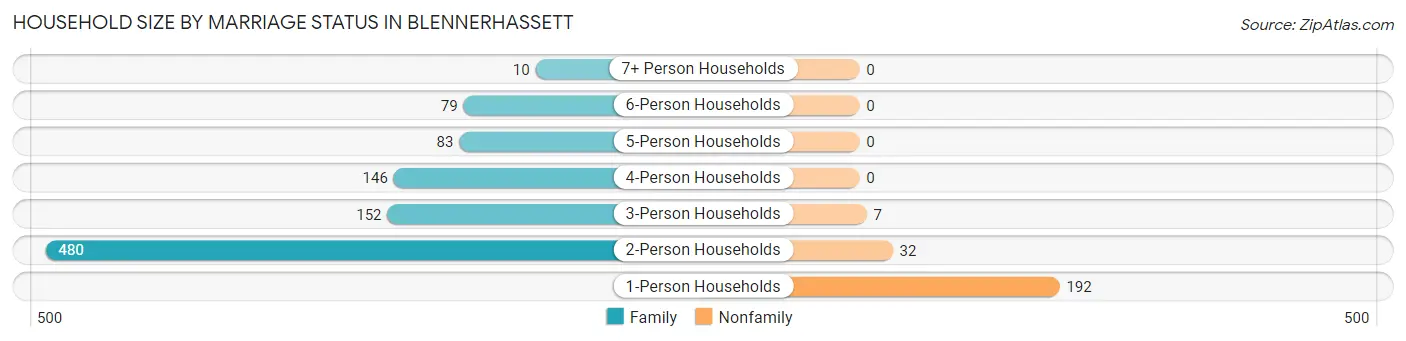
Household Size by Marriage Status in Blennerhassett
Out of a total of 1,181 households in Blennerhassett, 950 (80.4%) are family households, while 231 (19.6%) are nonfamily households. The most numerous type of family households are 2-person households, comprising 480, and the most common type of nonfamily households are 1-person households, comprising 192.
| Household Size | Family Households | Nonfamily Households |
| 1-Person Households | - | 192 (16.3%) |
| 2-Person Households | 480 (40.6%) | 32 (2.7%) |
| 3-Person Households | 152 (12.9%) | 7 (0.6%) |
| 4-Person Households | 146 (12.4%) | 0 (0.0%) |
| 5-Person Households | 83 (7.0%) | 0 (0.0%) |
| 6-Person Households | 79 (6.7%) | 0 (0.0%) |
| 7+ Person Households | 10 (0.9%) | 0 (0.0%) |
| Total | 950 (80.4%) | 231 (19.6%) |
Female Fertility in Blennerhassett
Fertility by Age in Blennerhassett
Average fertility rate in Blennerhassett is 24.0 births per 1,000 women. Women in the age bracket of 35 to 50 years have the highest fertility rate with 58.0 births per 1,000 women. Women in the age bracket of 35 to 50 years acount for 100.0% of all women with births.
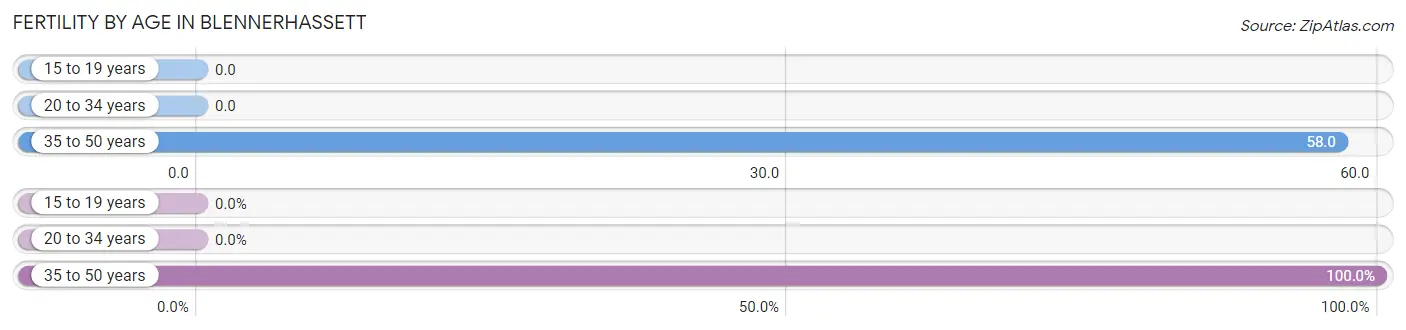
| Age Bracket | Women with Births | Births / 1,000 Women |
| 15 to 19 years | 0 (0.0%) | 0.0 |
| 20 to 34 years | 0 (0.0%) | 0.0 |
| 35 to 50 years | 15 (100.0%) | 58.0 |
| Total | 15 (100.0%) | 24.0 |
Fertility by Age by Marriage Status in Blennerhassett
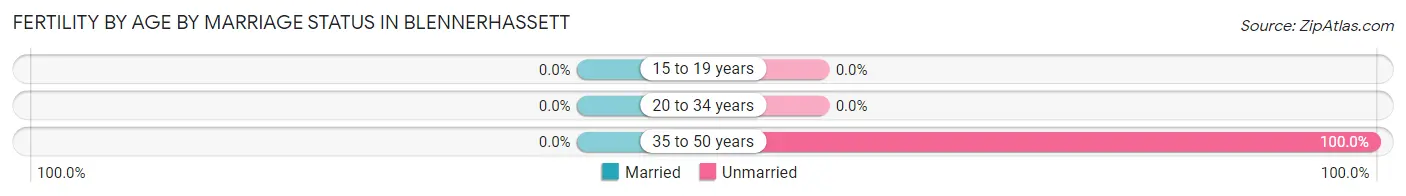
| Age Bracket | Married | Unmarried |
| 15 to 19 years | 0 (0.0%) | 0 (0.0%) |
| 20 to 34 years | 0 (0.0%) | 0 (0.0%) |
| 35 to 50 years | 0 (0.0%) | 15 (100.0%) |
| Total | 0 (0.0%) | 15 (100.0%) |
Fertility by Education in Blennerhassett
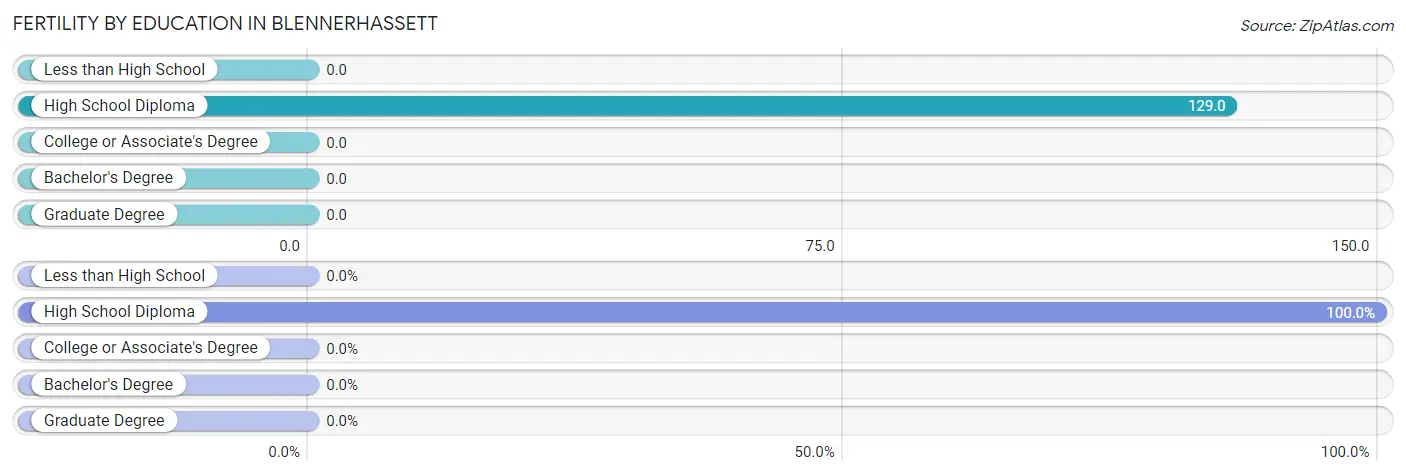
| Educational Attainment | Women with Births | Births / 1,000 Women |
| Less than High School | 0 (0.0%) | 0.0 |
| High School Diploma | 15 (100.0%) | 129.0 |
| College or Associate's Degree | 0 (0.0%) | 0.0 |
| Bachelor's Degree | 0 (0.0%) | 0.0 |
| Graduate Degree | 0 (0.0%) | 0.0 |
| Total | 15 (100.0%) | 24.0 |
Fertility by Education by Marriage Status in Blennerhassett
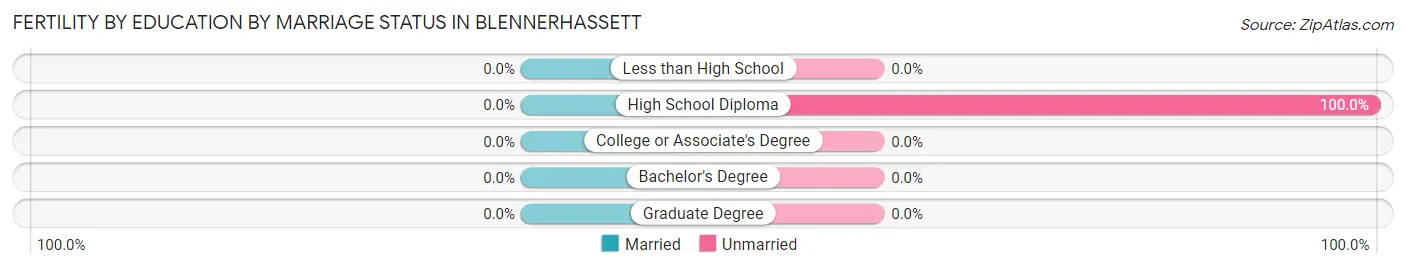
| Educational Attainment | Married | Unmarried |
| Less than High School | 0 (0.0%) | 0 (0.0%) |
| High School Diploma | 0 (0.0%) | 15 (100.0%) |
| College or Associate's Degree | 0 (0.0%) | 0 (0.0%) |
| Bachelor's Degree | 0 (0.0%) | 0 (0.0%) |
| Graduate Degree | 0 (0.0%) | 0 (0.0%) |
| Total | 0 (0.0%) | 15 (100.0%) |
Employment Characteristics in Blennerhassett
Employment by Class of Employer in Blennerhassett
Among the 1,516 employed individuals in Blennerhassett, private company employees (820 | 54.1%), state government employees (314 | 20.7%), and not-for-profit organizations (185 | 12.2%) make up the most common classes of employment.
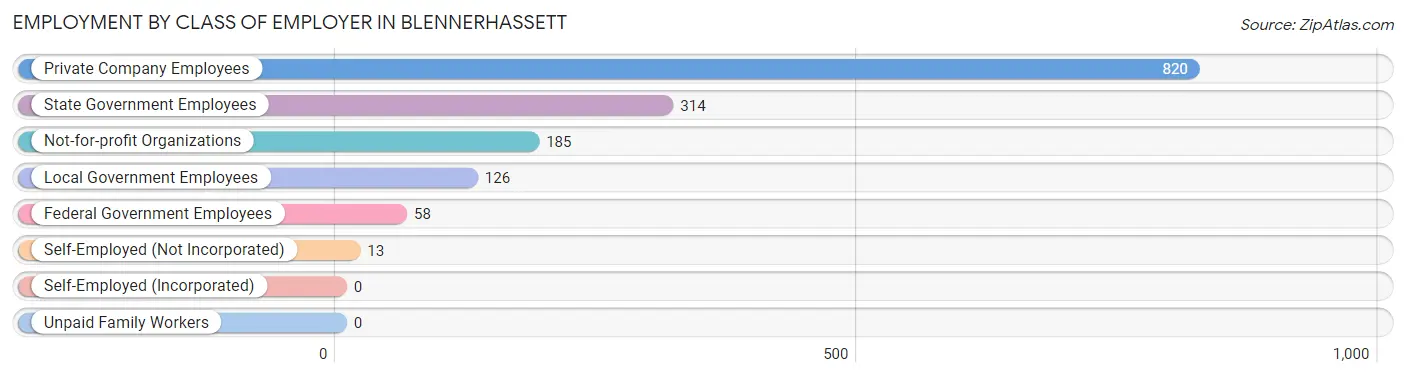
| Employer Class | # Employees | % Employees |
| Private Company Employees | 820 | 54.1% |
| Self-Employed (Incorporated) | 0 | 0.0% |
| Self-Employed (Not Incorporated) | 13 | 0.9% |
| Not-for-profit Organizations | 185 | 12.2% |
| Local Government Employees | 126 | 8.3% |
| State Government Employees | 314 | 20.7% |
| Federal Government Employees | 58 | 3.8% |
| Unpaid Family Workers | 0 | 0.0% |
| Total | 1,516 | 100.0% |
Employment Status by Age in Blennerhassett
According to the labor force statistics for Blennerhassett, out of the total population over 16 years of age (2,737), 58.8% or 1,609 individuals are in the labor force, with 5.0% or 80 of them unemployed. The age group with the highest labor force participation rate is 20 to 24 years, with 100.0% or 76 individuals in the labor force. Within the labor force, the 20 to 24 years age range has the highest percentage of unemployed individuals, with 28.9% or 22 of them being unemployed.
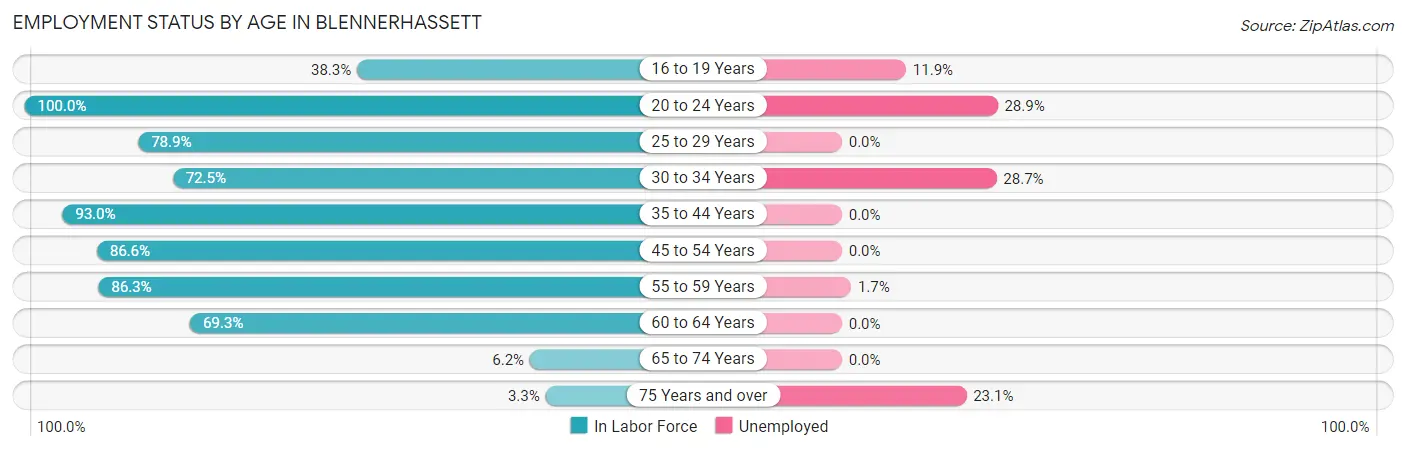
| Age Bracket | In Labor Force | Unemployed |
| 16 to 19 Years | 59 (38.3%) | 7 (11.9%) |
| 20 to 24 Years | 76 (100.0%) | 22 (28.9%) |
| 25 to 29 Years | 180 (78.9%) | 0 (0.0%) |
| 30 to 34 Years | 150 (72.5%) | 43 (28.7%) |
| 35 to 44 Years | 399 (93.0%) | 0 (0.0%) |
| 45 to 54 Years | 201 (86.6%) | 0 (0.0%) |
| 55 to 59 Years | 359 (86.3%) | 6 (1.7%) |
| 60 to 64 Years | 149 (69.3%) | 0 (0.0%) |
| 65 to 74 Years | 24 (6.2%) | 0 (0.0%) |
| 75 Years and over | 13 (3.3%) | 3 (23.1%) |
| Total | 1,609 (58.8%) | 80 (5.0%) |
Employment Status by Educational Attainment in Blennerhassett
According to labor force statistics for Blennerhassett, 83.3% of individuals (1,439) out of the total population between 25 and 64 years of age (1,727) are in the labor force, with 3.4% or 49 of them being unemployed. The group with the highest labor force participation rate are those with the educational attainment of bachelor's degree or higher, with 91.4% or 374 individuals in the labor force. Within the labor force, individuals with high school diploma education have the highest percentage of unemployment, with 10.6% or 43 of them being unemployed.
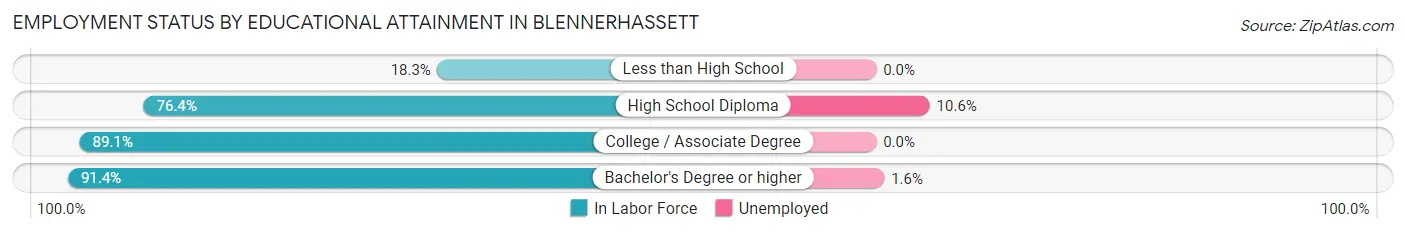
| Educational Attainment | In Labor Force | Unemployed |
| Less than High School | 11 (18.3%) | 0 (0.0%) |
| High School Diploma | 407 (76.4%) | 56 (10.6%) |
| College / Associate Degree | 646 (89.1%) | 0 (0.0%) |
| Bachelor's Degree or higher | 374 (91.4%) | 7 (1.6%) |
| Total | 1,439 (83.3%) | 59 (3.4%) |
Employment Occupations by Sex in Blennerhassett
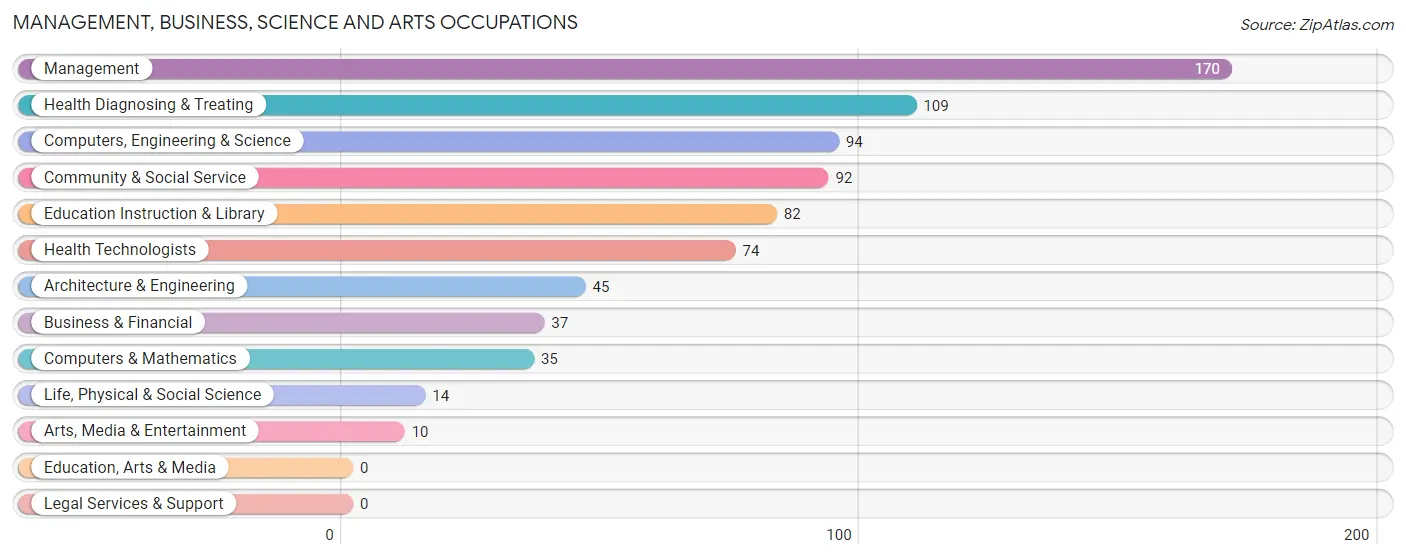
Management, Business, Science and Arts Occupations
The most common Management, Business, Science and Arts occupations in Blennerhassett are Management (170 | 11.1%), Health Diagnosing & Treating (109 | 7.1%), Computers, Engineering & Science (94 | 6.1%), Community & Social Service (92 | 6.0%), and Education Instruction & Library (82 | 5.4%).
Management, Business, Science and Arts Occupations by Sex
Within the Management, Business, Science and Arts occupations in Blennerhassett, the most male-oriented occupations are Arts, Media & Entertainment (100.0%), Architecture & Engineering (75.6%), and Management (72.4%), while the most female-oriented occupations are Life, Physical & Social Science (100.0%), Education Instruction & Library (84.2%), and Health Technologists (83.8%).
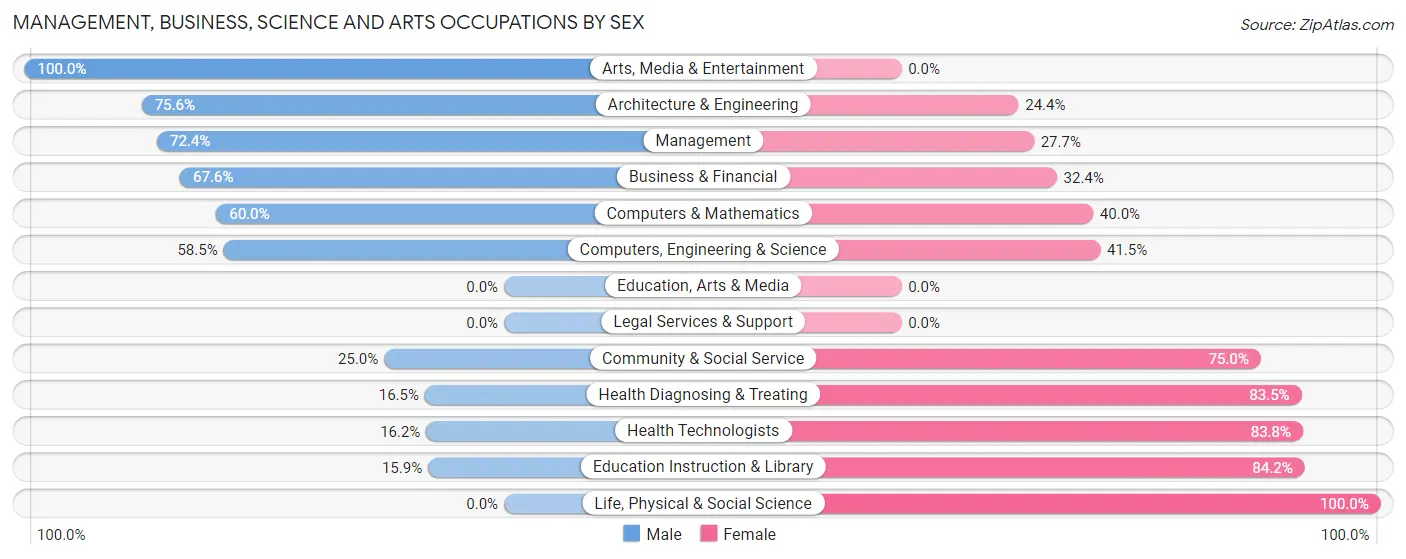
| Occupation | Male | Female |
| Management | 123 (72.4%) | 47 (27.7%) |
| Business & Financial | 25 (67.6%) | 12 (32.4%) |
| Computers, Engineering & Science | 55 (58.5%) | 39 (41.5%) |
| Computers & Mathematics | 21 (60.0%) | 14 (40.0%) |
| Architecture & Engineering | 34 (75.6%) | 11 (24.4%) |
| Life, Physical & Social Science | 0 (0.0%) | 14 (100.0%) |
| Community & Social Service | 23 (25.0%) | 69 (75.0%) |
| Education, Arts & Media | 0 (0.0%) | 0 (0.0%) |
| Legal Services & Support | 0 (0.0%) | 0 (0.0%) |
| Education Instruction & Library | 13 (15.9%) | 69 (84.2%) |
| Arts, Media & Entertainment | 10 (100.0%) | 0 (0.0%) |
| Health Diagnosing & Treating | 18 (16.5%) | 91 (83.5%) |
| Health Technologists | 12 (16.2%) | 62 (83.8%) |
| Total (Category) | 244 (48.6%) | 258 (51.4%) |
| Total (Overall) | 752 (49.2%) | 777 (50.8%) |
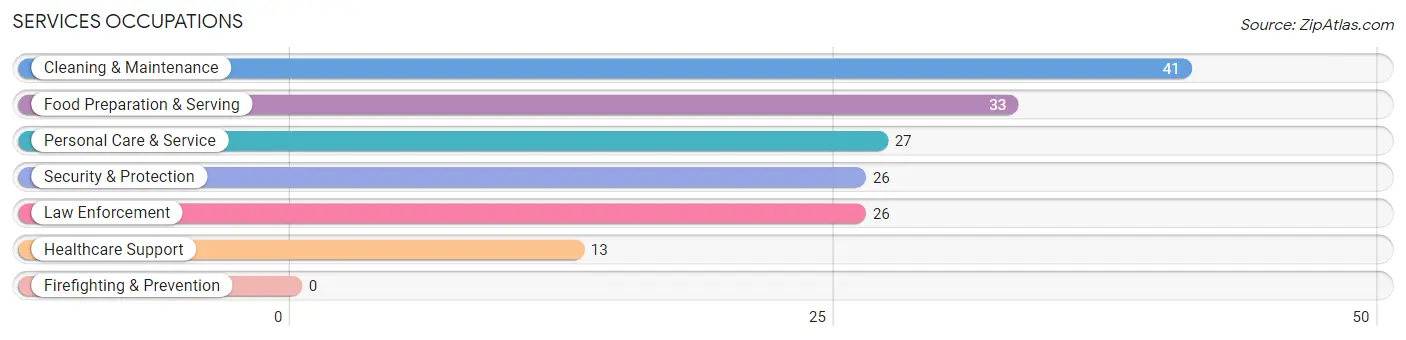
Services Occupations
The most common Services occupations in Blennerhassett are Cleaning & Maintenance (41 | 2.7%), Food Preparation & Serving (33 | 2.2%), Personal Care & Service (27 | 1.8%), Security & Protection (26 | 1.7%), and Law Enforcement (26 | 1.7%).
Services Occupations by Sex
Within the Services occupations in Blennerhassett, the most male-oriented occupations are Security & Protection (100.0%), Law Enforcement (100.0%), and Food Preparation & Serving (51.5%), while the most female-oriented occupations are Healthcare Support (100.0%), Cleaning & Maintenance (82.9%), and Personal Care & Service (81.5%).
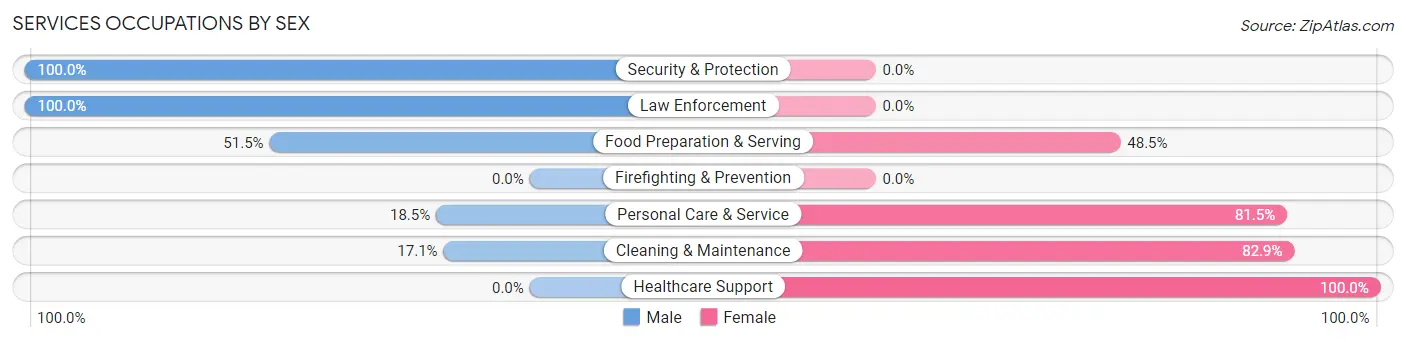
| Occupation | Male | Female |
| Healthcare Support | 0 (0.0%) | 13 (100.0%) |
| Security & Protection | 26 (100.0%) | 0 (0.0%) |
| Firefighting & Prevention | 0 (0.0%) | 0 (0.0%) |
| Law Enforcement | 26 (100.0%) | 0 (0.0%) |
| Food Preparation & Serving | 17 (51.5%) | 16 (48.5%) |
| Cleaning & Maintenance | 7 (17.1%) | 34 (82.9%) |
| Personal Care & Service | 5 (18.5%) | 22 (81.5%) |
| Total (Category) | 55 (39.3%) | 85 (60.7%) |
| Total (Overall) | 752 (49.2%) | 777 (50.8%) |
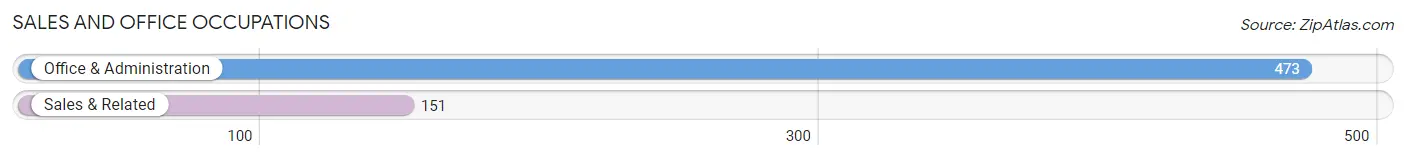
Sales and Office Occupations
The most common Sales and Office occupations in Blennerhassett are Office & Administration (473 | 30.9%), and Sales & Related (151 | 9.9%).
Sales and Office Occupations by Sex
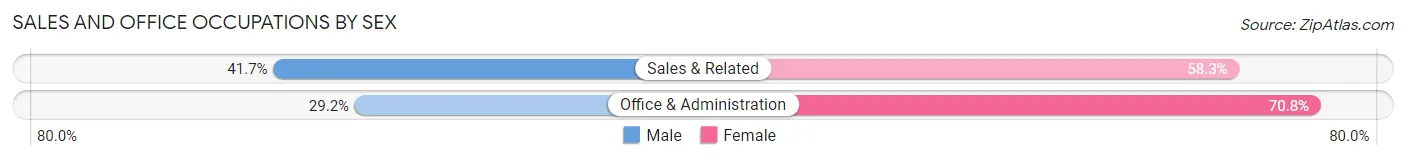
| Occupation | Male | Female |
| Sales & Related | 63 (41.7%) | 88 (58.3%) |
| Office & Administration | 138 (29.2%) | 335 (70.8%) |
| Total (Category) | 201 (32.2%) | 423 (67.8%) |
| Total (Overall) | 752 (49.2%) | 777 (50.8%) |
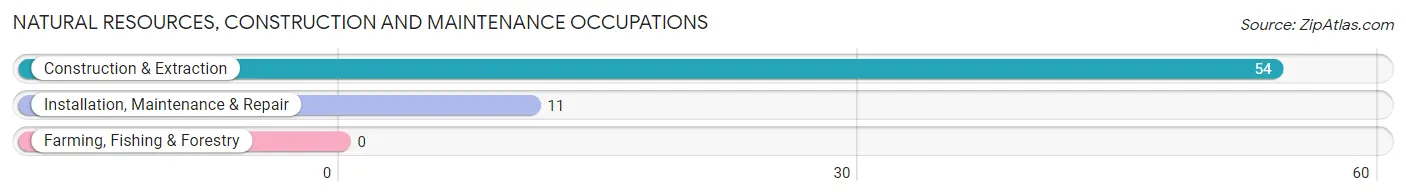
Natural Resources, Construction and Maintenance Occupations
The most common Natural Resources, Construction and Maintenance occupations in Blennerhassett are Construction & Extraction (54 | 3.5%), and Installation, Maintenance & Repair (11 | 0.7%).
Natural Resources, Construction and Maintenance Occupations by Sex
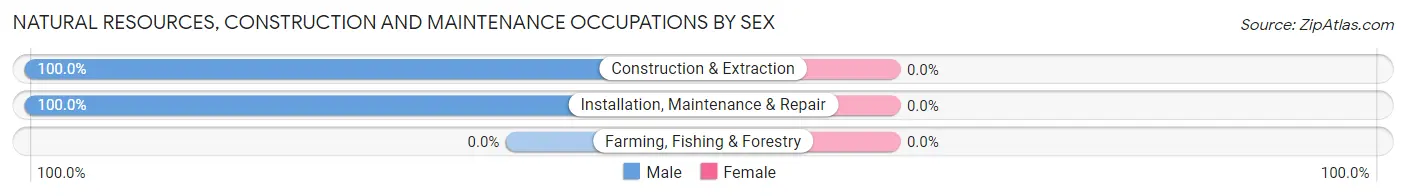
| Occupation | Male | Female |
| Farming, Fishing & Forestry | 0 (0.0%) | 0 (0.0%) |
| Construction & Extraction | 54 (100.0%) | 0 (0.0%) |
| Installation, Maintenance & Repair | 11 (100.0%) | 0 (0.0%) |
| Total (Category) | 65 (100.0%) | 0 (0.0%) |
| Total (Overall) | 752 (49.2%) | 777 (50.8%) |
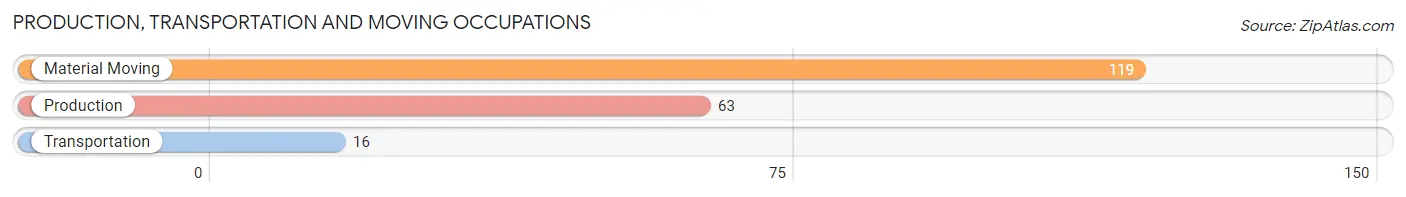
Production, Transportation and Moving Occupations
The most common Production, Transportation and Moving occupations in Blennerhassett are Material Moving (119 | 7.8%), Production (63 | 4.1%), and Transportation (16 | 1.1%).
Production, Transportation and Moving Occupations by Sex
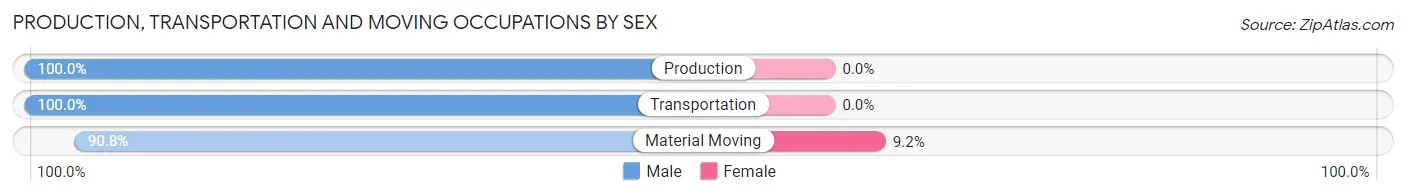
| Occupation | Male | Female |
| Production | 63 (100.0%) | 0 (0.0%) |
| Transportation | 16 (100.0%) | 0 (0.0%) |
| Material Moving | 108 (90.8%) | 11 (9.2%) |
| Total (Category) | 187 (94.4%) | 11 (5.6%) |
| Total (Overall) | 752 (49.2%) | 777 (50.8%) |
Employment Industries by Sex in Blennerhassett
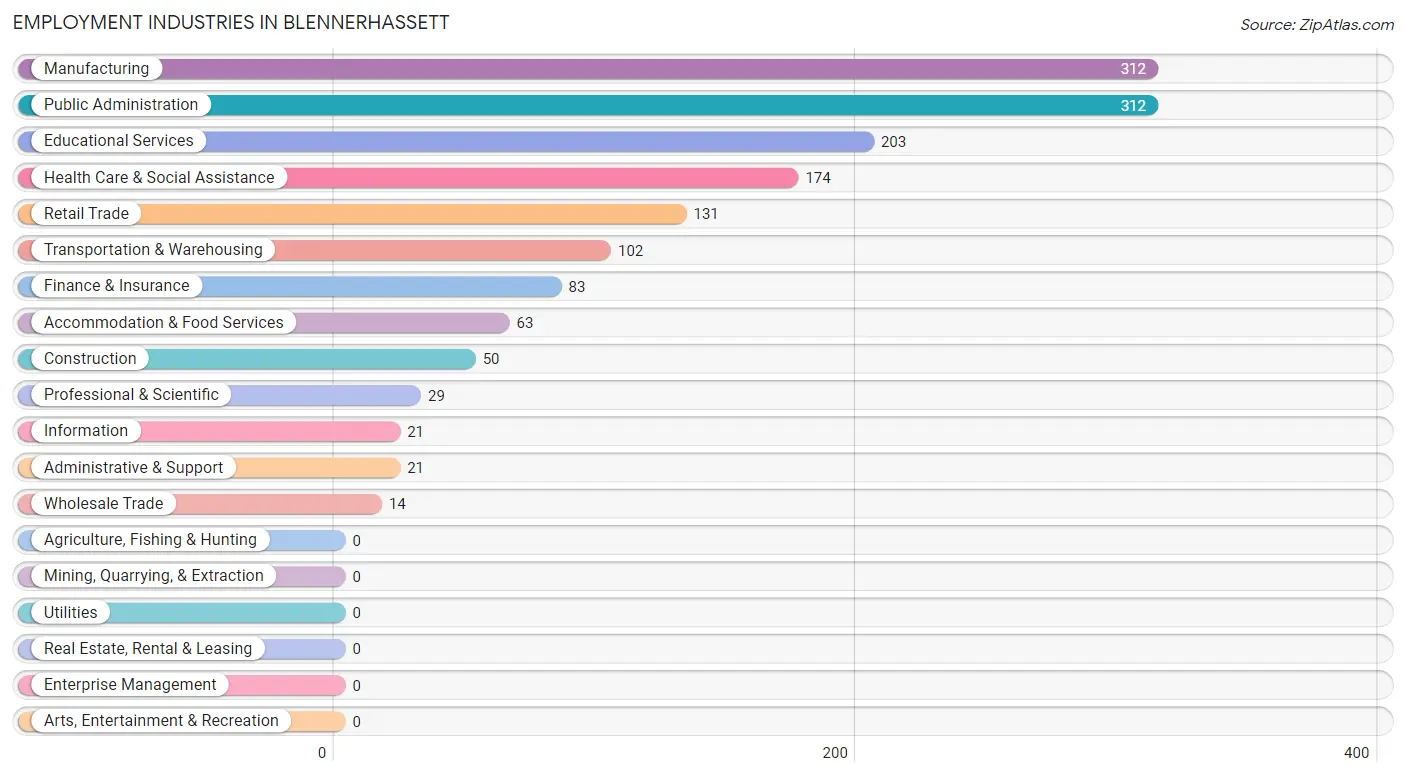
Employment Industries in Blennerhassett
The major employment industries in Blennerhassett include Manufacturing (312 | 20.4%), Public Administration (312 | 20.4%), Educational Services (203 | 13.3%), Health Care & Social Assistance (174 | 11.4%), and Retail Trade (131 | 8.6%).
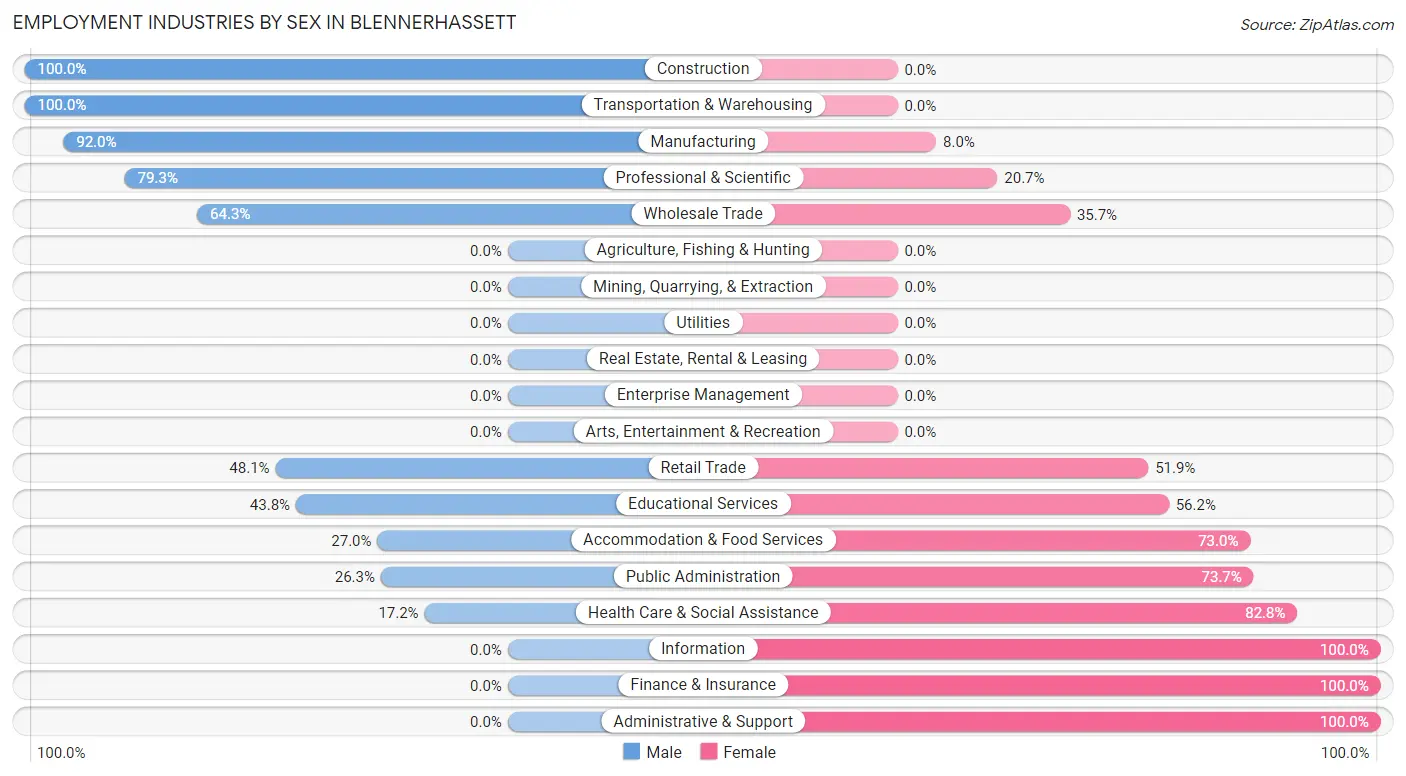
Employment Industries by Sex in Blennerhassett
The Blennerhassett industries that see more men than women are Construction (100.0%), Transportation & Warehousing (100.0%), and Manufacturing (92.0%), whereas the industries that tend to have a higher number of women are Information (100.0%), Finance & Insurance (100.0%), and Administrative & Support (100.0%).
| Industry | Male | Female |
| Agriculture, Fishing & Hunting | 0 (0.0%) | 0 (0.0%) |
| Mining, Quarrying, & Extraction | 0 (0.0%) | 0 (0.0%) |
| Construction | 50 (100.0%) | 0 (0.0%) |
| Manufacturing | 287 (92.0%) | 25 (8.0%) |
| Wholesale Trade | 9 (64.3%) | 5 (35.7%) |
| Retail Trade | 63 (48.1%) | 68 (51.9%) |
| Transportation & Warehousing | 102 (100.0%) | 0 (0.0%) |
| Utilities | 0 (0.0%) | 0 (0.0%) |
| Information | 0 (0.0%) | 21 (100.0%) |
| Finance & Insurance | 0 (0.0%) | 83 (100.0%) |
| Real Estate, Rental & Leasing | 0 (0.0%) | 0 (0.0%) |
| Professional & Scientific | 23 (79.3%) | 6 (20.7%) |
| Enterprise Management | 0 (0.0%) | 0 (0.0%) |
| Administrative & Support | 0 (0.0%) | 21 (100.0%) |
| Educational Services | 89 (43.8%) | 114 (56.2%) |
| Health Care & Social Assistance | 30 (17.2%) | 144 (82.8%) |
| Arts, Entertainment & Recreation | 0 (0.0%) | 0 (0.0%) |
| Accommodation & Food Services | 17 (27.0%) | 46 (73.0%) |
| Public Administration | 82 (26.3%) | 230 (73.7%) |
| Total | 752 (49.2%) | 777 (50.8%) |
Education in Blennerhassett
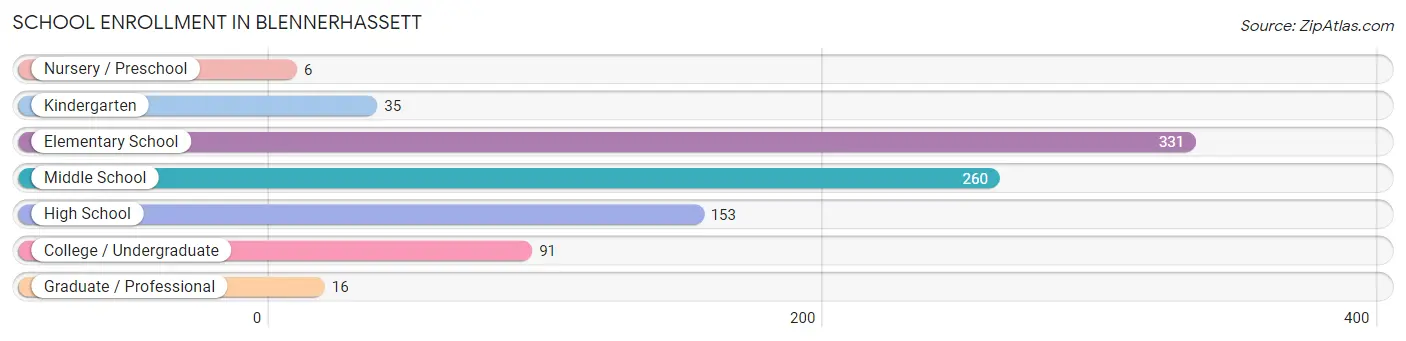
School Enrollment in Blennerhassett
The most common levels of schooling among the 892 students in Blennerhassett are elementary school (331 | 37.1%), middle school (260 | 29.1%), and high school (153 | 17.2%).
| School Level | # Students | % Students |
| Nursery / Preschool | 6 | 0.7% |
| Kindergarten | 35 | 3.9% |
| Elementary School | 331 | 37.1% |
| Middle School | 260 | 29.1% |
| High School | 153 | 17.2% |
| College / Undergraduate | 91 | 10.2% |
| Graduate / Professional | 16 | 1.8% |
| Total | 892 | 100.0% |
School Enrollment by Age by Funding Source in Blennerhassett
Out of a total of 892 students who are enrolled in schools in Blennerhassett, 89 (10.0%) attend a private institution, while the remaining 803 (90.0%) are enrolled in public schools. The age group of 20 to 24 year olds has the highest likelihood of being enrolled in private schools, with 26 (55.3% in the age bracket) enrolled. Conversely, the age group of 3 to 4 year olds has the lowest likelihood of being enrolled in a private school, with 15 (100.0% in the age bracket) attending a public institution.
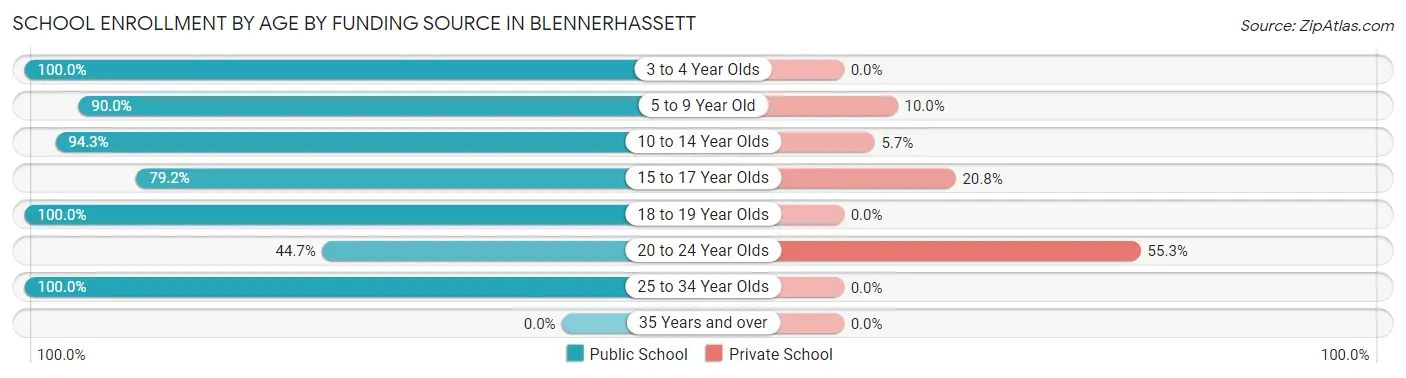
| Age Bracket | Public School | Private School |
| 3 to 4 Year Olds | 15 (100.0%) | 0 (0.0%) |
| 5 to 9 Year Old | 260 (90.0%) | 29 (10.0%) |
| 10 to 14 Year Olds | 395 (94.3%) | 24 (5.7%) |
| 15 to 17 Year Olds | 38 (79.2%) | 10 (20.8%) |
| 18 to 19 Year Olds | 67 (100.0%) | 0 (0.0%) |
| 20 to 24 Year Olds | 21 (44.7%) | 26 (55.3%) |
| 25 to 34 Year Olds | 7 (100.0%) | 0 (0.0%) |
| 35 Years and over | 0 (0.0%) | 0 (0.0%) |
| Total | 803 (90.0%) | 89 (10.0%) |
Educational Attainment by Field of Study in Blennerhassett
Education (152 | 20.4%), business (147 | 19.7%), science & technology (111 | 14.9%), engineering (81 | 10.9%), and liberal arts & history (62 | 8.3%) are the most common fields of study among 746 individuals in Blennerhassett who have obtained a bachelor's degree or higher.
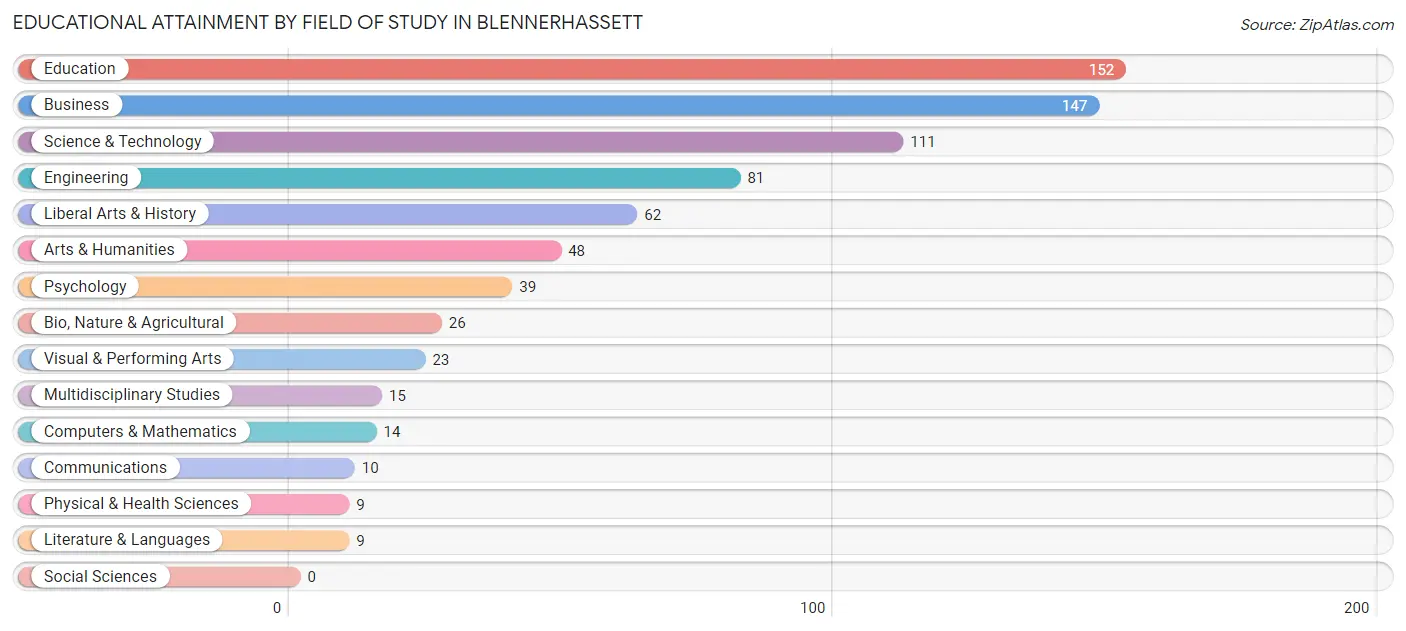
| Field of Study | # Graduates | % Graduates |
| Computers & Mathematics | 14 | 1.9% |
| Bio, Nature & Agricultural | 26 | 3.5% |
| Physical & Health Sciences | 9 | 1.2% |
| Psychology | 39 | 5.2% |
| Social Sciences | 0 | 0.0% |
| Engineering | 81 | 10.9% |
| Multidisciplinary Studies | 15 | 2.0% |
| Science & Technology | 111 | 14.9% |
| Business | 147 | 19.7% |
| Education | 152 | 20.4% |
| Literature & Languages | 9 | 1.2% |
| Liberal Arts & History | 62 | 8.3% |
| Visual & Performing Arts | 23 | 3.1% |
| Communications | 10 | 1.3% |
| Arts & Humanities | 48 | 6.4% |
| Total | 746 | 100.0% |
Transportation & Commute in Blennerhassett
Vehicle Availability by Sex in Blennerhassett
The most prevalent vehicle ownership categories in Blennerhassett are males with 2 vehicles (230, accounting for 31.1%) and females with 2 vehicles (404, making up 29.6%).
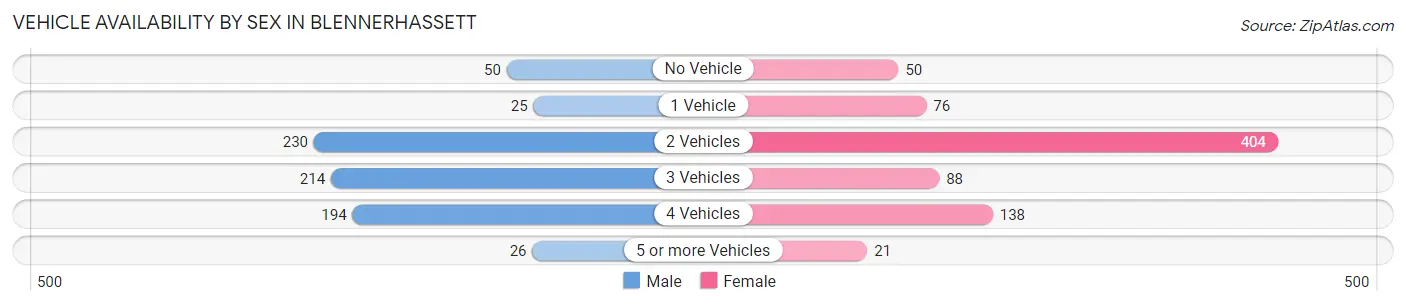
| Vehicles Available | Male | Female |
| No Vehicle | 50 (6.8%) | 50 (6.4%) |
| 1 Vehicle | 25 (3.4%) | 76 (9.8%) |
| 2 Vehicles | 230 (31.1%) | 404 (52.0%) |
| 3 Vehicles | 214 (29.0%) | 88 (11.3%) |
| 4 Vehicles | 194 (26.3%) | 138 (17.8%) |
| 5 or more Vehicles | 26 (3.5%) | 21 (2.7%) |
| Total | 739 (100.0%) | 777 (100.0%) |
Commute Time in Blennerhassett
The most frequently occuring commute durations in Blennerhassett are 10 to 14 minutes (459 commuters, 31.3%), 15 to 19 minutes (441 commuters, 30.1%), and 5 to 9 minutes (228 commuters, 15.5%).
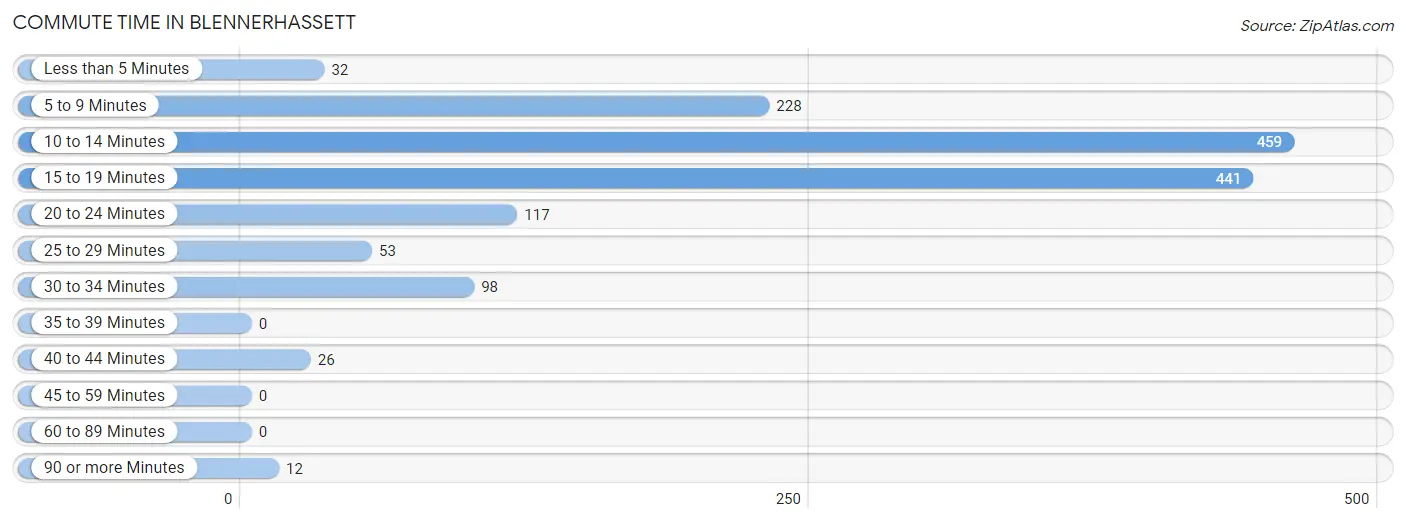
| Commute Time | # Commuters | % Commuters |
| Less than 5 Minutes | 32 | 2.2% |
| 5 to 9 Minutes | 228 | 15.5% |
| 10 to 14 Minutes | 459 | 31.3% |
| 15 to 19 Minutes | 441 | 30.1% |
| 20 to 24 Minutes | 117 | 8.0% |
| 25 to 29 Minutes | 53 | 3.6% |
| 30 to 34 Minutes | 98 | 6.7% |
| 35 to 39 Minutes | 0 | 0.0% |
| 40 to 44 Minutes | 26 | 1.8% |
| 45 to 59 Minutes | 0 | 0.0% |
| 60 to 89 Minutes | 0 | 0.0% |
| 90 or more Minutes | 12 | 0.8% |
Commute Time by Sex in Blennerhassett
The most common commute times in Blennerhassett are 15 to 19 minutes (211 commuters, 29.5%) for males and 10 to 14 minutes (329 commuters, 43.8%) for females.
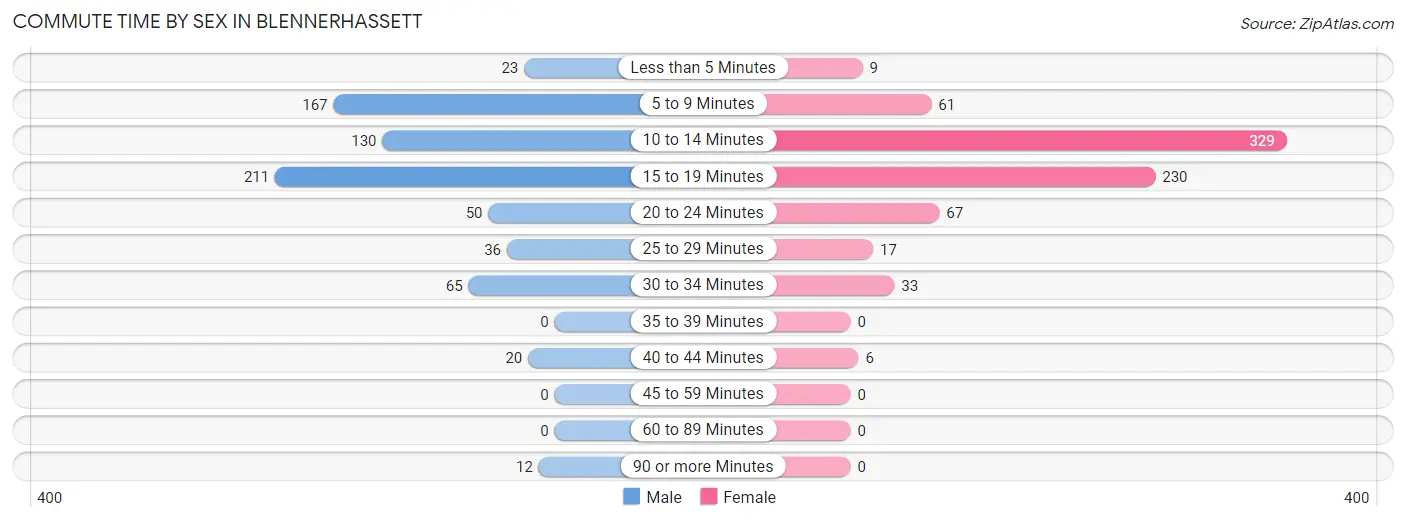
| Commute Time | Male | Female |
| Less than 5 Minutes | 23 (3.2%) | 9 (1.2%) |
| 5 to 9 Minutes | 167 (23.4%) | 61 (8.1%) |
| 10 to 14 Minutes | 130 (18.2%) | 329 (43.8%) |
| 15 to 19 Minutes | 211 (29.5%) | 230 (30.6%) |
| 20 to 24 Minutes | 50 (7.0%) | 67 (8.9%) |
| 25 to 29 Minutes | 36 (5.0%) | 17 (2.3%) |
| 30 to 34 Minutes | 65 (9.1%) | 33 (4.4%) |
| 35 to 39 Minutes | 0 (0.0%) | 0 (0.0%) |
| 40 to 44 Minutes | 20 (2.8%) | 6 (0.8%) |
| 45 to 59 Minutes | 0 (0.0%) | 0 (0.0%) |
| 60 to 89 Minutes | 0 (0.0%) | 0 (0.0%) |
| 90 or more Minutes | 12 (1.7%) | 0 (0.0%) |
Time of Departure to Work by Sex in Blennerhassett
The most frequent times of departure to work in Blennerhassett are 6:30 AM to 6:59 AM (373, 52.2%) for males and 7:00 AM to 7:29 AM (332, 44.2%) for females.
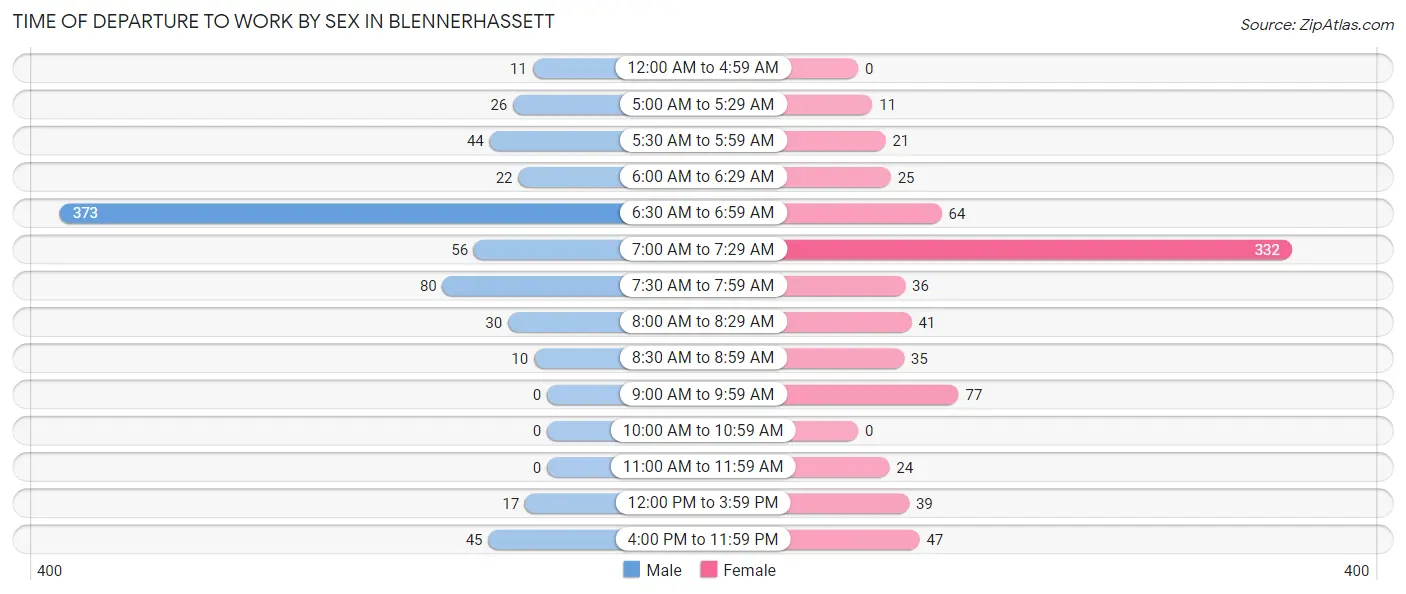
| Time of Departure | Male | Female |
| 12:00 AM to 4:59 AM | 11 (1.5%) | 0 (0.0%) |
| 5:00 AM to 5:29 AM | 26 (3.6%) | 11 (1.5%) |
| 5:30 AM to 5:59 AM | 44 (6.2%) | 21 (2.8%) |
| 6:00 AM to 6:29 AM | 22 (3.1%) | 25 (3.3%) |
| 6:30 AM to 6:59 AM | 373 (52.2%) | 64 (8.5%) |
| 7:00 AM to 7:29 AM | 56 (7.8%) | 332 (44.2%) |
| 7:30 AM to 7:59 AM | 80 (11.2%) | 36 (4.8%) |
| 8:00 AM to 8:29 AM | 30 (4.2%) | 41 (5.4%) |
| 8:30 AM to 8:59 AM | 10 (1.4%) | 35 (4.6%) |
| 9:00 AM to 9:59 AM | 0 (0.0%) | 77 (10.2%) |
| 10:00 AM to 10:59 AM | 0 (0.0%) | 0 (0.0%) |
| 11:00 AM to 11:59 AM | 0 (0.0%) | 24 (3.2%) |
| 12:00 PM to 3:59 PM | 17 (2.4%) | 39 (5.2%) |
| 4:00 PM to 11:59 PM | 45 (6.3%) | 47 (6.2%) |
| Total | 714 (100.0%) | 752 (100.0%) |
Housing Occupancy in Blennerhassett
Occupancy by Ownership in Blennerhassett
Of the total 1,181 dwellings in Blennerhassett, owner-occupied units account for 1,061 (89.8%), while renter-occupied units make up 120 (10.2%).
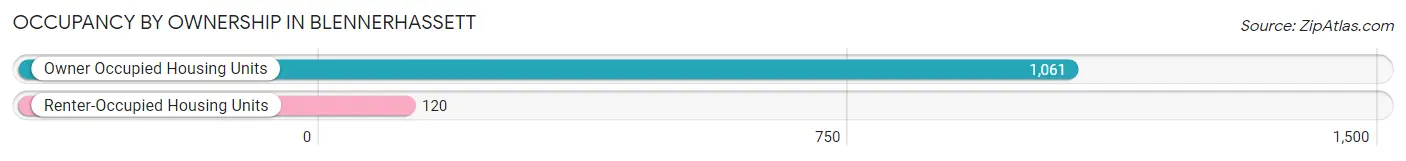
| Occupancy | # Housing Units | % Housing Units |
| Owner Occupied Housing Units | 1,061 | 89.8% |
| Renter-Occupied Housing Units | 120 | 10.2% |
| Total Occupied Housing Units | 1,181 | 100.0% |
Occupancy by Household Size in Blennerhassett
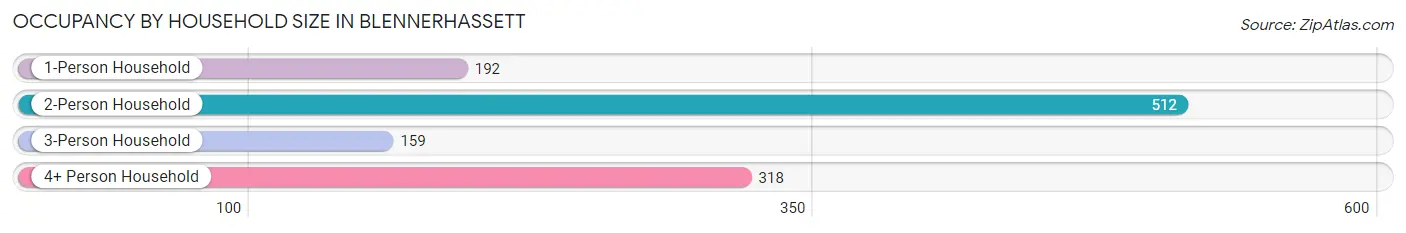
| Household Size | # Housing Units | % Housing Units |
| 1-Person Household | 192 | 16.3% |
| 2-Person Household | 512 | 43.3% |
| 3-Person Household | 159 | 13.5% |
| 4+ Person Household | 318 | 26.9% |
| Total Housing Units | 1,181 | 100.0% |
Occupancy by Ownership by Household Size in Blennerhassett
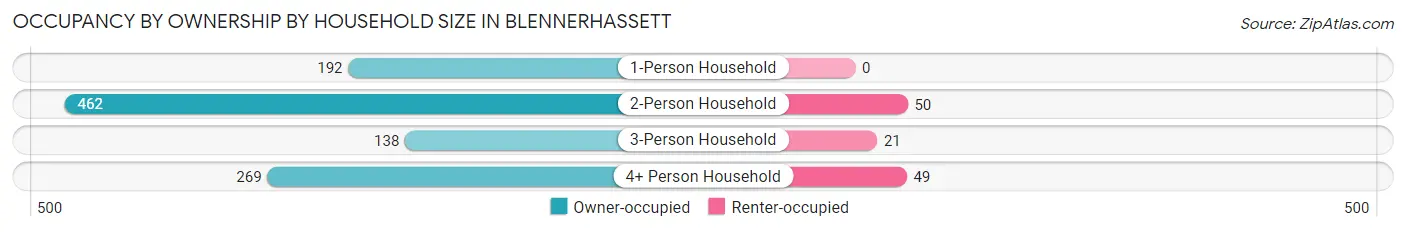
| Household Size | Owner-occupied | Renter-occupied |
| 1-Person Household | 192 (100.0%) | 0 (0.0%) |
| 2-Person Household | 462 (90.2%) | 50 (9.8%) |
| 3-Person Household | 138 (86.8%) | 21 (13.2%) |
| 4+ Person Household | 269 (84.6%) | 49 (15.4%) |
| Total Housing Units | 1,061 (89.8%) | 120 (10.2%) |
Occupancy by Educational Attainment in Blennerhassett
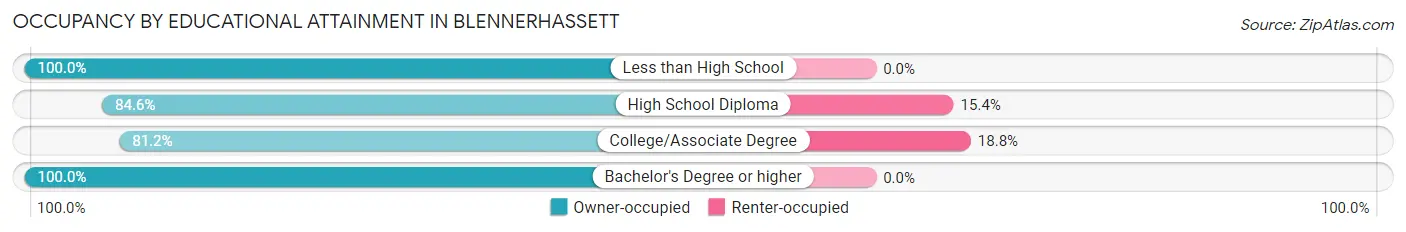
| Household Size | Owner-occupied | Renter-occupied |
| Less than High School | 32 (100.0%) | 0 (0.0%) |
| High School Diploma | 270 (84.6%) | 49 (15.4%) |
| College/Associate Degree | 307 (81.2%) | 71 (18.8%) |
| Bachelor's Degree or higher | 452 (100.0%) | 0 (0.0%) |
Occupancy by Age of Householder in Blennerhassett
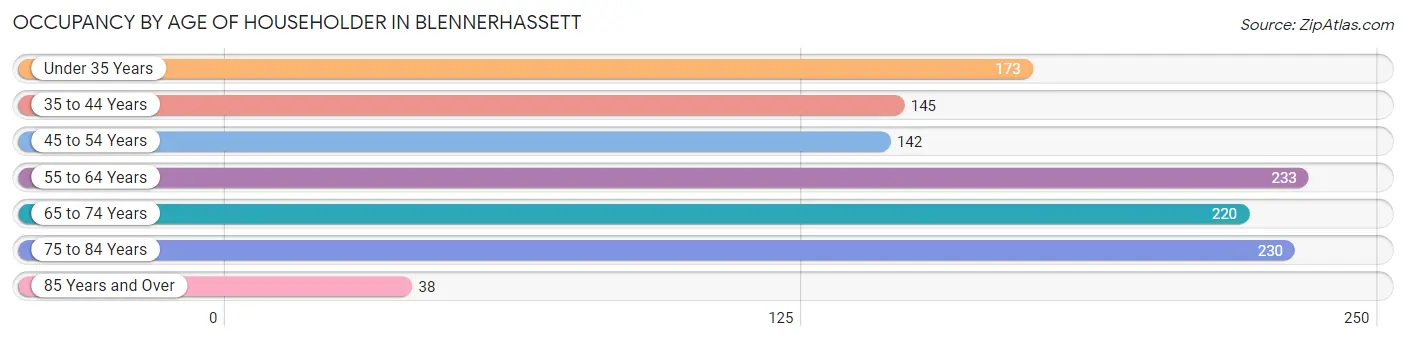
| Age Bracket | # Households | % Households |
| Under 35 Years | 173 | 14.6% |
| 35 to 44 Years | 145 | 12.3% |
| 45 to 54 Years | 142 | 12.0% |
| 55 to 64 Years | 233 | 19.7% |
| 65 to 74 Years | 220 | 18.6% |
| 75 to 84 Years | 230 | 19.5% |
| 85 Years and Over | 38 | 3.2% |
| Total | 1,181 | 100.0% |
Housing Finances in Blennerhassett
Median Income by Occupancy in Blennerhassett
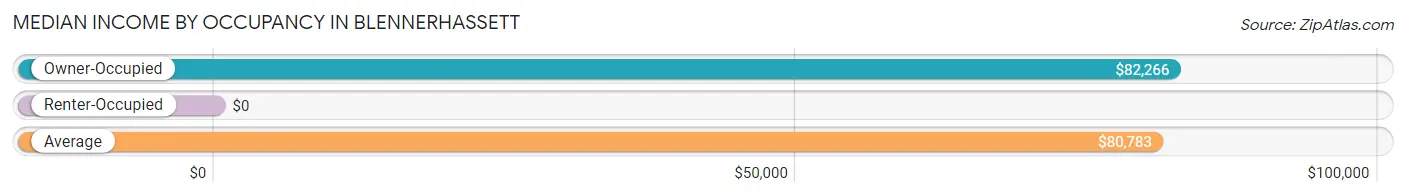
| Occupancy Type | # Households | Median Income |
| Owner-Occupied | 1,061 (89.8%) | $82,266 |
| Renter-Occupied | 120 (10.2%) | $0 |
| Average | 1,181 (100.0%) | $80,783 |
Occupancy by Householder Income Bracket in Blennerhassett
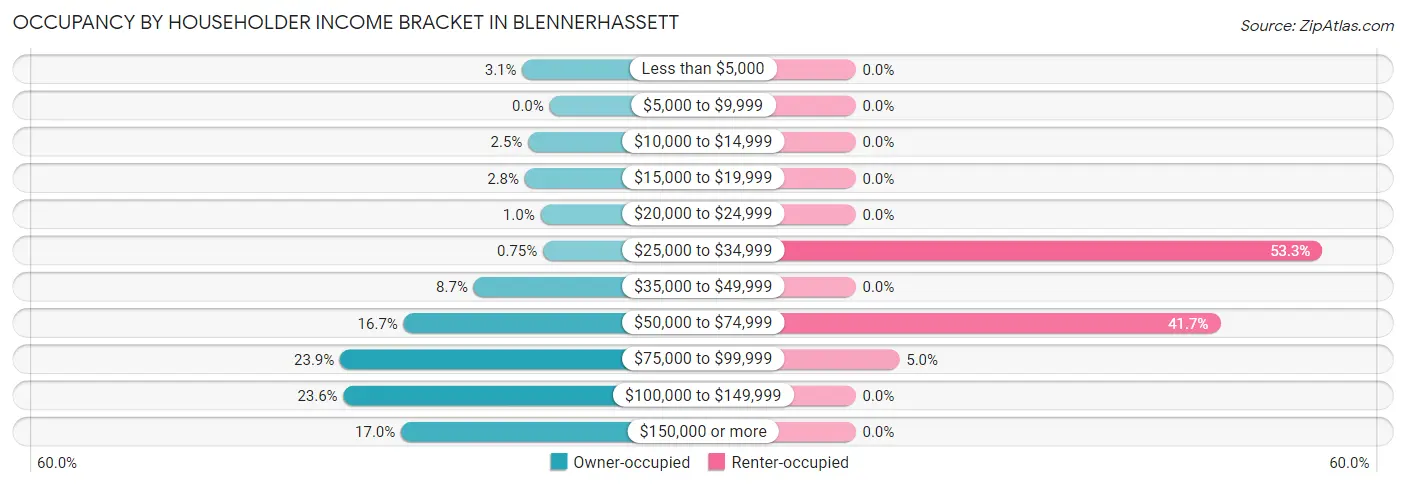
| Income Bracket | Owner-occupied | Renter-occupied |
| Less than $5,000 | 33 (3.1%) | 0 (0.0%) |
| $5,000 to $9,999 | 0 (0.0%) | 0 (0.0%) |
| $10,000 to $14,999 | 26 (2.5%) | 0 (0.0%) |
| $15,000 to $19,999 | 30 (2.8%) | 0 (0.0%) |
| $20,000 to $24,999 | 11 (1.0%) | 0 (0.0%) |
| $25,000 to $34,999 | 8 (0.7%) | 64 (53.3%) |
| $35,000 to $49,999 | 92 (8.7%) | 0 (0.0%) |
| $50,000 to $74,999 | 177 (16.7%) | 50 (41.7%) |
| $75,000 to $99,999 | 254 (23.9%) | 6 (5.0%) |
| $100,000 to $149,999 | 250 (23.6%) | 0 (0.0%) |
| $150,000 or more | 180 (17.0%) | 0 (0.0%) |
| Total | 1,061 (100.0%) | 120 (100.0%) |
Monthly Housing Cost Tiers in Blennerhassett
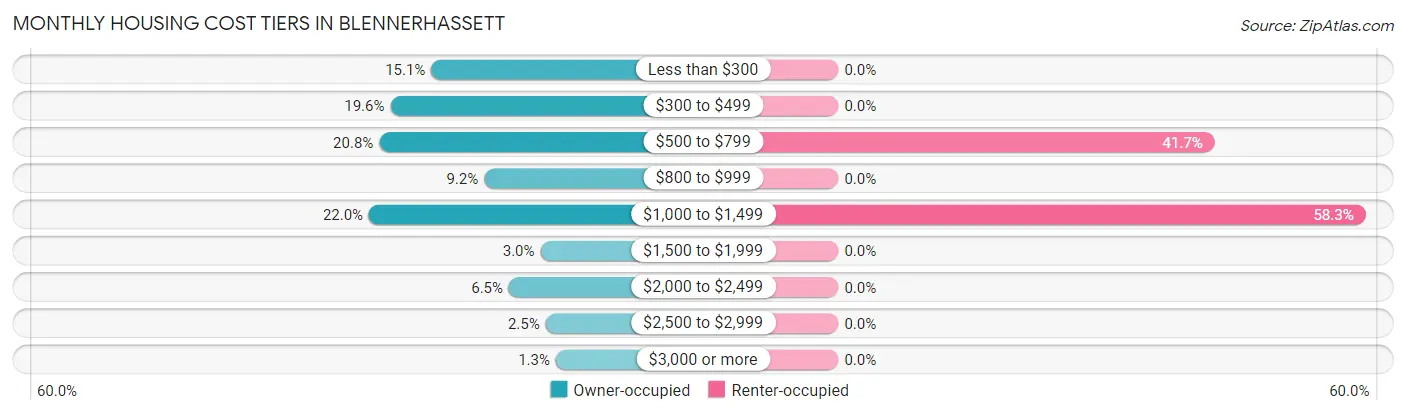
| Monthly Cost | Owner-occupied | Renter-occupied |
| Less than $300 | 160 (15.1%) | 0 (0.0%) |
| $300 to $499 | 208 (19.6%) | 0 (0.0%) |
| $500 to $799 | 221 (20.8%) | 50 (41.7%) |
| $800 to $999 | 98 (9.2%) | 0 (0.0%) |
| $1,000 to $1,499 | 233 (22.0%) | 70 (58.3%) |
| $1,500 to $1,999 | 32 (3.0%) | 0 (0.0%) |
| $2,000 to $2,499 | 69 (6.5%) | 0 (0.0%) |
| $2,500 to $2,999 | 26 (2.5%) | 0 (0.0%) |
| $3,000 or more | 14 (1.3%) | 0 (0.0%) |
| Total | 1,061 (100.0%) | 120 (100.0%) |
Physical Housing Characteristics in Blennerhassett
Housing Structures in Blennerhassett
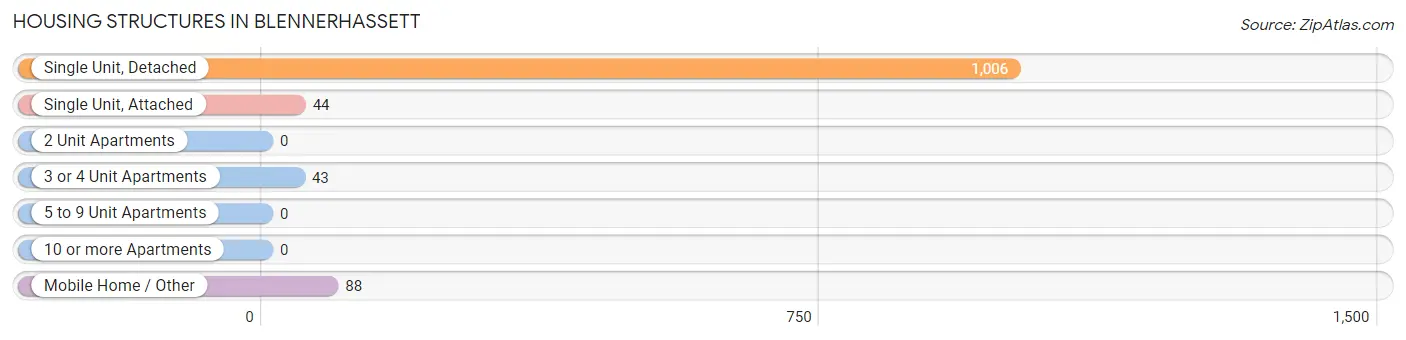
| Structure Type | # Housing Units | % Housing Units |
| Single Unit, Detached | 1,006 | 85.2% |
| Single Unit, Attached | 44 | 3.7% |
| 2 Unit Apartments | 0 | 0.0% |
| 3 or 4 Unit Apartments | 43 | 3.6% |
| 5 to 9 Unit Apartments | 0 | 0.0% |
| 10 or more Apartments | 0 | 0.0% |
| Mobile Home / Other | 88 | 7.4% |
| Total | 1,181 | 100.0% |
Housing Structures by Occupancy in Blennerhassett
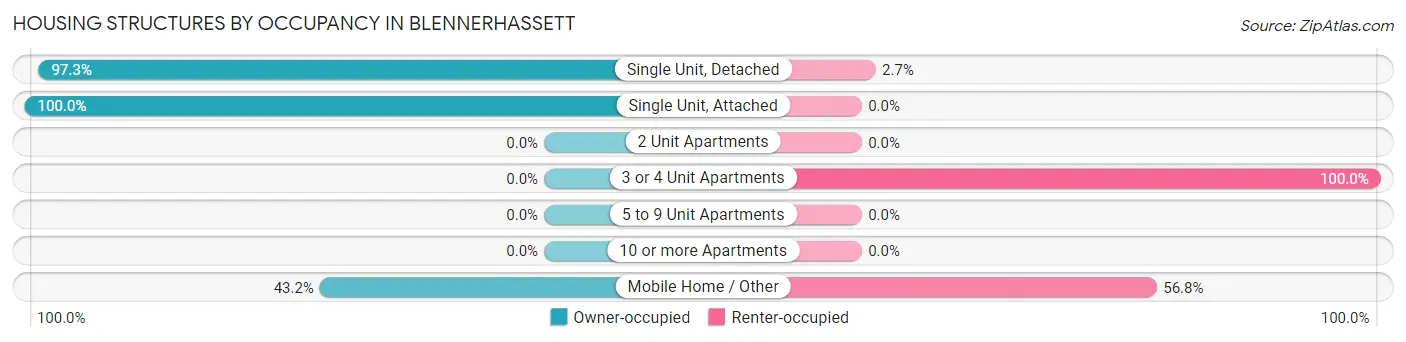
| Structure Type | Owner-occupied | Renter-occupied |
| Single Unit, Detached | 979 (97.3%) | 27 (2.7%) |
| Single Unit, Attached | 44 (100.0%) | 0 (0.0%) |
| 2 Unit Apartments | 0 (0.0%) | 0 (0.0%) |
| 3 or 4 Unit Apartments | 0 (0.0%) | 43 (100.0%) |
| 5 to 9 Unit Apartments | 0 (0.0%) | 0 (0.0%) |
| 10 or more Apartments | 0 (0.0%) | 0 (0.0%) |
| Mobile Home / Other | 38 (43.2%) | 50 (56.8%) |
| Total | 1,061 (89.8%) | 120 (10.2%) |
Housing Structures by Number of Rooms in Blennerhassett
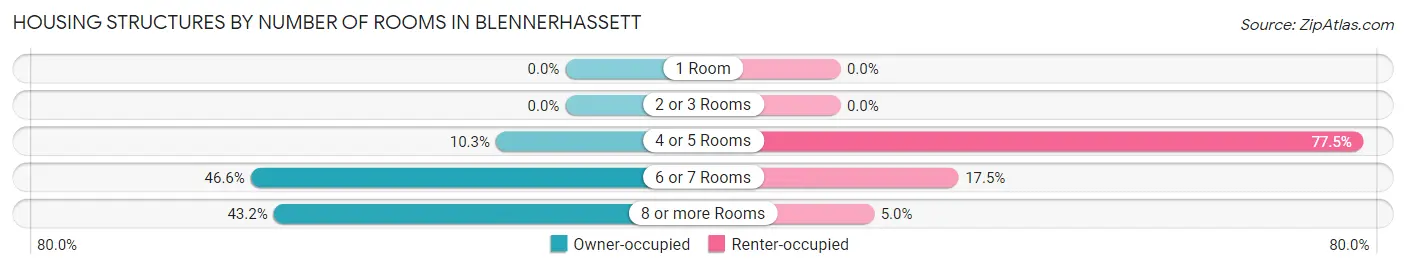
| Number of Rooms | Owner-occupied | Renter-occupied |
| 1 Room | 0 (0.0%) | 0 (0.0%) |
| 2 or 3 Rooms | 0 (0.0%) | 0 (0.0%) |
| 4 or 5 Rooms | 109 (10.3%) | 93 (77.5%) |
| 6 or 7 Rooms | 494 (46.6%) | 21 (17.5%) |
| 8 or more Rooms | 458 (43.2%) | 6 (5.0%) |
| Total | 1,061 (100.0%) | 120 (100.0%) |
Housing Structure by Heating Type in Blennerhassett
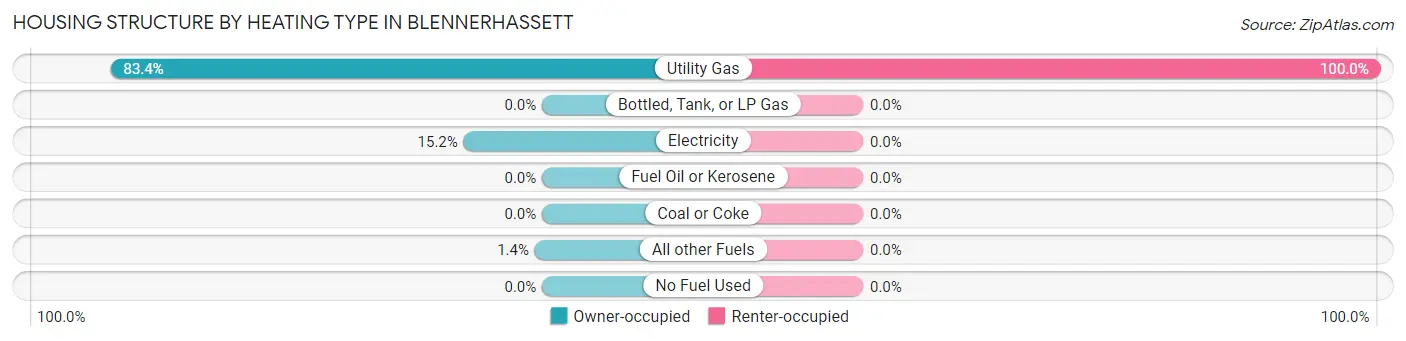
| Heating Type | Owner-occupied | Renter-occupied |
| Utility Gas | 885 (83.4%) | 120 (100.0%) |
| Bottled, Tank, or LP Gas | 0 (0.0%) | 0 (0.0%) |
| Electricity | 161 (15.2%) | 0 (0.0%) |
| Fuel Oil or Kerosene | 0 (0.0%) | 0 (0.0%) |
| Coal or Coke | 0 (0.0%) | 0 (0.0%) |
| All other Fuels | 15 (1.4%) | 0 (0.0%) |
| No Fuel Used | 0 (0.0%) | 0 (0.0%) |
| Total | 1,061 (100.0%) | 120 (100.0%) |
Household Vehicle Usage in Blennerhassett
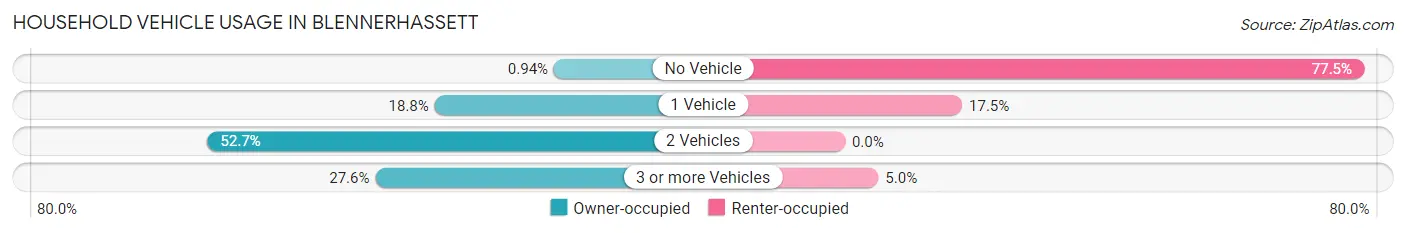
| Vehicles per Household | Owner-occupied | Renter-occupied |
| No Vehicle | 10 (0.9%) | 93 (77.5%) |
| 1 Vehicle | 199 (18.8%) | 21 (17.5%) |
| 2 Vehicles | 559 (52.7%) | 0 (0.0%) |
| 3 or more Vehicles | 293 (27.6%) | 6 (5.0%) |
| Total | 1,061 (100.0%) | 120 (100.0%) |
Real Estate & Mortgages in Blennerhassett
Real Estate and Mortgage Overview in Blennerhassett
| Characteristic | Without Mortgage | With Mortgage |
| Housing Units | 485 | 576 |
| Median Property Value | $183,600 | $173,200 |
| Median Household Income | $71,607 | $125 |
| Monthly Housing Costs | $373 | $14 |
| Real Estate Taxes | $931 | $0 |
Property Value by Mortgage Status in Blennerhassett
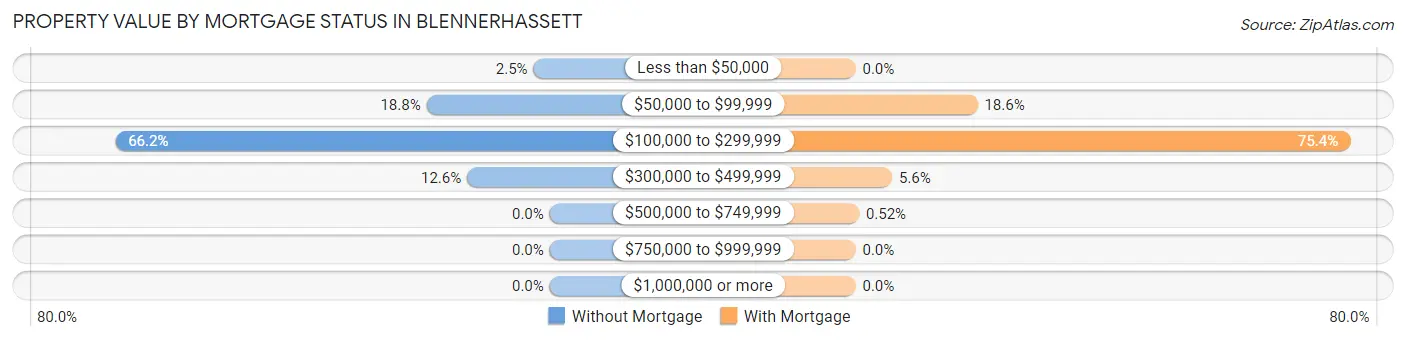
| Property Value | Without Mortgage | With Mortgage |
| Less than $50,000 | 12 (2.5%) | 0 (0.0%) |
| $50,000 to $99,999 | 91 (18.8%) | 107 (18.6%) |
| $100,000 to $299,999 | 321 (66.2%) | 434 (75.3%) |
| $300,000 to $499,999 | 61 (12.6%) | 32 (5.6%) |
| $500,000 to $749,999 | 0 (0.0%) | 3 (0.5%) |
| $750,000 to $999,999 | 0 (0.0%) | 0 (0.0%) |
| $1,000,000 or more | 0 (0.0%) | 0 (0.0%) |
| Total | 485 (100.0%) | 576 (100.0%) |
Household Income by Mortgage Status in Blennerhassett
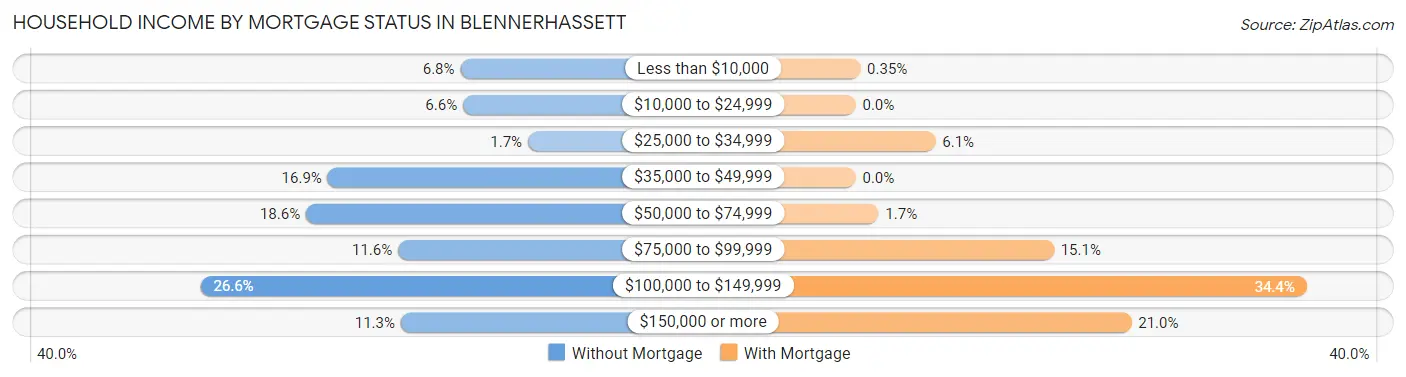
| Household Income | Without Mortgage | With Mortgage |
| Less than $10,000 | 33 (6.8%) | 2 (0.4%) |
| $10,000 to $24,999 | 32 (6.6%) | 0 (0.0%) |
| $25,000 to $34,999 | 8 (1.7%) | 35 (6.1%) |
| $35,000 to $49,999 | 82 (16.9%) | 0 (0.0%) |
| $50,000 to $74,999 | 90 (18.6%) | 10 (1.7%) |
| $75,000 to $99,999 | 56 (11.6%) | 87 (15.1%) |
| $100,000 to $149,999 | 129 (26.6%) | 198 (34.4%) |
| $150,000 or more | 55 (11.3%) | 121 (21.0%) |
| Total | 485 (100.0%) | 576 (100.0%) |
Property Value to Household Income Ratio in Blennerhassett
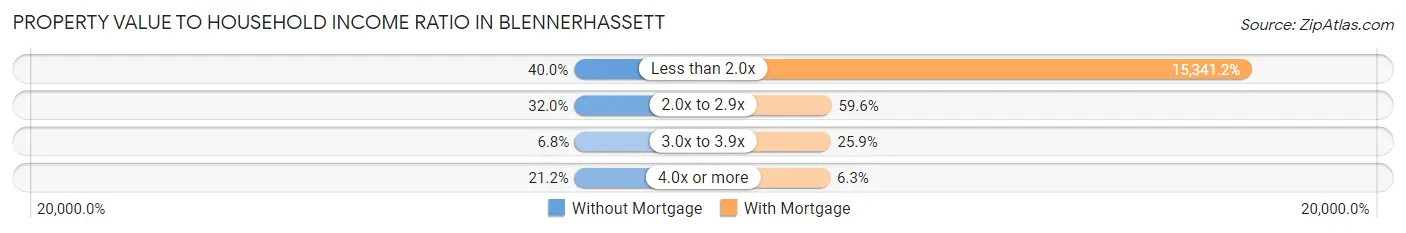
| Value-to-Income Ratio | Without Mortgage | With Mortgage |
| Less than 2.0x | 194 (40.0%) | 88,365 (15,341.1%) |
| 2.0x to 2.9x | 155 (32.0%) | 343 (59.6%) |
| 3.0x to 3.9x | 33 (6.8%) | 149 (25.9%) |
| 4.0x or more | 103 (21.2%) | 36 (6.2%) |
| Total | 485 (100.0%) | 576 (100.0%) |
Real Estate Taxes by Mortgage Status in Blennerhassett
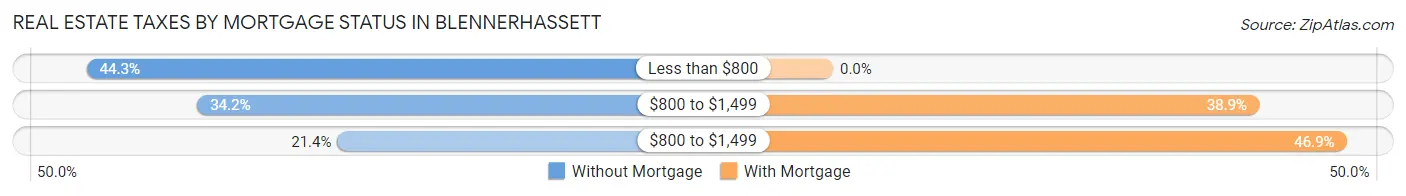
| Property Taxes | Without Mortgage | With Mortgage |
| Less than $800 | 215 (44.3%) | 0 (0.0%) |
| $800 to $1,499 | 166 (34.2%) | 224 (38.9%) |
| $800 to $1,499 | 104 (21.4%) | 270 (46.9%) |
| Total | 485 (100.0%) | 576 (100.0%) |
Health & Disability in Blennerhassett
Health Insurance Coverage by Age in Blennerhassett
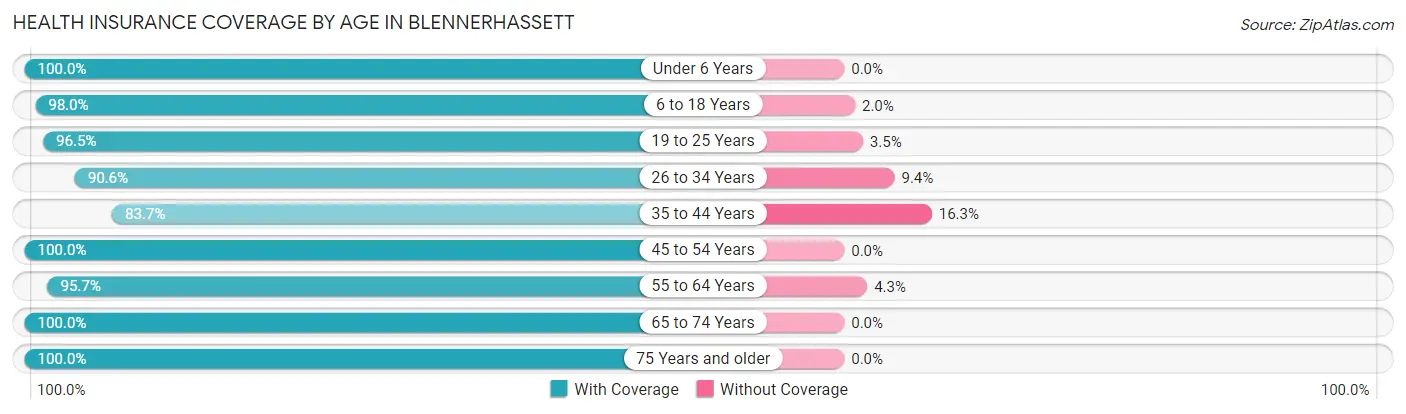
| Age Bracket | With Coverage | Without Coverage |
| Under 6 Years | 77 (100.0%) | 0 (0.0%) |
| 6 to 18 Years | 833 (98.0%) | 17 (2.0%) |
| 19 to 25 Years | 195 (96.5%) | 7 (3.5%) |
| 26 to 34 Years | 329 (90.6%) | 34 (9.4%) |
| 35 to 44 Years | 359 (83.7%) | 70 (16.3%) |
| 45 to 54 Years | 232 (100.0%) | 0 (0.0%) |
| 55 to 64 Years | 604 (95.7%) | 27 (4.3%) |
| 65 to 74 Years | 386 (100.0%) | 0 (0.0%) |
| 75 Years and older | 389 (100.0%) | 0 (0.0%) |
| Total | 3,404 (95.6%) | 155 (4.4%) |
Health Insurance Coverage by Citizenship Status in Blennerhassett
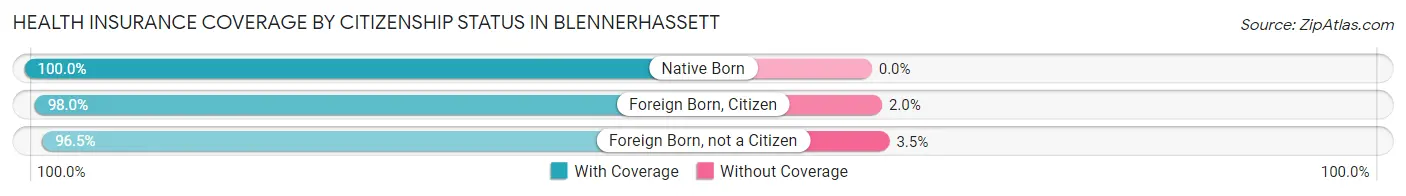
| Citizenship Status | With Coverage | Without Coverage |
| Native Born | 77 (100.0%) | 0 (0.0%) |
| Foreign Born, Citizen | 833 (98.0%) | 17 (2.0%) |
| Foreign Born, not a Citizen | 195 (96.5%) | 7 (3.5%) |
Health Insurance Coverage by Household Income in Blennerhassett
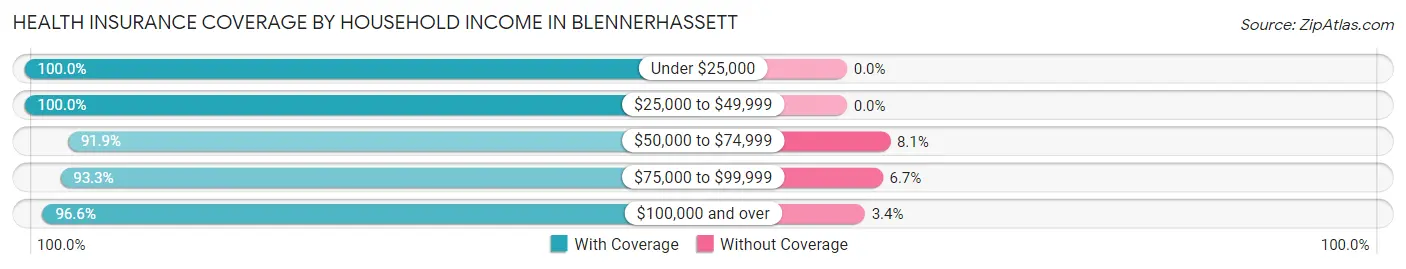
| Household Income | With Coverage | Without Coverage |
| Under $25,000 | 115 (100.0%) | 0 (0.0%) |
| $25,000 to $49,999 | 471 (100.0%) | 0 (0.0%) |
| $50,000 to $74,999 | 569 (91.9%) | 50 (8.1%) |
| $75,000 to $99,999 | 724 (93.3%) | 52 (6.7%) |
| $100,000 and over | 1,525 (96.6%) | 53 (3.4%) |
Public vs Private Health Insurance Coverage by Age in Blennerhassett
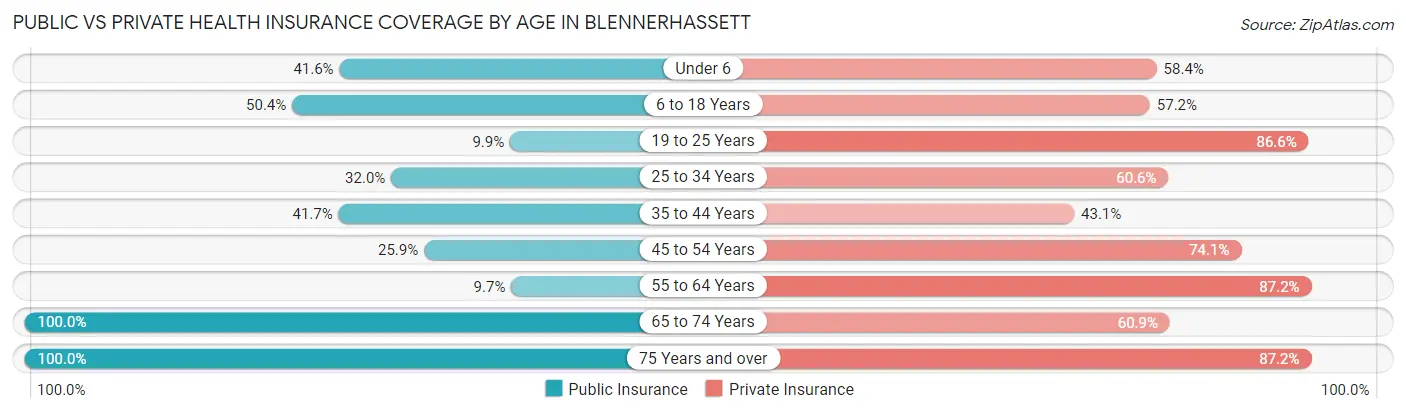
| Age Bracket | Public Insurance | Private Insurance |
| Under 6 | 32 (41.6%) | 45 (58.4%) |
| 6 to 18 Years | 428 (50.3%) | 486 (57.2%) |
| 19 to 25 Years | 20 (9.9%) | 175 (86.6%) |
| 25 to 34 Years | 116 (32.0%) | 220 (60.6%) |
| 35 to 44 Years | 179 (41.7%) | 185 (43.1%) |
| 45 to 54 Years | 60 (25.9%) | 172 (74.1%) |
| 55 to 64 Years | 61 (9.7%) | 550 (87.2%) |
| 65 to 74 Years | 386 (100.0%) | 235 (60.9%) |
| 75 Years and over | 389 (100.0%) | 339 (87.2%) |
| Total | 1,671 (46.9%) | 2,407 (67.6%) |
Disability Status by Sex by Age in Blennerhassett
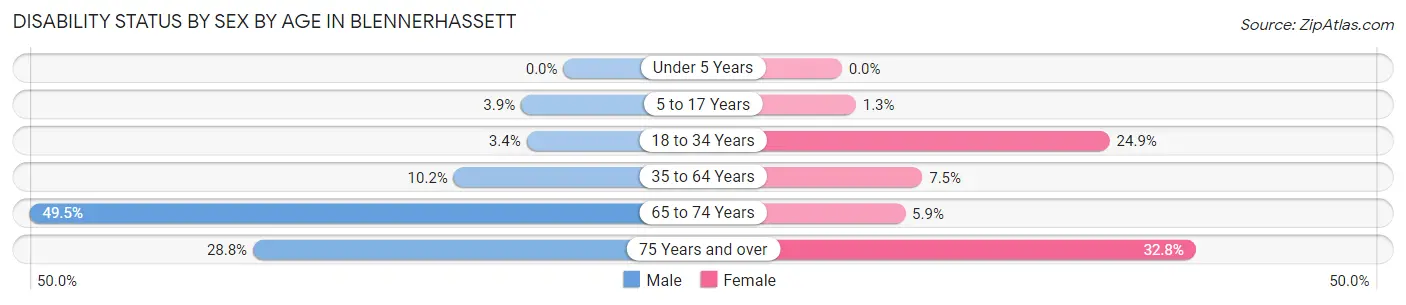
| Age Bracket | Male | Female |
| Under 5 Years | 0 (0.0%) | 0 (0.0%) |
| 5 to 17 Years | 13 (3.9%) | 6 (1.3%) |
| 18 to 34 Years | 10 (3.4%) | 87 (24.9%) |
| 35 to 64 Years | 62 (10.2%) | 51 (7.5%) |
| 65 to 74 Years | 107 (49.5%) | 10 (5.9%) |
| 75 Years and over | 34 (28.8%) | 89 (32.8%) |
Disability Class by Sex by Age in Blennerhassett
Disability Class: Hearing Difficulty
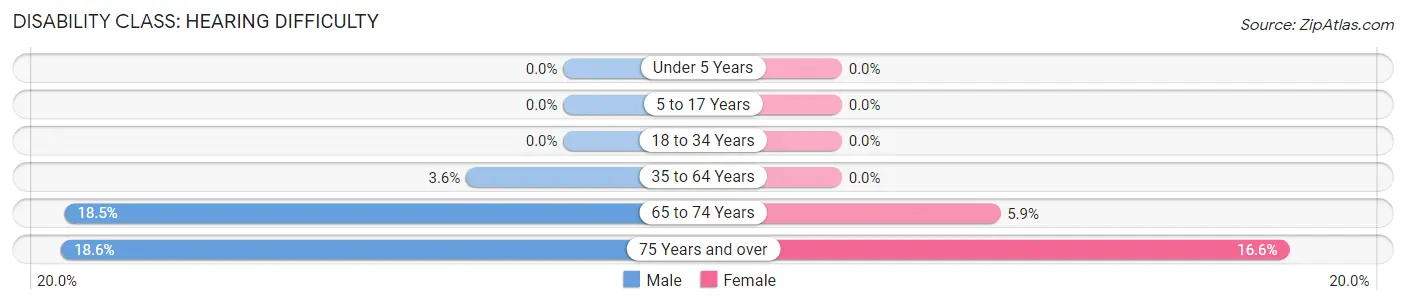
| Age Bracket | Male | Female |
| Under 5 Years | 0 (0.0%) | 0 (0.0%) |
| 5 to 17 Years | 0 (0.0%) | 0 (0.0%) |
| 18 to 34 Years | 0 (0.0%) | 0 (0.0%) |
| 35 to 64 Years | 22 (3.6%) | 0 (0.0%) |
| 65 to 74 Years | 40 (18.5%) | 10 (5.9%) |
| 75 Years and over | 22 (18.6%) | 45 (16.6%) |
Disability Class: Vision Difficulty
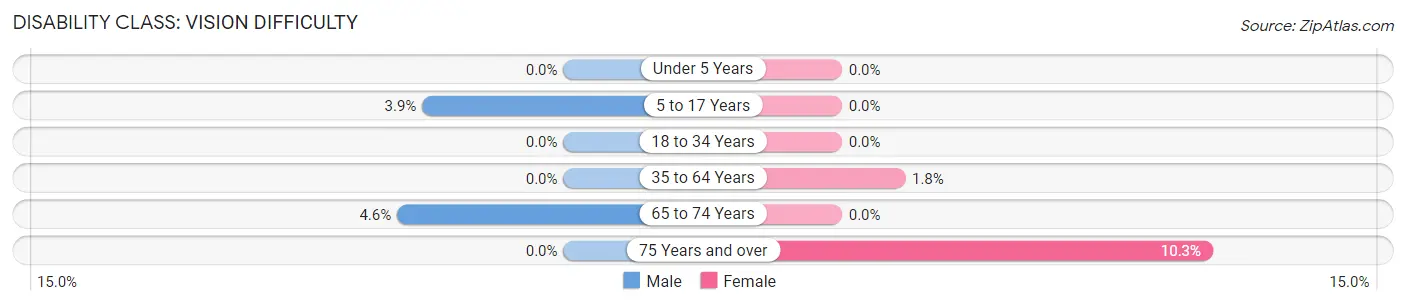
| Age Bracket | Male | Female |
| Under 5 Years | 0 (0.0%) | 0 (0.0%) |
| 5 to 17 Years | 13 (3.9%) | 0 (0.0%) |
| 18 to 34 Years | 0 (0.0%) | 0 (0.0%) |
| 35 to 64 Years | 0 (0.0%) | 12 (1.8%) |
| 65 to 74 Years | 10 (4.6%) | 0 (0.0%) |
| 75 Years and over | 0 (0.0%) | 28 (10.3%) |
Disability Class: Cognitive Difficulty
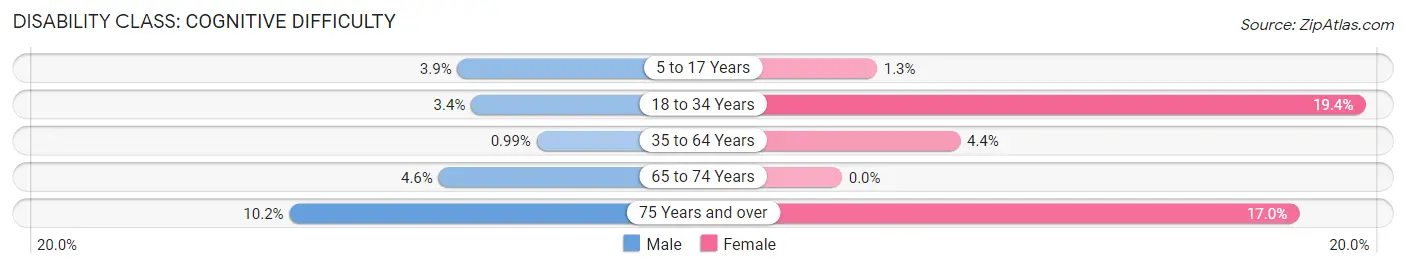
| Age Bracket | Male | Female |
| 5 to 17 Years | 13 (3.9%) | 6 (1.3%) |
| 18 to 34 Years | 10 (3.4%) | 68 (19.4%) |
| 35 to 64 Years | 6 (1.0%) | 30 (4.4%) |
| 65 to 74 Years | 10 (4.6%) | 0 (0.0%) |
| 75 Years and over | 12 (10.2%) | 46 (17.0%) |
Disability Class: Ambulatory Difficulty
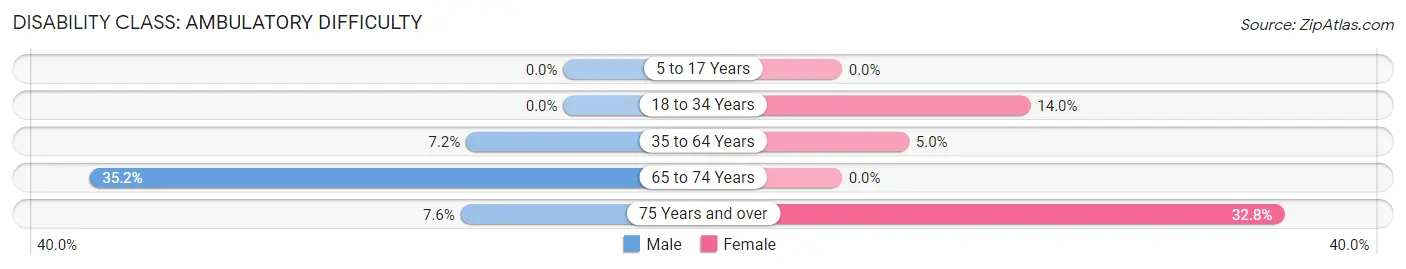
| Age Bracket | Male | Female |
| 5 to 17 Years | 0 (0.0%) | 0 (0.0%) |
| 18 to 34 Years | 0 (0.0%) | 49 (14.0%) |
| 35 to 64 Years | 44 (7.2%) | 34 (5.0%) |
| 65 to 74 Years | 76 (35.2%) | 0 (0.0%) |
| 75 Years and over | 9 (7.6%) | 89 (32.8%) |
Disability Class: Self-Care Difficulty
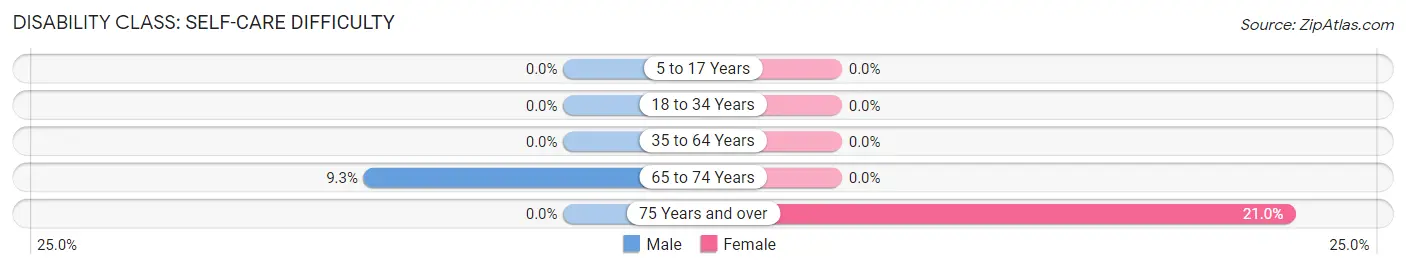
| Age Bracket | Male | Female |
| 5 to 17 Years | 0 (0.0%) | 0 (0.0%) |
| 18 to 34 Years | 0 (0.0%) | 0 (0.0%) |
| 35 to 64 Years | 0 (0.0%) | 0 (0.0%) |
| 65 to 74 Years | 20 (9.3%) | 0 (0.0%) |
| 75 Years and over | 0 (0.0%) | 57 (21.0%) |
Technology Access in Blennerhassett
Computing Device Access in Blennerhassett
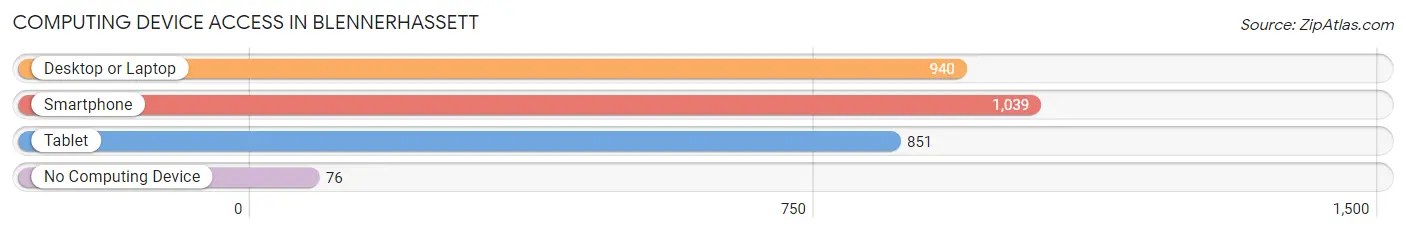
| Device Type | # Households | % Households |
| Desktop or Laptop | 940 | 79.6% |
| Smartphone | 1,039 | 88.0% |
| Tablet | 851 | 72.1% |
| No Computing Device | 76 | 6.4% |
| Total | 1,181 | 100.0% |
Internet Access in Blennerhassett
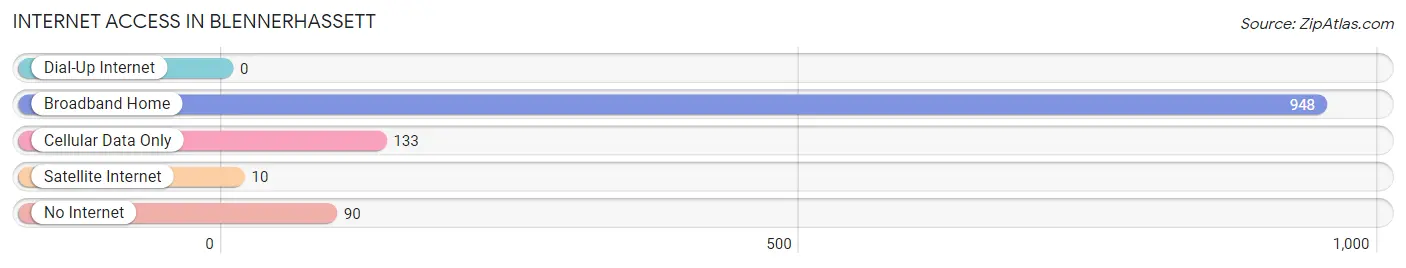
| Internet Type | # Households | % Households |
| Dial-Up Internet | 0 | 0.0% |
| Broadband Home | 948 | 80.3% |
| Cellular Data Only | 133 | 11.3% |
| Satellite Internet | 10 | 0.9% |
| No Internet | 90 | 7.6% |
| Total | 1,181 | 100.0% |
Blennerhassett Summary
Blennerhassett is a small unincorporated community located in Wood County, West Virginia. It is situated on the Ohio River, just south of Parkersburg. The community was named after Harman Blennerhassett, an Irish-born lawyer and politician who settled in the area in 1798.
History
The area that is now Blennerhassett was first settled by Native Americans, including the Shawnee and Mingo tribes. The first European settlers arrived in the late 1700s, and the area was officially established as Blennerhassett in 1810.
Harman Blennerhassett was an Irish-born lawyer and politician who had been involved in the Irish Rebellion of 1798. He fled to the United States in 1799 and eventually settled in the area that is now Blennerhassett. He purchased an island in the Ohio River and built a mansion there, which became known as Blennerhassett Island.
In 1805, Blennerhassett became involved in a conspiracy with Aaron Burr to create an independent nation in the western United States. The conspiracy was uncovered and Blennerhassett was arrested and charged with treason. He was eventually acquitted, but his reputation was ruined and he was forced to flee the area.
The community of Blennerhassett was officially established in 1810. The town was named after Harman Blennerhassett, and the island he had built was renamed Blennerhassett Island.
Geography
Blennerhassett is located in Wood County, West Virginia. It is situated on the Ohio River, just south of Parkersburg. The community is located on the western side of the river, and is bordered by the towns of Vienna and Williamstown.
The terrain of Blennerhassett is mostly flat, with some rolling hills. The area is heavily forested, with a mix of deciduous and coniferous trees. The climate is humid continental, with hot summers and cold winters.
Economy
The economy of Blennerhassett is largely based on tourism. The town is home to Blennerhassett Island Historical State Park, which attracts visitors from all over the world. The park features a replica of Harman Blennerhassett’s mansion, as well as a museum and other attractions.
The town is also home to several small businesses, including restaurants, shops, and a marina. The town is also home to a number of manufacturing companies, including a plastics plant and a paper mill.
Demographics
As of the 2010 census, the population of Blennerhassett was 1,845. The racial makeup of the town was 97.3% White, 0.7% African American, 0.2% Native American, 0.3% Asian, and 1.5% from other races.
The median household income in Blennerhassett was $37,917, and the median family income was $45,938. The per capita income was $20,945. About 11.3% of families and 14.2% of the population were below the poverty line.
Common Questions
What is Per Capita Income in Blennerhassett?
Per Capita income in Blennerhassett is $34,495.
What is the Median Family Income in Blennerhassett?
Median Family Income in Blennerhassett is $82,198.
What is the Median Household income in Blennerhassett?
Median Household Income in Blennerhassett is $80,783.
What is Income or Wage Gap in Blennerhassett?
Income or Wage Gap in Blennerhassett is 22.2%.
Women in Blennerhassett earn 77.8 cents for every dollar earned by a man.
What is Inequality or Gini Index in Blennerhassett?
Inequality or Gini Index in Blennerhassett is 0.36.
What is the Total Population of Blennerhassett?
Total Population of Blennerhassett is 3,564.
What is the Total Male Population of Blennerhassett?
Total Male Population of Blennerhassett is 1,596.
What is the Total Female Population of Blennerhassett?
Total Female Population of Blennerhassett is 1,968.
What is the Ratio of Males per 100 Females in Blennerhassett?
There are 81.10 Males per 100 Females in Blennerhassett.
What is the Ratio of Females per 100 Males in Blennerhassett?
There are 123.31 Females per 100 Males in Blennerhassett.
What is the Median Population Age in Blennerhassett?
Median Population Age in Blennerhassett is 40.7 Years.
What is the Average Family Size in Blennerhassett
Average Family Size in Blennerhassett is 3.4 People.
What is the Average Household Size in Blennerhassett
Average Household Size in Blennerhassett is 3.0 People.
How Large is the Labor Force in Blennerhassett?
There are 1,609 People in the Labor Forcein in Blennerhassett.
What is the Percentage of People in the Labor Force in Blennerhassett?
58.8% of People are in the Labor Force in Blennerhassett.
What is the Unemployment Rate in Blennerhassett?
Unemployment Rate in Blennerhassett is 5.0%.