Zip Codes with the Highest Percentage of Population with a Degree in Literature and Languages in Vermont
RELATED REPORTS & OPTIONS
Literature and Languages
Vermont
Compare Zip Codes
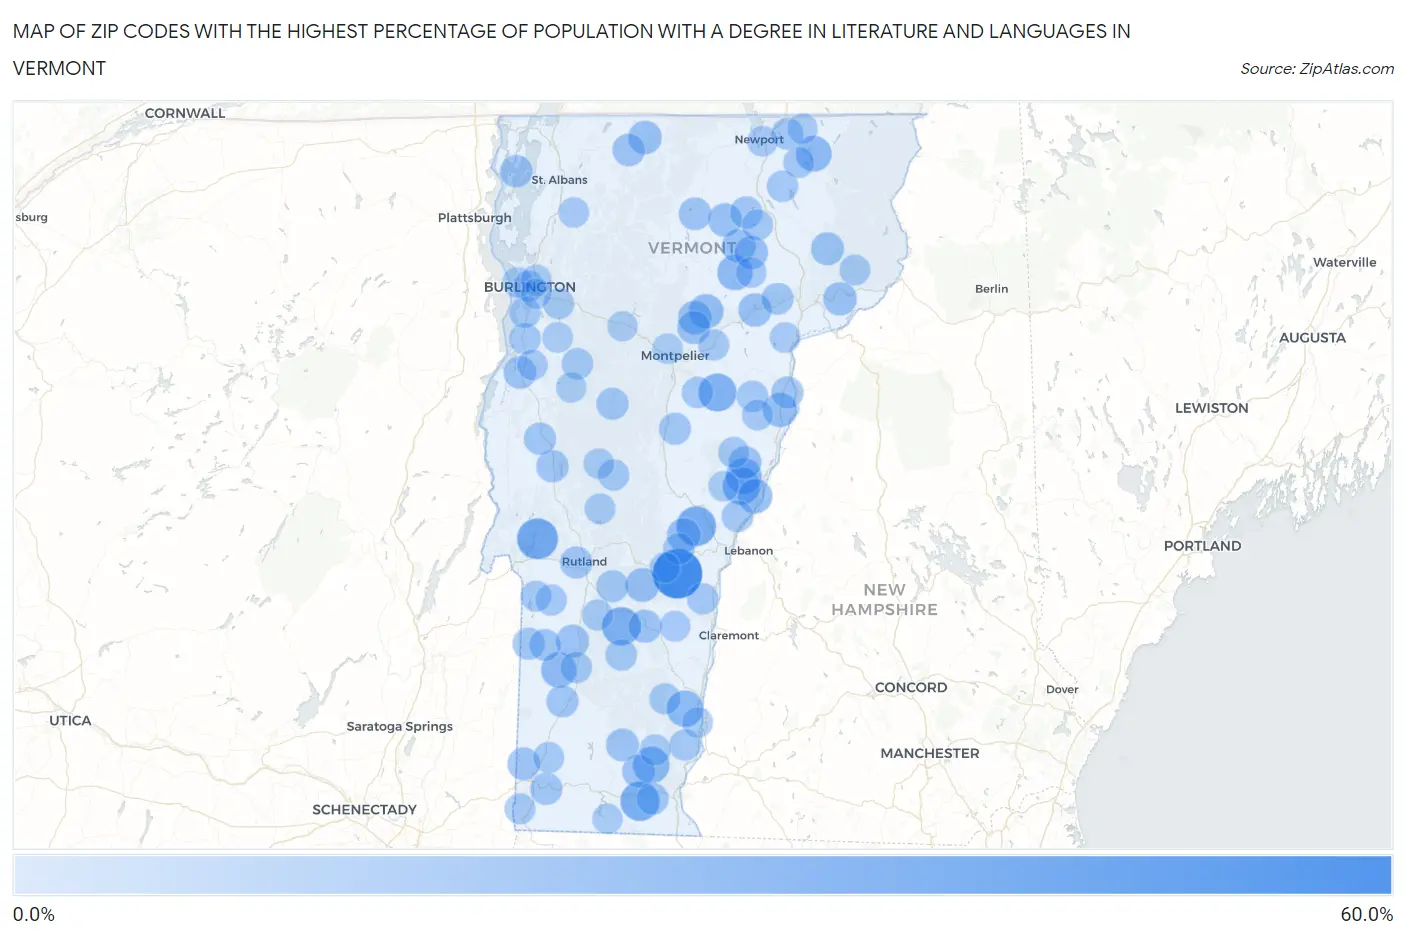
Map of Zip Codes with the Highest Percentage of Population with a Degree in Literature and Languages in Vermont
0.0%
60.0%
Zip Codes with the Highest Percentage of Population with a Degree in Literature and Languages in Vermont
| Zip Code | % Graduates | vs State | vs National | |
| 1. | 05071 | 54.3% | 8.2%(+46.2)#1 | 4.4%(+49.9)#49 |
| 2. | 05732 | 33.1% | 8.2%(+24.9)#2 | 4.4%(+28.7)#173 |
| 3. | 05053 | 30.4% | 8.2%(+22.2)#3 | 4.4%(+26.0)#199 |
| 4. | 05344 | 29.4% | 8.2%(+21.2)#4 | 4.4%(+25.0)#207 |
| 5. | 05730 | 27.6% | 8.2%(+19.5)#5 | 4.4%(+23.2)#240 |
| 6. | 05649 | 26.2% | 8.2%(+18.0)#6 | 4.4%(+21.7)#278 |
| 7. | 05075 | 23.9% | 8.2%(+15.8)#7 | 4.4%(+19.5)#336 |
| 8. | 05362 | 23.1% | 8.2%(+14.9)#8 | 4.4%(+18.7)#359 |
| 9. | 05154 | 22.4% | 8.2%(+14.3)#9 | 4.4%(+18.0)#376 |
| 10. | 05058 | 21.4% | 8.2%(+13.3)#10 | 4.4%(+17.0)#422 |
| 11. | 05853 | 21.1% | 8.2%(+12.9)#11 | 4.4%(+16.6)#431 |
| 12. | 05843 | 20.0% | 8.2%(+11.8)#12 | 4.4%(+15.6)#468 |
| 13. | 05251 | 20.0% | 8.2%(+11.8)#13 | 4.4%(+15.6)#469 |
| 14. | 05043 | 17.9% | 8.2%(+9.77)#14 | 4.4%(+13.5)#580 |
| 15. | 05650 | 17.9% | 8.2%(+9.72)#15 | 4.4%(+13.5)#582 |
| 16. | 05051 | 17.5% | 8.2%(+9.30)#16 | 4.4%(+13.1)#604 |
| 17. | 05056 | 16.6% | 8.2%(+8.42)#17 | 4.4%(+12.2)#663 |
| 18. | 05841 | 16.4% | 8.2%(+8.25)#18 | 4.4%(+12.0)#677 |
| 19. | 05067 | 16.1% | 8.2%(+7.94)#19 | 4.4%(+11.7)#714 |
| 20. | 05648 | 15.9% | 8.2%(+7.75)#20 | 4.4%(+11.5)#730 |
| 21. | 05827 | 15.9% | 8.2%(+7.72)#21 | 4.4%(+11.5)#735 |
| 22. | 05447 | 15.8% | 8.2%(+7.63)#22 | 4.4%(+11.4)#745 |
| 23. | 05824 | 15.8% | 8.2%(+7.59)#23 | 4.4%(+11.3)#747 |
| 24. | 05842 | 15.6% | 8.2%(+7.41)#24 | 4.4%(+11.2)#764 |
| 25. | 05873 | 15.2% | 8.2%(+7.07)#25 | 4.4%(+10.8)#797 |
| 26. | 05640 | 14.8% | 8.2%(+6.65)#26 | 4.4%(+10.4)#834 |
| 27. | 05739 | 14.8% | 8.2%(+6.64)#27 | 4.4%(+10.4)#836 |
| 28. | 05351 | 14.7% | 8.2%(+6.52)#28 | 4.4%(+10.3)#848 |
| 29. | 05149 | 14.5% | 8.2%(+6.33)#29 | 4.4%(+10.1)#875 |
| 30. | 05832 | 14.4% | 8.2%(+6.26)#30 | 4.4%(+10.0)#880 |
| 31. | 05355 | 14.0% | 8.2%(+5.86)#31 | 4.4%(+9.61)#925 |
| 32. | 05456 | 13.9% | 8.2%(+5.71)#32 | 4.4%(+9.46)#939 |
| 33. | 05083 | 13.8% | 8.2%(+5.63)#33 | 4.4%(+9.38)#944 |
| 34. | 05653 | 13.6% | 8.2%(+5.47)#34 | 4.4%(+9.23)#958 |
| 35. | 05257 | 13.5% | 8.2%(+5.35)#35 | 4.4%(+9.10)#978 |
| 36. | 05450 | 13.3% | 8.2%(+5.14)#36 | 4.4%(+8.89)#1,012 |
| 37. | 05474 | 13.2% | 8.2%(+5.04)#37 | 4.4%(+8.79)#1,023 |
| 38. | 05875 | 13.2% | 8.2%(+5.03)#38 | 4.4%(+8.78)#1,024 |
| 39. | 05769 | 13.0% | 8.2%(+4.88)#39 | 4.4%(+8.63)#1,040 |
| 40. | 05736 | 12.8% | 8.2%(+4.66)#40 | 4.4%(+8.41)#1,078 |
| 41. | 05753 | 12.8% | 8.2%(+4.63)#41 | 4.4%(+8.38)#1,083 |
| 42. | 05201 | 12.7% | 8.2%(+4.56)#42 | 4.4%(+8.31)#1,091 |
| 43. | 05775 | 12.7% | 8.2%(+4.54)#43 | 4.4%(+8.29)#1,099 |
| 44. | 05674 | 12.5% | 8.2%(+4.35)#44 | 4.4%(+8.10)#1,137 |
| 45. | 05828 | 12.5% | 8.2%(+4.34)#45 | 4.4%(+8.09)#1,139 |
| 46. | 05254 | 12.4% | 8.2%(+4.28)#46 | 4.4%(+8.04)#1,152 |
| 47. | 05081 | 12.4% | 8.2%(+4.21)#47 | 4.4%(+7.96)#1,160 |
| 48. | 05738 | 12.2% | 8.2%(+4.05)#48 | 4.4%(+7.80)#1,191 |
| 49. | 05301 | 12.1% | 8.2%(+3.98)#49 | 4.4%(+7.73)#1,194 |
| 50. | 05036 | 12.1% | 8.2%(+3.96)#50 | 4.4%(+7.71)#1,198 |
| 51. | 05829 | 11.7% | 8.2%(+3.57)#51 | 4.4%(+7.32)#1,274 |
| 52. | 05761 | 11.6% | 8.2%(+3.43)#52 | 4.4%(+7.19)#1,313 |
| 53. | 05055 | 11.3% | 8.2%(+3.09)#53 | 4.4%(+6.84)#1,395 |
| 54. | 05076 | 11.1% | 8.2%(+2.95)#54 | 4.4%(+6.70)#1,436 |
| 55. | 05161 | 11.1% | 8.2%(+2.92)#55 | 4.4%(+6.67)#1,452 |
| 56. | 05253 | 11.0% | 8.2%(+2.88)#56 | 4.4%(+6.64)#1,461 |
| 57. | 05654 | 11.0% | 8.2%(+2.82)#57 | 4.4%(+6.58)#1,480 |
| 58. | 05089 | 10.8% | 8.2%(+2.62)#58 | 4.4%(+6.38)#1,530 |
| 59. | 05445 | 10.7% | 8.2%(+2.57)#59 | 4.4%(+6.32)#1,548 |
| 60. | 05487 | 10.7% | 8.2%(+2.52)#60 | 4.4%(+6.27)#1,563 |
| 61. | 05346 | 10.6% | 8.2%(+2.39)#61 | 4.4%(+6.14)#1,610 |
| 62. | 05091 | 10.5% | 8.2%(+2.37)#62 | 4.4%(+6.12)#1,618 |
| 63. | 05482 | 10.5% | 8.2%(+2.36)#63 | 4.4%(+6.11)#1,632 |
| 64. | 05767 | 10.5% | 8.2%(+2.33)#64 | 4.4%(+6.09)#1,638 |
| 65. | 05860 | 10.5% | 8.2%(+2.33)#65 | 4.4%(+6.08)#1,642 |
| 66. | 05401 | 10.4% | 8.2%(+2.22)#66 | 4.4%(+5.97)#1,681 |
| 67. | 05757 | 10.4% | 8.2%(+2.21)#67 | 4.4%(+5.96)#1,687 |
| 68. | 05146 | 10.4% | 8.2%(+2.20)#68 | 4.4%(+5.95)#1,691 |
| 69. | 05345 | 10.4% | 8.2%(+2.19)#69 | 4.4%(+5.94)#1,693 |
| 70. | 05839 | 10.1% | 8.2%(+1.92)#70 | 4.4%(+5.68)#1,785 |
| 71. | 05079 | 10.0% | 8.2%(+1.88)#71 | 4.4%(+5.63)#1,800 |
| 72. | 05764 | 10.0% | 8.2%(+1.80)#72 | 4.4%(+5.55)#1,848 |
| 73. | 05667 | 9.9% | 8.2%(+1.69)#73 | 4.4%(+5.45)#1,891 |
| 74. | 05262 | 9.7% | 8.2%(+1.53)#74 | 4.4%(+5.29)#1,957 |
| 75. | 05742 | 9.7% | 8.2%(+1.53)#75 | 4.4%(+5.28)#1,958 |
| 76. | 05495 | 9.6% | 8.2%(+1.46)#76 | 4.4%(+5.22)#1,987 |
| 77. | 05040 | 9.6% | 8.2%(+1.42)#77 | 4.4%(+5.17)#2,005 |
| 78. | 05872 | 9.5% | 8.2%(+1.36)#78 | 4.4%(+5.11)#2,027 |
| 79. | 05260 | 9.5% | 8.2%(+1.36)#79 | 4.4%(+5.11)#2,033 |
| 80. | 05737 | 9.5% | 8.2%(+1.33)#80 | 4.4%(+5.08)#2,047 |
| 81. | 05142 | 9.5% | 8.2%(+1.30)#81 | 4.4%(+5.06)#2,061 |
| 82. | 05408 | 9.4% | 8.2%(+1.23)#82 | 4.4%(+4.98)#2,094 |
| 83. | 05404 | 9.4% | 8.2%(+1.19)#83 | 4.4%(+4.94)#2,119 |
| 84. | 05158 | 9.3% | 8.2%(+1.14)#84 | 4.4%(+4.89)#2,143 |
| 85. | 05858 | 9.2% | 8.2%(+1.07)#85 | 4.4%(+4.82)#2,190 |
| 86. | 05461 | 9.1% | 8.2%(+0.893)#86 | 4.4%(+4.65)#2,293 |
| 87. | 05821 | 9.0% | 8.2%(+0.869)#87 | 4.4%(+4.62)#2,302 |
| 88. | 05473 | 8.9% | 8.2%(+0.765)#88 | 4.4%(+4.52)#2,359 |
| 89. | 05454 | 8.9% | 8.2%(+0.733)#89 | 4.4%(+4.49)#2,377 |
| 90. | 05748 | 8.8% | 8.2%(+0.686)#90 | 4.4%(+4.44)#2,397 |
| 91. | 05034 | 8.8% | 8.2%(+0.609)#91 | 4.4%(+4.36)#2,432 |
| 92. | 05855 | 8.8% | 8.2%(+0.590)#92 | 4.4%(+4.34)#2,441 |
| 93. | 05836 | 8.7% | 8.2%(+0.532)#93 | 4.4%(+4.29)#2,482 |
| 94. | 05602 | 8.7% | 8.2%(+0.527)#94 | 4.4%(+4.28)#2,495 |
| 95. | 05070 | 8.7% | 8.2%(+0.490)#95 | 4.4%(+4.24)#2,512 |
| 96. | 05443 | 8.6% | 8.2%(+0.432)#96 | 4.4%(+4.19)#2,547 |
| 97. | 05830 | 8.6% | 8.2%(+0.416)#97 | 4.4%(+4.17)#2,557 |
| 98. | 05403 | 8.4% | 8.2%(+0.283)#98 | 4.4%(+4.04)#2,650 |
| 99. | 05676 | 8.2% | 8.2%(+0.017)#99 | 4.4%(+3.77)#2,840 |
| 100. | 05361 | 8.1% | 8.2%(-0.033)#100 | 4.4%(+3.72)#2,877 |
Common Questions
What are the Top 10 Zip Codes with the Highest Percentage of Population with a Degree in Literature and Languages in Vermont?
Top 10 Zip Codes with the Highest Percentage of Population with a Degree in Literature and Languages in Vermont are:
What zip code has the Highest Percentage of Population with a Degree in Literature and Languages in Vermont?
05071 has the Highest Percentage of Population with a Degree in Literature and Languages in Vermont with 54.3%.
What is the Percentage of Population with a Degree in Literature and Languages in the State of Vermont?
Percentage of Population with a Degree in Literature and Languages in Vermont is 8.2%.
What is the Percentage of Population with a Degree in Literature and Languages in the United States?
Percentage of Population with a Degree in Literature and Languages in the United States is 4.4%.