La Paloma Lost Creek, TX Map & Demographics
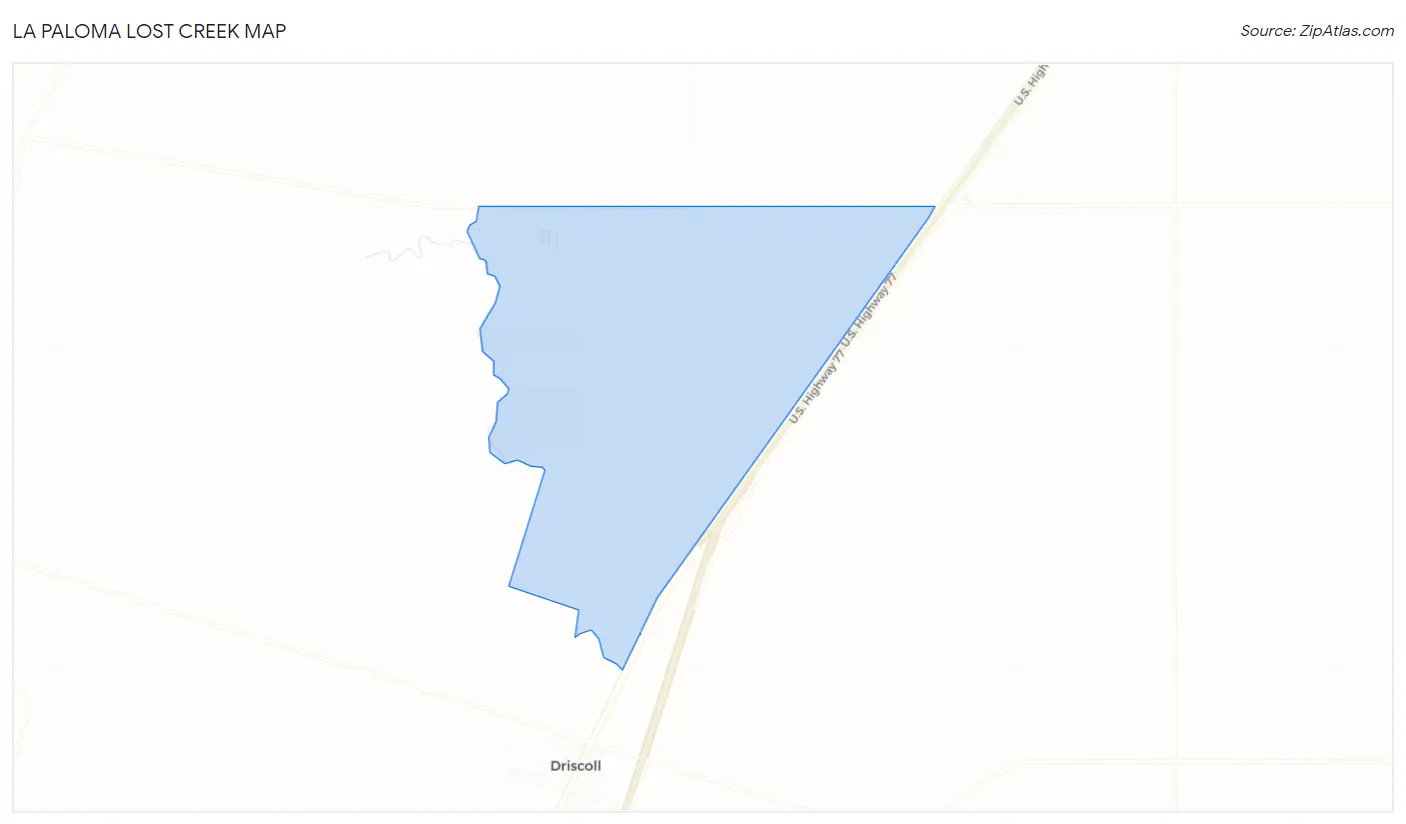
La Paloma Lost Creek Map
La Paloma Lost Creek Overview
$22,179
PER CAPITA INCOME
$2,499
AVG HOUSEHOLD INCOME
4.8%
WAGE / INCOME GAP [ % ]
95.2¢/ $1
WAGE / INCOME GAP [ $ ]
0.75
INEQUALITY / GINI INDEX
621
TOTAL POPULATION
280
MALE POPULATION
341
FEMALE POPULATION
82.11
MALES / 100 FEMALES
121.79
FEMALES / 100 MALES
44.5
MEDIAN AGE
4.6
AVG FAMILY SIZE
2.1
AVG HOUSEHOLD SIZE
236
LABOR FORCE [ PEOPLE ]
43.9%
PERCENT IN LABOR FORCE
3.8%
UNEMPLOYMENT RATE
Income in La Paloma Lost Creek
Income Overview in La Paloma Lost Creek
| Characteristic | Number | Measure |
| Per Capita Income | 621 | $22,179 |
| Median Family Income | 84 | $0 |
| Mean Family Income | 84 | $124,073 |
| Median Household Income | 283 | $2,499 |
| Mean Household Income | 283 | $45,792 |
| Income Deficit | 84 | $0 |
| Wage / Income Gap (%) | 621 | 4.84% |
| Wage / Income Gap ($) | 621 | 95.16¢ per $1 |
| Gini / Inequality Index | 621 | 0.75 |
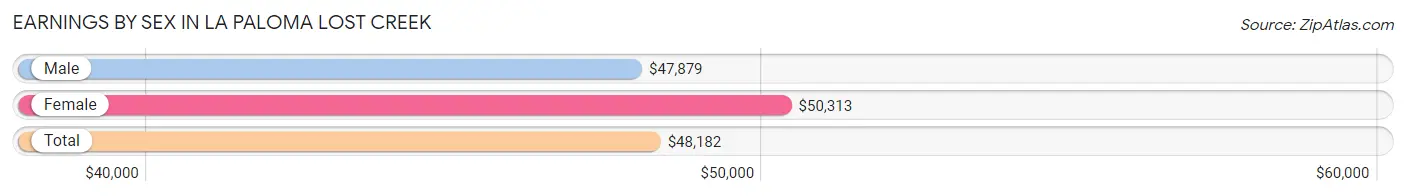
Earnings by Sex in La Paloma Lost Creek
Average Earnings in La Paloma Lost Creek are $48,182, $47,879 for men and $50,313 for women, a difference of 4.8%.
| Sex | Number | Average Earnings |
| Male | 154 (65.2%) | $47,879 |
| Female | 82 (34.7%) | $50,313 |
| Total | 236 (100.0%) | $48,182 |
Earnings by Sex by Income Bracket in La Paloma Lost Creek
The most common earnings brackets in La Paloma Lost Creek are $45,000 to $49,999 for men (33 | 21.4%) and $50,000 to $54,999 for women (32 | 39.0%).
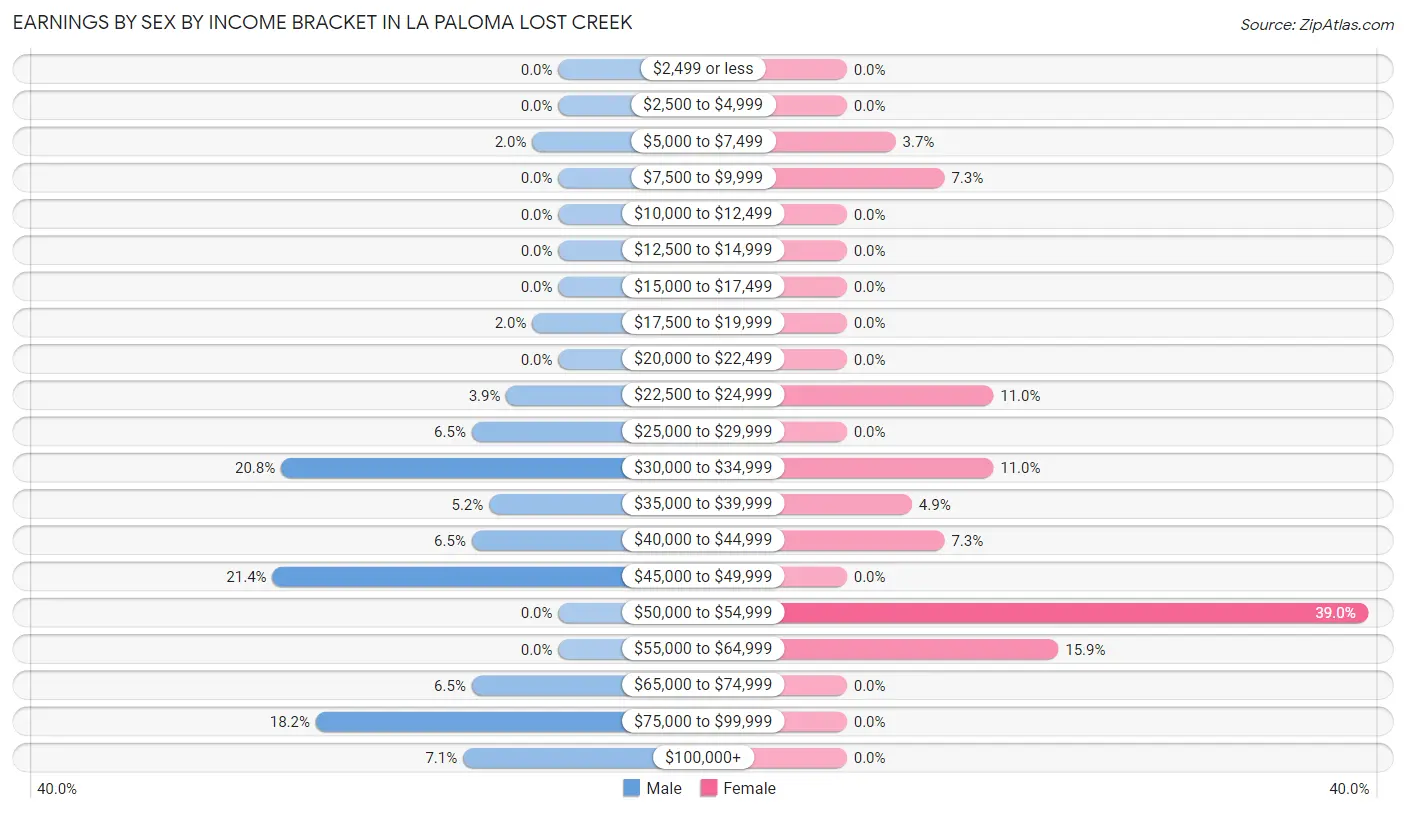
| Income | Male | Female |
| $2,499 or less | 0 (0.0%) | 0 (0.0%) |
| $2,500 to $4,999 | 0 (0.0%) | 0 (0.0%) |
| $5,000 to $7,499 | 3 (1.9%) | 3 (3.7%) |
| $7,500 to $9,999 | 0 (0.0%) | 6 (7.3%) |
| $10,000 to $12,499 | 0 (0.0%) | 0 (0.0%) |
| $12,500 to $14,999 | 0 (0.0%) | 0 (0.0%) |
| $15,000 to $17,499 | 0 (0.0%) | 0 (0.0%) |
| $17,500 to $19,999 | 3 (1.9%) | 0 (0.0%) |
| $20,000 to $22,499 | 0 (0.0%) | 0 (0.0%) |
| $22,500 to $24,999 | 6 (3.9%) | 9 (11.0%) |
| $25,000 to $29,999 | 10 (6.5%) | 0 (0.0%) |
| $30,000 to $34,999 | 32 (20.8%) | 9 (11.0%) |
| $35,000 to $39,999 | 8 (5.2%) | 4 (4.9%) |
| $40,000 to $44,999 | 10 (6.5%) | 6 (7.3%) |
| $45,000 to $49,999 | 33 (21.4%) | 0 (0.0%) |
| $50,000 to $54,999 | 0 (0.0%) | 32 (39.0%) |
| $55,000 to $64,999 | 0 (0.0%) | 13 (15.9%) |
| $65,000 to $74,999 | 10 (6.5%) | 0 (0.0%) |
| $75,000 to $99,999 | 28 (18.2%) | 0 (0.0%) |
| $100,000+ | 11 (7.1%) | 0 (0.0%) |
| Total | 154 (100.0%) | 82 (100.0%) |
Earnings by Sex by Educational Attainment in La Paloma Lost Creek
Average earnings in La Paloma Lost Creek are $47,879 for men and $50,469 for women, a difference of 5.1%. Men with an educational attainment of high school diploma enjoy the highest average annual earnings of $48,220, while those with high school diploma education earn the least with $48,220. Women with an educational attainment of high school diploma earn the most with the average annual earnings of $50,820, while those with high school diploma education have the smallest earnings of $50,820.
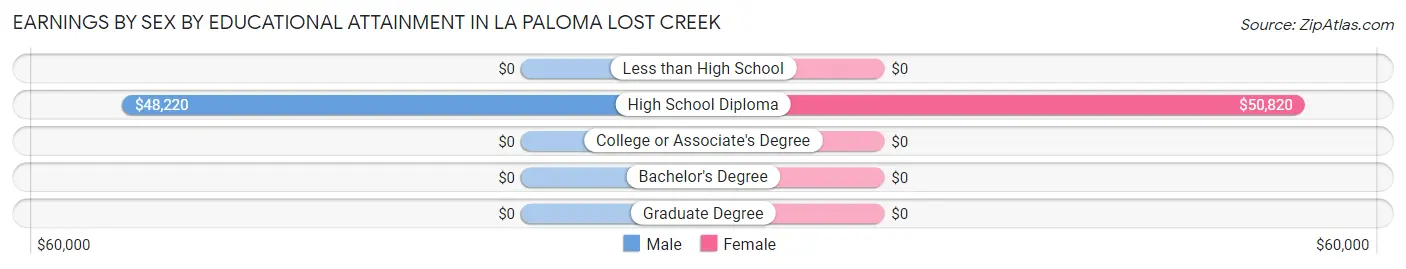
| Educational Attainment | Male Income | Female Income |
| Less than High School | - | - |
| High School Diploma | $48,220 | $50,820 |
| College or Associate's Degree | - | - |
| Bachelor's Degree | - | - |
| Graduate Degree | - | - |
| Total | $47,879 | $50,469 |
Family Income in La Paloma Lost Creek
Family Income Brackets in La Paloma Lost Creek
According to the La Paloma Lost Creek family income data, there are 28 families falling into the $200,000+ income range, which is the most common income bracket and makes up 33.3% of all families.
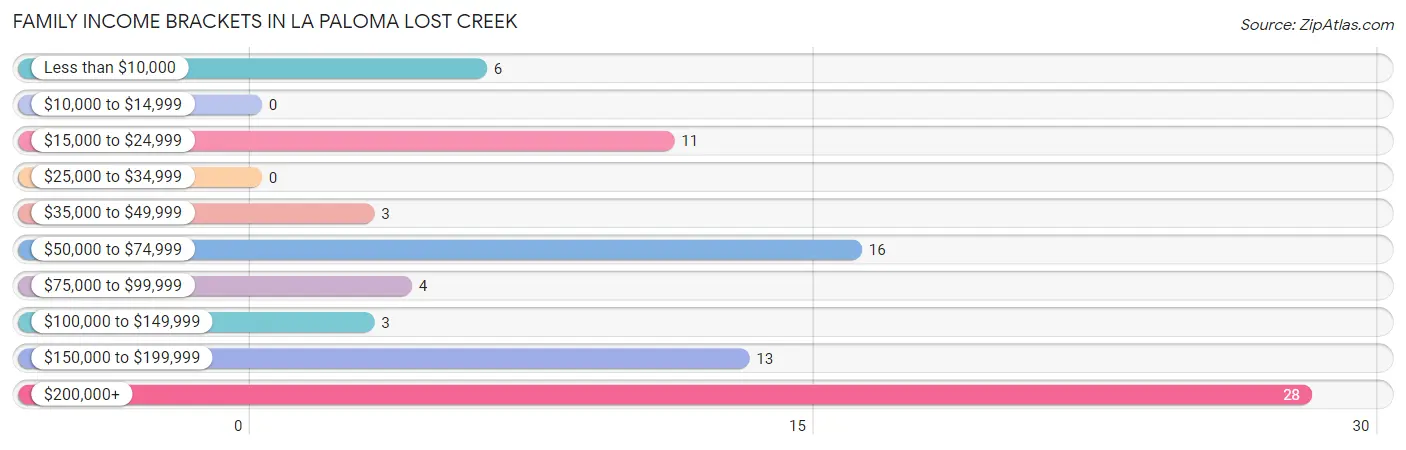
| Income Bracket | # Families | % Families |
| Less than $10,000 | 6 | 7.1% |
| $10,000 to $14,999 | 0 | 0.0% |
| $15,000 to $24,999 | 11 | 13.1% |
| $25,000 to $34,999 | 0 | 0.0% |
| $35,000 to $49,999 | 3 | 3.6% |
| $50,000 to $74,999 | 16 | 19.0% |
| $75,000 to $99,999 | 4 | 4.8% |
| $100,000 to $149,999 | 3 | 3.6% |
| $150,000 to $199,999 | 13 | 15.5% |
| $200,000+ | 28 | 33.3% |
Family Income by Famaliy Size in La Paloma Lost Creek
| Income Bracket | # Families | Median Income |
| 2-Person Families | 40 (47.6%) | $0 |
| 3-Person Families | 3 (3.6%) | $0 |
| 4-Person Families | 10 (11.9%) | $0 |
| 5-Person Families | 0 (0.0%) | $0 |
| 6-Person Families | 3 (3.6%) | $0 |
| 7+ Person Families | 28 (33.3%) | $0 |
| Total | 84 (100.0%) | $0 |
Family Income by Number of Earners in La Paloma Lost Creek
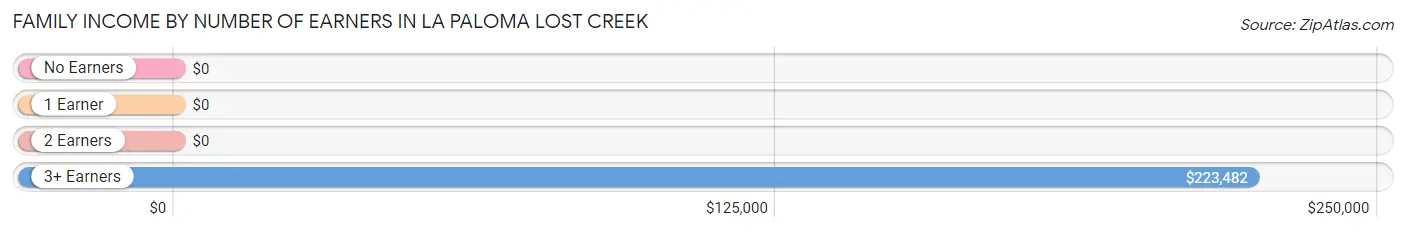
| Number of Earners | # Families | Median Income |
| No Earners | 11 (13.1%) | $0 |
| 1 Earner | 12 (14.3%) | $0 |
| 2 Earners | 27 (32.1%) | $0 |
| 3+ Earners | 34 (40.5%) | $223,482 |
| Total | 84 (100.0%) | $0 |
Household Income in La Paloma Lost Creek
Household Income Brackets in La Paloma Lost Creek
With 169 households falling in the category, the less than $10,000 income range is the most frequent in La Paloma Lost Creek, accounting for 59.7% of all households.
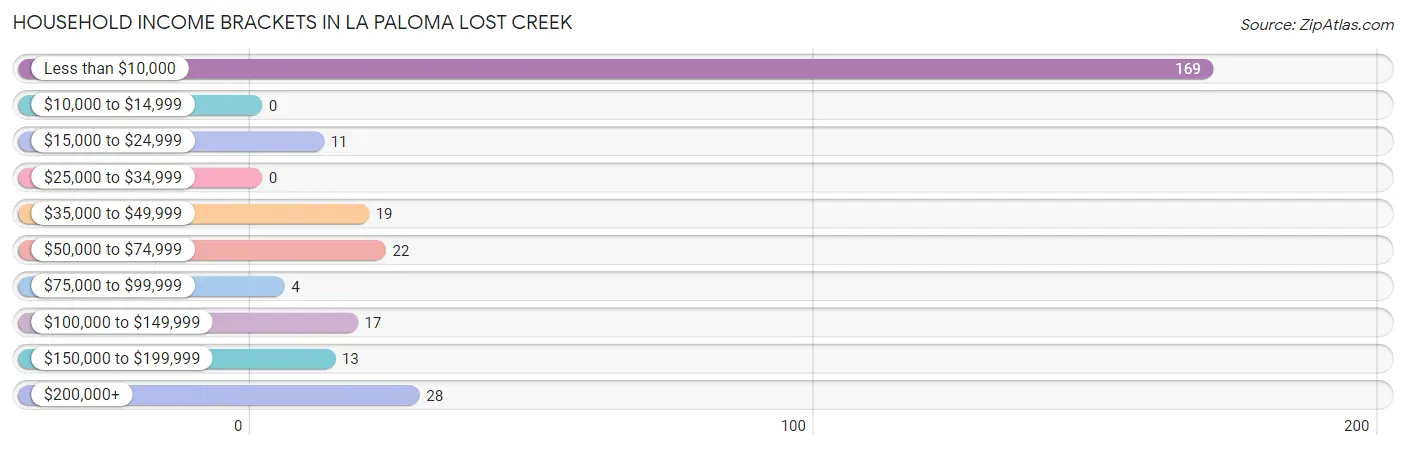
| Income Bracket | # Households | % Households |
| Less than $10,000 | 169 | 59.7% |
| $10,000 to $14,999 | 0 | 0.0% |
| $15,000 to $24,999 | 11 | 3.9% |
| $25,000 to $34,999 | 0 | 0.0% |
| $35,000 to $49,999 | 19 | 6.7% |
| $50,000 to $74,999 | 22 | 7.8% |
| $75,000 to $99,999 | 4 | 1.4% |
| $100,000 to $149,999 | 17 | 6.0% |
| $150,000 to $199,999 | 13 | 4.6% |
| $200,000+ | 28 | 9.9% |
Household Income by Householder Age in La Paloma Lost Creek
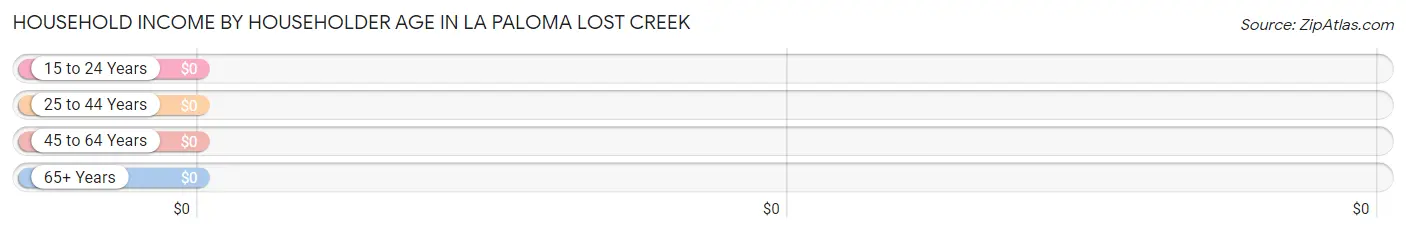
| Income Bracket | # Households | Median Income |
| 15 to 24 Years | 0 (0.0%) | $0 |
| 25 to 44 Years | 182 (64.3%) | $0 |
| 45 to 64 Years | 76 (26.9%) | $0 |
| 65+ Years | 25 (8.8%) | $0 |
| Total | 283 (100.0%) | $2,499 |
Poverty in La Paloma Lost Creek
Income Below Poverty by Sex and Age in La Paloma Lost Creek
With 5.5% poverty level for males and 59.5% for females among the residents of La Paloma Lost Creek, 65 to 74 year old males and 25 to 34 year old females are the most vulnerable to poverty, with 14 males (50.0%) and 169 females (97.1%) in their respective age groups living below the poverty level.
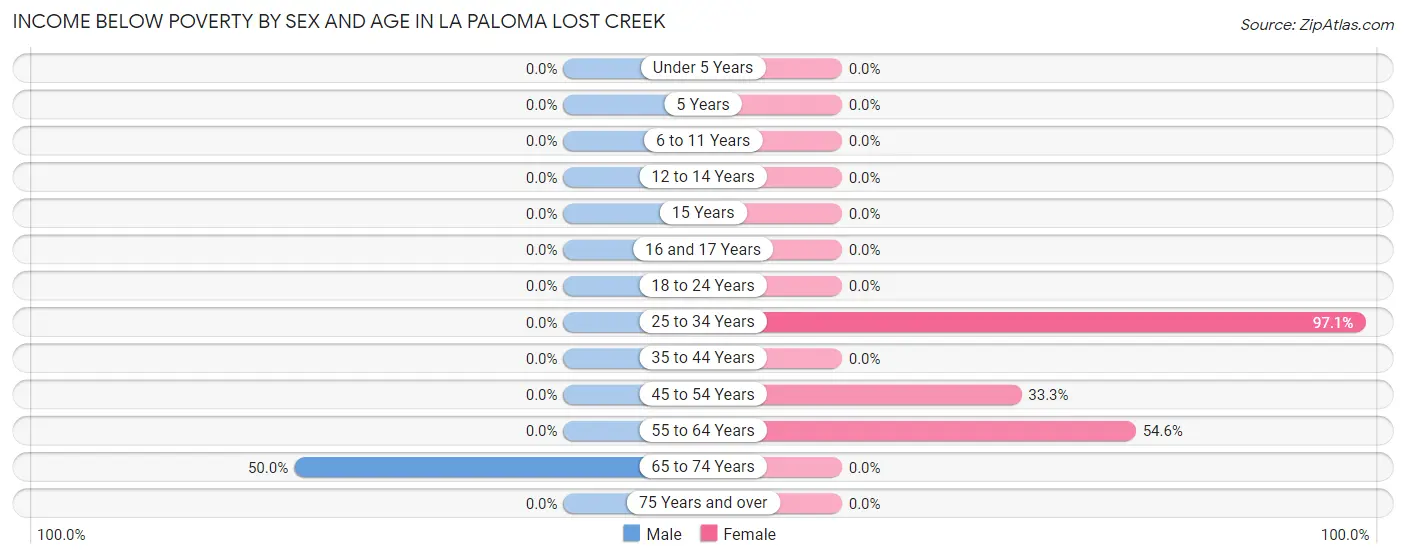
| Age Bracket | Male | Female |
| Under 5 Years | 0 (0.0%) | 0 (0.0%) |
| 5 Years | 0 (0.0%) | 0 (0.0%) |
| 6 to 11 Years | 0 (0.0%) | 0 (0.0%) |
| 12 to 14 Years | 0 (0.0%) | 0 (0.0%) |
| 15 Years | 0 (0.0%) | 0 (0.0%) |
| 16 and 17 Years | 0 (0.0%) | 0 (0.0%) |
| 18 to 24 Years | 0 (0.0%) | 0 (0.0%) |
| 25 to 34 Years | 0 (0.0%) | 169 (97.1%) |
| 35 to 44 Years | 0 (0.0%) | 0 (0.0%) |
| 45 to 54 Years | 0 (0.0%) | 22 (33.3%) |
| 55 to 64 Years | 0 (0.0%) | 12 (54.5%) |
| 65 to 74 Years | 14 (50.0%) | 0 (0.0%) |
| 75 Years and over | 0 (0.0%) | 0 (0.0%) |
| Total | 14 (5.5%) | 203 (59.5%) |
Income Above Poverty by Sex and Age in La Paloma Lost Creek
According to the poverty statistics in La Paloma Lost Creek, males aged 12 to 14 years and females aged 6 to 11 years are the age groups that are most secure financially, with 100.0% of males and 100.0% of females in these age groups living above the poverty line.
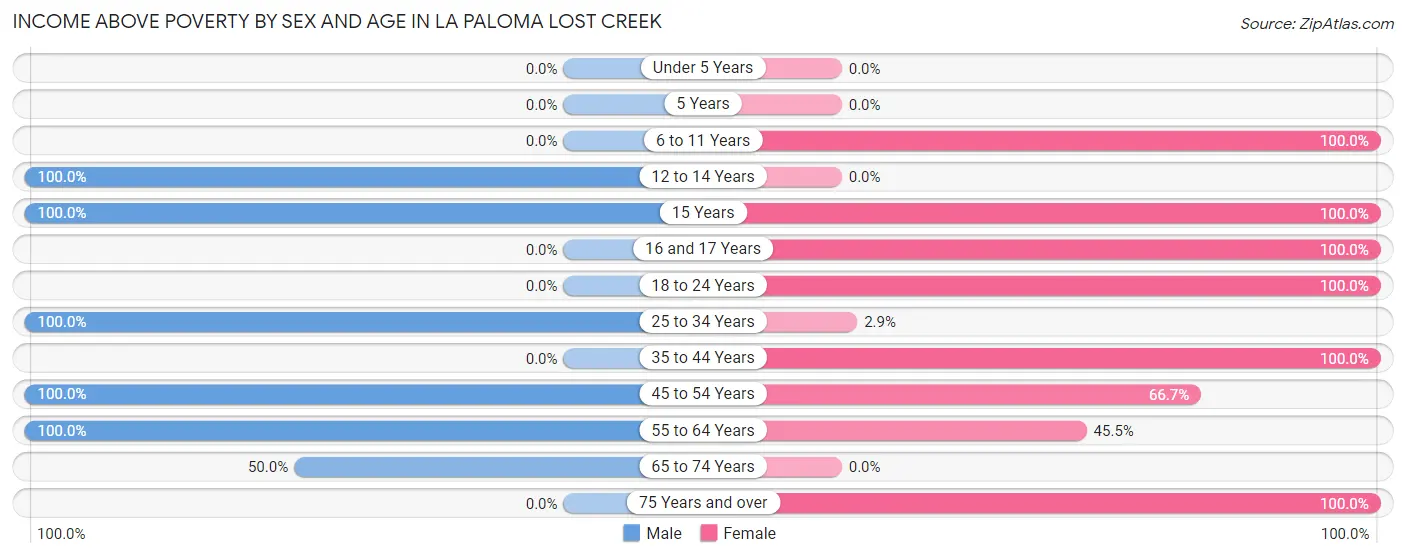
| Age Bracket | Male | Female |
| Under 5 Years | 0 (0.0%) | 0 (0.0%) |
| 5 Years | 0 (0.0%) | 0 (0.0%) |
| 6 to 11 Years | 0 (0.0%) | 8 (100.0%) |
| 12 to 14 Years | 29 (100.0%) | 0 (0.0%) |
| 15 Years | 35 (100.0%) | 12 (100.0%) |
| 16 and 17 Years | 0 (0.0%) | 11 (100.0%) |
| 18 to 24 Years | 0 (0.0%) | 4 (100.0%) |
| 25 to 34 Years | 11 (100.0%) | 5 (2.9%) |
| 35 to 44 Years | 0 (0.0%) | 13 (100.0%) |
| 45 to 54 Years | 125 (100.0%) | 44 (66.7%) |
| 55 to 64 Years | 28 (100.0%) | 10 (45.5%) |
| 65 to 74 Years | 14 (50.0%) | 0 (0.0%) |
| 75 Years and over | 0 (0.0%) | 31 (100.0%) |
| Total | 242 (94.5%) | 138 (40.5%) |
Income Below Poverty Among Married-Couple Families in La Paloma Lost Creek
The poverty statistics for married-couple families in La Paloma Lost Creek show that 23.4% or 11 of the total 47 families live below the poverty line. Families with no children have the highest poverty rate of 29.7%, comprising of 11 families. On the other hand, families with 1 or 2 children have the lowest poverty rate of 0.0%, which includes 0 families.
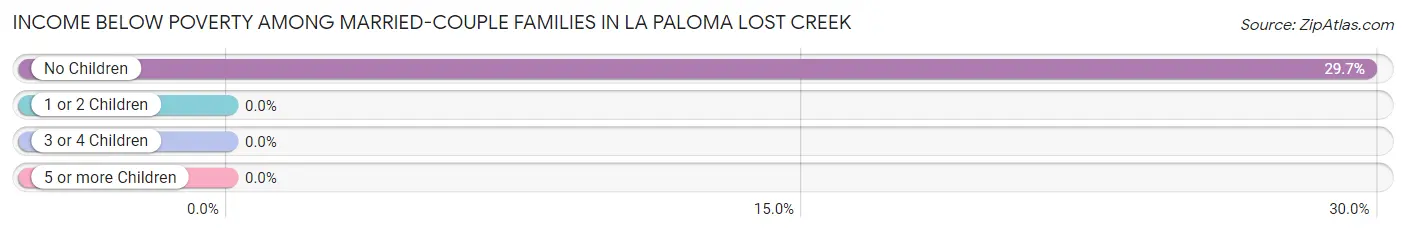
| Children | Above Poverty | Below Poverty |
| No Children | 26 (70.3%) | 11 (29.7%) |
| 1 or 2 Children | 10 (100.0%) | 0 (0.0%) |
| 3 or 4 Children | 0 (0.0%) | 0 (0.0%) |
| 5 or more Children | 0 (0.0%) | 0 (0.0%) |
| Total | 36 (76.6%) | 11 (23.4%) |
Income Below Poverty Among Single-Parent Households in La Paloma Lost Creek
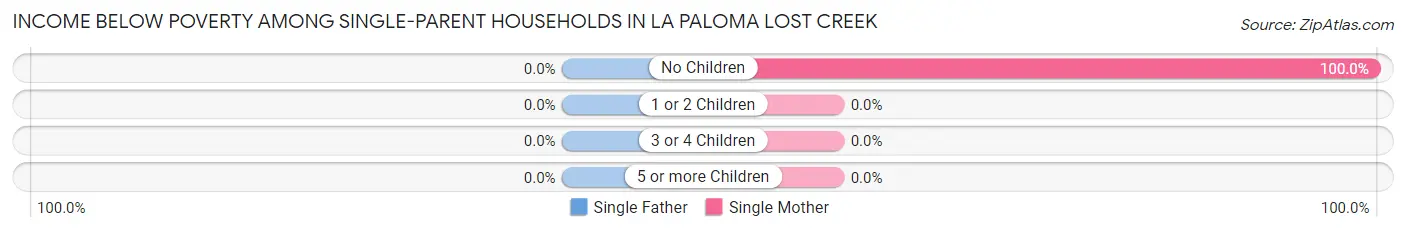
| Children | Single Father | Single Mother |
| No Children | 0 (0.0%) | 6 (100.0%) |
| 1 or 2 Children | 0 (0.0%) | 0 (0.0%) |
| 3 or 4 Children | 0 (0.0%) | 0 (0.0%) |
| 5 or more Children | 0 (0.0%) | 0 (0.0%) |
| Total | 0 (0.0%) | 6 (100.0%) |
Income Below Poverty Among Married-Couple vs Single-Parent Households in La Paloma Lost Creek
The poverty data for La Paloma Lost Creek shows that 11 of the married-couple family households (23.4%) and 6 of the single-parent households (16.2%) are living below the poverty level. Within the married-couple family households, those with no children have the highest poverty rate, with 11 households (29.7%) falling below the poverty line. Among the single-parent households, those with no children have the highest poverty rate, with 6 household (100.0%) living below poverty.
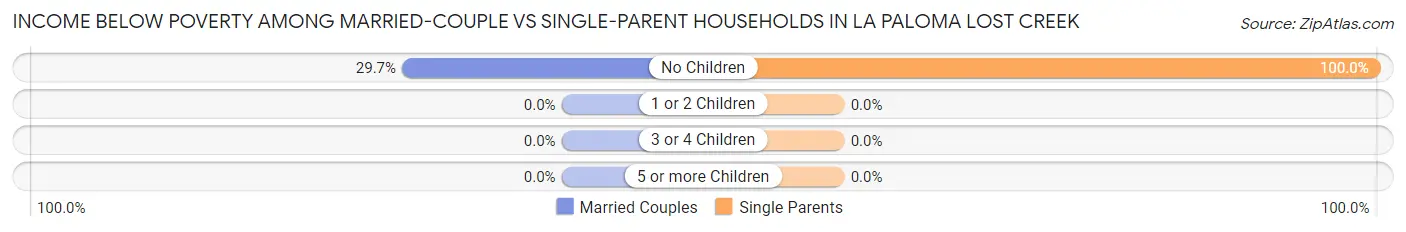
| Children | Married-Couple Families | Single-Parent Households |
| No Children | 11 (29.7%) | 6 (100.0%) |
| 1 or 2 Children | 0 (0.0%) | 0 (0.0%) |
| 3 or 4 Children | 0 (0.0%) | 0 (0.0%) |
| 5 or more Children | 0 (0.0%) | 0 (0.0%) |
| Total | 11 (23.4%) | 6 (16.2%) |
Race in La Paloma Lost Creek
The most populous races in La Paloma Lost Creek are Hispanic or Latino (598 | 96.3%), White / Caucasian (328 | 52.8%), and Two or more Races (279 | 44.9%).
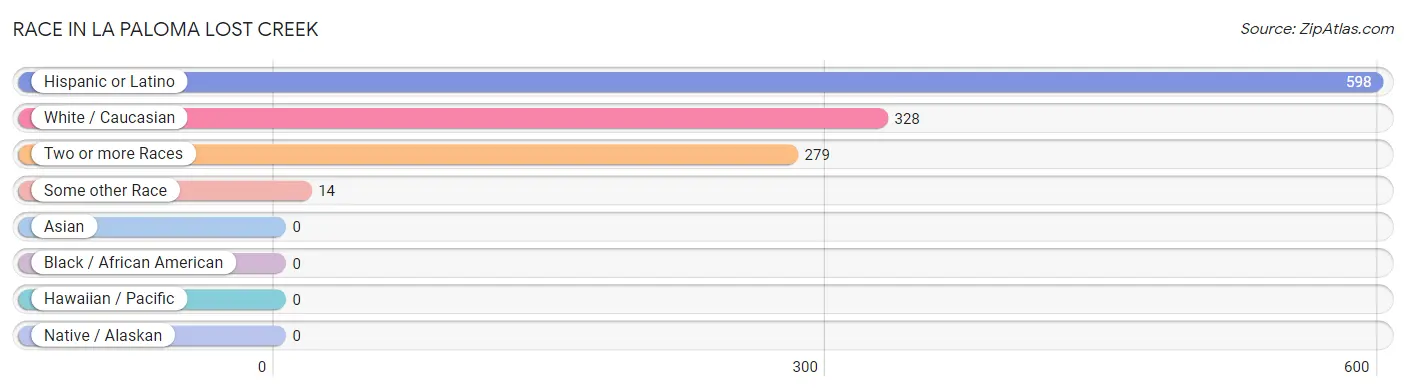
| Race | # Population | % Population |
| Asian | 0 | 0.0% |
| Black / African American | 0 | 0.0% |
| Hawaiian / Pacific | 0 | 0.0% |
| Hispanic or Latino | 598 | 96.3% |
| Native / Alaskan | 0 | 0.0% |
| White / Caucasian | 328 | 52.8% |
| Two or more Races | 279 | 44.9% |
| Some other Race | 14 | 2.2% |
| Total | 621 | 100.0% |
Ancestry in La Paloma Lost Creek
The most populous ancestries reported in La Paloma Lost Creek are Mexican (598 | 96.3%), Dutch (9 | 1.5%), Scottish (9 | 1.5%), English (3 | 0.5%), and German (3 | 0.5%), together accounting for 100.2% of all La Paloma Lost Creek residents.
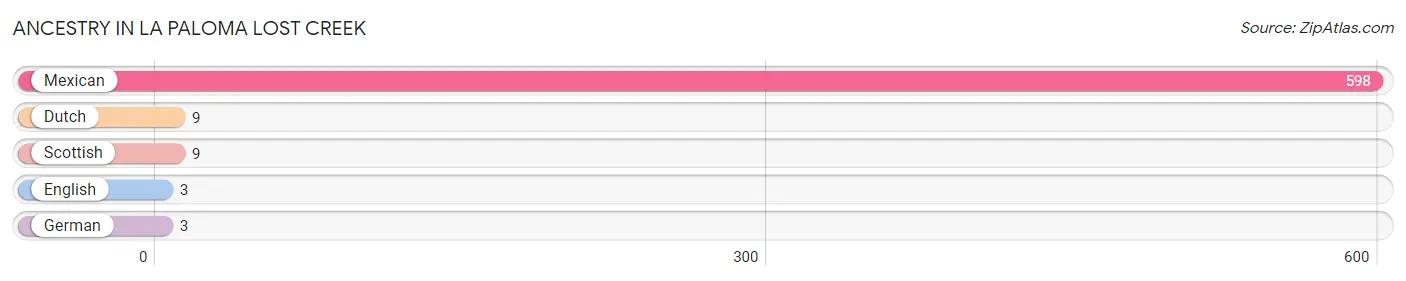
| Ancestry | # Population | % Population |
| Dutch | 9 | 1.5% |
| English | 3 | 0.5% |
| German | 3 | 0.5% |
| Mexican | 598 | 96.3% |
| Scottish | 9 | 1.5% | View All 5 Rows |
Immigrants in La Paloma Lost Creek
The most numerous immigrant groups reported in La Paloma Lost Creek came from Central America (46 | 7.4%), Latin America (46 | 7.4%), and Mexico (46 | 7.4%), together accounting for 22.2% of all La Paloma Lost Creek residents.
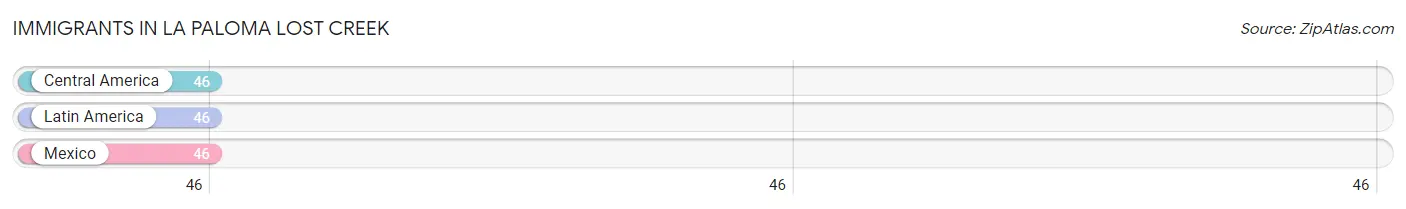
| Immigration Origin | # Population | % Population |
| Central America | 46 | 7.4% |
| Latin America | 46 | 7.4% |
| Mexico | 46 | 7.4% | View All 3 Rows |
Sex and Age in La Paloma Lost Creek
Sex and Age in La Paloma Lost Creek
The most populous age groups in La Paloma Lost Creek are 45 to 49 Years (63 | 22.5%) for men and 25 to 29 Years (174 | 51.0%) for women.
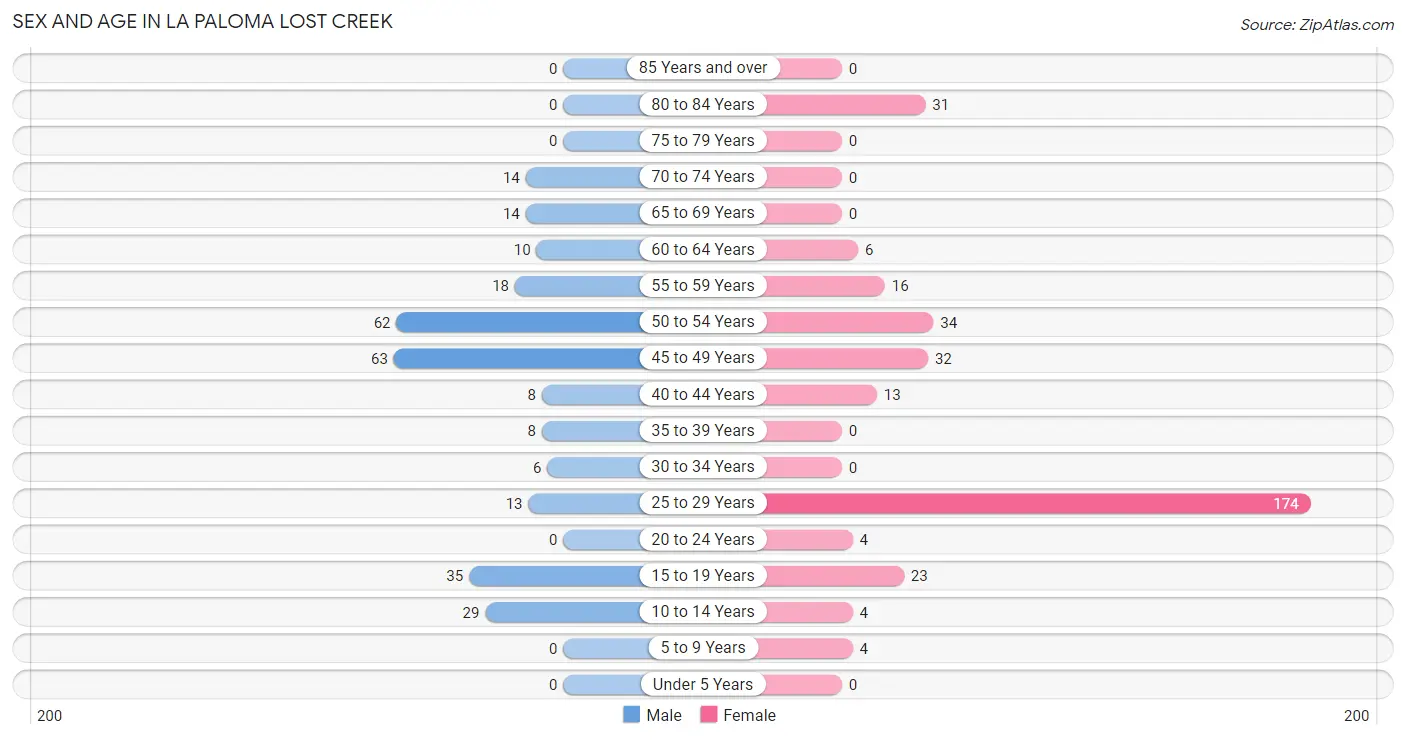
| Age Bracket | Male | Female |
| Under 5 Years | 0 (0.0%) | 0 (0.0%) |
| 5 to 9 Years | 0 (0.0%) | 4 (1.2%) |
| 10 to 14 Years | 29 (10.4%) | 4 (1.2%) |
| 15 to 19 Years | 35 (12.5%) | 23 (6.7%) |
| 20 to 24 Years | 0 (0.0%) | 4 (1.2%) |
| 25 to 29 Years | 13 (4.6%) | 174 (51.0%) |
| 30 to 34 Years | 6 (2.1%) | 0 (0.0%) |
| 35 to 39 Years | 8 (2.9%) | 0 (0.0%) |
| 40 to 44 Years | 8 (2.9%) | 13 (3.8%) |
| 45 to 49 Years | 63 (22.5%) | 32 (9.4%) |
| 50 to 54 Years | 62 (22.1%) | 34 (10.0%) |
| 55 to 59 Years | 18 (6.4%) | 16 (4.7%) |
| 60 to 64 Years | 10 (3.6%) | 6 (1.8%) |
| 65 to 69 Years | 14 (5.0%) | 0 (0.0%) |
| 70 to 74 Years | 14 (5.0%) | 0 (0.0%) |
| 75 to 79 Years | 0 (0.0%) | 0 (0.0%) |
| 80 to 84 Years | 0 (0.0%) | 31 (9.1%) |
| 85 Years and over | 0 (0.0%) | 0 (0.0%) |
| Total | 280 (100.0%) | 341 (100.0%) |
Families and Households in La Paloma Lost Creek
Median Family Size in La Paloma Lost Creek
The median family size in La Paloma Lost Creek is 4.61 persons per family, with single male/father families (31 | 36.9%) accounting for the largest median family size of 7.9 persons per family. On the other hand, single female/mother families (6 | 7.1%) represent the smallest median family size with 2.00 persons per family.
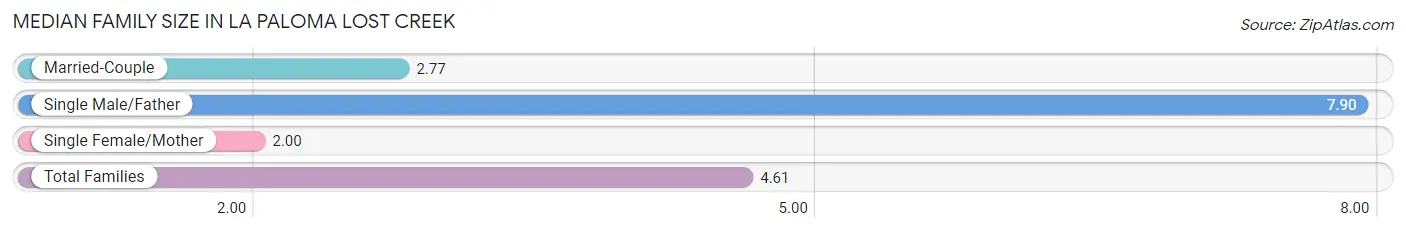
| Family Type | # Families | Family Size |
| Married-Couple | 47 (55.9%) | 2.77 |
| Single Male/Father | 31 (36.9%) | 7.90 |
| Single Female/Mother | 6 (7.1%) | 2.00 |
| Total Families | 84 (100.0%) | 4.61 |
Median Household Size in La Paloma Lost Creek
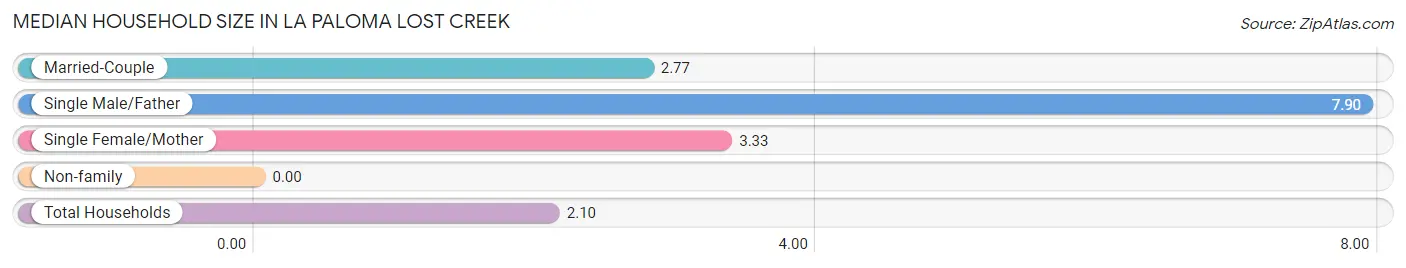
| Household Type | # Households | Household Size |
| Married-Couple | 47 (16.6%) | 2.77 |
| Single Male/Father | 31 (11.0%) | 7.90 |
| Single Female/Mother | 6 (2.1%) | 3.33 |
| Non-family | 199 (70.3%) | - |
| Total Households | 283 (100.0%) | 2.10 |
Household Size by Marriage Status in La Paloma Lost Creek
Out of a total of 283 households in La Paloma Lost Creek, 84 (29.7%) are family households, while 199 (70.3%) are nonfamily households. The most numerous type of family households are 2-person households, comprising 34, and the most common type of nonfamily households are 1-person households, comprising 199.
| Household Size | Family Households | Nonfamily Households |
| 1-Person Households | - | 199 (70.3%) |
| 2-Person Households | 34 (12.0%) | 0 (0.0%) |
| 3-Person Households | 9 (3.2%) | 0 (0.0%) |
| 4-Person Households | 10 (3.5%) | 0 (0.0%) |
| 5-Person Households | 0 (0.0%) | 0 (0.0%) |
| 6-Person Households | 3 (1.1%) | 0 (0.0%) |
| 7+ Person Households | 28 (9.9%) | 0 (0.0%) |
| Total | 84 (29.7%) | 199 (70.3%) |
Female Fertility in La Paloma Lost Creek
Fertility by Age in La Paloma Lost Creek
| Age Bracket | Women with Births | Births / 1,000 Women |
| 15 to 19 years | 0 (0.0%) | 0.0 |
| 20 to 34 years | 0 (0.0%) | 0.0 |
| 35 to 50 years | 0 (0.0%) | 0.0 |
| Total | 0 (0.0%) | 0.0 |
Fertility by Age by Marriage Status in La Paloma Lost Creek
| Age Bracket | Married | Unmarried |
| 15 to 19 years | 0 (0.0%) | 0 (0.0%) |
| 20 to 34 years | 0 (0.0%) | 0 (0.0%) |
| 35 to 50 years | 0 (0.0%) | 0 (0.0%) |
| Total | 0 (0.0%) | 0 (0.0%) |
Fertility by Education in La Paloma Lost Creek
| Educational Attainment | Women with Births | Births / 1,000 Women |
| Less than High School | 0 (0.0%) | 0.0 |
| High School Diploma | 0 (0.0%) | 0.0 |
| College or Associate's Degree | 0 (0.0%) | 0.0 |
| Bachelor's Degree | 0 (0.0%) | 0.0 |
| Graduate Degree | 0 (0.0%) | 0.0 |
| Total | 0 (0.0%) | 0.0 |
Fertility by Education by Marriage Status in La Paloma Lost Creek
| Educational Attainment | Married | Unmarried |
| Less than High School | 0 (0.0%) | 0 (0.0%) |
| High School Diploma | 0 (0.0%) | 0 (0.0%) |
| College or Associate's Degree | 0 (0.0%) | 0 (0.0%) |
| Bachelor's Degree | 0 (0.0%) | 0 (0.0%) |
| Graduate Degree | 0 (0.0%) | 0 (0.0%) |
| Total | 0 (0.0%) | 0 (0.0%) |
Employment Characteristics in La Paloma Lost Creek
Employment by Class of Employer in La Paloma Lost Creek
Among the 227 employed individuals in La Paloma Lost Creek, private company employees (181 | 79.7%), local government employees (17 | 7.5%), and self-employed (not incorporated) (16 | 7.0%) make up the most common classes of employment.
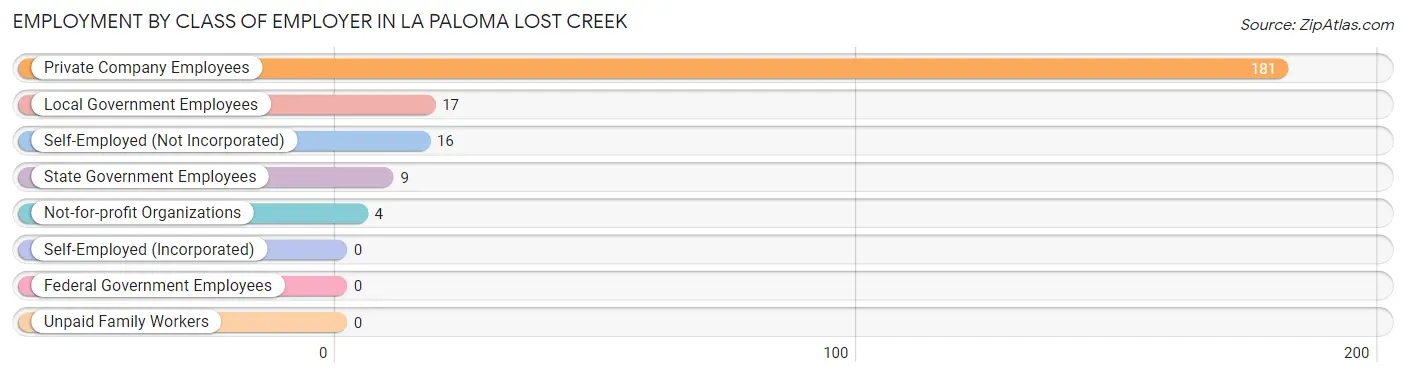
| Employer Class | # Employees | % Employees |
| Private Company Employees | 181 | 79.7% |
| Self-Employed (Incorporated) | 0 | 0.0% |
| Self-Employed (Not Incorporated) | 16 | 7.0% |
| Not-for-profit Organizations | 4 | 1.8% |
| Local Government Employees | 17 | 7.5% |
| State Government Employees | 9 | 4.0% |
| Federal Government Employees | 0 | 0.0% |
| Unpaid Family Workers | 0 | 0.0% |
| Total | 227 | 100.0% |
Employment Status by Age in La Paloma Lost Creek
According to the labor force statistics for La Paloma Lost Creek, out of the total population over 16 years of age (537), 43.9% or 236 individuals are in the labor force, with 3.8% or 9 of them unemployed. The age group with the highest labor force participation rate is 20 to 24 years, with 100.0% or 4 individuals in the labor force. Within the labor force, the 30 to 34 years age range has the highest percentage of unemployed individuals, with 100.0% or 6 of them being unemployed.
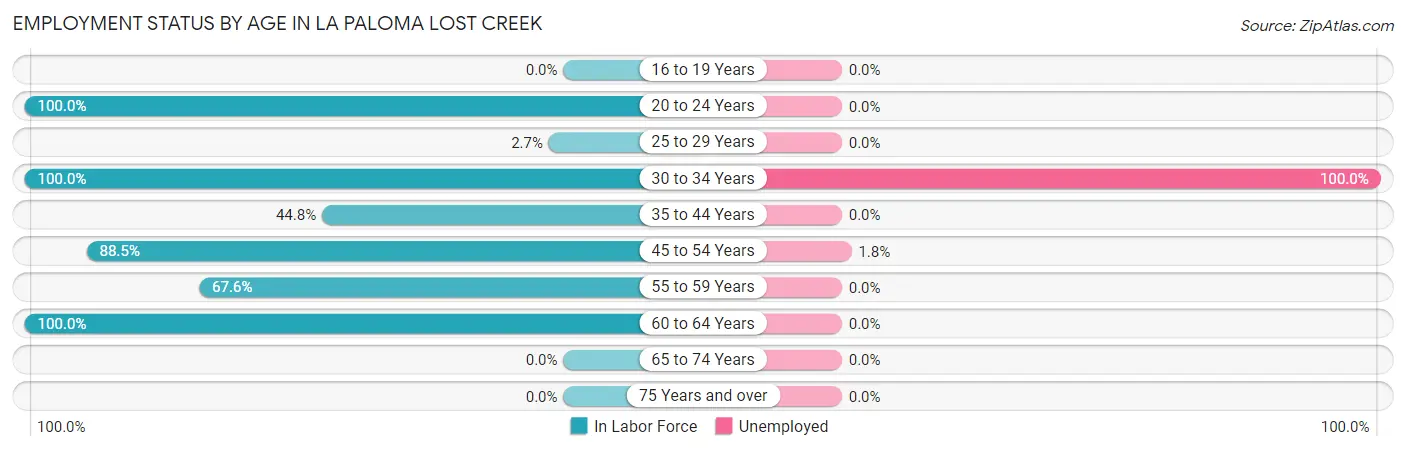
| Age Bracket | In Labor Force | Unemployed |
| 16 to 19 Years | 0 (0.0%) | 0 (0.0%) |
| 20 to 24 Years | 4 (100.0%) | 0 (0.0%) |
| 25 to 29 Years | 5 (2.7%) | 0 (0.0%) |
| 30 to 34 Years | 6 (100.0%) | 6 (100.0%) |
| 35 to 44 Years | 13 (44.8%) | 0 (0.0%) |
| 45 to 54 Years | 169 (88.5%) | 3 (1.8%) |
| 55 to 59 Years | 23 (67.6%) | 0 (0.0%) |
| 60 to 64 Years | 16 (100.0%) | 0 (0.0%) |
| 65 to 74 Years | 0 (0.0%) | 0 (0.0%) |
| 75 Years and over | 0 (0.0%) | 0 (0.0%) |
| Total | 236 (43.9%) | 9 (3.8%) |
Employment Status by Educational Attainment in La Paloma Lost Creek
According to labor force statistics for La Paloma Lost Creek, 50.1% of individuals (232) out of the total population between 25 and 64 years of age (463) are in the labor force, with 3.9% or 9 of them being unemployed. The group with the highest labor force participation rate are those with the educational attainment of bachelor's degree or higher, with 100.0% or 34 individuals in the labor force. Within the labor force, individuals with college / associate degree education have the highest percentage of unemployment, with 10.0% or 3 of them being unemployed.
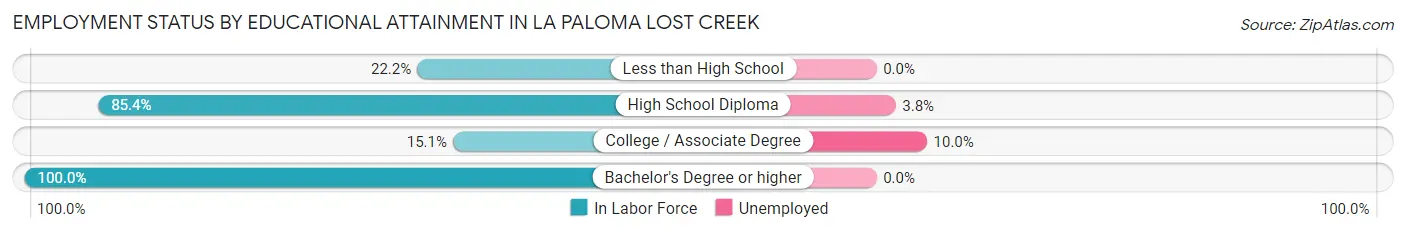
| Educational Attainment | In Labor Force | Unemployed |
| Less than High School | 10 (22.2%) | 0 (0.0%) |
| High School Diploma | 158 (85.4%) | 7 (3.8%) |
| College / Associate Degree | 30 (15.1%) | 20 (10.0%) |
| Bachelor's Degree or higher | 34 (100.0%) | 0 (0.0%) |
| Total | 232 (50.1%) | 18 (3.9%) |
Employment Occupations by Sex in La Paloma Lost Creek
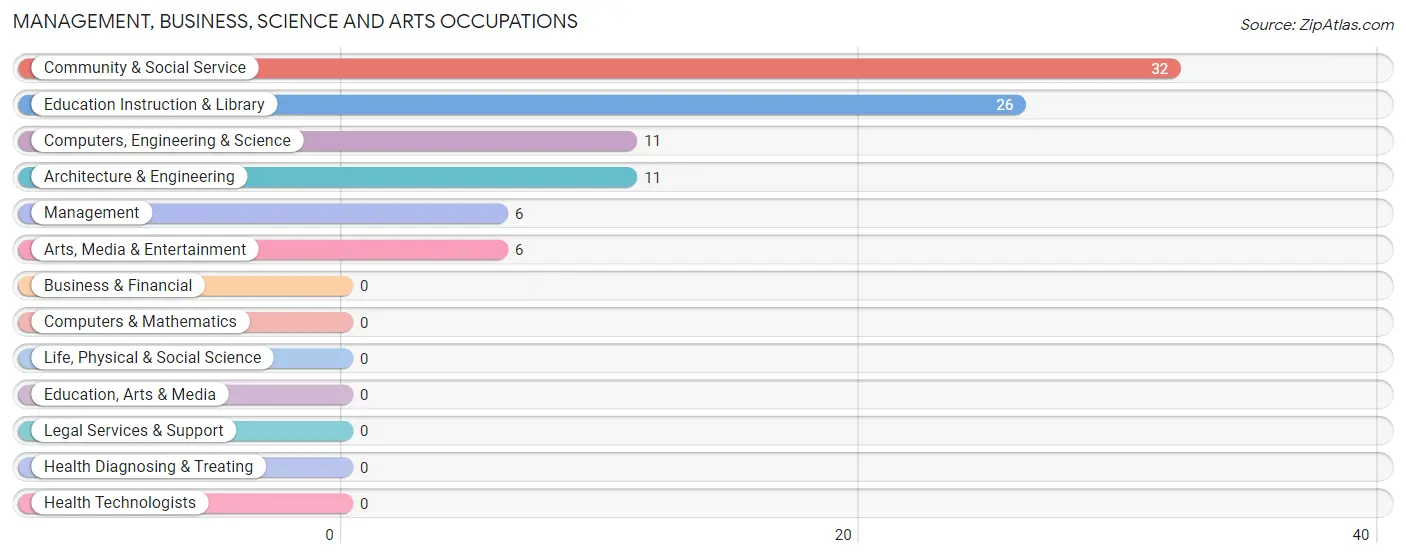
Management, Business, Science and Arts Occupations
The most common Management, Business, Science and Arts occupations in La Paloma Lost Creek are Community & Social Service (32 | 14.1%), Education Instruction & Library (26 | 11.5%), Computers, Engineering & Science (11 | 4.9%), Architecture & Engineering (11 | 4.9%), and Management (6 | 2.6%).
Management, Business, Science and Arts Occupations by Sex
Within the Management, Business, Science and Arts occupations in La Paloma Lost Creek, the most male-oriented occupations are Computers, Engineering & Science (100.0%), Architecture & Engineering (100.0%), and Arts, Media & Entertainment (50.0%), while the most female-oriented occupations are Management (100.0%), Education Instruction & Library (100.0%), and Community & Social Service (90.6%).
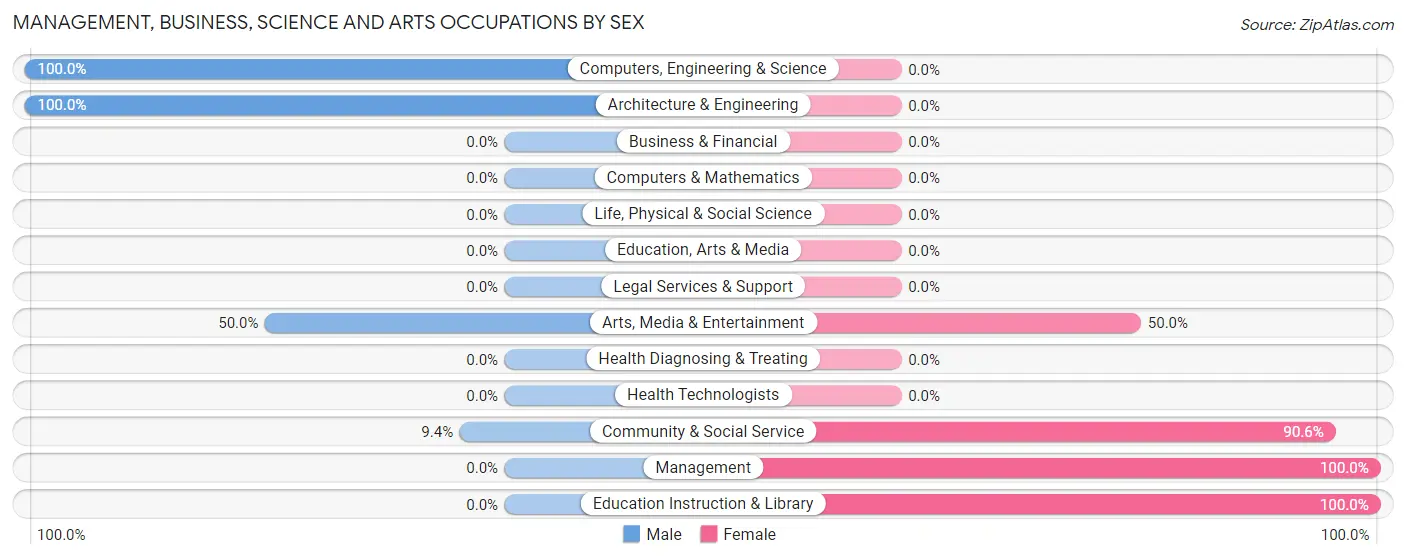
| Occupation | Male | Female |
| Management | 0 (0.0%) | 6 (100.0%) |
| Business & Financial | 0 (0.0%) | 0 (0.0%) |
| Computers, Engineering & Science | 11 (100.0%) | 0 (0.0%) |
| Computers & Mathematics | 0 (0.0%) | 0 (0.0%) |
| Architecture & Engineering | 11 (100.0%) | 0 (0.0%) |
| Life, Physical & Social Science | 0 (0.0%) | 0 (0.0%) |
| Community & Social Service | 3 (9.4%) | 29 (90.6%) |
| Education, Arts & Media | 0 (0.0%) | 0 (0.0%) |
| Legal Services & Support | 0 (0.0%) | 0 (0.0%) |
| Education Instruction & Library | 0 (0.0%) | 26 (100.0%) |
| Arts, Media & Entertainment | 3 (50.0%) | 3 (50.0%) |
| Health Diagnosing & Treating | 0 (0.0%) | 0 (0.0%) |
| Health Technologists | 0 (0.0%) | 0 (0.0%) |
| Total (Category) | 14 (28.6%) | 35 (71.4%) |
| Total (Overall) | 145 (63.9%) | 82 (36.1%) |
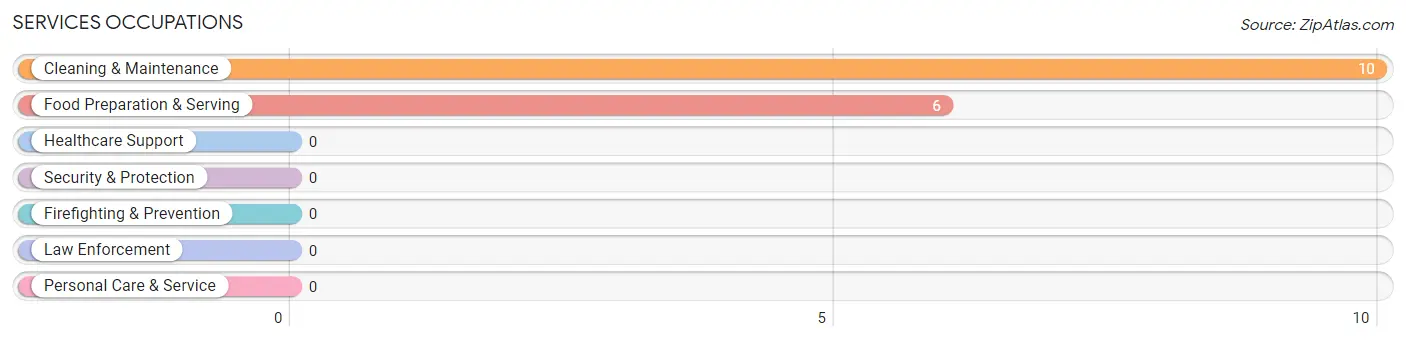
Services Occupations
The most common Services occupations in La Paloma Lost Creek are Cleaning & Maintenance (10 | 4.4%), and Food Preparation & Serving (6 | 2.6%).
Services Occupations by Sex
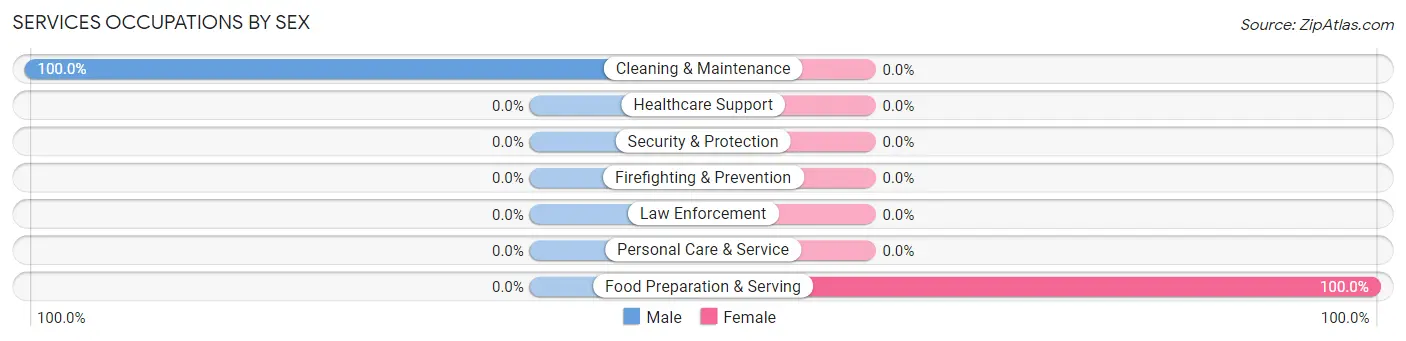
| Occupation | Male | Female |
| Healthcare Support | 0 (0.0%) | 0 (0.0%) |
| Security & Protection | 0 (0.0%) | 0 (0.0%) |
| Firefighting & Prevention | 0 (0.0%) | 0 (0.0%) |
| Law Enforcement | 0 (0.0%) | 0 (0.0%) |
| Food Preparation & Serving | 0 (0.0%) | 6 (100.0%) |
| Cleaning & Maintenance | 10 (100.0%) | 0 (0.0%) |
| Personal Care & Service | 0 (0.0%) | 0 (0.0%) |
| Total (Category) | 10 (62.5%) | 6 (37.5%) |
| Total (Overall) | 145 (63.9%) | 82 (36.1%) |
Sales and Office Occupations
The most common Sales and Office occupations in La Paloma Lost Creek are Office & Administration (49 | 21.6%), and Sales & Related (6 | 2.6%).

Sales and Office Occupations by Sex

| Occupation | Male | Female |
| Sales & Related | 6 (100.0%) | 0 (0.0%) |
| Office & Administration | 8 (16.3%) | 41 (83.7%) |
| Total (Category) | 14 (25.5%) | 41 (74.6%) |
| Total (Overall) | 145 (63.9%) | 82 (36.1%) |
Natural Resources, Construction and Maintenance Occupations
The most common Natural Resources, Construction and Maintenance occupations in La Paloma Lost Creek are , and Construction & Extraction (14 | 6.2%).
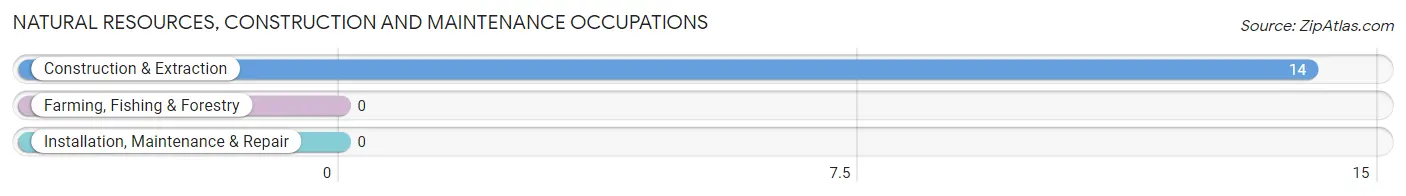
Natural Resources, Construction and Maintenance Occupations by Sex

| Occupation | Male | Female |
| Farming, Fishing & Forestry | 0 (0.0%) | 0 (0.0%) |
| Construction & Extraction | 14 (100.0%) | 0 (0.0%) |
| Installation, Maintenance & Repair | 0 (0.0%) | 0 (0.0%) |
| Total (Category) | 14 (100.0%) | 0 (0.0%) |
| Total (Overall) | 145 (63.9%) | 82 (36.1%) |
Production, Transportation and Moving Occupations
The most common Production, Transportation and Moving occupations in La Paloma Lost Creek are , and Transportation (93 | 41.0%).
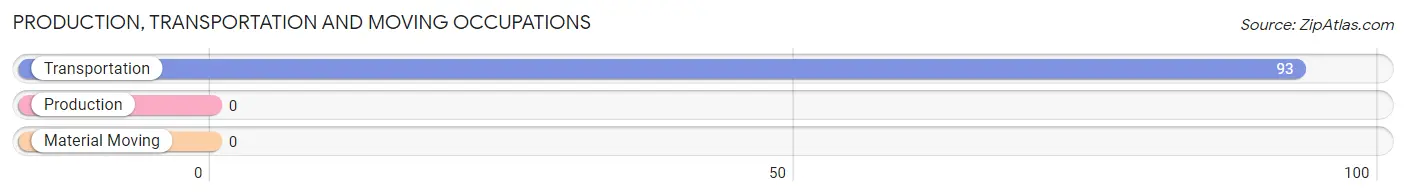
Production, Transportation and Moving Occupations by Sex
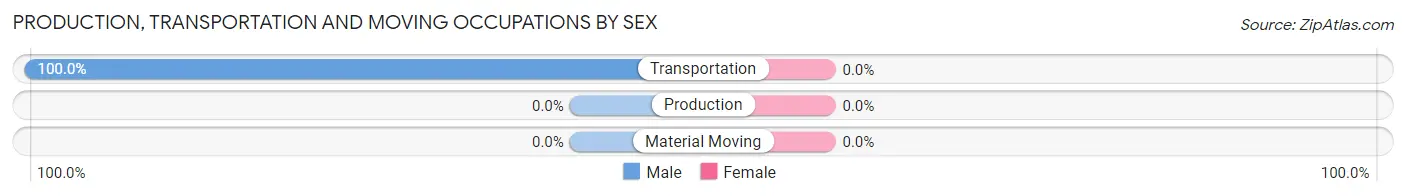
| Occupation | Male | Female |
| Production | 0 (0.0%) | 0 (0.0%) |
| Transportation | 93 (100.0%) | 0 (0.0%) |
| Material Moving | 0 (0.0%) | 0 (0.0%) |
| Total (Category) | 93 (100.0%) | 0 (0.0%) |
| Total (Overall) | 145 (63.9%) | 82 (36.1%) |
Employment Industries by Sex in La Paloma Lost Creek
Employment Industries in La Paloma Lost Creek
The major employment industries in La Paloma Lost Creek include Transportation & Warehousing (93 | 41.0%), Retail Trade (32 | 14.1%), Educational Services (26 | 11.5%), Health Care & Social Assistance (15 | 6.6%), and Construction (14 | 6.2%).
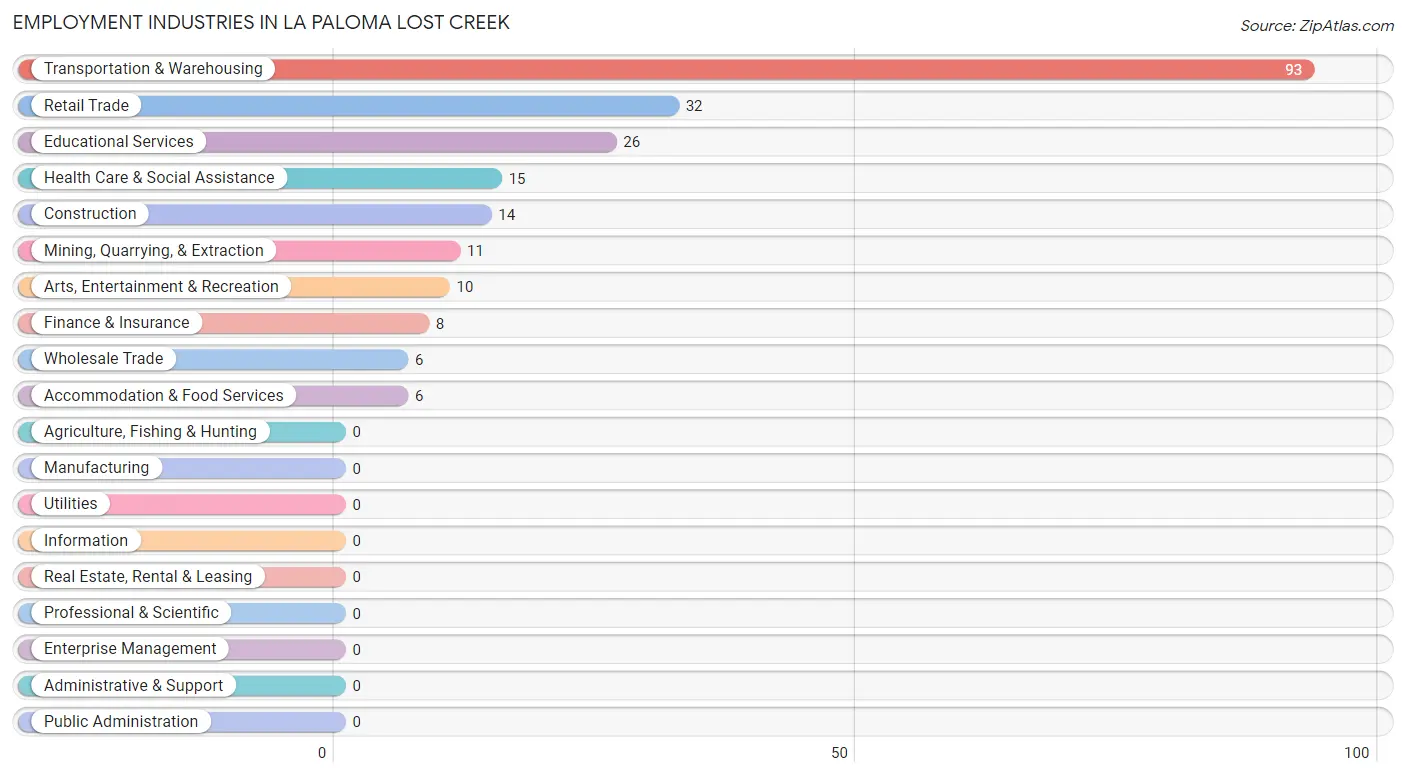
Employment Industries by Sex in La Paloma Lost Creek
The La Paloma Lost Creek industries that see more men than women are Mining, Quarrying, & Extraction (100.0%), Construction (100.0%), and Wholesale Trade (100.0%), whereas the industries that tend to have a higher number of women are Retail Trade (100.0%), Educational Services (100.0%), and Health Care & Social Assistance (100.0%).
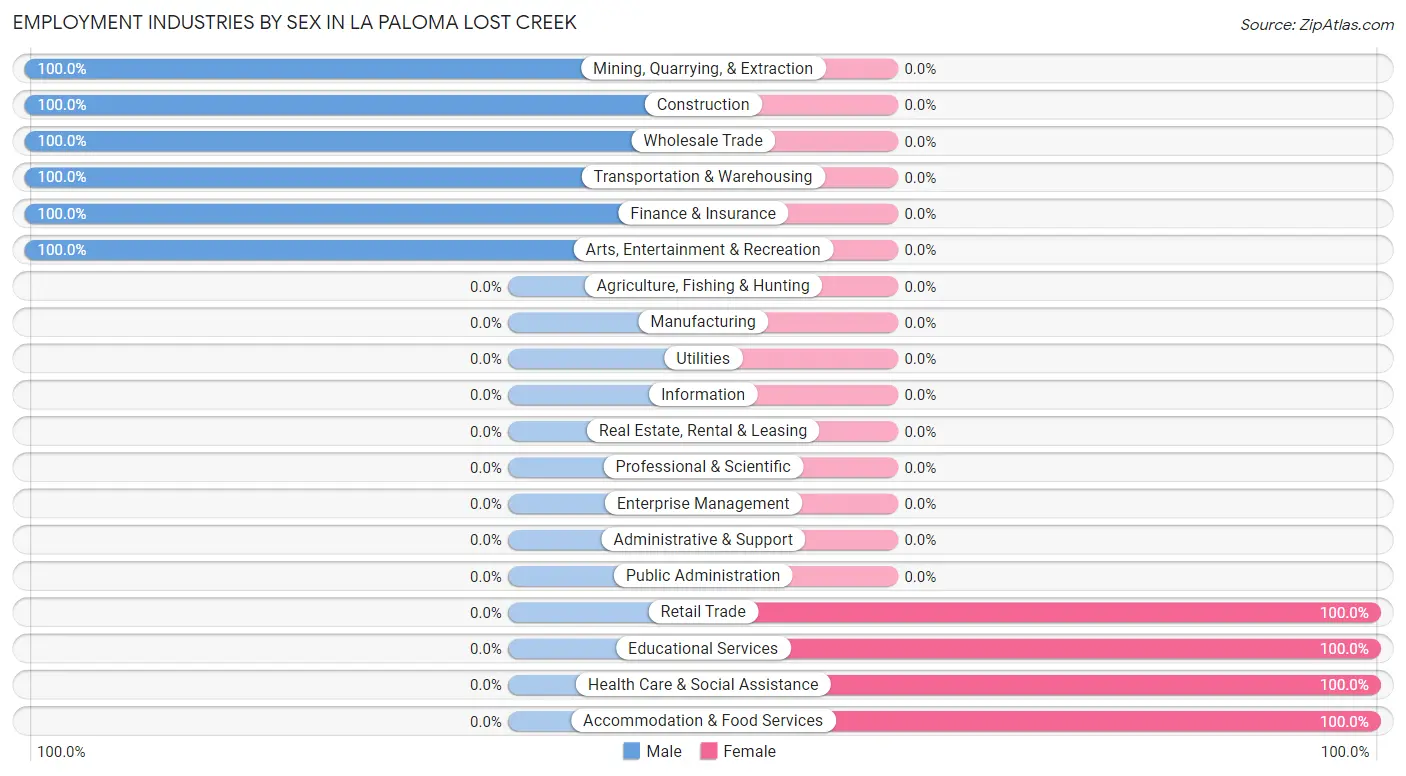
| Industry | Male | Female |
| Agriculture, Fishing & Hunting | 0 (0.0%) | 0 (0.0%) |
| Mining, Quarrying, & Extraction | 11 (100.0%) | 0 (0.0%) |
| Construction | 14 (100.0%) | 0 (0.0%) |
| Manufacturing | 0 (0.0%) | 0 (0.0%) |
| Wholesale Trade | 6 (100.0%) | 0 (0.0%) |
| Retail Trade | 0 (0.0%) | 32 (100.0%) |
| Transportation & Warehousing | 93 (100.0%) | 0 (0.0%) |
| Utilities | 0 (0.0%) | 0 (0.0%) |
| Information | 0 (0.0%) | 0 (0.0%) |
| Finance & Insurance | 8 (100.0%) | 0 (0.0%) |
| Real Estate, Rental & Leasing | 0 (0.0%) | 0 (0.0%) |
| Professional & Scientific | 0 (0.0%) | 0 (0.0%) |
| Enterprise Management | 0 (0.0%) | 0 (0.0%) |
| Administrative & Support | 0 (0.0%) | 0 (0.0%) |
| Educational Services | 0 (0.0%) | 26 (100.0%) |
| Health Care & Social Assistance | 0 (0.0%) | 15 (100.0%) |
| Arts, Entertainment & Recreation | 10 (100.0%) | 0 (0.0%) |
| Accommodation & Food Services | 0 (0.0%) | 6 (100.0%) |
| Public Administration | 0 (0.0%) | 0 (0.0%) |
| Total | 145 (63.9%) | 82 (36.1%) |
Education in La Paloma Lost Creek
School Enrollment in La Paloma Lost Creek
The most common levels of schooling among the 104 students in La Paloma Lost Creek are high school (87 | 83.7%), college / undergraduate (9 | 8.6%), and elementary school (4 | 3.8%).
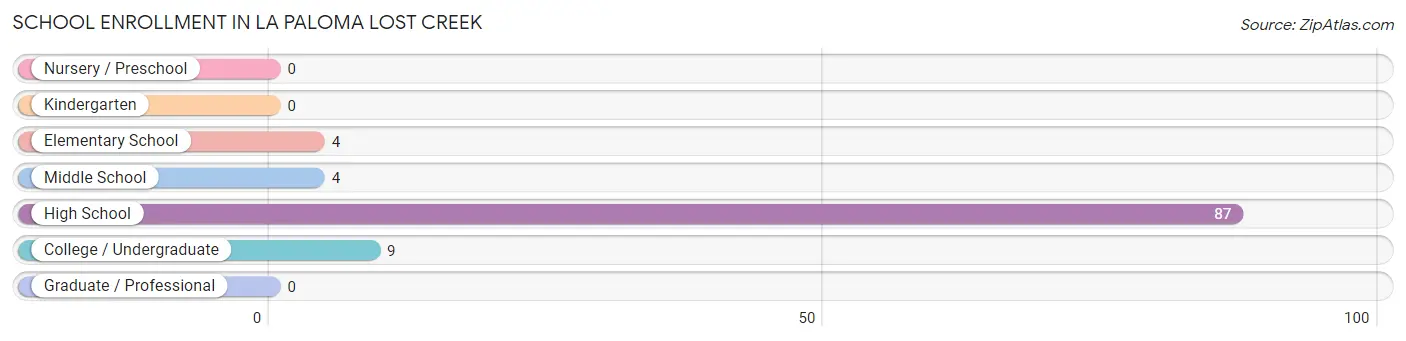
| School Level | # Students | % Students |
| Nursery / Preschool | 0 | 0.0% |
| Kindergarten | 0 | 0.0% |
| Elementary School | 4 | 3.8% |
| Middle School | 4 | 3.8% |
| High School | 87 | 83.7% |
| College / Undergraduate | 9 | 8.6% |
| Graduate / Professional | 0 | 0.0% |
| Total | 104 | 100.0% |
School Enrollment by Age by Funding Source in La Paloma Lost Creek
Out of a total of 104 students who are enrolled in schools in La Paloma Lost Creek, 4 (3.8%) attend a private institution, while the remaining 100 (96.2%) are enrolled in public schools. The age group of 10 to 14 year olds has the highest likelihood of being enrolled in private schools, with 4 (12.1% in the age bracket) enrolled. Conversely, the age group of 5 to 9 year old has the lowest likelihood of being enrolled in a private school, with 4 (100.0% in the age bracket) attending a public institution.
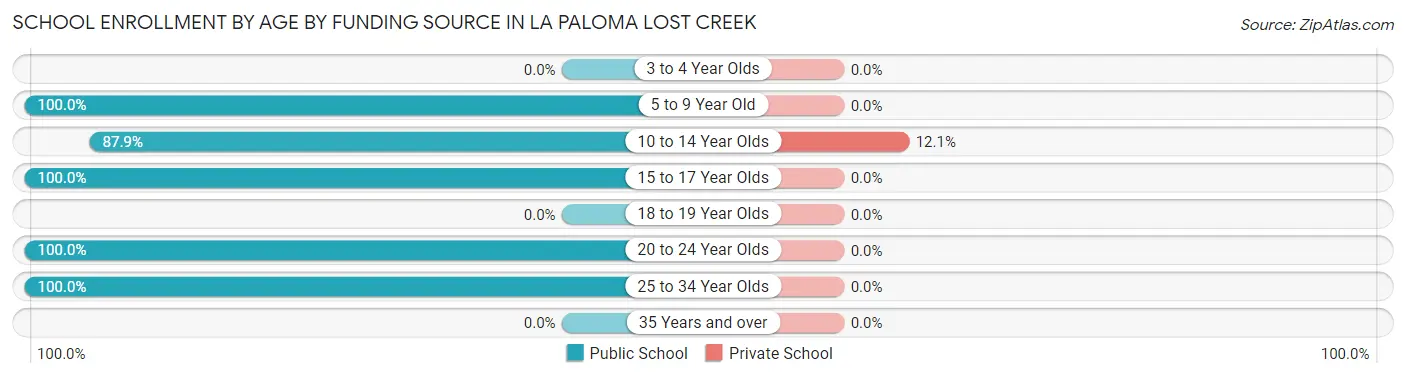
| Age Bracket | Public School | Private School |
| 3 to 4 Year Olds | 0 (0.0%) | 0 (0.0%) |
| 5 to 9 Year Old | 4 (100.0%) | 0 (0.0%) |
| 10 to 14 Year Olds | 29 (87.9%) | 4 (12.1%) |
| 15 to 17 Year Olds | 58 (100.0%) | 0 (0.0%) |
| 18 to 19 Year Olds | 0 (0.0%) | 0 (0.0%) |
| 20 to 24 Year Olds | 4 (100.0%) | 0 (0.0%) |
| 25 to 34 Year Olds | 5 (100.0%) | 0 (0.0%) |
| 35 Years and over | 0 (0.0%) | 0 (0.0%) |
| Total | 100 (96.2%) | 4 (3.8%) |
Educational Attainment by Field of Study in La Paloma Lost Creek
Education (26 | 46.4%), bio, nature & agricultural (14 | 25.0%), psychology (8 | 14.3%), and arts & humanities (8 | 14.3%) are the most common fields of study among 56 individuals in La Paloma Lost Creek who have obtained a bachelor's degree or higher.
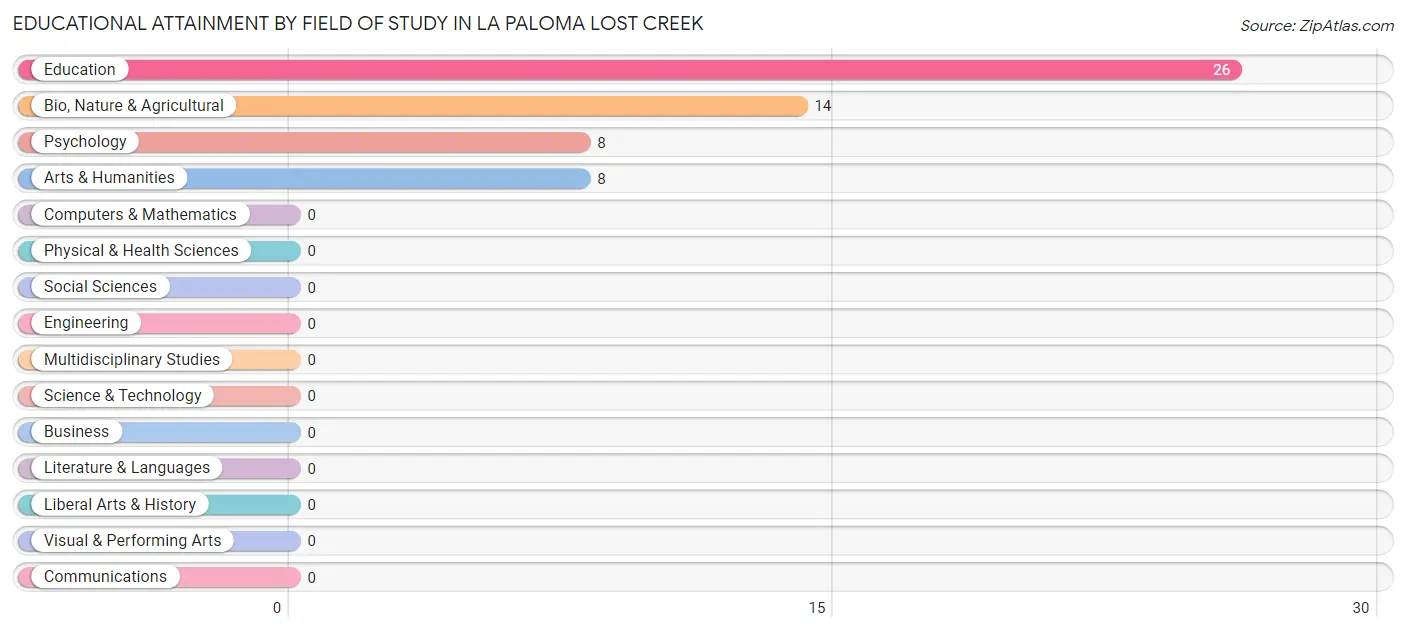
| Field of Study | # Graduates | % Graduates |
| Computers & Mathematics | 0 | 0.0% |
| Bio, Nature & Agricultural | 14 | 25.0% |
| Physical & Health Sciences | 0 | 0.0% |
| Psychology | 8 | 14.3% |
| Social Sciences | 0 | 0.0% |
| Engineering | 0 | 0.0% |
| Multidisciplinary Studies | 0 | 0.0% |
| Science & Technology | 0 | 0.0% |
| Business | 0 | 0.0% |
| Education | 26 | 46.4% |
| Literature & Languages | 0 | 0.0% |
| Liberal Arts & History | 0 | 0.0% |
| Visual & Performing Arts | 0 | 0.0% |
| Communications | 0 | 0.0% |
| Arts & Humanities | 8 | 14.3% |
| Total | 56 | 100.0% |
Transportation & Commute in La Paloma Lost Creek
Vehicle Availability by Sex in La Paloma Lost Creek
The most prevalent vehicle ownership categories in La Paloma Lost Creek are males with 4 vehicles (93, accounting for 64.1%) and females with 4 vehicles (32, making up 113.4%).
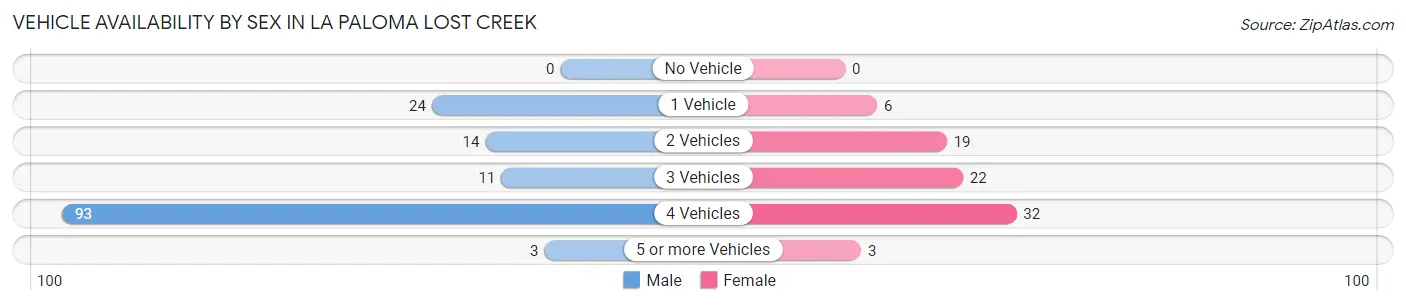
| Vehicles Available | Male | Female |
| No Vehicle | 0 (0.0%) | 0 (0.0%) |
| 1 Vehicle | 24 (16.6%) | 6 (7.3%) |
| 2 Vehicles | 14 (9.7%) | 19 (23.2%) |
| 3 Vehicles | 11 (7.6%) | 22 (26.8%) |
| 4 Vehicles | 93 (64.1%) | 32 (39.0%) |
| 5 or more Vehicles | 3 (2.1%) | 3 (3.7%) |
| Total | 145 (100.0%) | 82 (100.0%) |
Commute Time in La Paloma Lost Creek
The most frequently occuring commute durations in La Paloma Lost Creek are 30 to 34 minutes (126 commuters, 55.5%), 15 to 19 minutes (46 commuters, 20.3%), and 25 to 29 minutes (22 commuters, 9.7%).
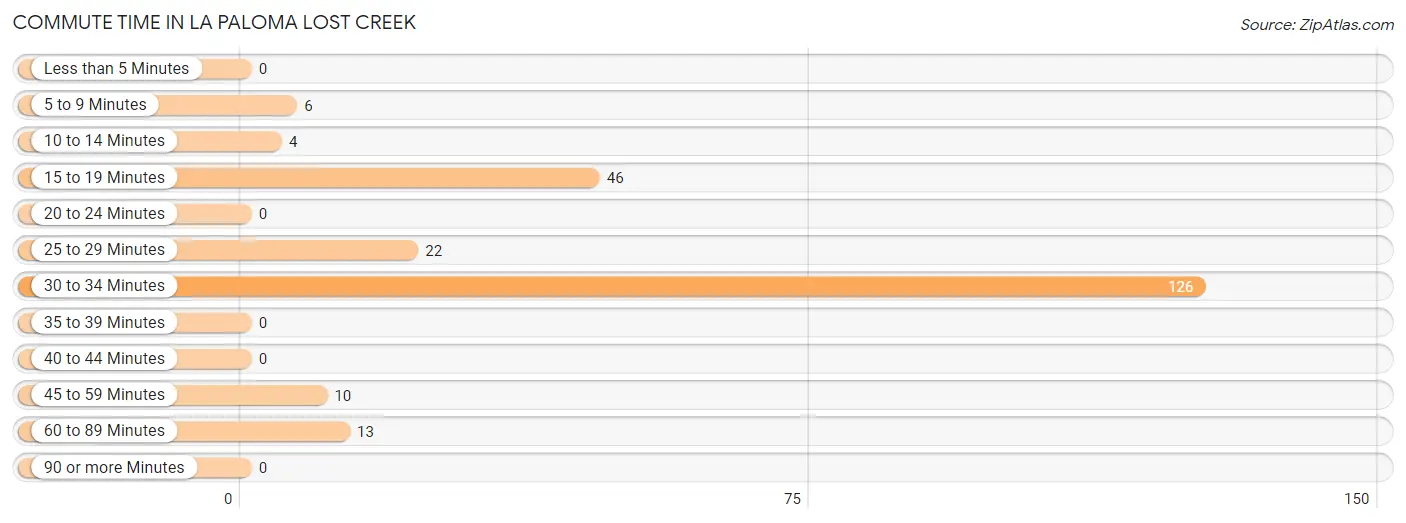
| Commute Time | # Commuters | % Commuters |
| Less than 5 Minutes | 0 | 0.0% |
| 5 to 9 Minutes | 6 | 2.6% |
| 10 to 14 Minutes | 4 | 1.8% |
| 15 to 19 Minutes | 46 | 20.3% |
| 20 to 24 Minutes | 0 | 0.0% |
| 25 to 29 Minutes | 22 | 9.7% |
| 30 to 34 Minutes | 126 | 55.5% |
| 35 to 39 Minutes | 0 | 0.0% |
| 40 to 44 Minutes | 0 | 0.0% |
| 45 to 59 Minutes | 10 | 4.4% |
| 60 to 89 Minutes | 13 | 5.7% |
| 90 or more Minutes | 0 | 0.0% |
Commute Time by Sex in La Paloma Lost Creek
The most common commute times in La Paloma Lost Creek are 30 to 34 minutes (94 commuters, 64.8%) for males and 30 to 34 minutes (32 commuters, 39.0%) for females.
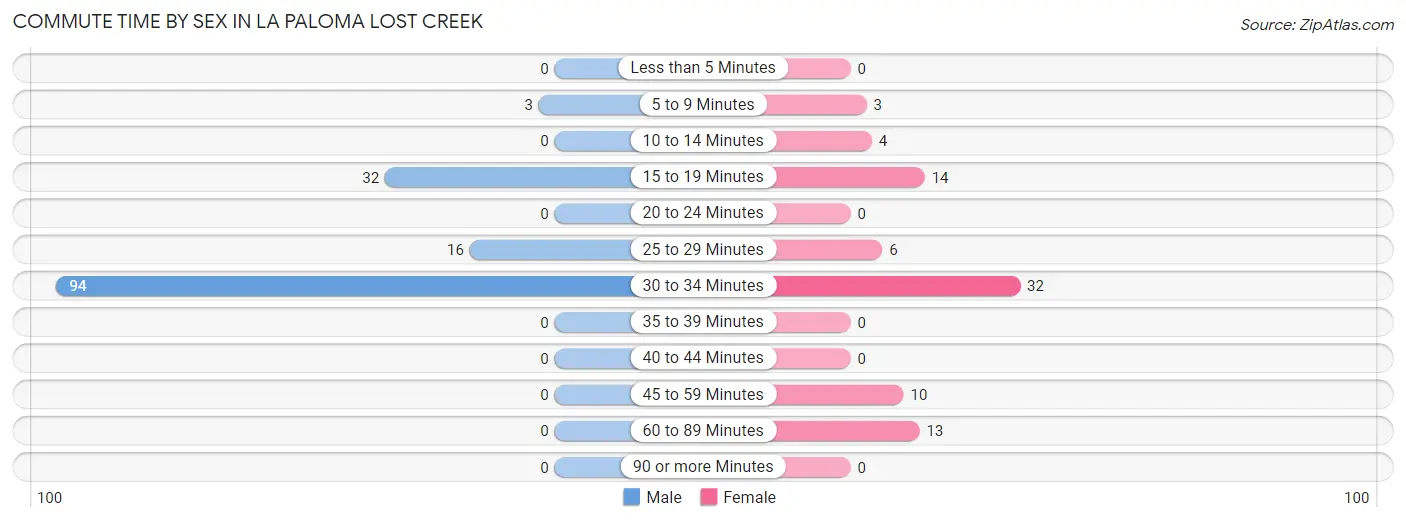
| Commute Time | Male | Female |
| Less than 5 Minutes | 0 (0.0%) | 0 (0.0%) |
| 5 to 9 Minutes | 3 (2.1%) | 3 (3.7%) |
| 10 to 14 Minutes | 0 (0.0%) | 4 (4.9%) |
| 15 to 19 Minutes | 32 (22.1%) | 14 (17.1%) |
| 20 to 24 Minutes | 0 (0.0%) | 0 (0.0%) |
| 25 to 29 Minutes | 16 (11.0%) | 6 (7.3%) |
| 30 to 34 Minutes | 94 (64.8%) | 32 (39.0%) |
| 35 to 39 Minutes | 0 (0.0%) | 0 (0.0%) |
| 40 to 44 Minutes | 0 (0.0%) | 0 (0.0%) |
| 45 to 59 Minutes | 0 (0.0%) | 10 (12.2%) |
| 60 to 89 Minutes | 0 (0.0%) | 13 (15.9%) |
| 90 or more Minutes | 0 (0.0%) | 0 (0.0%) |
Time of Departure to Work by Sex in La Paloma Lost Creek
The most frequent times of departure to work in La Paloma Lost Creek are 6:00 AM to 6:29 AM (49, 33.8%) for males and 7:30 AM to 7:59 AM (32, 39.0%) for females.
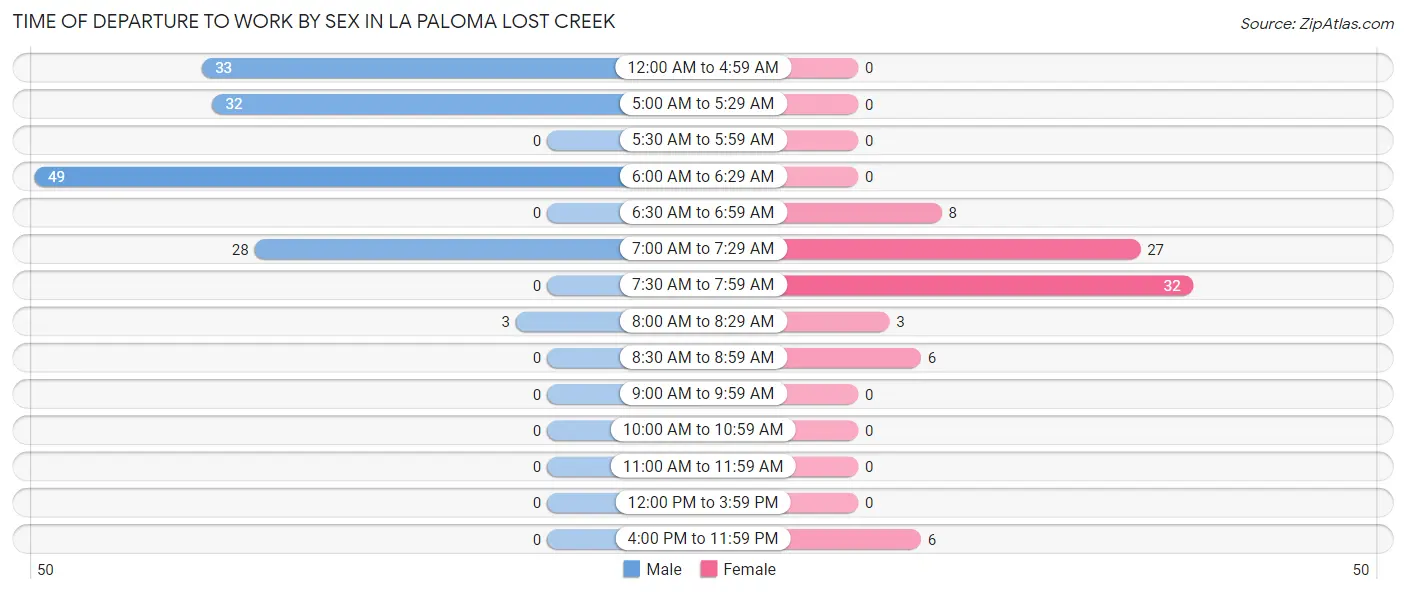
| Time of Departure | Male | Female |
| 12:00 AM to 4:59 AM | 33 (22.8%) | 0 (0.0%) |
| 5:00 AM to 5:29 AM | 32 (22.1%) | 0 (0.0%) |
| 5:30 AM to 5:59 AM | 0 (0.0%) | 0 (0.0%) |
| 6:00 AM to 6:29 AM | 49 (33.8%) | 0 (0.0%) |
| 6:30 AM to 6:59 AM | 0 (0.0%) | 8 (9.8%) |
| 7:00 AM to 7:29 AM | 28 (19.3%) | 27 (32.9%) |
| 7:30 AM to 7:59 AM | 0 (0.0%) | 32 (39.0%) |
| 8:00 AM to 8:29 AM | 3 (2.1%) | 3 (3.7%) |
| 8:30 AM to 8:59 AM | 0 (0.0%) | 6 (7.3%) |
| 9:00 AM to 9:59 AM | 0 (0.0%) | 0 (0.0%) |
| 10:00 AM to 10:59 AM | 0 (0.0%) | 0 (0.0%) |
| 11:00 AM to 11:59 AM | 0 (0.0%) | 0 (0.0%) |
| 12:00 PM to 3:59 PM | 0 (0.0%) | 0 (0.0%) |
| 4:00 PM to 11:59 PM | 0 (0.0%) | 6 (7.3%) |
| Total | 145 (100.0%) | 82 (100.0%) |
Housing Occupancy in La Paloma Lost Creek
Occupancy by Ownership in La Paloma Lost Creek
Of the total 283 dwellings in La Paloma Lost Creek, owner-occupied units account for 273 (96.5%), while renter-occupied units make up 10 (3.5%).
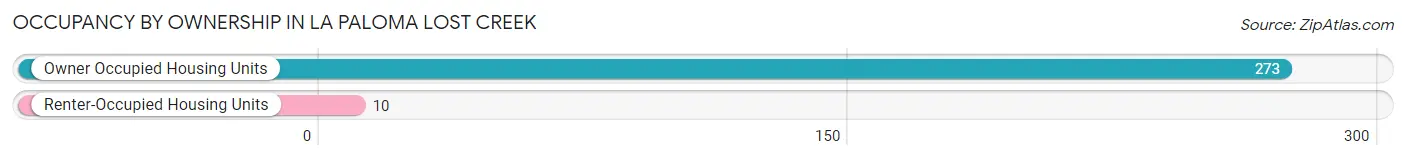
| Occupancy | # Housing Units | % Housing Units |
| Owner Occupied Housing Units | 273 | 96.5% |
| Renter-Occupied Housing Units | 10 | 3.5% |
| Total Occupied Housing Units | 283 | 100.0% |
Occupancy by Household Size in La Paloma Lost Creek
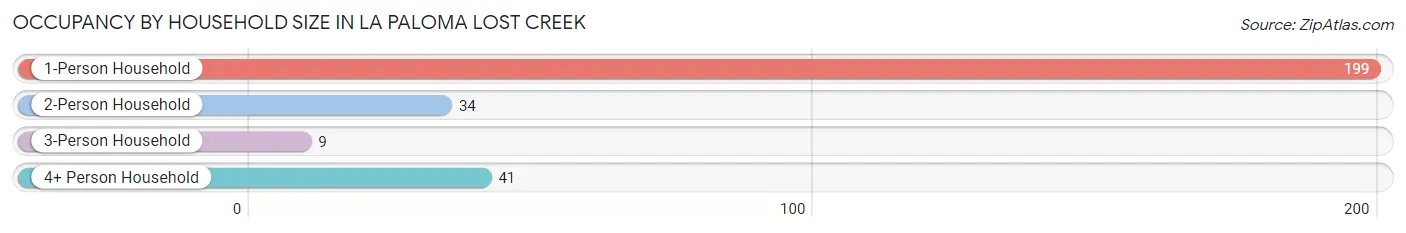
| Household Size | # Housing Units | % Housing Units |
| 1-Person Household | 199 | 70.3% |
| 2-Person Household | 34 | 12.0% |
| 3-Person Household | 9 | 3.2% |
| 4+ Person Household | 41 | 14.5% |
| Total Housing Units | 283 | 100.0% |
Occupancy by Ownership by Household Size in La Paloma Lost Creek
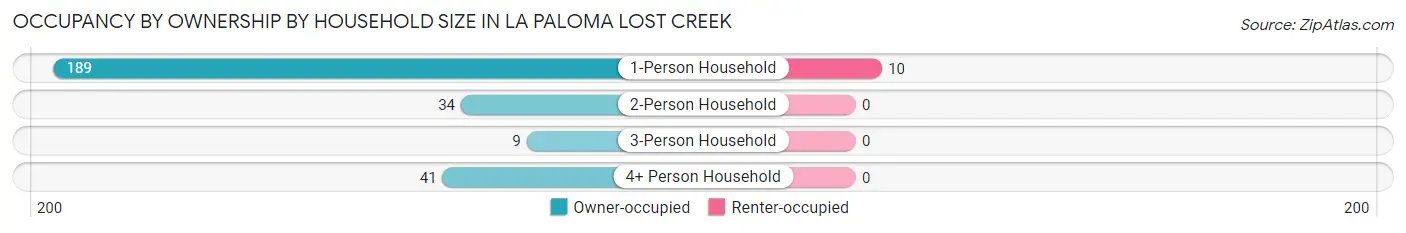
| Household Size | Owner-occupied | Renter-occupied |
| 1-Person Household | 189 (95.0%) | 10 (5.0%) |
| 2-Person Household | 34 (100.0%) | 0 (0.0%) |
| 3-Person Household | 9 (100.0%) | 0 (0.0%) |
| 4+ Person Household | 41 (100.0%) | 0 (0.0%) |
| Total Housing Units | 273 (96.5%) | 10 (3.5%) |
Occupancy by Educational Attainment in La Paloma Lost Creek
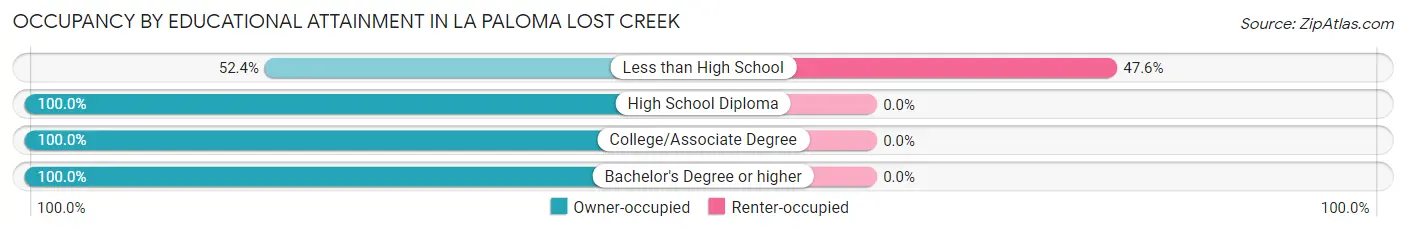
| Household Size | Owner-occupied | Renter-occupied |
| Less than High School | 11 (52.4%) | 10 (47.6%) |
| High School Diploma | 50 (100.0%) | 0 (0.0%) |
| College/Associate Degree | 185 (100.0%) | 0 (0.0%) |
| Bachelor's Degree or higher | 27 (100.0%) | 0 (0.0%) |
Occupancy by Age of Householder in La Paloma Lost Creek
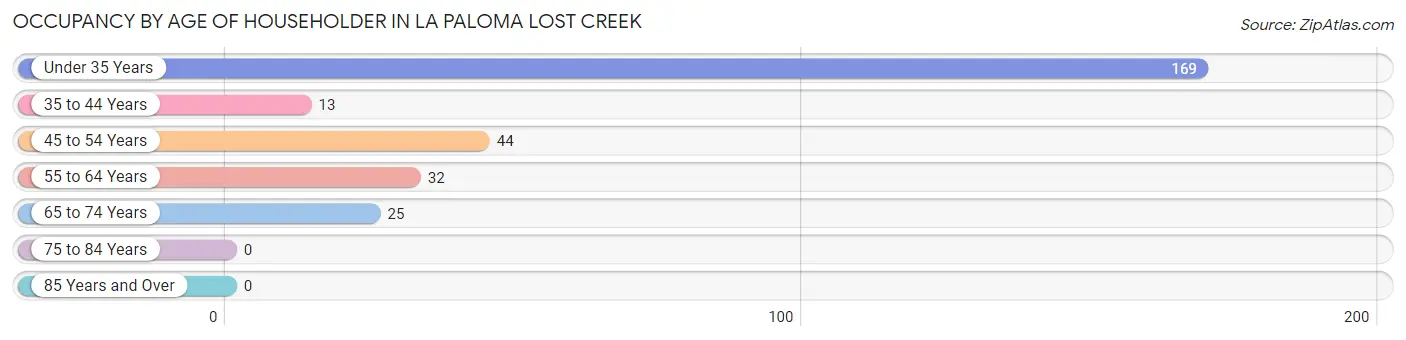
| Age Bracket | # Households | % Households |
| Under 35 Years | 169 | 59.7% |
| 35 to 44 Years | 13 | 4.6% |
| 45 to 54 Years | 44 | 15.5% |
| 55 to 64 Years | 32 | 11.3% |
| 65 to 74 Years | 25 | 8.8% |
| 75 to 84 Years | 0 | 0.0% |
| 85 Years and Over | 0 | 0.0% |
| Total | 283 | 100.0% |
Housing Finances in La Paloma Lost Creek
Median Income by Occupancy in La Paloma Lost Creek
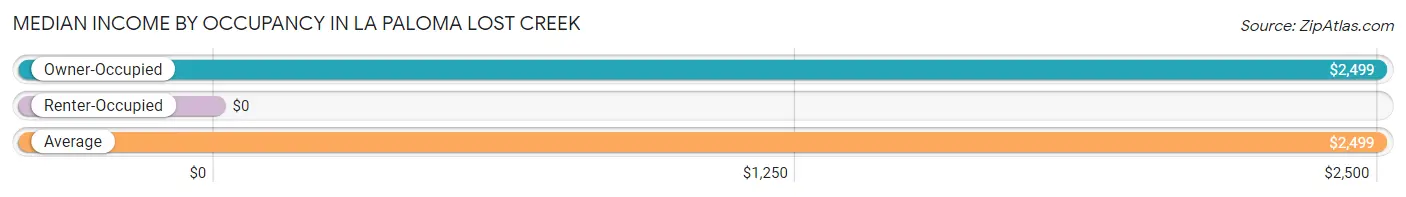
| Occupancy Type | # Households | Median Income |
| Owner-Occupied | 273 (96.5%) | $2,499 |
| Renter-Occupied | 10 (3.5%) | $0 |
| Average | 283 (100.0%) | $2,499 |
Occupancy by Householder Income Bracket in La Paloma Lost Creek
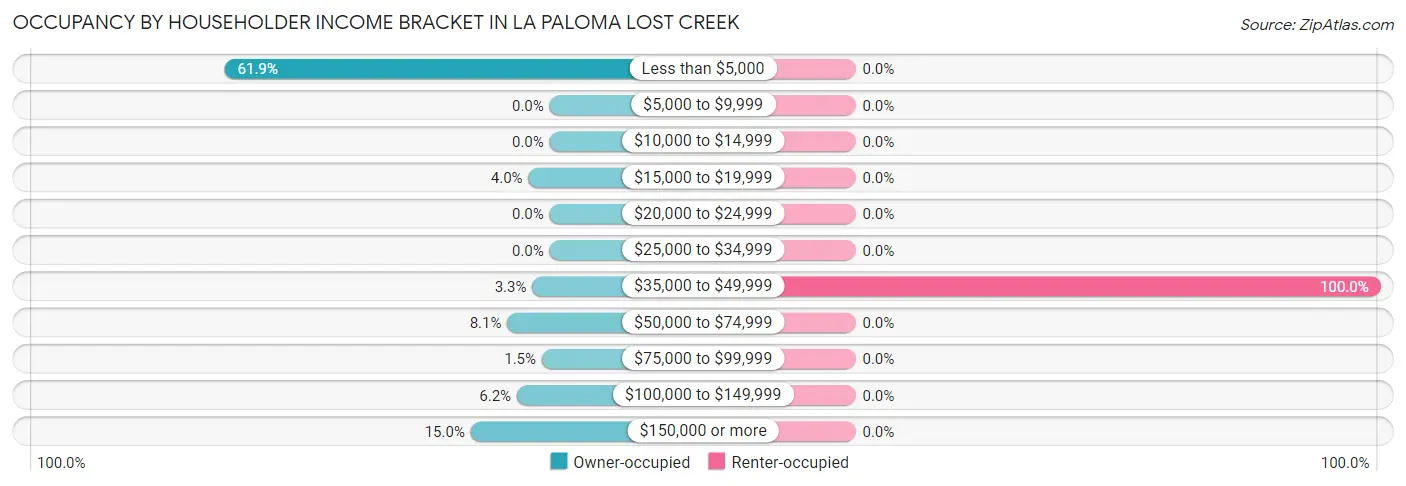
| Income Bracket | Owner-occupied | Renter-occupied |
| Less than $5,000 | 169 (61.9%) | 0 (0.0%) |
| $5,000 to $9,999 | 0 (0.0%) | 0 (0.0%) |
| $10,000 to $14,999 | 0 (0.0%) | 0 (0.0%) |
| $15,000 to $19,999 | 11 (4.0%) | 0 (0.0%) |
| $20,000 to $24,999 | 0 (0.0%) | 0 (0.0%) |
| $25,000 to $34,999 | 0 (0.0%) | 0 (0.0%) |
| $35,000 to $49,999 | 9 (3.3%) | 10 (100.0%) |
| $50,000 to $74,999 | 22 (8.1%) | 0 (0.0%) |
| $75,000 to $99,999 | 4 (1.5%) | 0 (0.0%) |
| $100,000 to $149,999 | 17 (6.2%) | 0 (0.0%) |
| $150,000 or more | 41 (15.0%) | 0 (0.0%) |
| Total | 273 (100.0%) | 10 (100.0%) |
Monthly Housing Cost Tiers in La Paloma Lost Creek
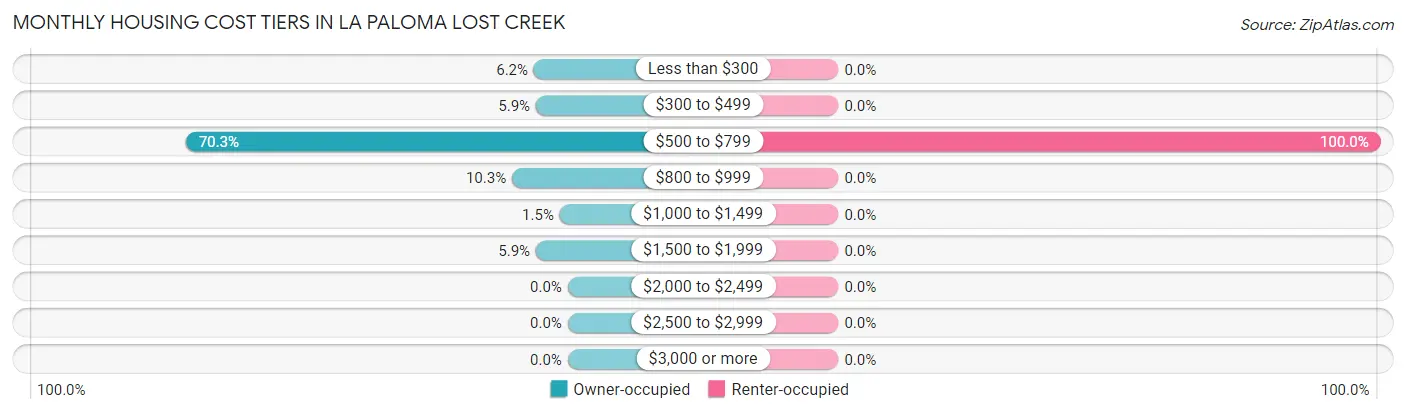
| Monthly Cost | Owner-occupied | Renter-occupied |
| Less than $300 | 17 (6.2%) | 0 (0.0%) |
| $300 to $499 | 16 (5.9%) | 0 (0.0%) |
| $500 to $799 | 192 (70.3%) | 10 (100.0%) |
| $800 to $999 | 28 (10.3%) | 0 (0.0%) |
| $1,000 to $1,499 | 4 (1.5%) | 0 (0.0%) |
| $1,500 to $1,999 | 16 (5.9%) | 0 (0.0%) |
| $2,000 to $2,499 | 0 (0.0%) | 0 (0.0%) |
| $2,500 to $2,999 | 0 (0.0%) | 0 (0.0%) |
| $3,000 or more | 0 (0.0%) | 0 (0.0%) |
| Total | 273 (100.0%) | 10 (100.0%) |
Physical Housing Characteristics in La Paloma Lost Creek
Housing Structures in La Paloma Lost Creek
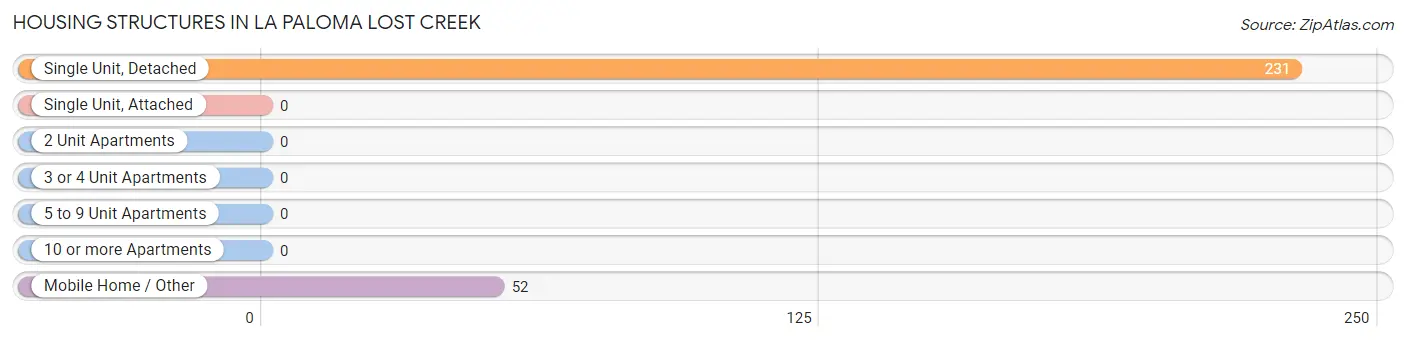
| Structure Type | # Housing Units | % Housing Units |
| Single Unit, Detached | 231 | 81.6% |
| Single Unit, Attached | 0 | 0.0% |
| 2 Unit Apartments | 0 | 0.0% |
| 3 or 4 Unit Apartments | 0 | 0.0% |
| 5 to 9 Unit Apartments | 0 | 0.0% |
| 10 or more Apartments | 0 | 0.0% |
| Mobile Home / Other | 52 | 18.4% |
| Total | 283 | 100.0% |
Housing Structures by Occupancy in La Paloma Lost Creek
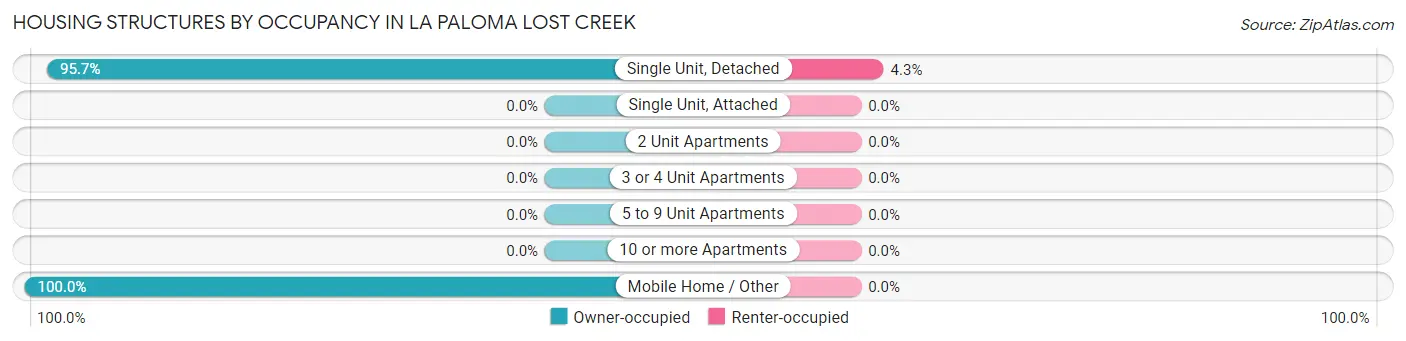
| Structure Type | Owner-occupied | Renter-occupied |
| Single Unit, Detached | 221 (95.7%) | 10 (4.3%) |
| Single Unit, Attached | 0 (0.0%) | 0 (0.0%) |
| 2 Unit Apartments | 0 (0.0%) | 0 (0.0%) |
| 3 or 4 Unit Apartments | 0 (0.0%) | 0 (0.0%) |
| 5 to 9 Unit Apartments | 0 (0.0%) | 0 (0.0%) |
| 10 or more Apartments | 0 (0.0%) | 0 (0.0%) |
| Mobile Home / Other | 52 (100.0%) | 0 (0.0%) |
| Total | 273 (96.5%) | 10 (3.5%) |
Housing Structures by Number of Rooms in La Paloma Lost Creek
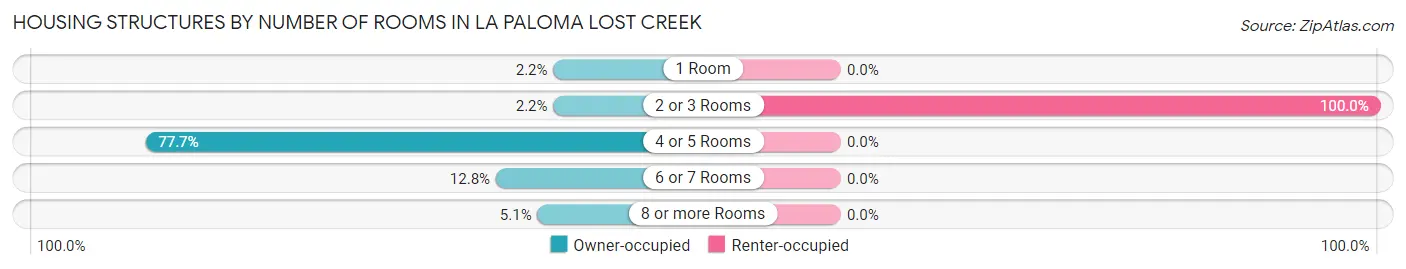
| Number of Rooms | Owner-occupied | Renter-occupied |
| 1 Room | 6 (2.2%) | 0 (0.0%) |
| 2 or 3 Rooms | 6 (2.2%) | 10 (100.0%) |
| 4 or 5 Rooms | 212 (77.7%) | 0 (0.0%) |
| 6 or 7 Rooms | 35 (12.8%) | 0 (0.0%) |
| 8 or more Rooms | 14 (5.1%) | 0 (0.0%) |
| Total | 273 (100.0%) | 10 (100.0%) |
Housing Structure by Heating Type in La Paloma Lost Creek
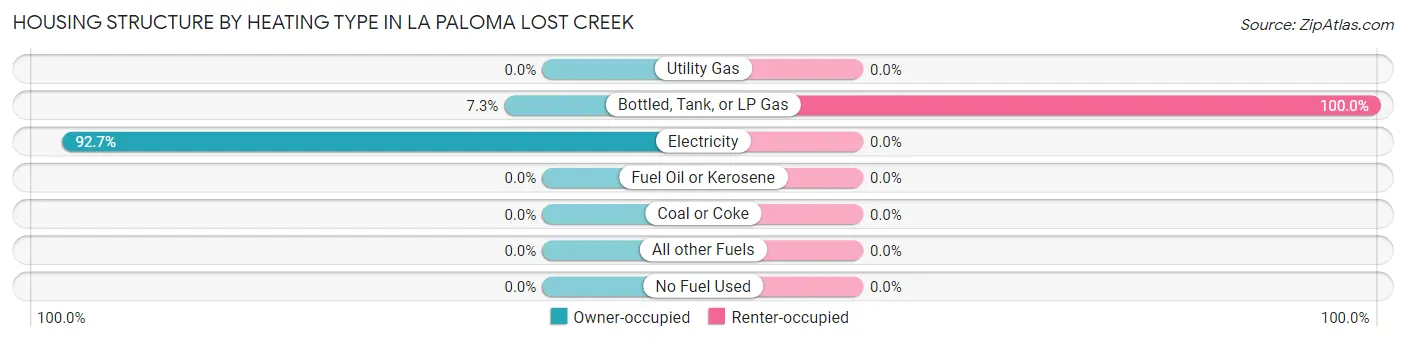
| Heating Type | Owner-occupied | Renter-occupied |
| Utility Gas | 0 (0.0%) | 0 (0.0%) |
| Bottled, Tank, or LP Gas | 20 (7.3%) | 10 (100.0%) |
| Electricity | 253 (92.7%) | 0 (0.0%) |
| Fuel Oil or Kerosene | 0 (0.0%) | 0 (0.0%) |
| Coal or Coke | 0 (0.0%) | 0 (0.0%) |
| All other Fuels | 0 (0.0%) | 0 (0.0%) |
| No Fuel Used | 0 (0.0%) | 0 (0.0%) |
| Total | 273 (100.0%) | 10 (100.0%) |
Household Vehicle Usage in La Paloma Lost Creek
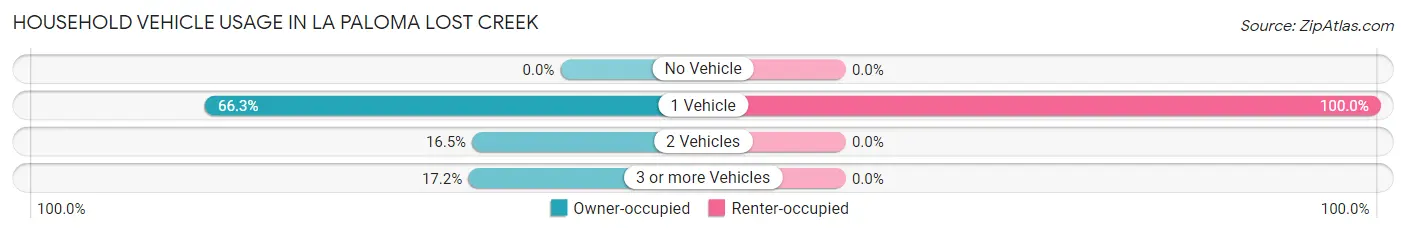
| Vehicles per Household | Owner-occupied | Renter-occupied |
| No Vehicle | 0 (0.0%) | 0 (0.0%) |
| 1 Vehicle | 181 (66.3%) | 10 (100.0%) |
| 2 Vehicles | 45 (16.5%) | 0 (0.0%) |
| 3 or more Vehicles | 47 (17.2%) | 0 (0.0%) |
| Total | 273 (100.0%) | 10 (100.0%) |
Real Estate & Mortgages in La Paloma Lost Creek
Real Estate and Mortgage Overview in La Paloma Lost Creek
| Characteristic | Without Mortgage | With Mortgage |
| Housing Units | 247 | 26 |
| Median Property Value | $263,500 | $154,700 |
| Median Household Income | $2,499 | $13 |
| Monthly Housing Costs | $648 | $0 |
| Real Estate Taxes | $5,999 | $0 |
Property Value by Mortgage Status in La Paloma Lost Creek
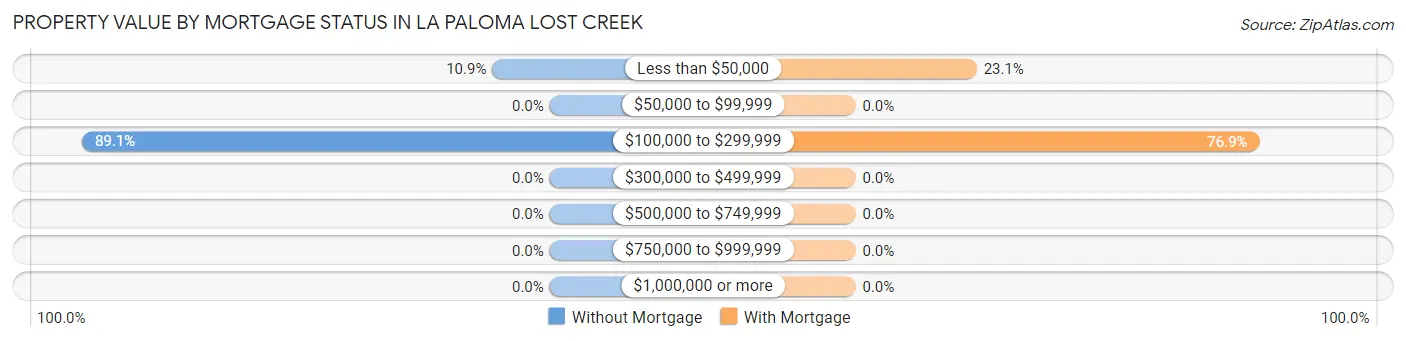
| Property Value | Without Mortgage | With Mortgage |
| Less than $50,000 | 27 (10.9%) | 6 (23.1%) |
| $50,000 to $99,999 | 0 (0.0%) | 0 (0.0%) |
| $100,000 to $299,999 | 220 (89.1%) | 20 (76.9%) |
| $300,000 to $499,999 | 0 (0.0%) | 0 (0.0%) |
| $500,000 to $749,999 | 0 (0.0%) | 0 (0.0%) |
| $750,000 to $999,999 | 0 (0.0%) | 0 (0.0%) |
| $1,000,000 or more | 0 (0.0%) | 0 (0.0%) |
| Total | 247 (100.0%) | 26 (100.0%) |
Household Income by Mortgage Status in La Paloma Lost Creek
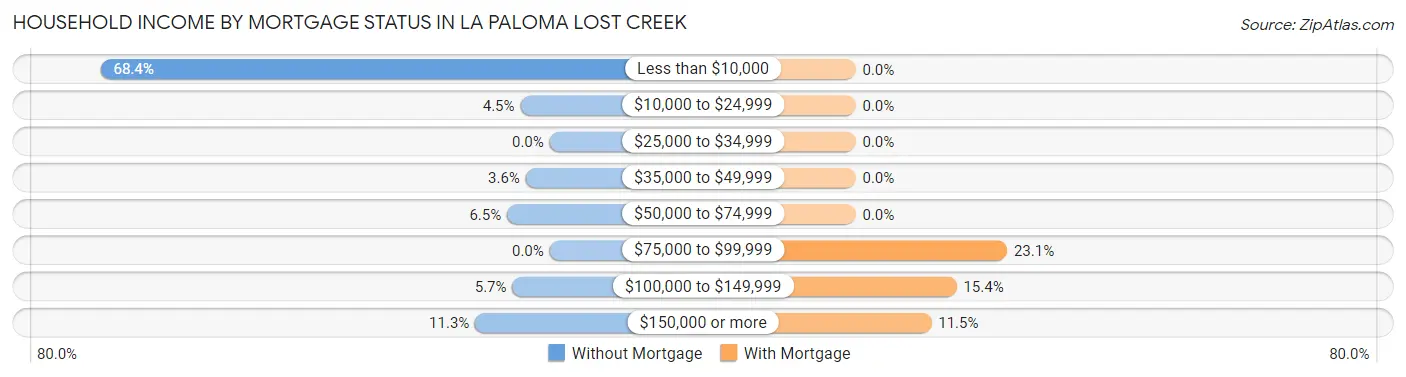
| Household Income | Without Mortgage | With Mortgage |
| Less than $10,000 | 169 (68.4%) | 0 (0.0%) |
| $10,000 to $24,999 | 11 (4.4%) | 0 (0.0%) |
| $25,000 to $34,999 | 0 (0.0%) | 0 (0.0%) |
| $35,000 to $49,999 | 9 (3.6%) | 0 (0.0%) |
| $50,000 to $74,999 | 16 (6.5%) | 0 (0.0%) |
| $75,000 to $99,999 | 0 (0.0%) | 6 (23.1%) |
| $100,000 to $149,999 | 14 (5.7%) | 4 (15.4%) |
| $150,000 or more | 28 (11.3%) | 3 (11.5%) |
| Total | 247 (100.0%) | 26 (100.0%) |
Property Value to Household Income Ratio in La Paloma Lost Creek
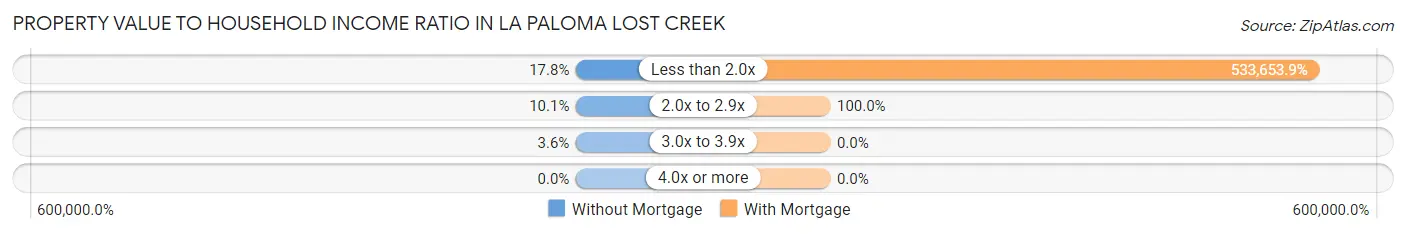
| Value-to-Income Ratio | Without Mortgage | With Mortgage |
| Less than 2.0x | 44 (17.8%) | 138,750 (533,653.8%) |
| 2.0x to 2.9x | 25 (10.1%) | 26 (100.0%) |
| 3.0x to 3.9x | 9 (3.6%) | 0 (0.0%) |
| 4.0x or more | 0 (0.0%) | 0 (0.0%) |
| Total | 247 (100.0%) | 26 (100.0%) |
Real Estate Taxes by Mortgage Status in La Paloma Lost Creek
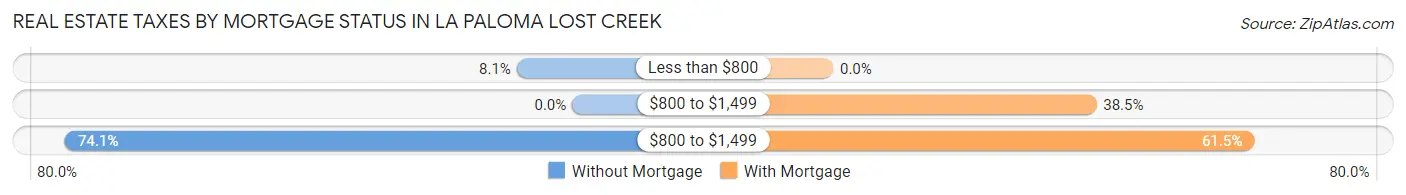
| Property Taxes | Without Mortgage | With Mortgage |
| Less than $800 | 20 (8.1%) | 0 (0.0%) |
| $800 to $1,499 | 0 (0.0%) | 10 (38.5%) |
| $800 to $1,499 | 183 (74.1%) | 16 (61.5%) |
| Total | 247 (100.0%) | 26 (100.0%) |
Health & Disability in La Paloma Lost Creek
Health Insurance Coverage by Age in La Paloma Lost Creek
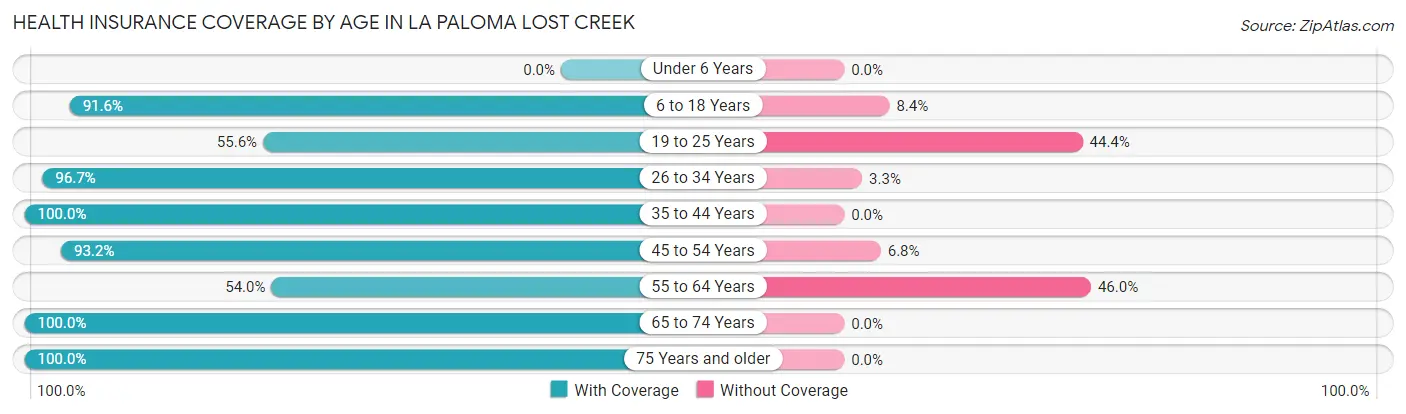
| Age Bracket | With Coverage | Without Coverage |
| Under 6 Years | 0 (0.0%) | 0 (0.0%) |
| 6 to 18 Years | 87 (91.6%) | 8 (8.4%) |
| 19 to 25 Years | 5 (55.6%) | 4 (44.4%) |
| 26 to 34 Years | 174 (96.7%) | 6 (3.3%) |
| 35 to 44 Years | 13 (100.0%) | 0 (0.0%) |
| 45 to 54 Years | 178 (93.2%) | 13 (6.8%) |
| 55 to 64 Years | 27 (54.0%) | 23 (46.0%) |
| 65 to 74 Years | 28 (100.0%) | 0 (0.0%) |
| 75 Years and older | 31 (100.0%) | 0 (0.0%) |
| Total | 543 (90.9%) | 54 (9.0%) |
Health Insurance Coverage by Citizenship Status in La Paloma Lost Creek

| Citizenship Status | With Coverage | Without Coverage |
| Native Born | 0 (0.0%) | 0 (0.0%) |
| Foreign Born, Citizen | 87 (91.6%) | 8 (8.4%) |
| Foreign Born, not a Citizen | 5 (55.6%) | 4 (44.4%) |
Health Insurance Coverage by Household Income in La Paloma Lost Creek
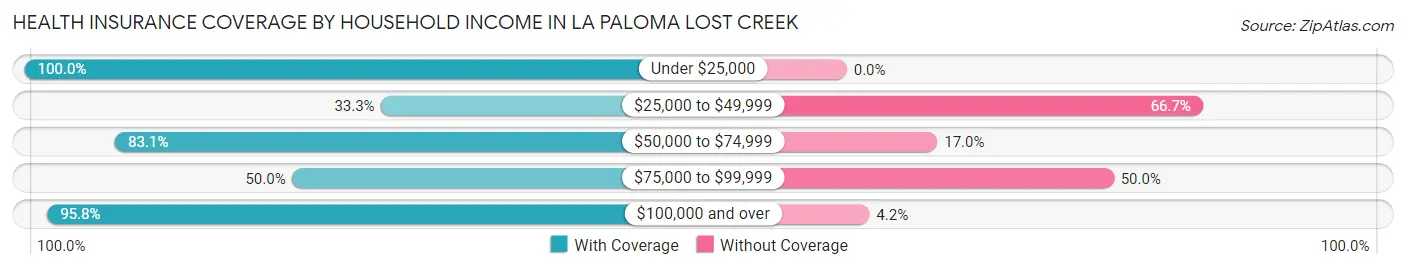
| Household Income | With Coverage | Without Coverage |
| Under $25,000 | 202 (100.0%) | 0 (0.0%) |
| $25,000 to $49,999 | 14 (33.3%) | 28 (66.7%) |
| $50,000 to $74,999 | 49 (83.1%) | 10 (17.0%) |
| $75,000 to $99,999 | 4 (50.0%) | 4 (50.0%) |
| $100,000 and over | 271 (95.8%) | 12 (4.2%) |
Public vs Private Health Insurance Coverage by Age in La Paloma Lost Creek
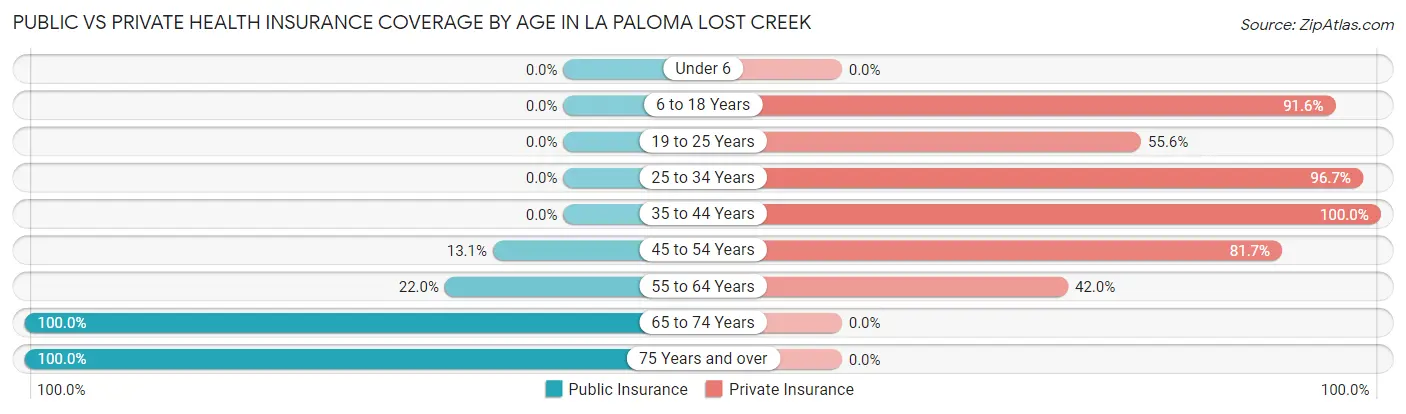
| Age Bracket | Public Insurance | Private Insurance |
| Under 6 | 0 (0.0%) | 0 (0.0%) |
| 6 to 18 Years | 0 (0.0%) | 87 (91.6%) |
| 19 to 25 Years | 0 (0.0%) | 5 (55.6%) |
| 25 to 34 Years | 0 (0.0%) | 174 (96.7%) |
| 35 to 44 Years | 0 (0.0%) | 13 (100.0%) |
| 45 to 54 Years | 25 (13.1%) | 156 (81.7%) |
| 55 to 64 Years | 11 (22.0%) | 21 (42.0%) |
| 65 to 74 Years | 28 (100.0%) | 0 (0.0%) |
| 75 Years and over | 31 (100.0%) | 0 (0.0%) |
| Total | 95 (15.9%) | 456 (76.4%) |
Disability Status by Sex by Age in La Paloma Lost Creek
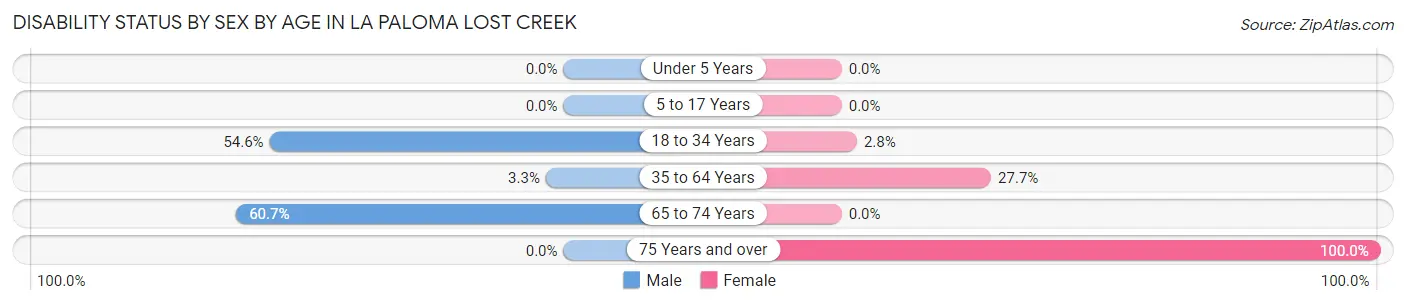
| Age Bracket | Male | Female |
| Under 5 Years | 0 (0.0%) | 0 (0.0%) |
| 5 to 17 Years | 0 (0.0%) | 0 (0.0%) |
| 18 to 34 Years | 6 (54.5%) | 5 (2.8%) |
| 35 to 64 Years | 5 (3.3%) | 28 (27.7%) |
| 65 to 74 Years | 17 (60.7%) | 0 (0.0%) |
| 75 Years and over | 0 (0.0%) | 31 (100.0%) |
Disability Class by Sex by Age in La Paloma Lost Creek
Disability Class: Hearing Difficulty
| Age Bracket | Male | Female |
| Under 5 Years | 0 (0.0%) | 0 (0.0%) |
| 5 to 17 Years | 0 (0.0%) | 0 (0.0%) |
| 18 to 34 Years | 0 (0.0%) | 0 (0.0%) |
| 35 to 64 Years | 0 (0.0%) | 0 (0.0%) |
| 65 to 74 Years | 0 (0.0%) | 0 (0.0%) |
| 75 Years and over | 0 (0.0%) | 0 (0.0%) |
Disability Class: Vision Difficulty
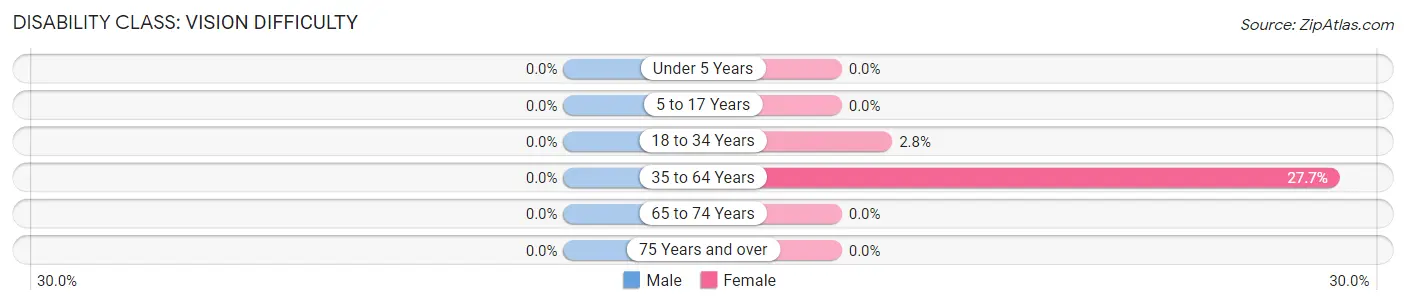
| Age Bracket | Male | Female |
| Under 5 Years | 0 (0.0%) | 0 (0.0%) |
| 5 to 17 Years | 0 (0.0%) | 0 (0.0%) |
| 18 to 34 Years | 0 (0.0%) | 5 (2.8%) |
| 35 to 64 Years | 0 (0.0%) | 28 (27.7%) |
| 65 to 74 Years | 0 (0.0%) | 0 (0.0%) |
| 75 Years and over | 0 (0.0%) | 0 (0.0%) |
Disability Class: Cognitive Difficulty
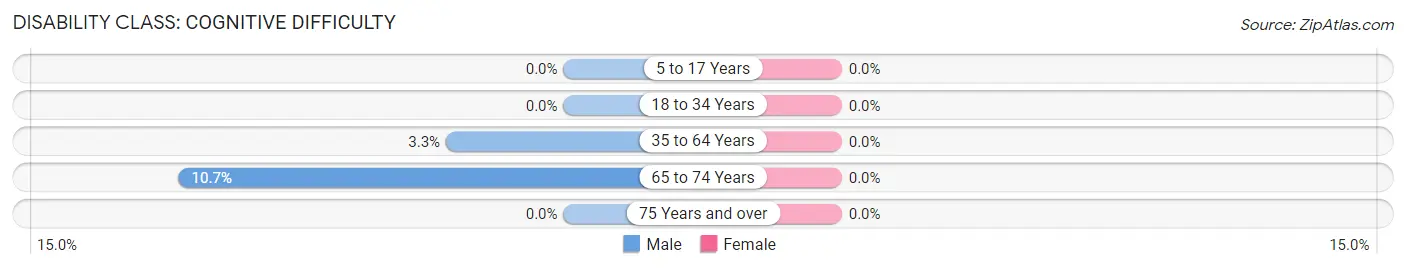
| Age Bracket | Male | Female |
| 5 to 17 Years | 0 (0.0%) | 0 (0.0%) |
| 18 to 34 Years | 0 (0.0%) | 0 (0.0%) |
| 35 to 64 Years | 5 (3.3%) | 0 (0.0%) |
| 65 to 74 Years | 3 (10.7%) | 0 (0.0%) |
| 75 Years and over | 0 (0.0%) | 0 (0.0%) |
Disability Class: Ambulatory Difficulty
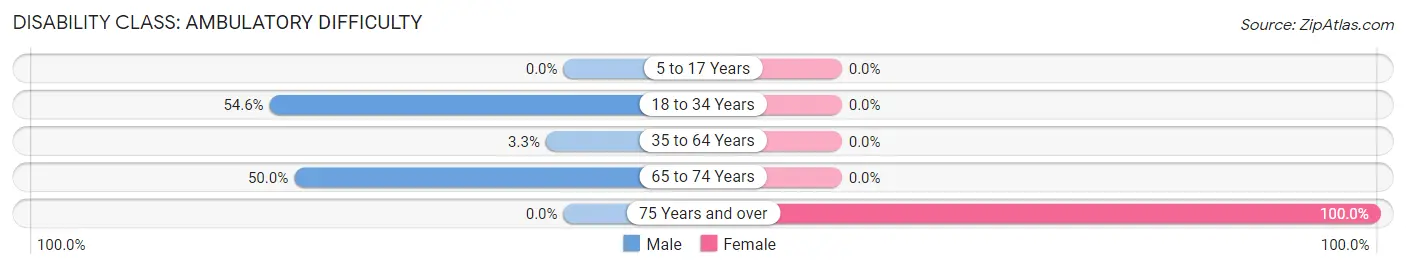
| Age Bracket | Male | Female |
| 5 to 17 Years | 0 (0.0%) | 0 (0.0%) |
| 18 to 34 Years | 6 (54.5%) | 0 (0.0%) |
| 35 to 64 Years | 5 (3.3%) | 0 (0.0%) |
| 65 to 74 Years | 14 (50.0%) | 0 (0.0%) |
| 75 Years and over | 0 (0.0%) | 31 (100.0%) |
Disability Class: Self-Care Difficulty
| Age Bracket | Male | Female |
| 5 to 17 Years | 0 (0.0%) | 0 (0.0%) |
| 18 to 34 Years | 0 (0.0%) | 0 (0.0%) |
| 35 to 64 Years | 0 (0.0%) | 0 (0.0%) |
| 65 to 74 Years | 0 (0.0%) | 0 (0.0%) |
| 75 Years and over | 0 (0.0%) | 0 (0.0%) |
Technology Access in La Paloma Lost Creek
Computing Device Access in La Paloma Lost Creek
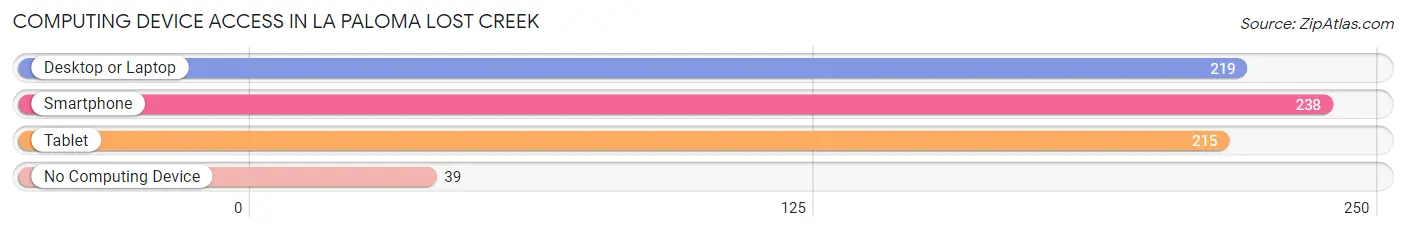
| Device Type | # Households | % Households |
| Desktop or Laptop | 219 | 77.4% |
| Smartphone | 238 | 84.1% |
| Tablet | 215 | 76.0% |
| No Computing Device | 39 | 13.8% |
| Total | 283 | 100.0% |
Internet Access in La Paloma Lost Creek
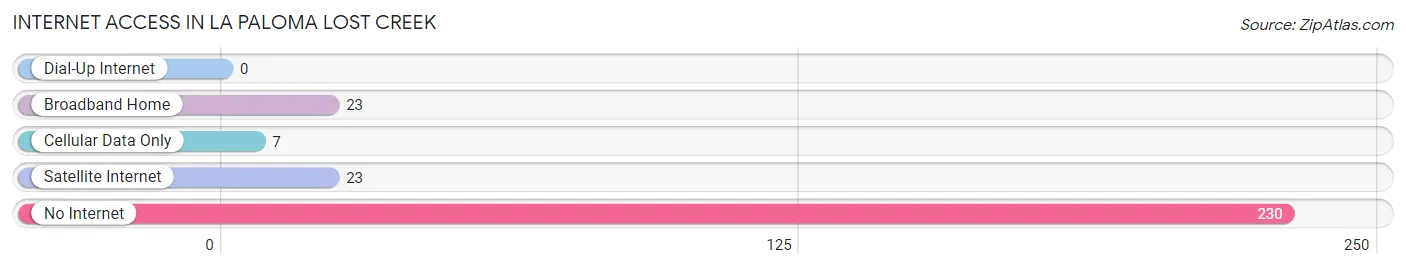
| Internet Type | # Households | % Households |
| Dial-Up Internet | 0 | 0.0% |
| Broadband Home | 23 | 8.1% |
| Cellular Data Only | 7 | 2.5% |
| Satellite Internet | 23 | 8.1% |
| No Internet | 230 | 81.3% |
| Total | 283 | 100.0% |
La Paloma Lost Creek Summary
La Paloma is a small unincorporated community located in Lost Creek, Texas, in the United States. It is situated in the western part of Travis County, approximately 20 miles west of Austin. The community is located along the banks of the Colorado River, and is home to a population of approximately 500 people.
History
La Paloma was first settled in the late 1800s by a group of Mexican immigrants who were looking for a place to call home. The area was originally known as “La Paloma de los Pinos”, which translates to “The Dove of the Pines”. The name was chosen to honor the many doves that were seen in the area.
The first settlers of La Paloma were mostly farmers and ranchers, and the community quickly grew to include a post office, a general store, and a school. The school was built in the early 1900s and served as the primary source of education for the children of La Paloma.
In the early 1900s, the community was also home to a number of businesses, including a blacksmith shop, a livery stable, and a saloon. The saloon was a popular gathering place for the locals, and it was here that the first La Paloma rodeo was held in 1912.
Geography
La Paloma is located in the western part of Travis County, approximately 20 miles west of Austin. The community is situated along the banks of the Colorado River, and is surrounded by rolling hills and lush vegetation. The area is known for its mild climate and abundant wildlife, including deer, wild turkeys, and a variety of birds.
The terrain of La Paloma is mostly flat, with some areas of rolling hills. The soil is mostly sandy loam, and the area is known for its fertile farmland. The community is also home to a number of creeks and streams, which provide a source of water for the local residents.
Economy
The economy of La Paloma is largely based on agriculture. The area is known for its fertile farmland, and the local farmers grow a variety of crops, including corn, wheat, and hay. The area is also home to a number of cattle ranches, and the local ranchers raise beef cattle for sale.
In addition to agriculture, the local economy is also supported by a number of small businesses, including a general store, a post office, and a few restaurants. The community is also home to a number of churches, and the local residents are active in their faith.
Demographics
As of the 2010 census, the population of La Paloma was approximately 500 people. The racial makeup of the community was 94.2% White, 0.8% African American, 0.4% Native American, 0.2% Asian, and 4.4% from other races. The median household income was $45,000, and the median age was 37.
The majority of the population of La Paloma is of Hispanic or Latino origin. The local residents are mostly Catholic, and the community is home to a number of churches. The local schools are part of the Austin Independent School District, and the community is served by a number of local businesses.
Common Questions
What is Per Capita Income in La Paloma Lost Creek?
Per Capita income in La Paloma Lost Creek is $22,179.
What is the Median Household income in La Paloma Lost Creek?
Median Household Income in La Paloma Lost Creek is $2,499.
What is Income or Wage Gap in La Paloma Lost Creek?
Income or Wage Gap in La Paloma Lost Creek is 4.8%.
Women in La Paloma Lost Creek earn 95.2 cents for every dollar earned by a man.
What is Inequality or Gini Index in La Paloma Lost Creek?
Inequality or Gini Index in La Paloma Lost Creek is 0.75.
What is the Total Population of La Paloma Lost Creek?
Total Population of La Paloma Lost Creek is 621.
What is the Total Male Population of La Paloma Lost Creek?
Total Male Population of La Paloma Lost Creek is 280.
What is the Total Female Population of La Paloma Lost Creek?
Total Female Population of La Paloma Lost Creek is 341.
What is the Ratio of Males per 100 Females in La Paloma Lost Creek?
There are 82.11 Males per 100 Females in La Paloma Lost Creek.
What is the Ratio of Females per 100 Males in La Paloma Lost Creek?
There are 121.79 Females per 100 Males in La Paloma Lost Creek.
What is the Median Population Age in La Paloma Lost Creek?
Median Population Age in La Paloma Lost Creek is 44.5 Years.
What is the Average Family Size in La Paloma Lost Creek
Average Family Size in La Paloma Lost Creek is 4.6 People.
What is the Average Household Size in La Paloma Lost Creek
Average Household Size in La Paloma Lost Creek is 2.1 People.
How Large is the Labor Force in La Paloma Lost Creek?
There are 236 People in the Labor Forcein in La Paloma Lost Creek.
What is the Percentage of People in the Labor Force in La Paloma Lost Creek?
43.9% of People are in the Labor Force in La Paloma Lost Creek.
What is the Unemployment Rate in La Paloma Lost Creek?
Unemployment Rate in La Paloma Lost Creek is 3.8%.