Zip Codes with the Highest Percentage of Population Employed in Transportation & Warehousing in Fort Worth, TX
RELATED REPORTS & OPTIONS
Transportation & Warehousing
Fort Worth
Compare Zip Codes
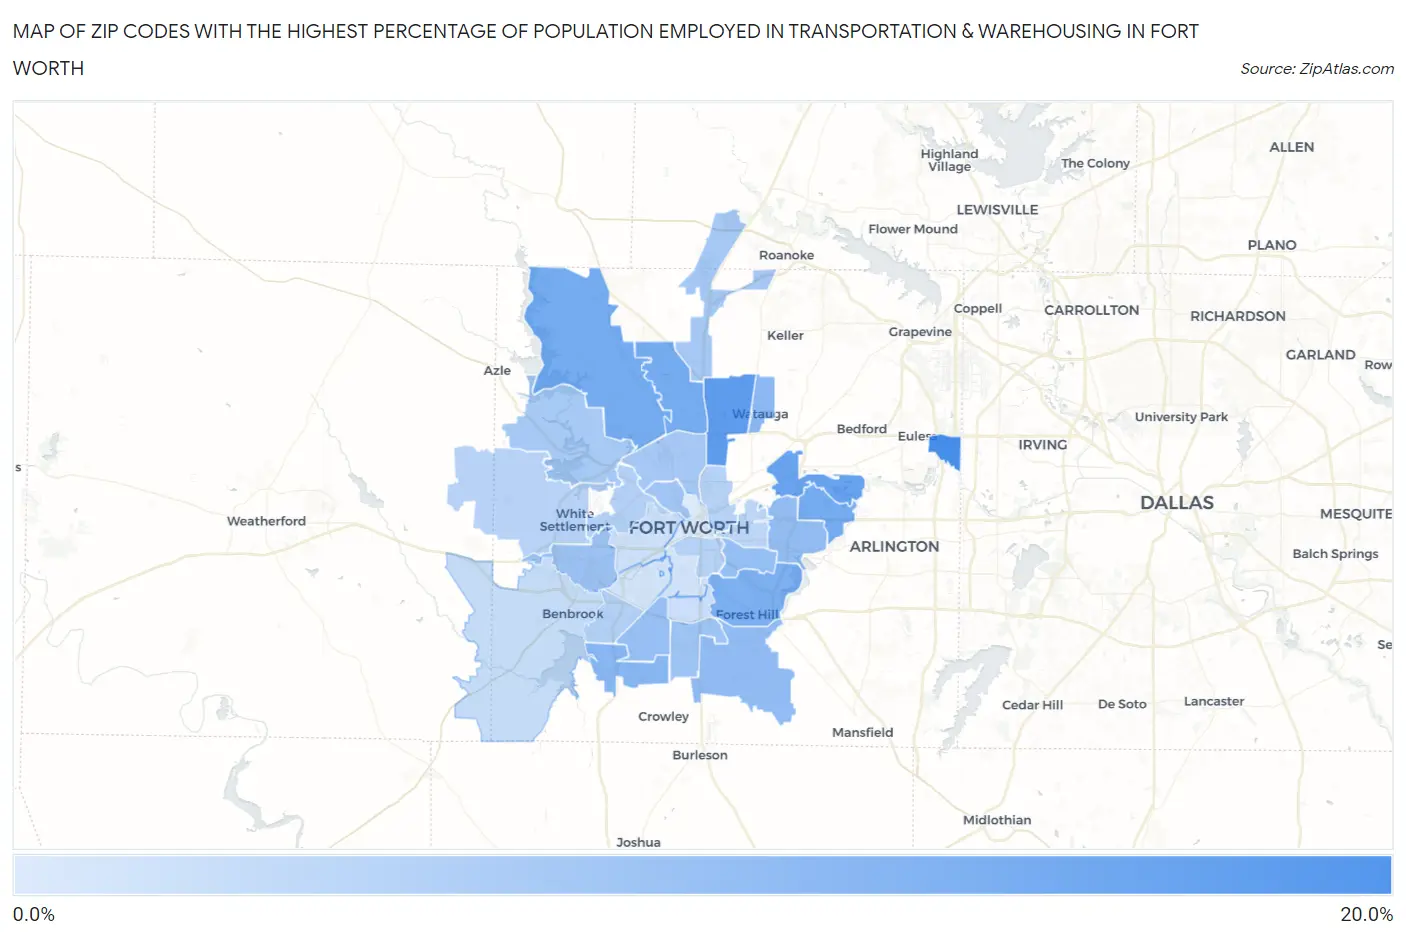
Map of Zip Codes with the Highest Percentage of Population Employed in Transportation & Warehousing in Fort Worth
2.6%
15.5%
Zip Codes with the Highest Percentage of Population Employed in Transportation & Warehousing in Fort Worth, TX
| Zip Code | % Employed | vs State | vs National | |
| 1. | 76155 | 15.5% | 5.5%(+10.0)#64 | 4.9%(+10.6)#971 |
| 2. | 76137 | 13.4% | 5.5%(+7.94)#92 | 4.9%(+8.49)#1,409 |
| 3. | 76118 | 12.5% | 5.5%(+6.96)#115 | 4.9%(+7.51)#1,697 |
| 4. | 76131 | 11.4% | 5.5%(+5.89)#148 | 4.9%(+6.45)#2,126 |
| 5. | 76120 | 11.4% | 5.5%(+5.87)#149 | 4.9%(+6.43)#2,134 |
| 6. | 76179 | 11.3% | 5.5%(+5.79)#152 | 4.9%(+6.34)#2,184 |
| 7. | 76119 | 10.8% | 5.5%(+5.32)#165 | 4.9%(+5.88)#2,407 |
| 8. | 76123 | 9.7% | 5.5%(+4.19)#226 | 4.9%(+4.75)#3,079 |
| 9. | 76148 | 9.4% | 5.5%(+3.87)#242 | 4.9%(+4.43)#3,338 |
| 10. | 76140 | 8.9% | 5.5%(+3.40)#275 | 4.9%(+3.95)#3,808 |
| 11. | 76112 | 8.8% | 5.5%(+3.28)#283 | 4.9%(+3.83)#3,952 |
| 12. | 76105 | 8.5% | 5.5%(+3.02)#298 | 4.9%(+3.57)#4,251 |
| 13. | 76133 | 8.4% | 5.5%(+2.91)#308 | 4.9%(+3.47)#4,373 |
| 14. | 76116 | 8.0% | 5.5%(+2.54)#341 | 4.9%(+3.09)#4,838 |
| 15. | 76134 | 7.8% | 5.5%(+2.34)#362 | 4.9%(+2.90)#5,125 |
| 16. | 76164 | 7.5% | 5.5%(+2.00)#398 | 4.9%(+2.55)#5,650 |
| 17. | 76177 | 7.3% | 5.5%(+1.76)#425 | 4.9%(+2.32)#6,074 |
| 18. | 76106 | 7.2% | 5.5%(+1.74)#429 | 4.9%(+2.30)#6,108 |
| 19. | 76135 | 7.0% | 5.5%(+1.47)#467 | 4.9%(+2.02)#6,619 |
| 20. | 76132 | 6.0% | 5.5%(+0.540)#613 | 4.9%(+1.10)#8,688 |
| 21. | 76114 | 5.9% | 5.5%(+0.428)#624 | 4.9%(+0.983)#8,953 |
| 22. | 76111 | 5.8% | 5.5%(+0.278)#658 | 4.9%(+0.834)#9,400 |
| 23. | 76104 | 5.7% | 5.5%(+0.230)#668 | 4.9%(+0.785)#9,567 |
| 24. | 76108 | 5.6% | 5.5%(+0.067)#705 | 4.9%(+0.622)#10,038 |
| 25. | 76103 | 5.3% | 5.5%(-0.208)#762 | 4.9%(+0.348)#10,935 |
| 26. | 76126 | 4.5% | 5.5%(-0.979)#924 | 4.9%(-0.424)#13,718 |
| 27. | 76115 | 4.1% | 5.5%(-1.38)#1,024 | 4.9%(-0.824)#15,370 |
| 28. | 76107 | 4.0% | 5.5%(-1.55)#1,061 | 4.9%(-0.993)#16,114 |
| 29. | 76110 | 3.5% | 5.5%(-2.05)#1,190 | 4.9%(-1.49)#18,261 |
| 30. | 76109 | 3.4% | 5.5%(-2.10)#1,203 | 4.9%(-1.55)#18,495 |
| 31. | 76102 | 2.6% | 5.5%(-2.92)#1,417 | 4.9%(-2.36)#22,037 |
1
Common Questions
What are the Top 10 Zip Codes with the Highest Percentage of Population Employed in Transportation & Warehousing in Fort Worth, TX?
Top 10 Zip Codes with the Highest Percentage of Population Employed in Transportation & Warehousing in Fort Worth, TX are:
What zip code has the Highest Percentage of Population Employed in Transportation & Warehousing in Fort Worth, TX?
76155 has the Highest Percentage of Population Employed in Transportation & Warehousing in Fort Worth, TX with 15.5%.
What is the Percentage of Population Employed in Transportation & Warehousing in Fort Worth, TX?
Percentage of Population Employed in Transportation & Warehousing in Fort Worth is 8.7%.
What is the Percentage of Population Employed in Transportation & Warehousing in Texas?
Percentage of Population Employed in Transportation & Warehousing in Texas is 5.5%.
What is the Percentage of Population Employed in Transportation & Warehousing in the United States?
Percentage of Population Employed in Transportation & Warehousing in the United States is 4.9%.