Zip Codes with the Highest Percentage of Population Employed in Transportation & Warehousing in Amarillo, TX
RELATED REPORTS & OPTIONS
Transportation & Warehousing
Amarillo
Compare Zip Codes
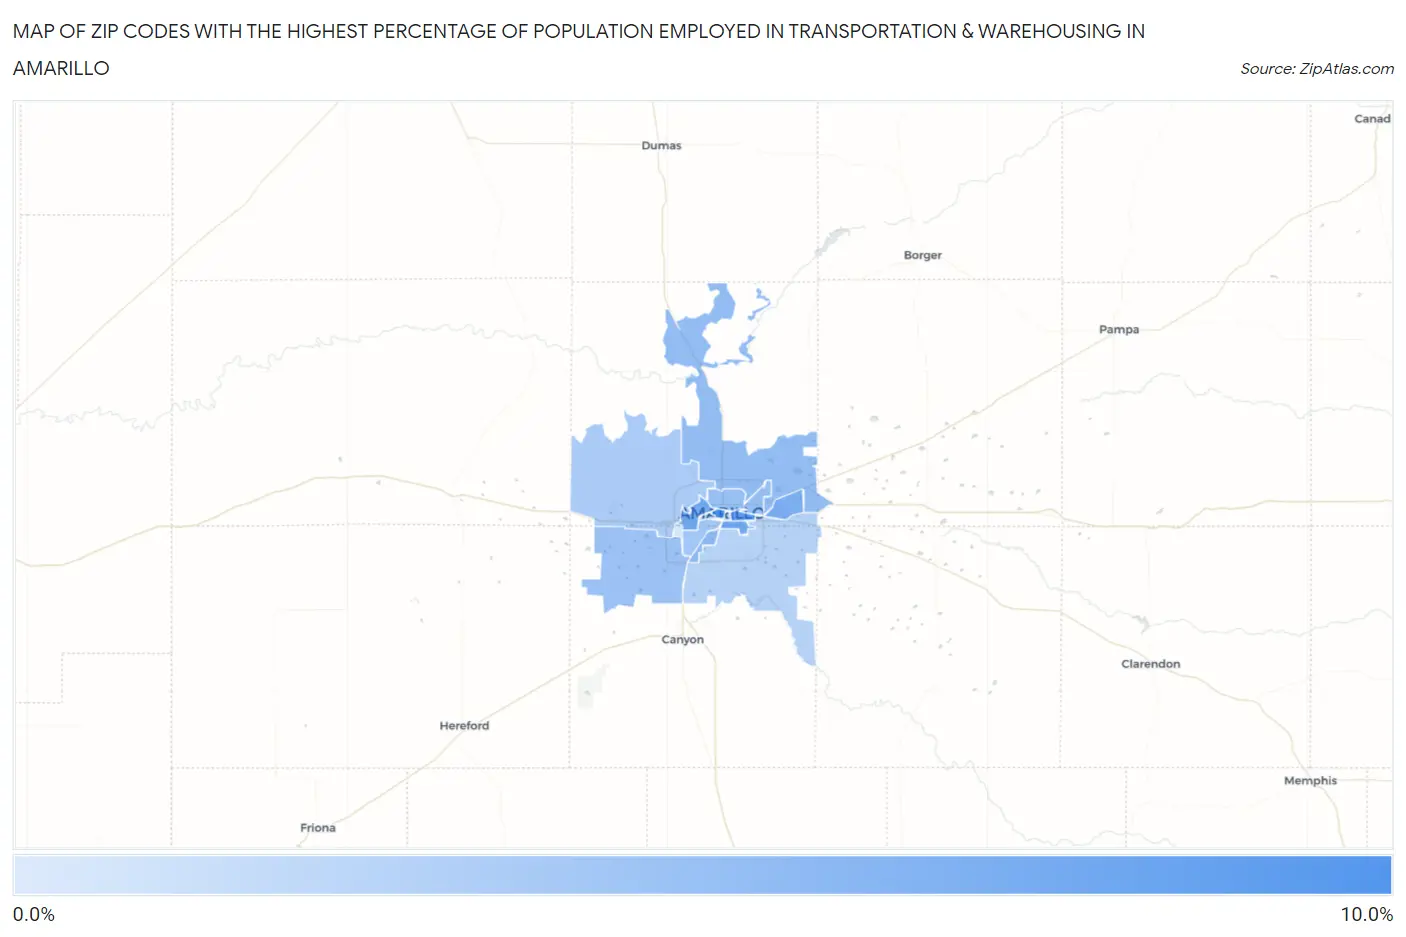
Map of Zip Codes with the Highest Percentage of Population Employed in Transportation & Warehousing in Amarillo
1.5%
9.1%
Zip Codes with the Highest Percentage of Population Employed in Transportation & Warehousing in Amarillo, TX
| Zip Code | % Employed | vs State | vs National | |
| 1. | 79101 | 9.1% | 5.5%(+3.58)#261 | 4.9%(+4.13)#3,623 |
| 2. | 79104 | 7.7% | 5.5%(+2.24)#373 | 4.9%(+2.80)#5,260 |
| 3. | 79103 | 6.8% | 5.5%(+1.27)#498 | 4.9%(+1.82)#7,032 |
| 4. | 79106 | 6.7% | 5.5%(+1.20)#513 | 4.9%(+1.75)#7,168 |
| 5. | 79111 | 6.5% | 5.5%(+0.960)#535 | 4.9%(+1.52)#7,648 |
| 6. | 79110 | 5.6% | 5.5%(+0.067)#706 | 4.9%(+0.622)#10,039 |
| 7. | 79108 | 5.2% | 5.5%(-0.287)#778 | 4.9%(+0.268)#11,191 |
| 8. | 79107 | 4.9% | 5.5%(-0.573)#842 | 4.9%(-0.017)#12,170 |
| 9. | 79119 | 4.8% | 5.5%(-0.712)#871 | 4.9%(-0.157)#12,688 |
| 10. | 79109 | 4.4% | 5.5%(-1.09)#949 | 4.9%(-0.535)#14,110 |
| 11. | 79124 | 4.1% | 5.5%(-1.44)#1,036 | 4.9%(-0.881)#15,621 |
| 12. | 79102 | 3.6% | 5.5%(-1.89)#1,150 | 4.9%(-1.33)#17,597 |
| 13. | 79118 | 3.4% | 5.5%(-2.10)#1,200 | 4.9%(-1.54)#18,469 |
| 14. | 79121 | 1.5% | 5.5%(-3.96)#1,560 | 4.9%(-3.40)#25,716 |
1
Common Questions
What are the Top 10 Zip Codes with the Highest Percentage of Population Employed in Transportation & Warehousing in Amarillo, TX?
Top 10 Zip Codes with the Highest Percentage of Population Employed in Transportation & Warehousing in Amarillo, TX are:
What zip code has the Highest Percentage of Population Employed in Transportation & Warehousing in Amarillo, TX?
79101 has the Highest Percentage of Population Employed in Transportation & Warehousing in Amarillo, TX with 9.1%.
What is the Percentage of Population Employed in Transportation & Warehousing in Amarillo, TX?
Percentage of Population Employed in Transportation & Warehousing in Amarillo is 4.9%.
What is the Percentage of Population Employed in Transportation & Warehousing in Texas?
Percentage of Population Employed in Transportation & Warehousing in Texas is 5.5%.
What is the Percentage of Population Employed in Transportation & Warehousing in the United States?
Percentage of Population Employed in Transportation & Warehousing in the United States is 4.9%.