Zip Codes with the Highest Percentage of Population Employed in Transportation & Warehousing in Houston, TX
RELATED REPORTS & OPTIONS
Transportation & Warehousing
Houston
Compare Zip Codes
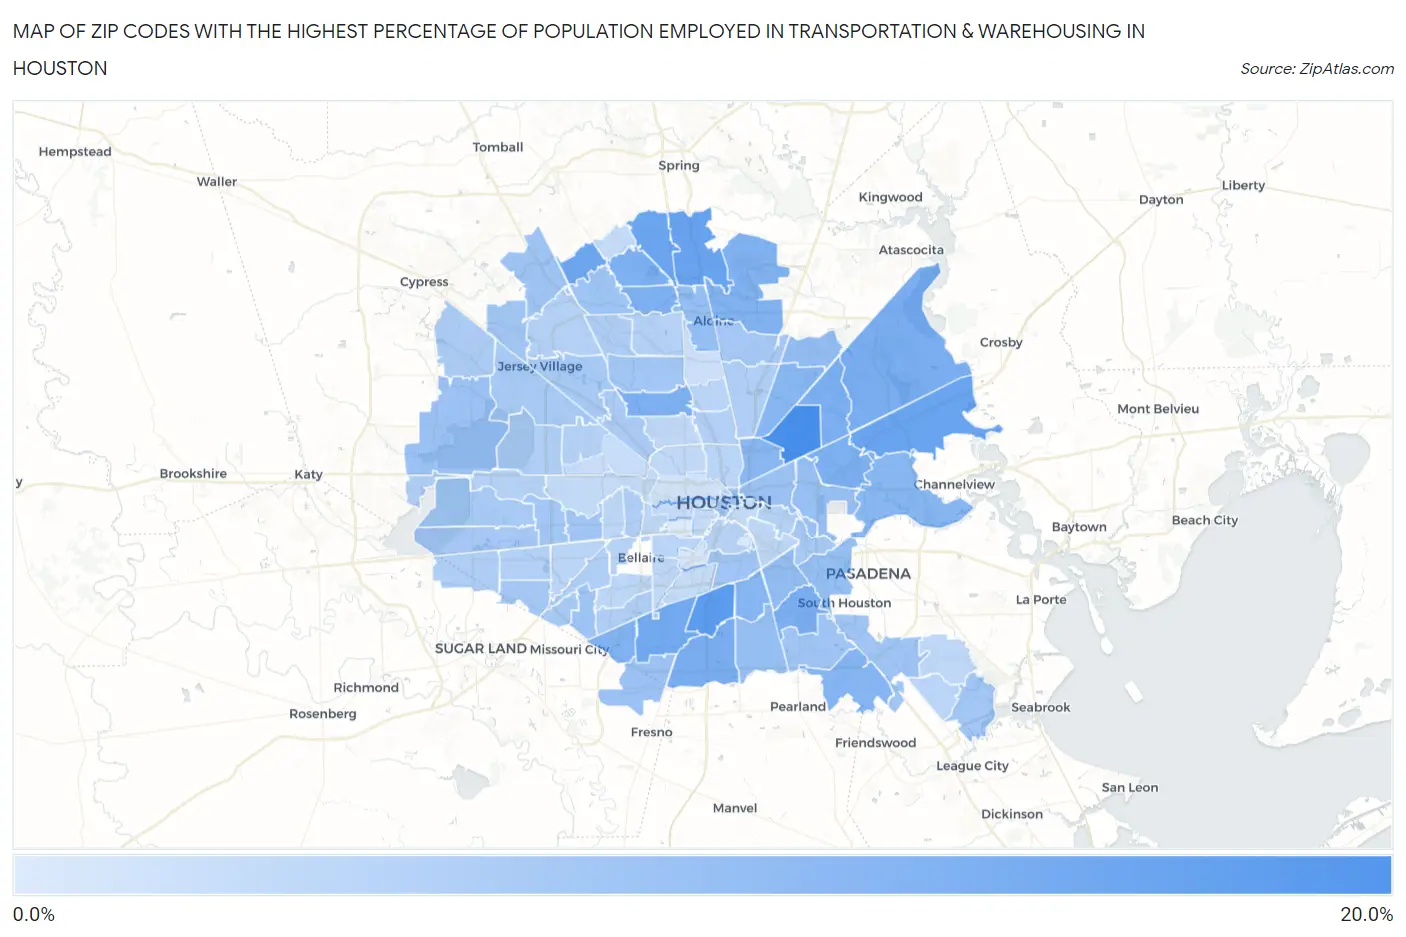
Map of Zip Codes with the Highest Percentage of Population Employed in Transportation & Warehousing in Houston
0.61%
15.2%
Zip Codes with the Highest Percentage of Population Employed in Transportation & Warehousing in Houston, TX
| Zip Code | % Employed | vs State | vs National | |
| 1. | 77028 | 15.2% | 5.5%(+9.68)#68 | 4.9%(+10.2)#1,024 |
| 2. | 77051 | 13.3% | 5.5%(+7.77)#95 | 4.9%(+8.32)#1,460 |
| 3. | 77073 | 12.0% | 5.5%(+6.48)#130 | 4.9%(+7.03)#1,872 |
| 4. | 77049 | 11.6% | 5.5%(+6.09)#140 | 4.9%(+6.65)#2,026 |
| 5. | 77090 | 11.4% | 5.5%(+5.94)#145 | 4.9%(+6.49)#2,098 |
| 6. | 77069 | 11.2% | 5.5%(+5.68)#157 | 4.9%(+6.23)#2,242 |
| 7. | 77045 | 10.6% | 5.5%(+5.13)#175 | 4.9%(+5.68)#2,513 |
| 8. | 77044 | 10.1% | 5.5%(+4.57)#204 | 4.9%(+5.12)#2,843 |
| 9. | 77047 | 10.0% | 5.5%(+4.53)#208 | 4.9%(+5.08)#2,861 |
| 10. | 77091 | 9.9% | 5.5%(+4.40)#214 | 4.9%(+4.96)#2,949 |
| 11. | 77014 | 9.9% | 5.5%(+4.40)#215 | 4.9%(+4.96)#2,952 |
| 12. | 77061 | 9.8% | 5.5%(+4.27)#223 | 4.9%(+4.83)#3,027 |
| 13. | 77078 | 9.7% | 5.5%(+4.24)#224 | 4.9%(+4.79)#3,048 |
| 14. | 77067 | 9.6% | 5.5%(+4.13)#230 | 4.9%(+4.69)#3,135 |
| 15. | 77013 | 9.5% | 5.5%(+3.99)#237 | 4.9%(+4.55)#3,245 |
| 16. | 77032 | 9.3% | 5.5%(+3.83)#245 | 4.9%(+4.39)#3,367 |
| 17. | 77085 | 9.3% | 5.5%(+3.80)#248 | 4.9%(+4.36)#3,389 |
| 18. | 77033 | 9.0% | 5.5%(+3.47)#269 | 4.9%(+4.02)#3,730 |
| 19. | 77089 | 8.9% | 5.5%(+3.37)#277 | 4.9%(+3.93)#3,851 |
| 20. | 77015 | 8.6% | 5.5%(+3.13)#287 | 4.9%(+3.69)#4,110 |
| 21. | 77016 | 8.6% | 5.5%(+3.09)#288 | 4.9%(+3.65)#4,161 |
| 22. | 77026 | 8.4% | 5.5%(+2.85)#316 | 4.9%(+3.41)#4,440 |
| 23. | 77050 | 7.5% | 5.5%(+2.04)#394 | 4.9%(+2.59)#5,578 |
| 24. | 77087 | 7.4% | 5.5%(+1.93)#404 | 4.9%(+2.48)#5,774 |
| 25. | 77048 | 7.4% | 5.5%(+1.88)#407 | 4.9%(+2.44)#5,851 |
| 26. | 77060 | 7.3% | 5.5%(+1.78)#420 | 4.9%(+2.33)#6,034 |
| 27. | 77017 | 7.2% | 5.5%(+1.73)#433 | 4.9%(+2.28)#6,145 |
| 28. | 77029 | 7.0% | 5.5%(+1.50)#462 | 4.9%(+2.06)#6,547 |
| 29. | 77084 | 6.9% | 5.5%(+1.44)#475 | 4.9%(+2.00)#6,671 |
| 30. | 77020 | 6.8% | 5.5%(+1.34)#486 | 4.9%(+1.89)#6,882 |
| 31. | 77053 | 6.7% | 5.5%(+1.19)#515 | 4.9%(+1.74)#7,179 |
| 32. | 77071 | 6.4% | 5.5%(+0.939)#539 | 4.9%(+1.49)#7,709 |
| 33. | 77066 | 6.4% | 5.5%(+0.873)#551 | 4.9%(+1.43)#7,873 |
| 34. | 77063 | 6.3% | 5.5%(+0.774)#566 | 4.9%(+1.33)#8,102 |
| 35. | 77021 | 6.2% | 5.5%(+0.712)#578 | 4.9%(+1.27)#8,253 |
| 36. | 77034 | 6.2% | 5.5%(+0.689)#582 | 4.9%(+1.24)#8,314 |
| 37. | 77002 | 6.2% | 5.5%(+0.677)#586 | 4.9%(+1.23)#8,342 |
| 38. | 77070 | 6.2% | 5.5%(+0.661)#588 | 4.9%(+1.22)#8,369 |
| 39. | 77075 | 6.1% | 5.5%(+0.635)#595 | 4.9%(+1.19)#8,443 |
| 40. | 77065 | 6.1% | 5.5%(+0.578)#604 | 4.9%(+1.13)#8,582 |
| 41. | 77042 | 6.1% | 5.5%(+0.564)#610 | 4.9%(+1.12)#8,629 |
| 42. | 77058 | 6.0% | 5.5%(+0.505)#616 | 4.9%(+1.06)#8,768 |
| 43. | 77088 | 5.9% | 5.5%(+0.385)#636 | 4.9%(+0.940)#9,070 |
| 44. | 77099 | 5.8% | 5.5%(+0.273)#660 | 4.9%(+0.828)#9,421 |
| 45. | 77039 | 5.7% | 5.5%(+0.190)#672 | 4.9%(+0.746)#9,677 |
| 46. | 77046 | 5.7% | 5.5%(+0.165)#681 | 4.9%(+0.720)#9,765 |
| 47. | 77082 | 5.7% | 5.5%(+0.155)#684 | 4.9%(+0.711)#9,793 |
| 48. | 77041 | 5.6% | 5.5%(+0.115)#695 | 4.9%(+0.671)#9,910 |
| 49. | 77031 | 5.6% | 5.5%(+0.060)#708 | 4.9%(+0.615)#10,059 |
| 50. | 77040 | 5.5% | 5.5%(+0.042)#715 | 4.9%(+0.597)#10,123 |
| 51. | 77012 | 5.5% | 5.5%(-0.003)#724 | 4.9%(+0.552)#10,249 |
| 52. | 77077 | 5.5% | 5.5%(-0.013)#727 | 4.9%(+0.542)#10,280 |
| 53. | 77092 | 5.4% | 5.5%(-0.103)#743 | 4.9%(+0.452)#10,576 |
| 54. | 77095 | 5.2% | 5.5%(-0.329)#784 | 4.9%(+0.226)#11,349 |
| 55. | 77086 | 4.9% | 5.5%(-0.552)#838 | 4.9%(+0.004)#12,097 |
| 56. | 77083 | 4.9% | 5.5%(-0.572)#840 | 4.9%(-0.016)#12,164 |
| 57. | 77035 | 4.8% | 5.5%(-0.682)#867 | 4.9%(-0.126)#12,552 |
| 58. | 77094 | 4.7% | 5.5%(-0.842)#891 | 4.9%(-0.287)#13,177 |
| 59. | 77074 | 4.7% | 5.5%(-0.847)#894 | 4.9%(-0.291)#13,192 |
| 60. | 77093 | 4.6% | 5.5%(-0.878)#904 | 4.9%(-0.323)#13,305 |
| 61. | 77043 | 4.6% | 5.5%(-0.926)#912 | 4.9%(-0.371)#13,504 |
| 62. | 77056 | 4.6% | 5.5%(-0.935)#916 | 4.9%(-0.380)#13,542 |
| 63. | 77022 | 4.5% | 5.5%(-1.02)#935 | 4.9%(-0.466)#13,860 |
| 64. | 77072 | 4.4% | 5.5%(-1.07)#943 | 4.9%(-0.514)#14,026 |
| 65. | 77011 | 4.3% | 5.5%(-1.19)#972 | 4.9%(-0.635)#14,547 |
| 66. | 77079 | 4.3% | 5.5%(-1.21)#975 | 4.9%(-0.654)#14,632 |
| 67. | 77064 | 4.3% | 5.5%(-1.23)#979 | 4.9%(-0.671)#14,700 |
| 68. | 77038 | 4.2% | 5.5%(-1.34)#1,008 | 4.9%(-0.783)#15,188 |
| 69. | 77080 | 4.1% | 5.5%(-1.36)#1,015 | 4.9%(-0.802)#15,273 |
| 70. | 77081 | 4.1% | 5.5%(-1.44)#1,037 | 4.9%(-0.883)#15,637 |
| 71. | 77004 | 4.0% | 5.5%(-1.49)#1,049 | 4.9%(-0.932)#15,847 |
| 72. | 77062 | 3.9% | 5.5%(-1.60)#1,075 | 4.9%(-1.05)#16,362 |
| 73. | 77036 | 3.9% | 5.5%(-1.60)#1,076 | 4.9%(-1.05)#16,367 |
| 74. | 77076 | 3.8% | 5.5%(-1.65)#1,094 | 4.9%(-1.10)#16,568 |
| 75. | 77009 | 3.8% | 5.5%(-1.75)#1,120 | 4.9%(-1.19)#17,003 |
| 76. | 77005 | 3.7% | 5.5%(-1.78)#1,130 | 4.9%(-1.23)#17,145 |
| 77. | 77057 | 3.7% | 5.5%(-1.83)#1,137 | 4.9%(-1.28)#17,336 |
| 78. | 77023 | 3.5% | 5.5%(-2.03)#1,188 | 4.9%(-1.48)#18,207 |
| 79. | 77096 | 3.4% | 5.5%(-2.08)#1,197 | 4.9%(-1.53)#18,419 |
| 80. | 77027 | 3.4% | 5.5%(-2.13)#1,216 | 4.9%(-1.57)#18,598 |
| 81. | 77059 | 3.3% | 5.5%(-2.20)#1,235 | 4.9%(-1.65)#18,924 |
| 82. | 77008 | 3.3% | 5.5%(-2.24)#1,245 | 4.9%(-1.69)#19,095 |
| 83. | 77018 | 3.2% | 5.5%(-2.29)#1,261 | 4.9%(-1.73)#19,322 |
| 84. | 77025 | 3.1% | 5.5%(-2.39)#1,291 | 4.9%(-1.84)#19,751 |
| 85. | 77006 | 3.0% | 5.5%(-2.52)#1,325 | 4.9%(-1.96)#20,322 |
| 86. | 77068 | 3.0% | 5.5%(-2.55)#1,332 | 4.9%(-2.00)#20,465 |
| 87. | 77024 | 2.9% | 5.5%(-2.57)#1,339 | 4.9%(-2.01)#20,531 |
| 88. | 77003 | 2.9% | 5.5%(-2.61)#1,350 | 4.9%(-2.05)#20,708 |
| 89. | 77054 | 2.7% | 5.5%(-2.84)#1,404 | 4.9%(-2.29)#21,737 |
| 90. | 77055 | 2.5% | 5.5%(-2.96)#1,425 | 4.9%(-2.40)#22,204 |
| 91. | 77019 | 2.5% | 5.5%(-3.02)#1,430 | 4.9%(-2.46)#22,457 |
| 92. | 77010 | 2.4% | 5.5%(-3.14)#1,453 | 4.9%(-2.59)#22,964 |
| 93. | 77037 | 2.2% | 5.5%(-3.34)#1,485 | 4.9%(-2.78)#23,701 |
| 94. | 77007 | 1.8% | 5.5%(-3.74)#1,533 | 4.9%(-3.19)#25,087 |
| 95. | 77030 | 1.0% | 5.5%(-4.46)#1,605 | 4.9%(-3.90)#26,918 |
| 96. | 77204 | 0.95% | 5.5%(-4.56)#1,613 | 4.9%(-4.00)#27,120 |
| 97. | 77098 | 0.61% | 5.5%(-4.89)#1,636 | 4.9%(-4.34)#27,661 |
1
Common Questions
What are the Top 10 Zip Codes with the Highest Percentage of Population Employed in Transportation & Warehousing in Houston, TX?
Top 10 Zip Codes with the Highest Percentage of Population Employed in Transportation & Warehousing in Houston, TX are:
What zip code has the Highest Percentage of Population Employed in Transportation & Warehousing in Houston, TX?
77028 has the Highest Percentage of Population Employed in Transportation & Warehousing in Houston, TX with 15.2%.
What is the Percentage of Population Employed in Transportation & Warehousing in Houston, TX?
Percentage of Population Employed in Transportation & Warehousing in Houston is 5.6%.
What is the Percentage of Population Employed in Transportation & Warehousing in Texas?
Percentage of Population Employed in Transportation & Warehousing in Texas is 5.5%.
What is the Percentage of Population Employed in Transportation & Warehousing in the United States?
Percentage of Population Employed in Transportation & Warehousing in the United States is 4.9%.