Falcon Mesa, TX Map & Demographics
Falcon Mesa Map
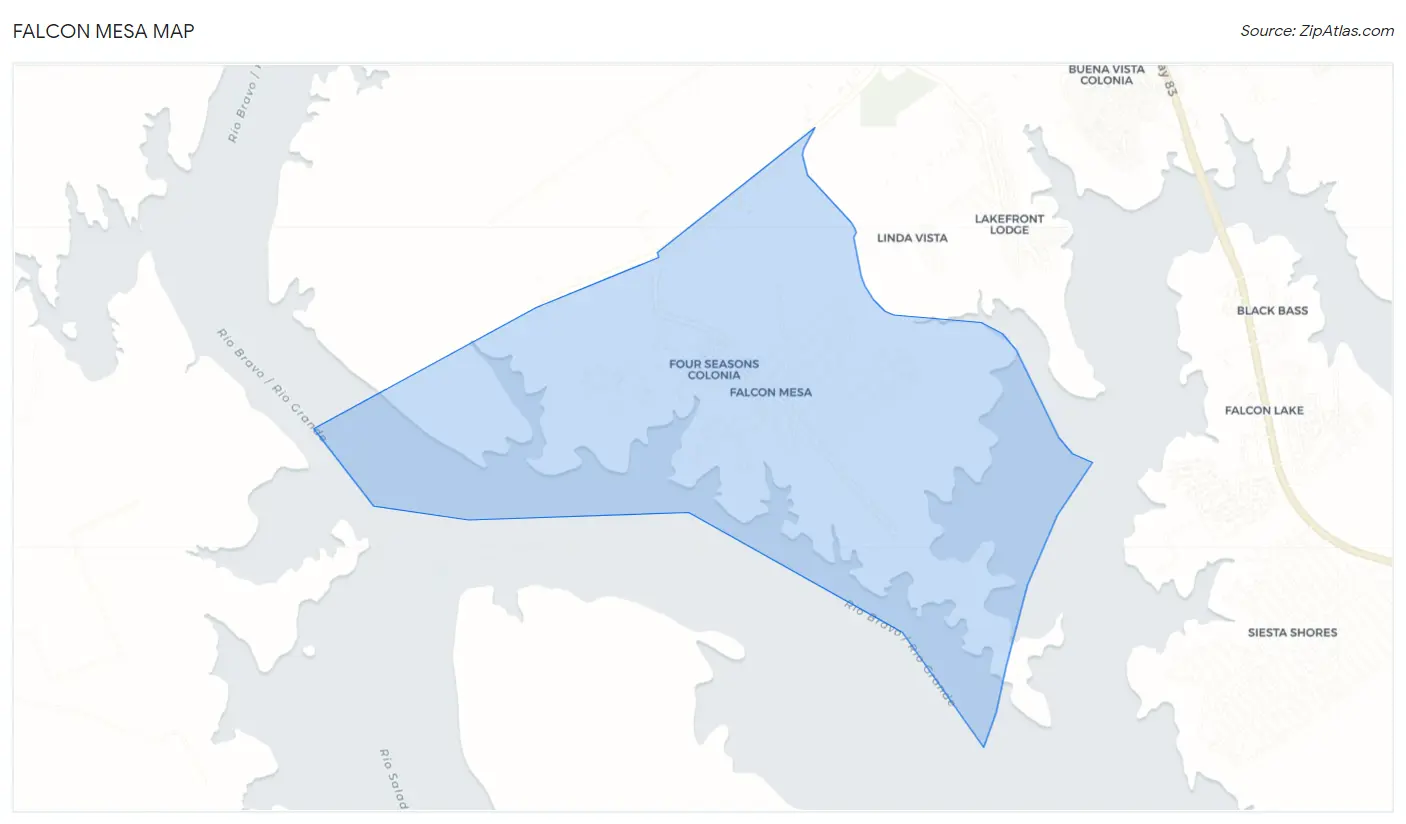
Falcon Mesa Overview
$26,119
PER CAPITA INCOME
$73,309
AVG FAMILY INCOME
0.50
INEQUALITY / GINI INDEX
118
TOTAL POPULATION
23
MALE POPULATION
95
FEMALE POPULATION
24.21
MALES / 100 FEMALES
413.04
FEMALES / 100 MALES
72.5
MEDIAN AGE
2.2
AVG FAMILY SIZE
1.3
AVG HOUSEHOLD SIZE
29
LABOR FORCE [ PEOPLE ]
24.6%
PERCENT IN LABOR FORCE
89.7%
UNEMPLOYMENT RATE
Income in Falcon Mesa
Income Overview in Falcon Mesa
| Characteristic | Number | Measure |
| Per Capita Income | 118 | $26,119 |
| Median Family Income | 23 | $73,309 |
| Mean Family Income | 23 | $62,587 |
| Median Household Income | 90 | $0 |
| Mean Household Income | 90 | $34,920 |
| Income Deficit | 23 | $0 |
| Wage / Income Gap (%) | 118 | 0.00% |
| Wage / Income Gap ($) | 118 | 100.00¢ per $1 |
| Gini / Inequality Index | 118 | 0.50 |
Earnings by Sex in Falcon Mesa
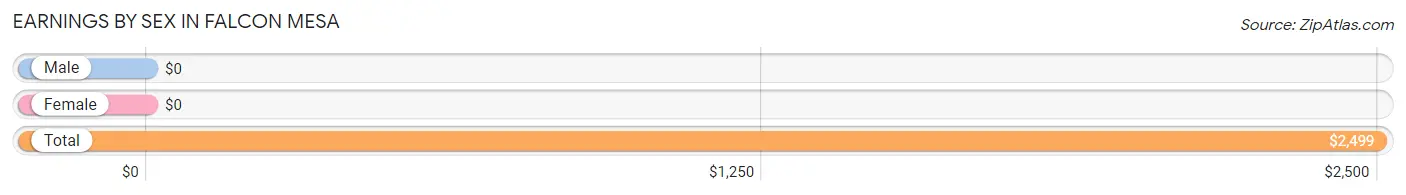
| Sex | Number | Average Earnings |
| Male | 3 (10.3%) | $0 |
| Female | 26 (89.7%) | $0 |
| Total | 29 (100.0%) | $2,499 |
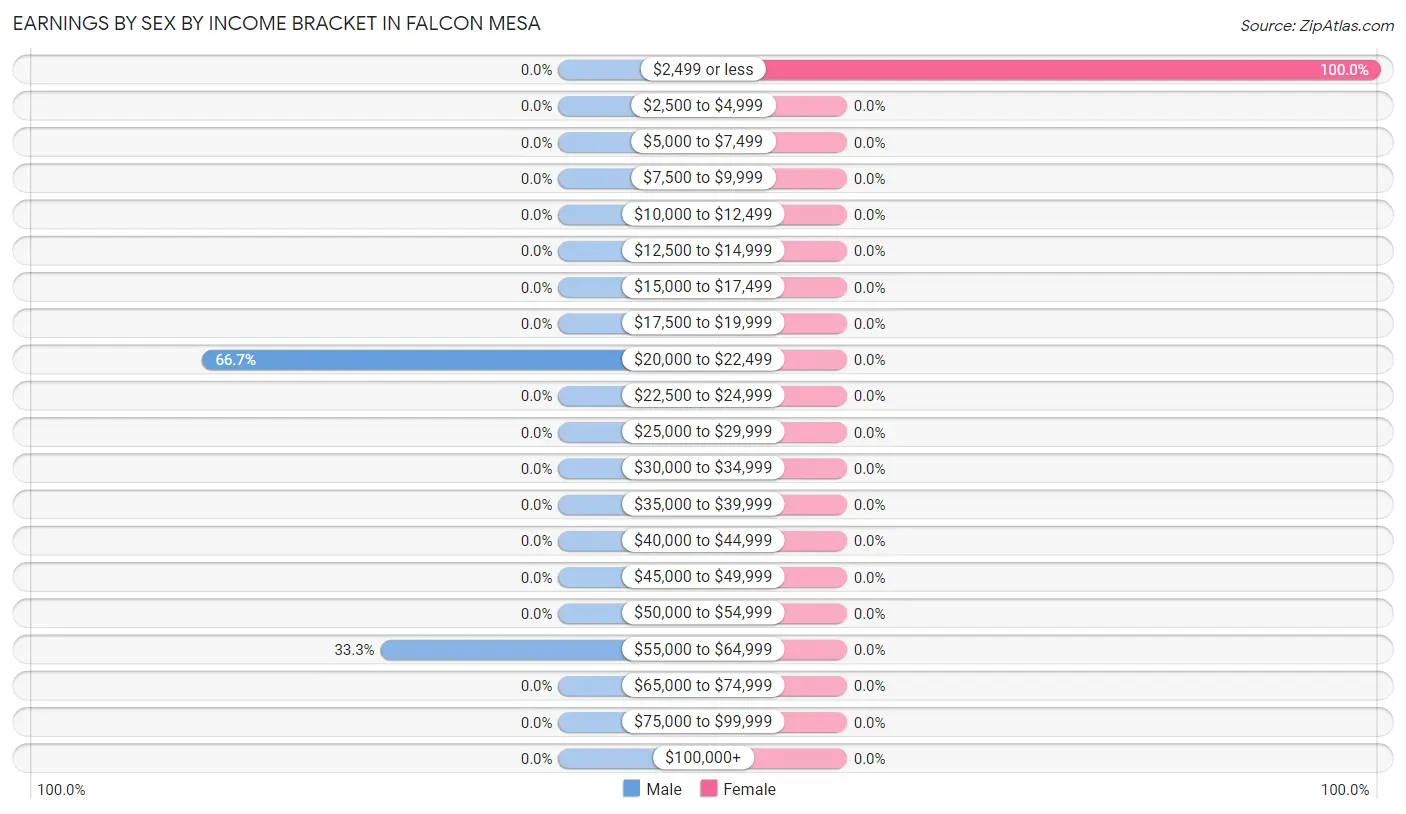
Earnings by Sex by Income Bracket in Falcon Mesa
The most common earnings brackets in Falcon Mesa are $20,000 to $22,499 for men (2 | 66.7%) and $2,499 or less for women (26 | 100.0%).
| Income | Male | Female |
| $2,499 or less | 0 (0.0%) | 26 (100.0%) |
| $2,500 to $4,999 | 0 (0.0%) | 0 (0.0%) |
| $5,000 to $7,499 | 0 (0.0%) | 0 (0.0%) |
| $7,500 to $9,999 | 0 (0.0%) | 0 (0.0%) |
| $10,000 to $12,499 | 0 (0.0%) | 0 (0.0%) |
| $12,500 to $14,999 | 0 (0.0%) | 0 (0.0%) |
| $15,000 to $17,499 | 0 (0.0%) | 0 (0.0%) |
| $17,500 to $19,999 | 0 (0.0%) | 0 (0.0%) |
| $20,000 to $22,499 | 2 (66.7%) | 0 (0.0%) |
| $22,500 to $24,999 | 0 (0.0%) | 0 (0.0%) |
| $25,000 to $29,999 | 0 (0.0%) | 0 (0.0%) |
| $30,000 to $34,999 | 0 (0.0%) | 0 (0.0%) |
| $35,000 to $39,999 | 0 (0.0%) | 0 (0.0%) |
| $40,000 to $44,999 | 0 (0.0%) | 0 (0.0%) |
| $45,000 to $49,999 | 0 (0.0%) | 0 (0.0%) |
| $50,000 to $54,999 | 0 (0.0%) | 0 (0.0%) |
| $55,000 to $64,999 | 1 (33.3%) | 0 (0.0%) |
| $65,000 to $74,999 | 0 (0.0%) | 0 (0.0%) |
| $75,000 to $99,999 | 0 (0.0%) | 0 (0.0%) |
| $100,000+ | 0 (0.0%) | 0 (0.0%) |
| Total | 3 (100.0%) | 26 (100.0%) |
Earnings by Sex by Educational Attainment in Falcon Mesa
| Educational Attainment | Male Income | Female Income |
| Less than High School | - | - |
| High School Diploma | - | - |
| College or Associate's Degree | - | - |
| Bachelor's Degree | - | - |
| Graduate Degree | - | - |
| Total | - | - |
Family Income in Falcon Mesa
Family Income Brackets in Falcon Mesa
According to the Falcon Mesa family income data, there are 17 families falling into the $50,000 to $74,999 income range, which is the most common income bracket and makes up 73.9% of all families.
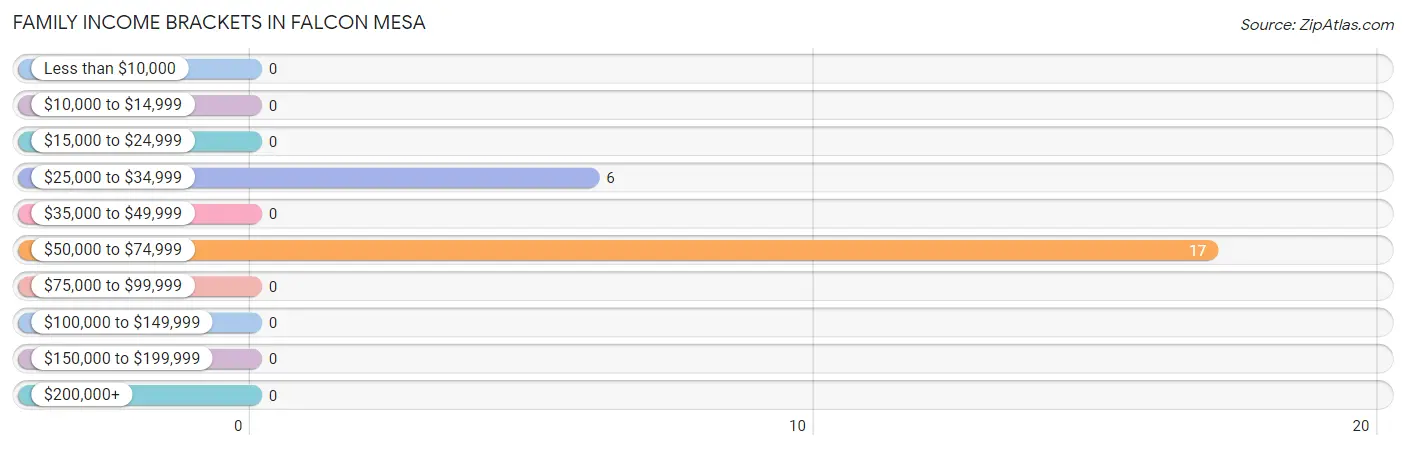
| Income Bracket | # Families | % Families |
| Less than $10,000 | 0 | 0.0% |
| $10,000 to $14,999 | 0 | 0.0% |
| $15,000 to $24,999 | 0 | 0.0% |
| $25,000 to $34,999 | 6 | 26.1% |
| $35,000 to $49,999 | 0 | 0.0% |
| $50,000 to $74,999 | 17 | 73.9% |
| $75,000 to $99,999 | 0 | 0.0% |
| $100,000 to $149,999 | 0 | 0.0% |
| $150,000 to $199,999 | 0 | 0.0% |
| $200,000+ | 0 | 0.0% |
Family Income by Famaliy Size in Falcon Mesa
2-person families (23 | 100.0%) account for the highest median family income in Falcon Mesa with $73,309 per family, while 2-person families (23 | 100.0%) have the highest median income of $36,654 per family member.
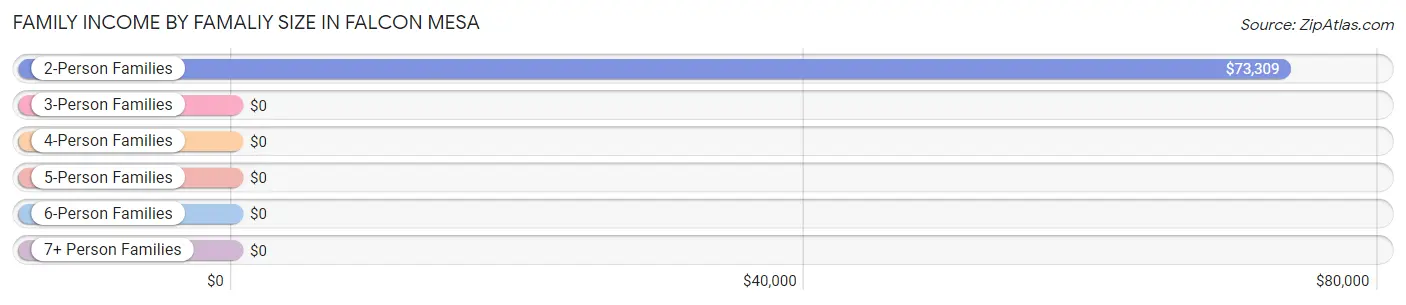
| Income Bracket | # Families | Median Income |
| 2-Person Families | 23 (100.0%) | $73,309 |
| 3-Person Families | 0 (0.0%) | $0 |
| 4-Person Families | 0 (0.0%) | $0 |
| 5-Person Families | 0 (0.0%) | $0 |
| 6-Person Families | 0 (0.0%) | $0 |
| 7+ Person Families | 0 (0.0%) | $0 |
| Total | 23 (100.0%) | $73,309 |
Family Income by Number of Earners in Falcon Mesa
| Number of Earners | # Families | Median Income |
| No Earners | 20 (87.0%) | $0 |
| 1 Earner | 3 (13.0%) | $0 |
| 2 Earners | 0 (0.0%) | $0 |
| 3+ Earners | 0 (0.0%) | $0 |
| Total | 23 (100.0%) | $73,309 |
Household Income in Falcon Mesa
Household Income Brackets in Falcon Mesa
With 27 households falling in the category, the $50,000 to $74,999 income range is the most frequent in Falcon Mesa, accounting for 30.0% of all households.
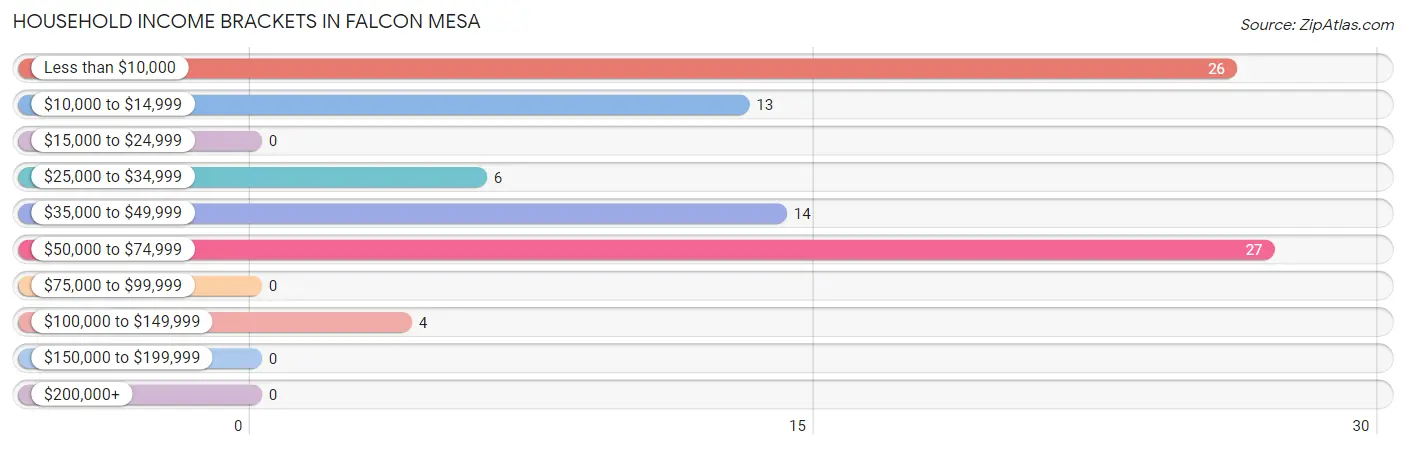
| Income Bracket | # Households | % Households |
| Less than $10,000 | 26 | 28.9% |
| $10,000 to $14,999 | 13 | 14.4% |
| $15,000 to $24,999 | 0 | 0.0% |
| $25,000 to $34,999 | 6 | 6.7% |
| $35,000 to $49,999 | 14 | 15.6% |
| $50,000 to $74,999 | 27 | 30.0% |
| $75,000 to $99,999 | 0 | 0.0% |
| $100,000 to $149,999 | 4 | 4.4% |
| $150,000 to $199,999 | 0 | 0.0% |
| $200,000+ | 0 | 0.0% |
Household Income by Householder Age in Falcon Mesa
| Income Bracket | # Households | Median Income |
| 15 to 24 Years | 0 (0.0%) | $0 |
| 25 to 44 Years | 0 (0.0%) | $0 |
| 45 to 64 Years | 30 (33.3%) | $0 |
| 65+ Years | 60 (66.7%) | $0 |
| Total | 90 (100.0%) | $0 |
Poverty in Falcon Mesa
Income Below Poverty by Sex and Age in Falcon Mesa
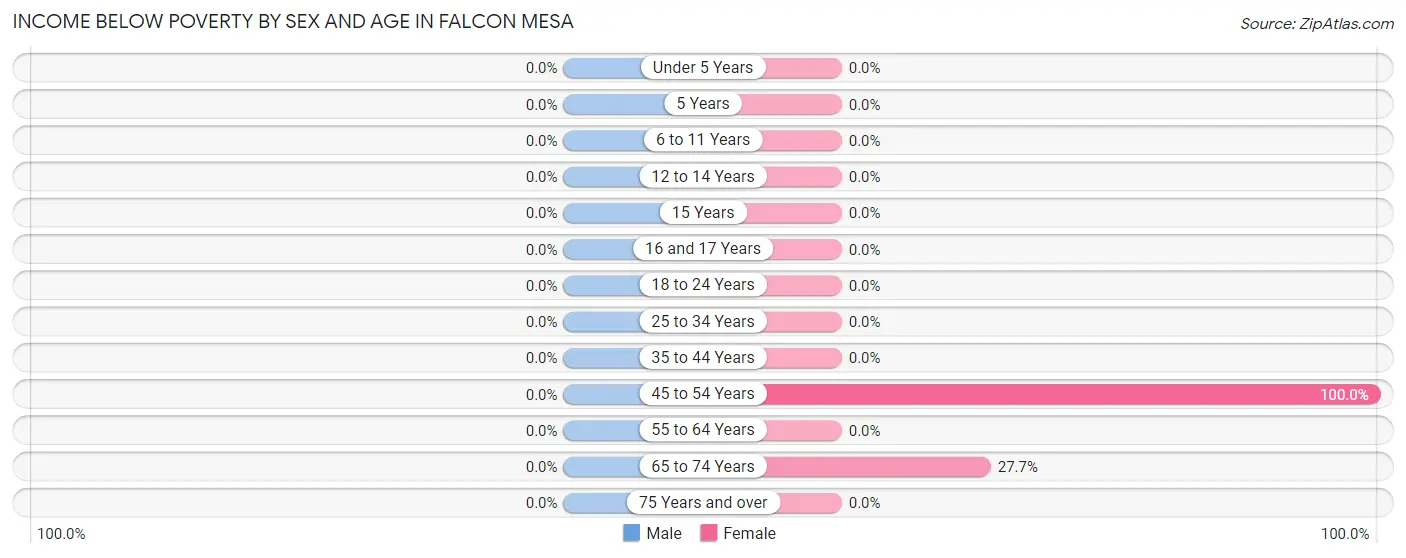
| Age Bracket | Male | Female |
| Under 5 Years | 0 (0.0%) | 0 (0.0%) |
| 5 Years | 0 (0.0%) | 0 (0.0%) |
| 6 to 11 Years | 0 (0.0%) | 0 (0.0%) |
| 12 to 14 Years | 0 (0.0%) | 0 (0.0%) |
| 15 Years | 0 (0.0%) | 0 (0.0%) |
| 16 and 17 Years | 0 (0.0%) | 0 (0.0%) |
| 18 to 24 Years | 0 (0.0%) | 0 (0.0%) |
| 25 to 34 Years | 0 (0.0%) | 0 (0.0%) |
| 35 to 44 Years | 0 (0.0%) | 0 (0.0%) |
| 45 to 54 Years | 0 (0.0%) | 26 (100.0%) |
| 55 to 64 Years | 0 (0.0%) | 0 (0.0%) |
| 65 to 74 Years | 0 (0.0%) | 13 (27.7%) |
| 75 Years and over | 0 (0.0%) | 0 (0.0%) |
| Total | 0 (0.0%) | 39 (41.0%) |
Income Above Poverty by Sex and Age in Falcon Mesa
According to the poverty statistics in Falcon Mesa, males aged 55 to 64 years and females aged 55 to 64 years are the age groups that are most secure financially, with 100.0% of males and 100.0% of females in these age groups living above the poverty line.
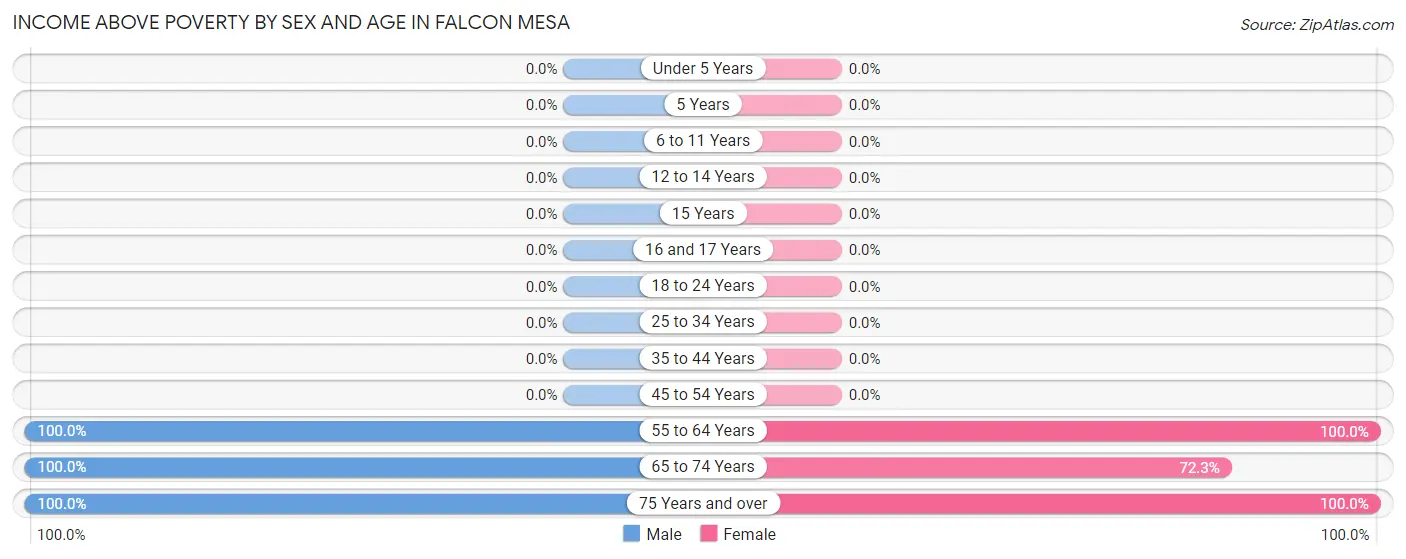
| Age Bracket | Male | Female |
| Under 5 Years | 0 (0.0%) | 0 (0.0%) |
| 5 Years | 0 (0.0%) | 0 (0.0%) |
| 6 to 11 Years | 0 (0.0%) | 0 (0.0%) |
| 12 to 14 Years | 0 (0.0%) | 0 (0.0%) |
| 15 Years | 0 (0.0%) | 0 (0.0%) |
| 16 and 17 Years | 0 (0.0%) | 0 (0.0%) |
| 18 to 24 Years | 0 (0.0%) | 0 (0.0%) |
| 25 to 34 Years | 0 (0.0%) | 0 (0.0%) |
| 35 to 44 Years | 0 (0.0%) | 0 (0.0%) |
| 45 to 54 Years | 0 (0.0%) | 0 (0.0%) |
| 55 to 64 Years | 1 (100.0%) | 4 (100.0%) |
| 65 to 74 Years | 2 (100.0%) | 34 (72.3%) |
| 75 Years and over | 20 (100.0%) | 18 (100.0%) |
| Total | 23 (100.0%) | 56 (59.0%) |
Income Below Poverty Among Married-Couple Families in Falcon Mesa
| Children | Above Poverty | Below Poverty |
| No Children | 23 (100.0%) | 0 (0.0%) |
| 1 or 2 Children | 0 (0.0%) | 0 (0.0%) |
| 3 or 4 Children | 0 (0.0%) | 0 (0.0%) |
| 5 or more Children | 0 (0.0%) | 0 (0.0%) |
| Total | 23 (100.0%) | 0 (0.0%) |
Income Below Poverty Among Single-Parent Households in Falcon Mesa
| Children | Single Father | Single Mother |
| No Children | 0 (0.0%) | 0 (0.0%) |
| 1 or 2 Children | 0 (0.0%) | 0 (0.0%) |
| 3 or 4 Children | 0 (0.0%) | 0 (0.0%) |
| 5 or more Children | 0 (0.0%) | 0 (0.0%) |
| Total | 0 (0.0%) | 0 (0.0%) |
Income Below Poverty Among Married-Couple vs Single-Parent Households in Falcon Mesa
| Children | Married-Couple Families | Single-Parent Households |
| No Children | 0 (0.0%) | 0 (0.0%) |
| 1 or 2 Children | 0 (0.0%) | 0 (0.0%) |
| 3 or 4 Children | 0 (0.0%) | 0 (0.0%) |
| 5 or more Children | 0 (0.0%) | 0 (0.0%) |
| Total | 0 (0.0%) | 0 (0.0%) |
Race in Falcon Mesa
The most populous races in Falcon Mesa are White / Caucasian (91 | 77.1%), Hispanic or Latino (27 | 22.9%), and Two or more Races (27 | 22.9%).
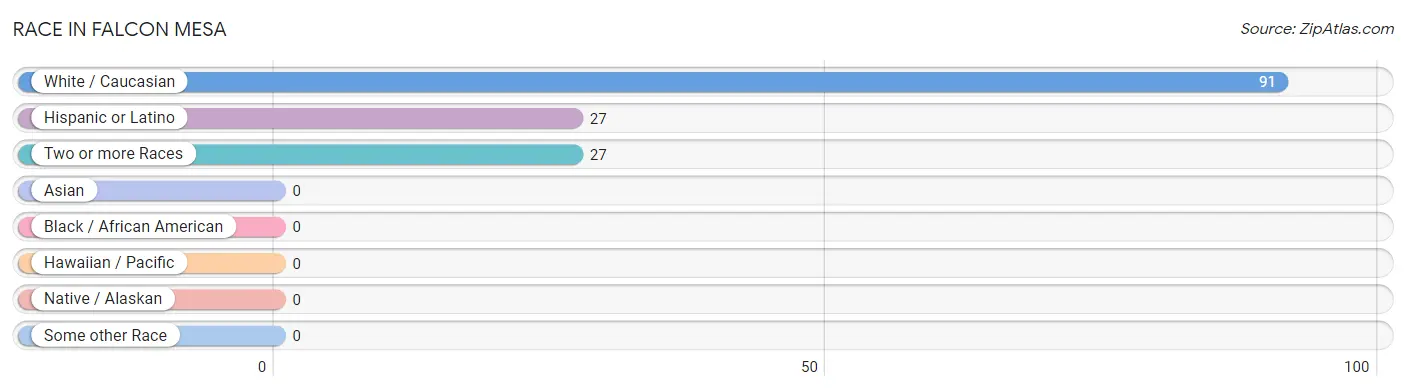
| Race | # Population | % Population |
| Asian | 0 | 0.0% |
| Black / African American | 0 | 0.0% |
| Hawaiian / Pacific | 0 | 0.0% |
| Hispanic or Latino | 27 | 22.9% |
| Native / Alaskan | 0 | 0.0% |
| White / Caucasian | 91 | 77.1% |
| Two or more Races | 27 | 22.9% |
| Some other Race | 0 | 0.0% |
| Total | 118 | 100.0% |
Ancestry in Falcon Mesa
The most populous ancestries reported in Falcon Mesa are German (61 | 51.7%), Mexican (26 | 22.0%), Czech (10 | 8.5%), Irish (6 | 5.1%), and English (4 | 3.4%), together accounting for 90.7% of all Falcon Mesa residents.
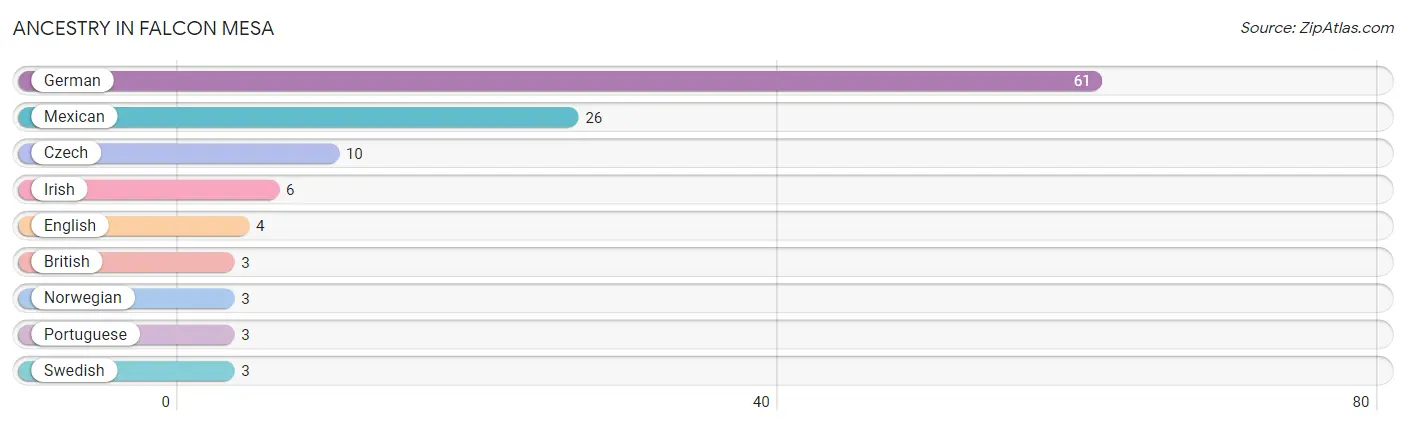
| Ancestry | # Population | % Population |
| British | 3 | 2.5% |
| Czech | 10 | 8.5% |
| English | 4 | 3.4% |
| German | 61 | 51.7% |
| Irish | 6 | 5.1% |
| Mexican | 26 | 22.0% |
| Norwegian | 3 | 2.5% |
| Portuguese | 3 | 2.5% |
| Swedish | 3 | 2.5% | View All 9 Rows |
Immigrants in Falcon Mesa

| Immigration Origin | # Population | % Population | View All 0 Rows |
Sex and Age in Falcon Mesa
Sex and Age in Falcon Mesa
The most populous age groups in Falcon Mesa are 75 to 79 Years (17 | 73.9%) for men and 70 to 74 Years (31 | 32.6%) for women.
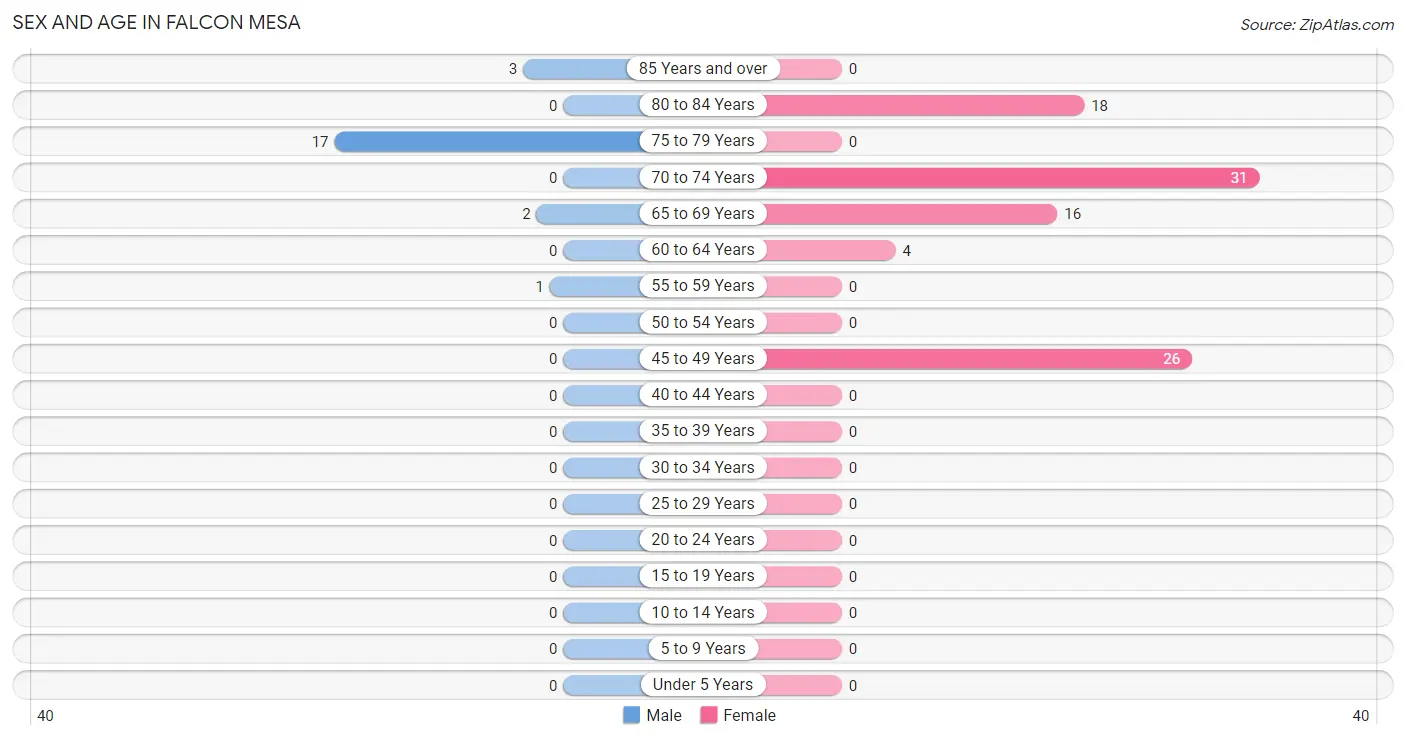
| Age Bracket | Male | Female |
| Under 5 Years | 0 (0.0%) | 0 (0.0%) |
| 5 to 9 Years | 0 (0.0%) | 0 (0.0%) |
| 10 to 14 Years | 0 (0.0%) | 0 (0.0%) |
| 15 to 19 Years | 0 (0.0%) | 0 (0.0%) |
| 20 to 24 Years | 0 (0.0%) | 0 (0.0%) |
| 25 to 29 Years | 0 (0.0%) | 0 (0.0%) |
| 30 to 34 Years | 0 (0.0%) | 0 (0.0%) |
| 35 to 39 Years | 0 (0.0%) | 0 (0.0%) |
| 40 to 44 Years | 0 (0.0%) | 0 (0.0%) |
| 45 to 49 Years | 0 (0.0%) | 26 (27.4%) |
| 50 to 54 Years | 0 (0.0%) | 0 (0.0%) |
| 55 to 59 Years | 1 (4.3%) | 0 (0.0%) |
| 60 to 64 Years | 0 (0.0%) | 4 (4.2%) |
| 65 to 69 Years | 2 (8.7%) | 16 (16.8%) |
| 70 to 74 Years | 0 (0.0%) | 31 (32.6%) |
| 75 to 79 Years | 17 (73.9%) | 0 (0.0%) |
| 80 to 84 Years | 0 (0.0%) | 18 (19.0%) |
| 85 Years and over | 3 (13.0%) | 0 (0.0%) |
| Total | 23 (100.0%) | 95 (100.0%) |
Families and Households in Falcon Mesa
Median Family Size in Falcon Mesa
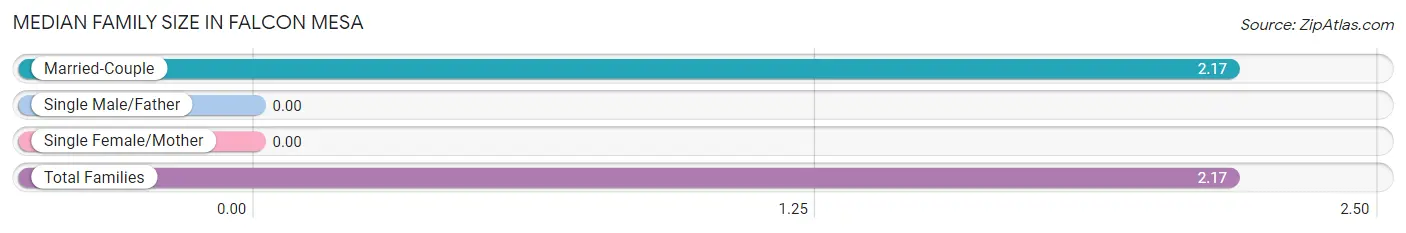
| Family Type | # Families | Family Size |
| Married-Couple | 23 (100.0%) | 2.17 |
| Single Male/Father | 0 (0.0%) | - |
| Single Female/Mother | 0 (0.0%) | - |
| Total Families | 23 (100.0%) | 2.17 |
Median Household Size in Falcon Mesa
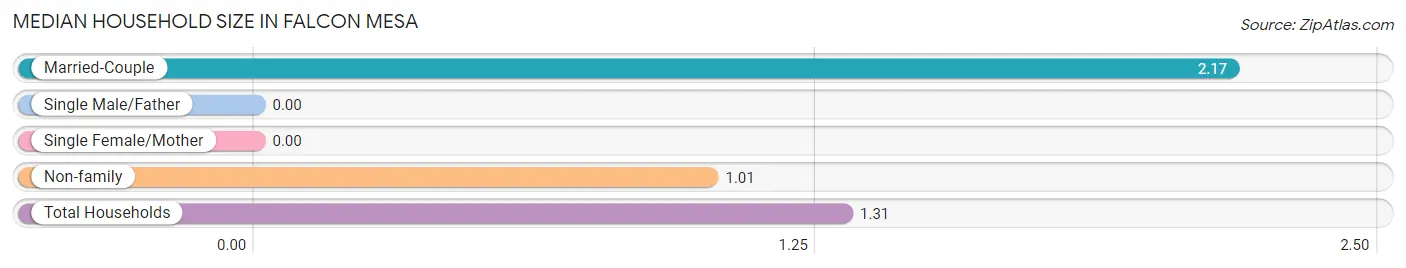
| Household Type | # Households | Household Size |
| Married-Couple | 23 (25.6%) | 2.17 |
| Single Male/Father | 0 (0.0%) | - |
| Single Female/Mother | 0 (0.0%) | - |
| Non-family | 67 (74.4%) | 1.01 |
| Total Households | 90 (100.0%) | 1.31 |
Household Size by Marriage Status in Falcon Mesa
Out of a total of 90 households in Falcon Mesa, 23 (25.6%) are family households, while 67 (74.4%) are nonfamily households. The most numerous type of family households are 2-person households, comprising 23, and the most common type of nonfamily households are 1-person households, comprising 63.
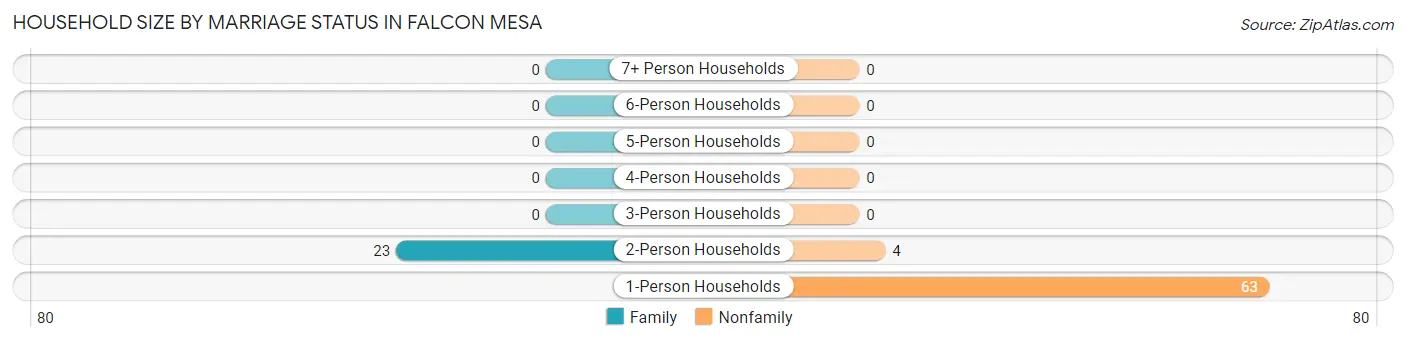
| Household Size | Family Households | Nonfamily Households |
| 1-Person Households | - | 63 (70.0%) |
| 2-Person Households | 23 (25.6%) | 4 (4.4%) |
| 3-Person Households | 0 (0.0%) | 0 (0.0%) |
| 4-Person Households | 0 (0.0%) | 0 (0.0%) |
| 5-Person Households | 0 (0.0%) | 0 (0.0%) |
| 6-Person Households | 0 (0.0%) | 0 (0.0%) |
| 7+ Person Households | 0 (0.0%) | 0 (0.0%) |
| Total | 23 (25.6%) | 67 (74.4%) |
Female Fertility in Falcon Mesa
Fertility by Age in Falcon Mesa
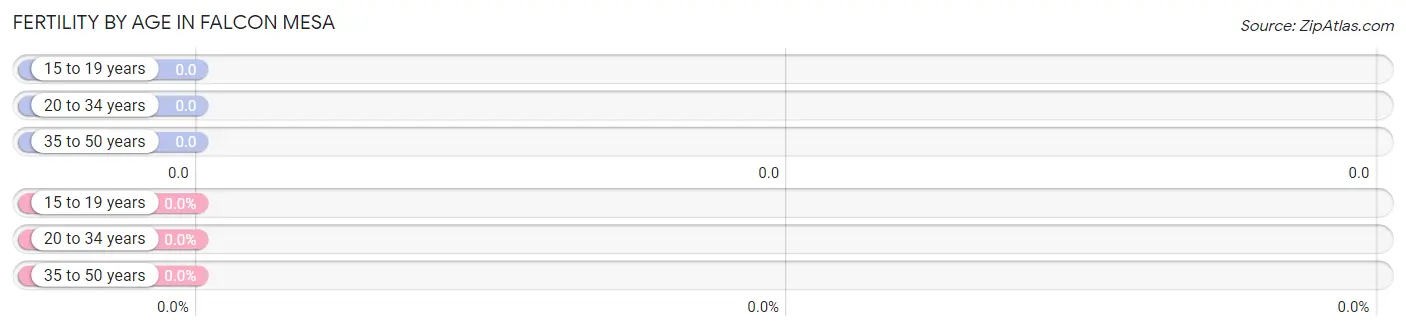
| Age Bracket | Women with Births | Births / 1,000 Women |
| 15 to 19 years | 0 (0.0%) | 0.0 |
| 20 to 34 years | 0 (0.0%) | 0.0 |
| 35 to 50 years | 0 (0.0%) | 0.0 |
| Total | 0 (0.0%) | 0.0 |
Fertility by Age by Marriage Status in Falcon Mesa
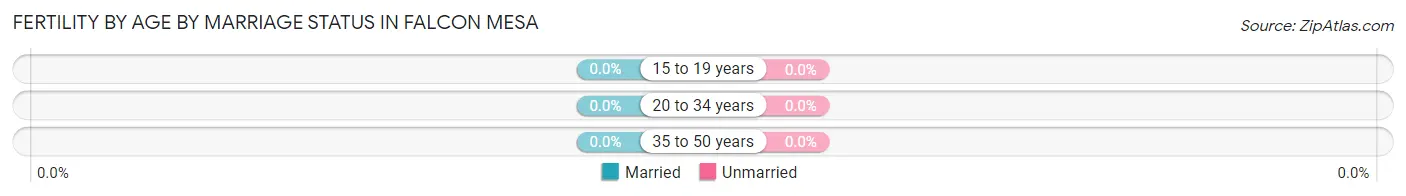
| Age Bracket | Married | Unmarried |
| 15 to 19 years | 0 (0.0%) | 0 (0.0%) |
| 20 to 34 years | 0 (0.0%) | 0 (0.0%) |
| 35 to 50 years | 0 (0.0%) | 0 (0.0%) |
| Total | 0 (0.0%) | 0 (0.0%) |
Fertility by Education in Falcon Mesa
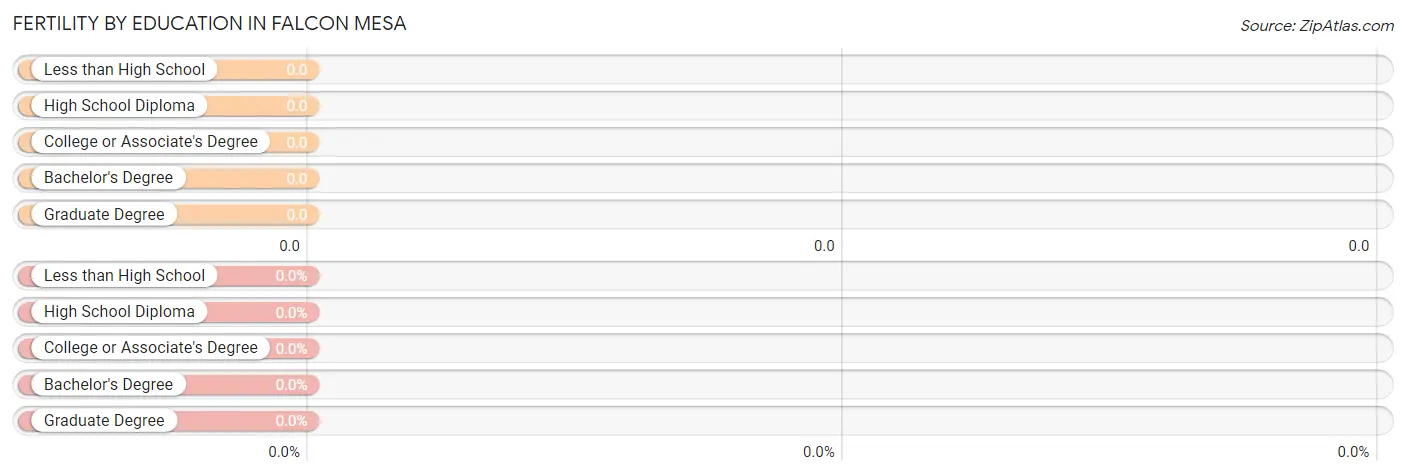
| Educational Attainment | Women with Births | Births / 1,000 Women |
| Less than High School | 0 (0.0%) | 0.0 |
| High School Diploma | 0 (0.0%) | 0.0 |
| College or Associate's Degree | 0 (0.0%) | 0.0 |
| Bachelor's Degree | 0 (0.0%) | 0.0 |
| Graduate Degree | 0 (0.0%) | 0.0 |
| Total | 0 (0.0%) | 0.0 |
Fertility by Education by Marriage Status in Falcon Mesa
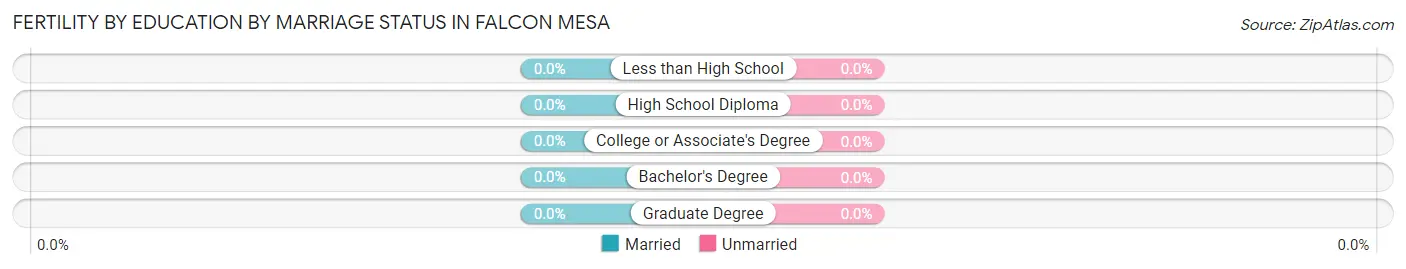
| Educational Attainment | Married | Unmarried |
| Less than High School | 0 (0.0%) | 0 (0.0%) |
| High School Diploma | 0 (0.0%) | 0 (0.0%) |
| College or Associate's Degree | 0 (0.0%) | 0 (0.0%) |
| Bachelor's Degree | 0 (0.0%) | 0 (0.0%) |
| Graduate Degree | 0 (0.0%) | 0 (0.0%) |
| Total | 0 (0.0%) | 0 (0.0%) |
Employment Characteristics in Falcon Mesa
Employment by Class of Employer in Falcon Mesa
Among the 3 employed individuals in Falcon Mesa, , and private company employees (3 | 100.0%) make up the most common classes of employment.
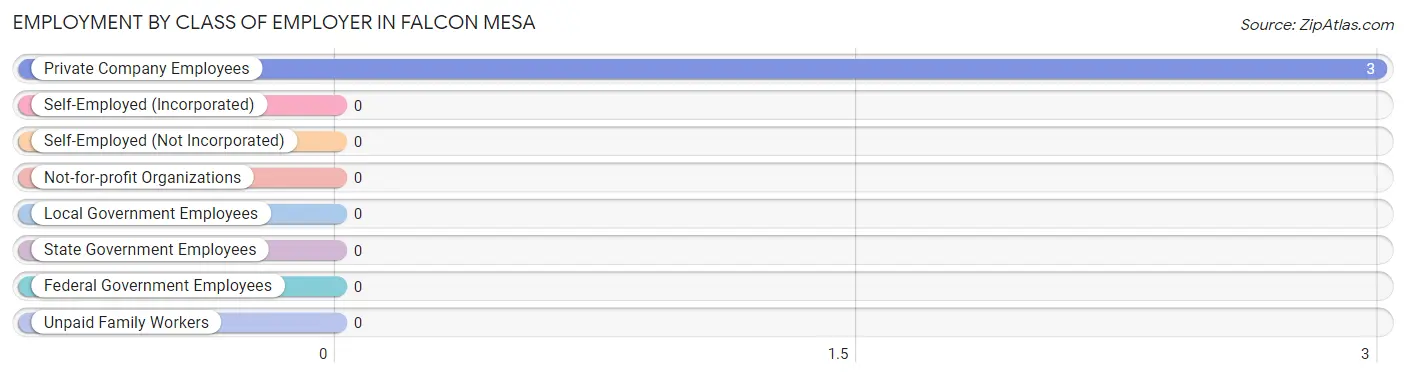
| Employer Class | # Employees | % Employees |
| Private Company Employees | 3 | 100.0% |
| Self-Employed (Incorporated) | 0 | 0.0% |
| Self-Employed (Not Incorporated) | 0 | 0.0% |
| Not-for-profit Organizations | 0 | 0.0% |
| Local Government Employees | 0 | 0.0% |
| State Government Employees | 0 | 0.0% |
| Federal Government Employees | 0 | 0.0% |
| Unpaid Family Workers | 0 | 0.0% |
| Total | 3 | 100.0% |
Employment Status by Age in Falcon Mesa
According to the labor force statistics for Falcon Mesa, out of the total population over 16 years of age (118), 24.6% or 29 individuals are in the labor force, with 89.7% or 26 of them unemployed. The age group with the highest labor force participation rate is 45 to 54 years, with 100.0% or 26 individuals in the labor force. Within the labor force, the 45 to 54 years age range has the highest percentage of unemployed individuals, with 100.0% or 26 of them being unemployed.
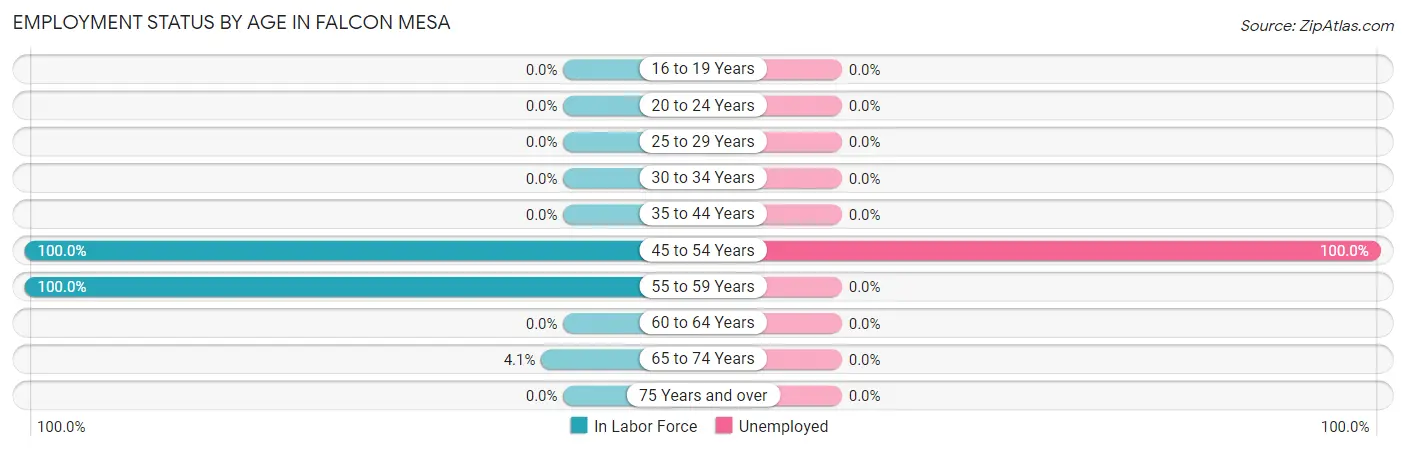
| Age Bracket | In Labor Force | Unemployed |
| 16 to 19 Years | 0 (0.0%) | 0 (0.0%) |
| 20 to 24 Years | 0 (0.0%) | 0 (0.0%) |
| 25 to 29 Years | 0 (0.0%) | 0 (0.0%) |
| 30 to 34 Years | 0 (0.0%) | 0 (0.0%) |
| 35 to 44 Years | 0 (0.0%) | 0 (0.0%) |
| 45 to 54 Years | 26 (100.0%) | 26 (100.0%) |
| 55 to 59 Years | 1 (100.0%) | 0 (0.0%) |
| 60 to 64 Years | 0 (0.0%) | 0 (0.0%) |
| 65 to 74 Years | 2 (4.1%) | 0 (0.0%) |
| 75 Years and over | 0 (0.0%) | 0 (0.0%) |
| Total | 29 (24.6%) | 26 (89.7%) |
Employment Status by Educational Attainment in Falcon Mesa
According to labor force statistics for Falcon Mesa, 87.1% of individuals (27) out of the total population between 25 and 64 years of age (31) are in the labor force, with 96.3% or 26 of them being unemployed. The group with the highest labor force participation rate are those with the educational attainment of college / associate degree, with 100.0% or 26 individuals in the labor force. Within the labor force, individuals with college / associate degree education have the highest percentage of unemployment, with 100.0% or 26 of them being unemployed.
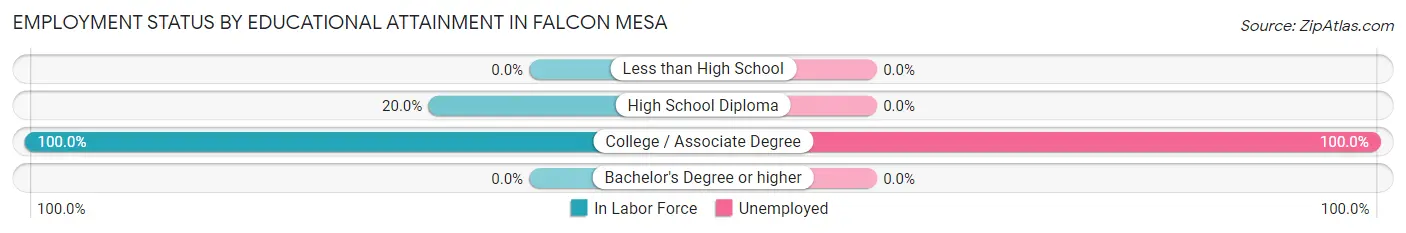
| Educational Attainment | In Labor Force | Unemployed |
| Less than High School | 0 (0.0%) | 0 (0.0%) |
| High School Diploma | 1 (20.0%) | 0 (0.0%) |
| College / Associate Degree | 26 (100.0%) | 26 (100.0%) |
| Bachelor's Degree or higher | 0 (0.0%) | 0 (0.0%) |
| Total | 27 (87.1%) | 30 (96.3%) |
Employment Occupations by Sex in Falcon Mesa
Management, Business, Science and Arts Occupations
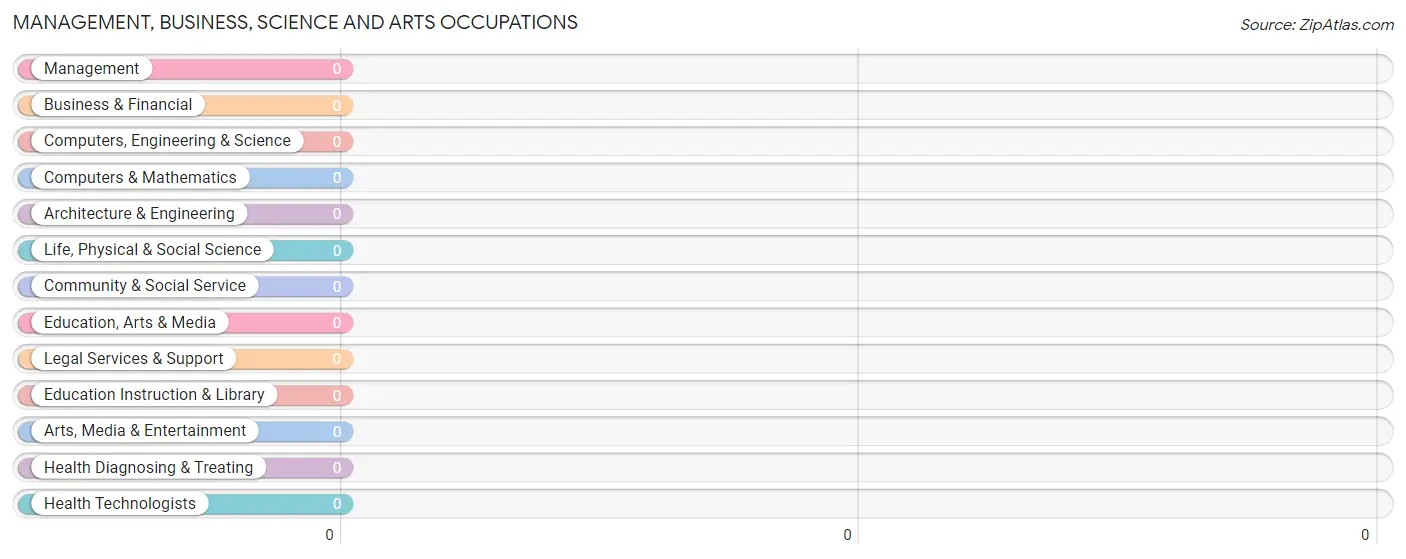
Management, Business, Science and Arts Occupations by Sex
| Occupation | Male | Female |
| Management | 0 (0.0%) | 0 (0.0%) |
| Business & Financial | 0 (0.0%) | 0 (0.0%) |
| Computers, Engineering & Science | 0 (0.0%) | 0 (0.0%) |
| Computers & Mathematics | 0 (0.0%) | 0 (0.0%) |
| Architecture & Engineering | 0 (0.0%) | 0 (0.0%) |
| Life, Physical & Social Science | 0 (0.0%) | 0 (0.0%) |
| Community & Social Service | 0 (0.0%) | 0 (0.0%) |
| Education, Arts & Media | 0 (0.0%) | 0 (0.0%) |
| Legal Services & Support | 0 (0.0%) | 0 (0.0%) |
| Education Instruction & Library | 0 (0.0%) | 0 (0.0%) |
| Arts, Media & Entertainment | 0 (0.0%) | 0 (0.0%) |
| Health Diagnosing & Treating | 0 (0.0%) | 0 (0.0%) |
| Health Technologists | 0 (0.0%) | 0 (0.0%) |
| Total (Category) | 0 (0.0%) | 0 (0.0%) |
| Total (Overall) | 3 (100.0%) | 0 (0.0%) |
Services Occupations
Services Occupations by Sex
| Occupation | Male | Female |
| Healthcare Support | 0 (0.0%) | 0 (0.0%) |
| Security & Protection | 0 (0.0%) | 0 (0.0%) |
| Firefighting & Prevention | 0 (0.0%) | 0 (0.0%) |
| Law Enforcement | 0 (0.0%) | 0 (0.0%) |
| Food Preparation & Serving | 0 (0.0%) | 0 (0.0%) |
| Cleaning & Maintenance | 0 (0.0%) | 0 (0.0%) |
| Personal Care & Service | 0 (0.0%) | 0 (0.0%) |
| Total (Category) | 0 (0.0%) | 0 (0.0%) |
| Total (Overall) | 3 (100.0%) | 0 (0.0%) |
Sales and Office Occupations
Sales and Office Occupations by Sex
| Occupation | Male | Female |
| Sales & Related | 0 (0.0%) | 0 (0.0%) |
| Office & Administration | 0 (0.0%) | 0 (0.0%) |
| Total (Category) | 0 (0.0%) | 0 (0.0%) |
| Total (Overall) | 3 (100.0%) | 0 (0.0%) |
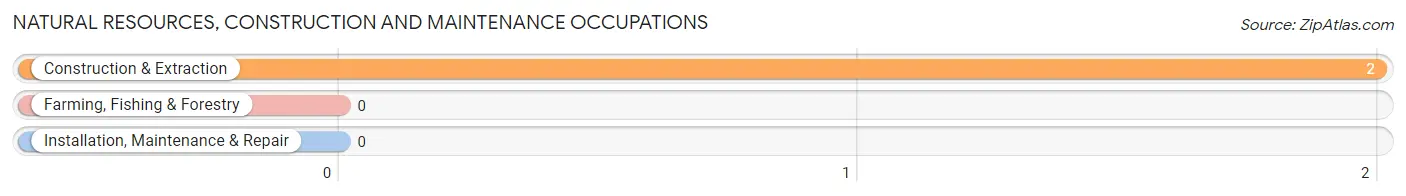
Natural Resources, Construction and Maintenance Occupations
The most common Natural Resources, Construction and Maintenance occupations in Falcon Mesa are , and Construction & Extraction (2 | 66.7%).
Natural Resources, Construction and Maintenance Occupations by Sex
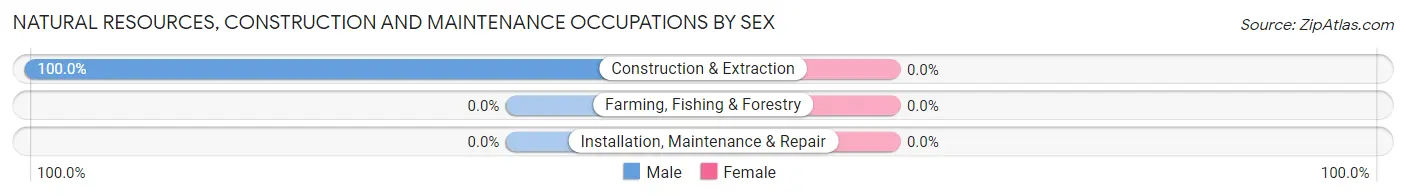
| Occupation | Male | Female |
| Farming, Fishing & Forestry | 0 (0.0%) | 0 (0.0%) |
| Construction & Extraction | 2 (100.0%) | 0 (0.0%) |
| Installation, Maintenance & Repair | 0 (0.0%) | 0 (0.0%) |
| Total (Category) | 2 (100.0%) | 0 (0.0%) |
| Total (Overall) | 3 (100.0%) | 0 (0.0%) |
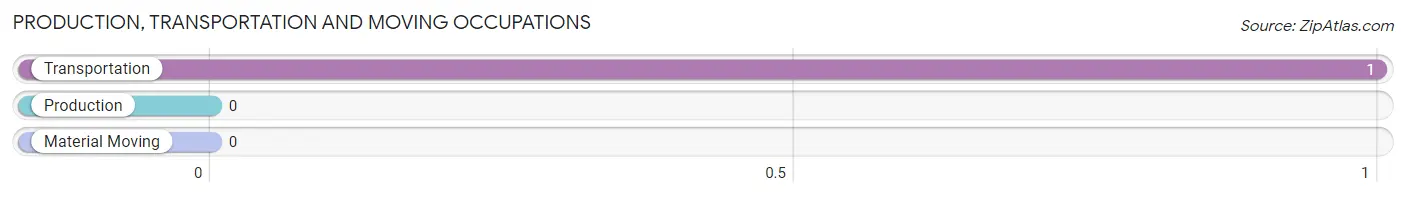
Production, Transportation and Moving Occupations
The most common Production, Transportation and Moving occupations in Falcon Mesa are , and Transportation (1 | 33.3%).
Production, Transportation and Moving Occupations by Sex
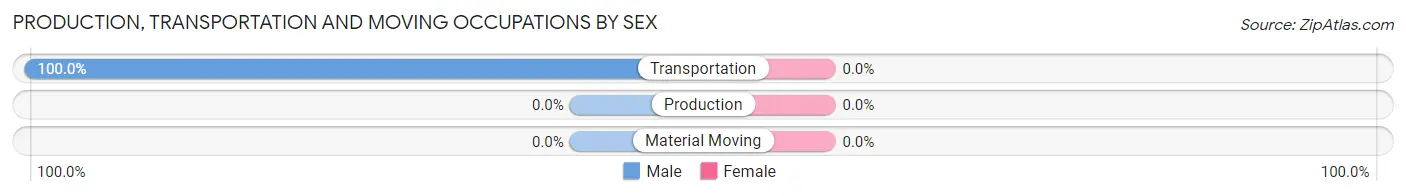
| Occupation | Male | Female |
| Production | 0 (0.0%) | 0 (0.0%) |
| Transportation | 1 (100.0%) | 0 (0.0%) |
| Material Moving | 0 (0.0%) | 0 (0.0%) |
| Total (Category) | 1 (100.0%) | 0 (0.0%) |
| Total (Overall) | 3 (100.0%) | 0 (0.0%) |
Employment Industries by Sex in Falcon Mesa
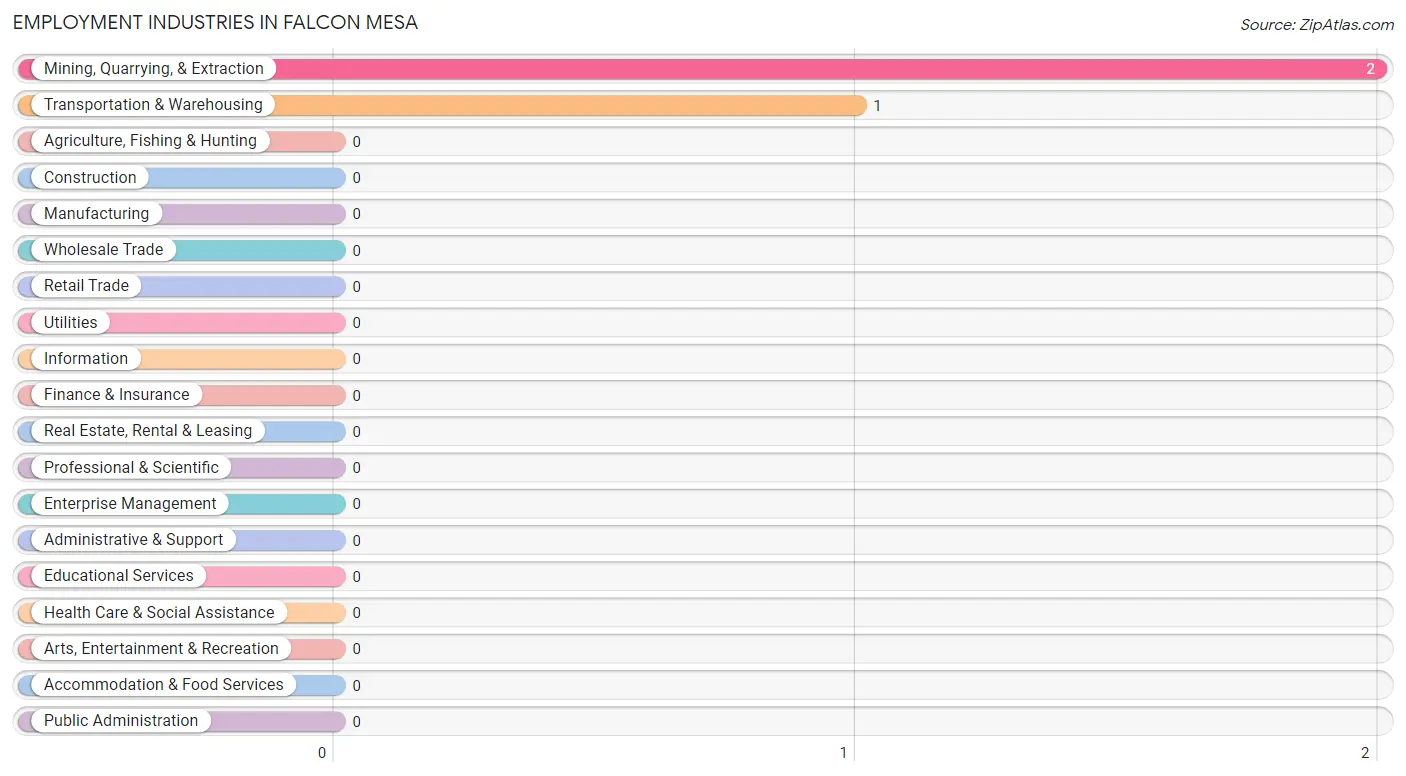
Employment Industries in Falcon Mesa
The major employment industries in Falcon Mesa include Mining, Quarrying, & Extraction (2 | 66.7%), and Transportation & Warehousing (1 | 33.3%).
Employment Industries by Sex in Falcon Mesa
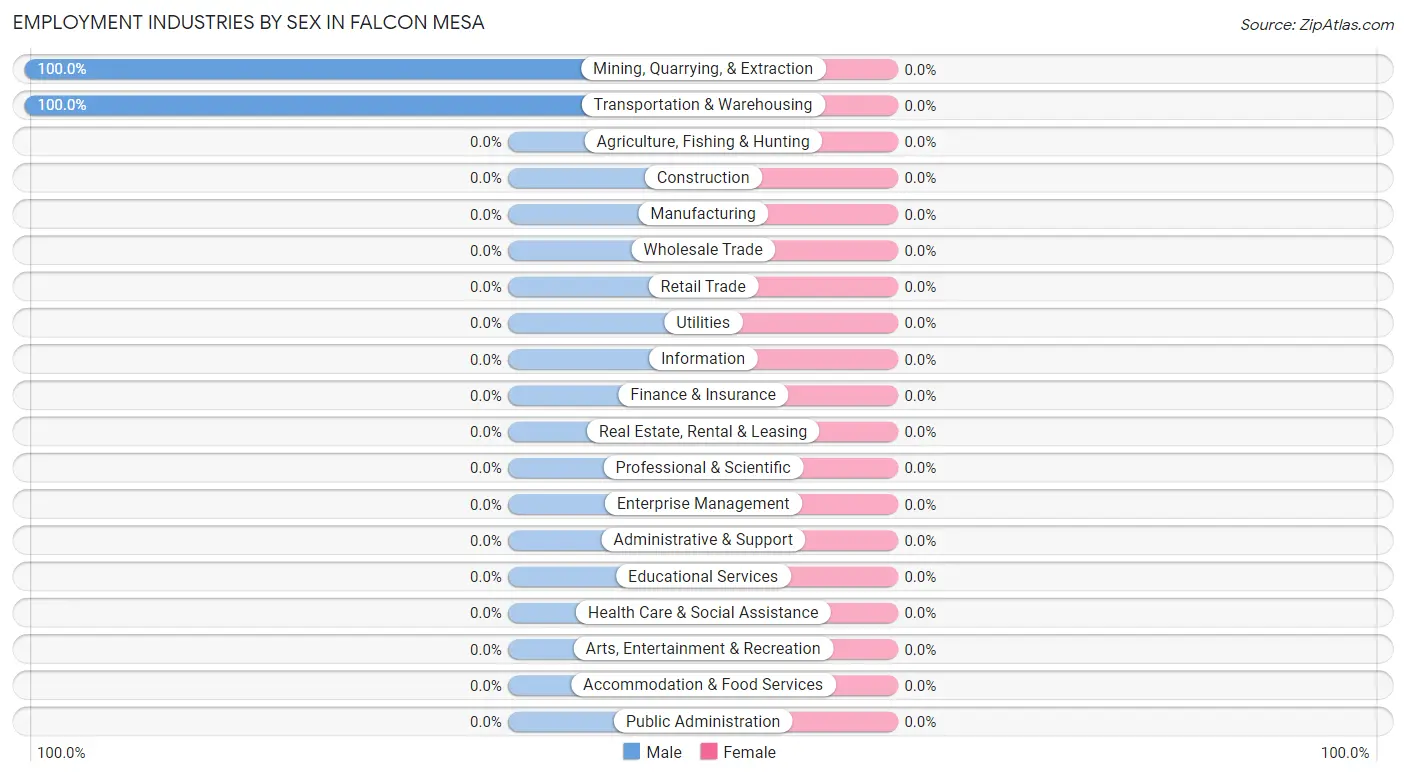
| Industry | Male | Female |
| Agriculture, Fishing & Hunting | 0 (0.0%) | 0 (0.0%) |
| Mining, Quarrying, & Extraction | 2 (100.0%) | 0 (0.0%) |
| Construction | 0 (0.0%) | 0 (0.0%) |
| Manufacturing | 0 (0.0%) | 0 (0.0%) |
| Wholesale Trade | 0 (0.0%) | 0 (0.0%) |
| Retail Trade | 0 (0.0%) | 0 (0.0%) |
| Transportation & Warehousing | 1 (100.0%) | 0 (0.0%) |
| Utilities | 0 (0.0%) | 0 (0.0%) |
| Information | 0 (0.0%) | 0 (0.0%) |
| Finance & Insurance | 0 (0.0%) | 0 (0.0%) |
| Real Estate, Rental & Leasing | 0 (0.0%) | 0 (0.0%) |
| Professional & Scientific | 0 (0.0%) | 0 (0.0%) |
| Enterprise Management | 0 (0.0%) | 0 (0.0%) |
| Administrative & Support | 0 (0.0%) | 0 (0.0%) |
| Educational Services | 0 (0.0%) | 0 (0.0%) |
| Health Care & Social Assistance | 0 (0.0%) | 0 (0.0%) |
| Arts, Entertainment & Recreation | 0 (0.0%) | 0 (0.0%) |
| Accommodation & Food Services | 0 (0.0%) | 0 (0.0%) |
| Public Administration | 0 (0.0%) | 0 (0.0%) |
| Total | 3 (100.0%) | 0 (0.0%) |
Education in Falcon Mesa
School Enrollment in Falcon Mesa
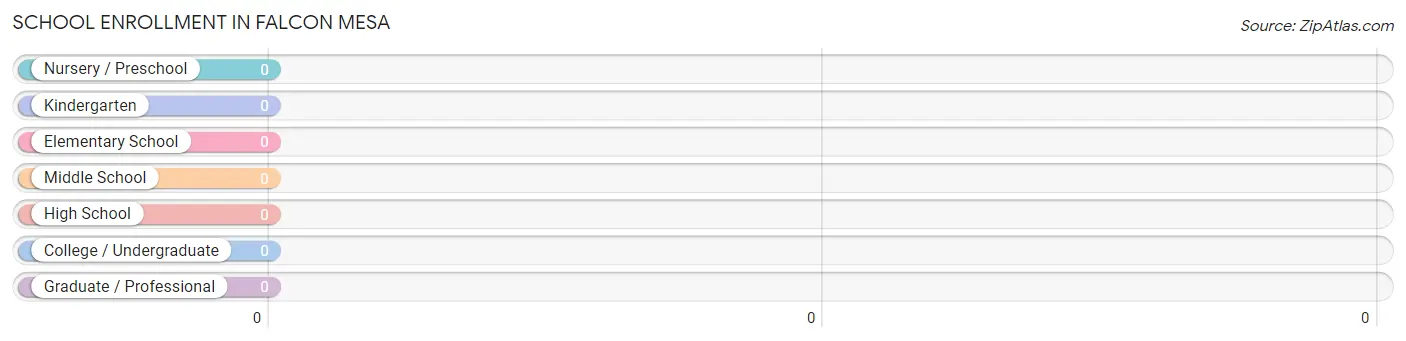
| School Level | # Students | % Students |
| Nursery / Preschool | 0 | 0.0% |
| Kindergarten | 0 | 0.0% |
| Elementary School | 0 | 0.0% |
| Middle School | 0 | 0.0% |
| High School | 0 | 0.0% |
| College / Undergraduate | 0 | 0.0% |
| Graduate / Professional | 0 | 0.0% |
| Total | 0 | 0.0% |
School Enrollment by Age by Funding Source in Falcon Mesa
| Age Bracket | Public School | Private School |
| 3 to 4 Year Olds | 0 (0.0%) | 0 (0.0%) |
| 5 to 9 Year Old | 0 (0.0%) | 0 (0.0%) |
| 10 to 14 Year Olds | 0 (0.0%) | 0 (0.0%) |
| 15 to 17 Year Olds | 0 (0.0%) | 0 (0.0%) |
| 18 to 19 Year Olds | 0 (0.0%) | 0 (0.0%) |
| 20 to 24 Year Olds | 0 (0.0%) | 0 (0.0%) |
| 25 to 34 Year Olds | 0 (0.0%) | 0 (0.0%) |
| 35 Years and over | 0 (0.0%) | 0 (0.0%) |
| Total | 0 (0.0%) | 0 (0.0%) |
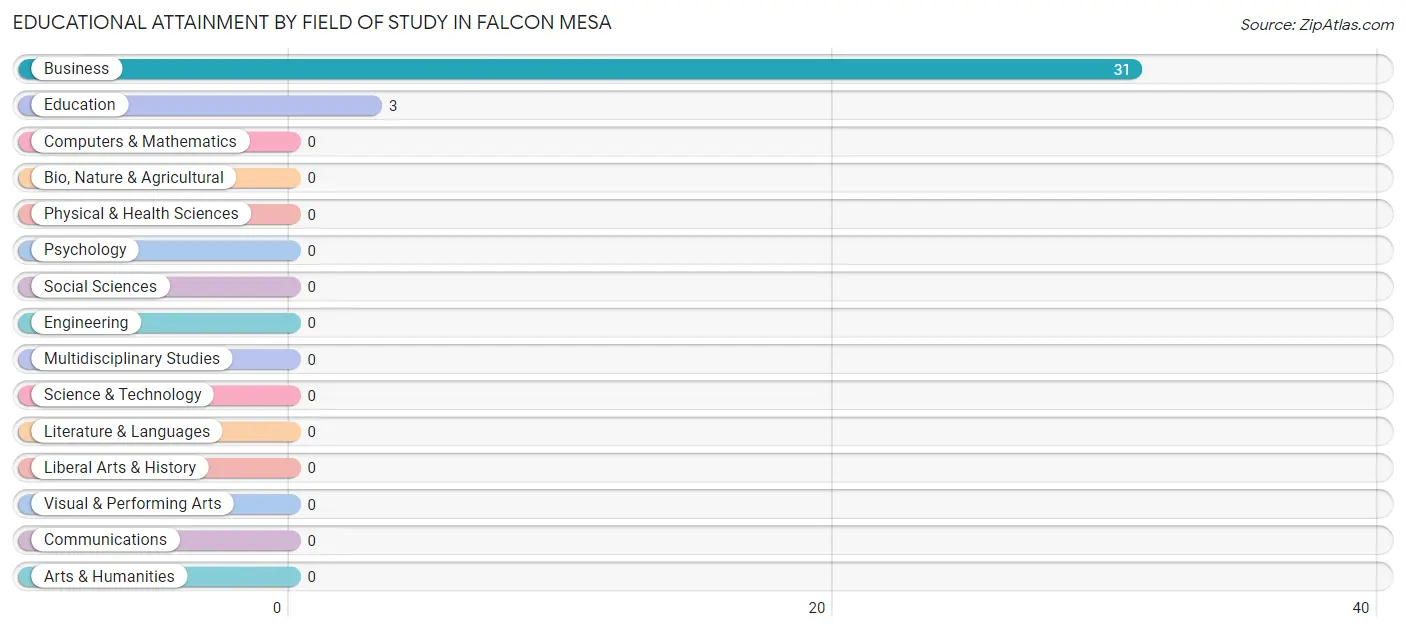
Educational Attainment by Field of Study in Falcon Mesa
Business (31 | 91.2%), and education (3 | 8.8%) are the most common fields of study among 34 individuals in Falcon Mesa who have obtained a bachelor's degree or higher.
| Field of Study | # Graduates | % Graduates |
| Computers & Mathematics | 0 | 0.0% |
| Bio, Nature & Agricultural | 0 | 0.0% |
| Physical & Health Sciences | 0 | 0.0% |
| Psychology | 0 | 0.0% |
| Social Sciences | 0 | 0.0% |
| Engineering | 0 | 0.0% |
| Multidisciplinary Studies | 0 | 0.0% |
| Science & Technology | 0 | 0.0% |
| Business | 31 | 91.2% |
| Education | 3 | 8.8% |
| Literature & Languages | 0 | 0.0% |
| Liberal Arts & History | 0 | 0.0% |
| Visual & Performing Arts | 0 | 0.0% |
| Communications | 0 | 0.0% |
| Arts & Humanities | 0 | 0.0% |
| Total | 34 | 100.0% |
Transportation & Commute in Falcon Mesa
Vehicle Availability by Sex in Falcon Mesa
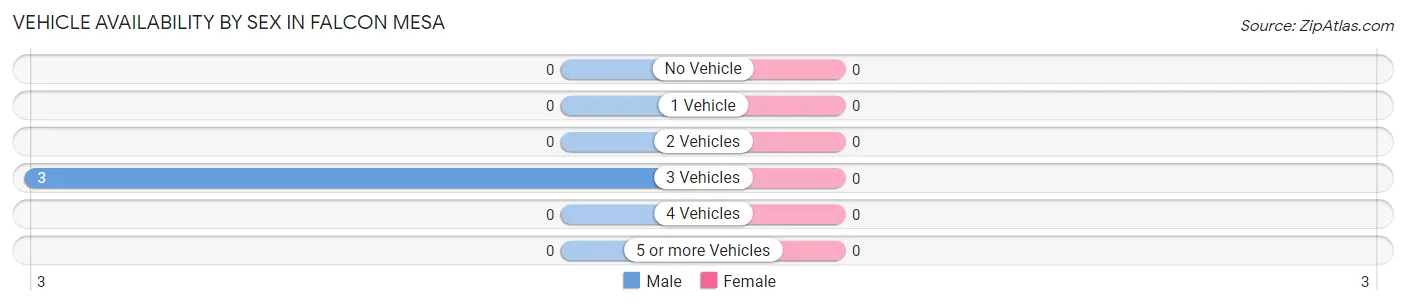
| Vehicles Available | Male | Female |
| No Vehicle | 0 (0.0%) | 0 (0.0%) |
| 1 Vehicle | 0 (0.0%) | 0 (0.0%) |
| 2 Vehicles | 0 (0.0%) | 0 (0.0%) |
| 3 Vehicles | 3 (100.0%) | 0 (0.0%) |
| 4 Vehicles | 0 (0.0%) | 0 (0.0%) |
| 5 or more Vehicles | 0 (0.0%) | 0 (0.0%) |
| Total | 3 (100.0%) | 0 (0.0%) |
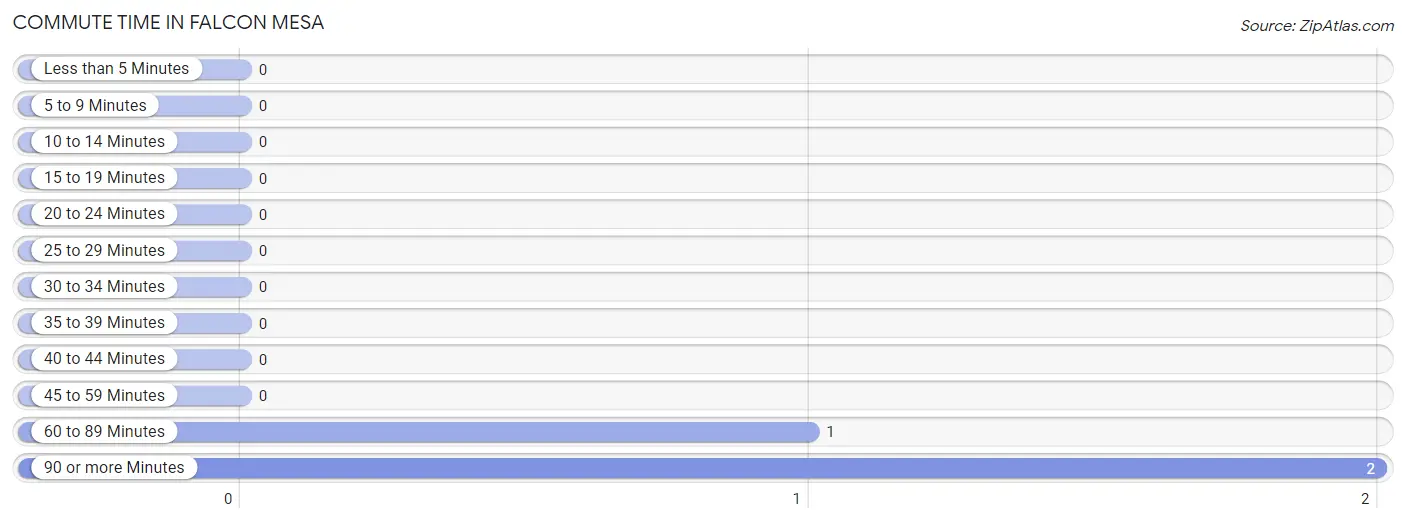
Commute Time in Falcon Mesa
The most frequently occuring commute durations in Falcon Mesa are 90 or more minutes (2 commuters, 66.7%), 60 to 89 minutes (1 commuters, 33.3%), and less than 5 minutes (0 commuters, 0.0%).
| Commute Time | # Commuters | % Commuters |
| Less than 5 Minutes | 0 | 0.0% |
| 5 to 9 Minutes | 0 | 0.0% |
| 10 to 14 Minutes | 0 | 0.0% |
| 15 to 19 Minutes | 0 | 0.0% |
| 20 to 24 Minutes | 0 | 0.0% |
| 25 to 29 Minutes | 0 | 0.0% |
| 30 to 34 Minutes | 0 | 0.0% |
| 35 to 39 Minutes | 0 | 0.0% |
| 40 to 44 Minutes | 0 | 0.0% |
| 45 to 59 Minutes | 0 | 0.0% |
| 60 to 89 Minutes | 1 | 33.3% |
| 90 or more Minutes | 2 | 66.7% |
Commute Time by Sex in Falcon Mesa
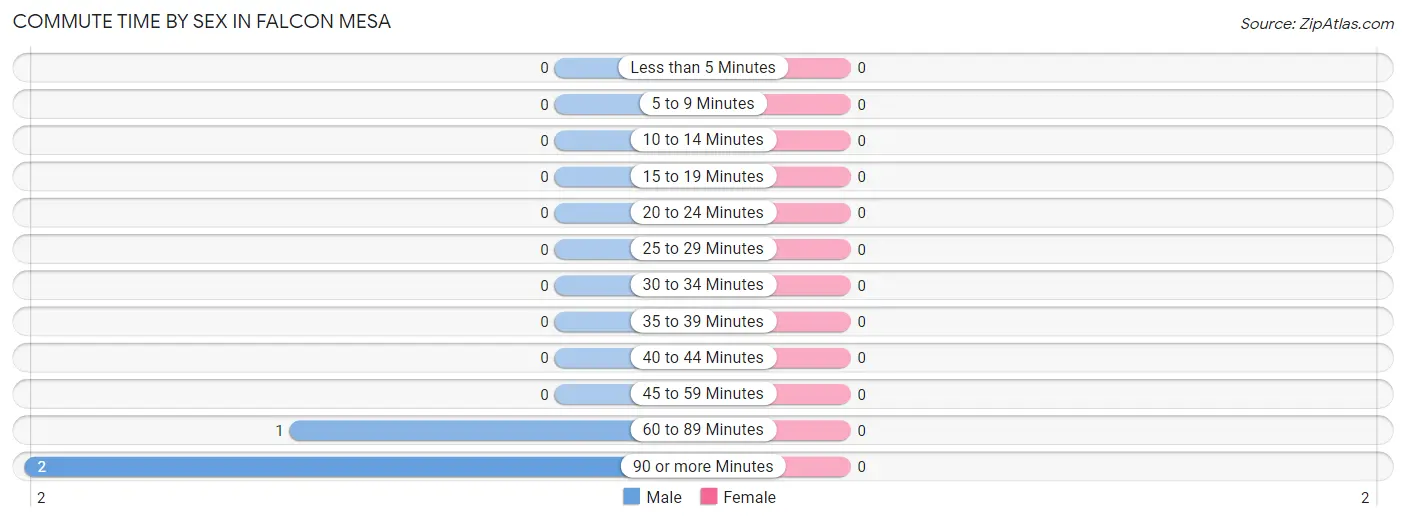
| Commute Time | Male | Female |
| Less than 5 Minutes | 0 (0.0%) | 0 (0.0%) |
| 5 to 9 Minutes | 0 (0.0%) | 0 (0.0%) |
| 10 to 14 Minutes | 0 (0.0%) | 0 (0.0%) |
| 15 to 19 Minutes | 0 (0.0%) | 0 (0.0%) |
| 20 to 24 Minutes | 0 (0.0%) | 0 (0.0%) |
| 25 to 29 Minutes | 0 (0.0%) | 0 (0.0%) |
| 30 to 34 Minutes | 0 (0.0%) | 0 (0.0%) |
| 35 to 39 Minutes | 0 (0.0%) | 0 (0.0%) |
| 40 to 44 Minutes | 0 (0.0%) | 0 (0.0%) |
| 45 to 59 Minutes | 0 (0.0%) | 0 (0.0%) |
| 60 to 89 Minutes | 1 (33.3%) | 0 (0.0%) |
| 90 or more Minutes | 2 (66.7%) | 0 (0.0%) |
Time of Departure to Work by Sex in Falcon Mesa
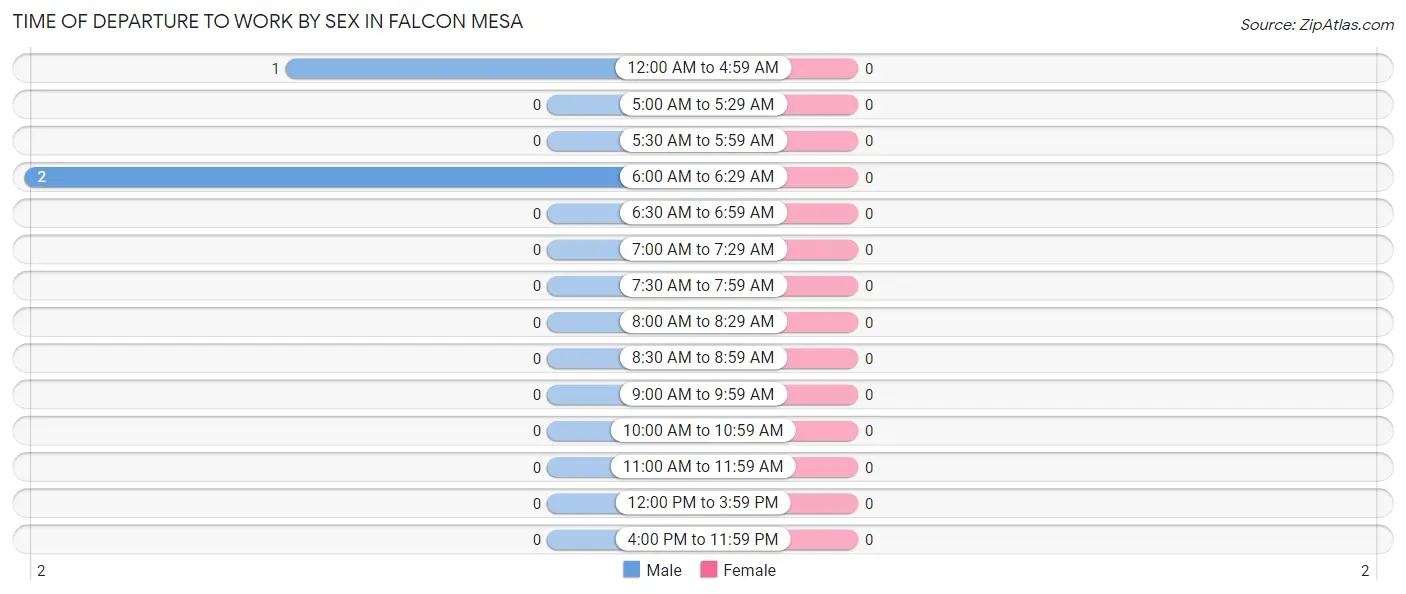
| Time of Departure | Male | Female |
| 12:00 AM to 4:59 AM | 1 (33.3%) | 0 (0.0%) |
| 5:00 AM to 5:29 AM | 0 (0.0%) | 0 (0.0%) |
| 5:30 AM to 5:59 AM | 0 (0.0%) | 0 (0.0%) |
| 6:00 AM to 6:29 AM | 2 (66.7%) | 0 (0.0%) |
| 6:30 AM to 6:59 AM | 0 (0.0%) | 0 (0.0%) |
| 7:00 AM to 7:29 AM | 0 (0.0%) | 0 (0.0%) |
| 7:30 AM to 7:59 AM | 0 (0.0%) | 0 (0.0%) |
| 8:00 AM to 8:29 AM | 0 (0.0%) | 0 (0.0%) |
| 8:30 AM to 8:59 AM | 0 (0.0%) | 0 (0.0%) |
| 9:00 AM to 9:59 AM | 0 (0.0%) | 0 (0.0%) |
| 10:00 AM to 10:59 AM | 0 (0.0%) | 0 (0.0%) |
| 11:00 AM to 11:59 AM | 0 (0.0%) | 0 (0.0%) |
| 12:00 PM to 3:59 PM | 0 (0.0%) | 0 (0.0%) |
| 4:00 PM to 11:59 PM | 0 (0.0%) | 0 (0.0%) |
| Total | 3 (100.0%) | 0 (0.0%) |
Housing Occupancy in Falcon Mesa
Occupancy by Ownership in Falcon Mesa
Of the total 90 dwellings in Falcon Mesa, owner-occupied units account for 90 (100.0%), while renter-occupied units make up 0 (0.0%).
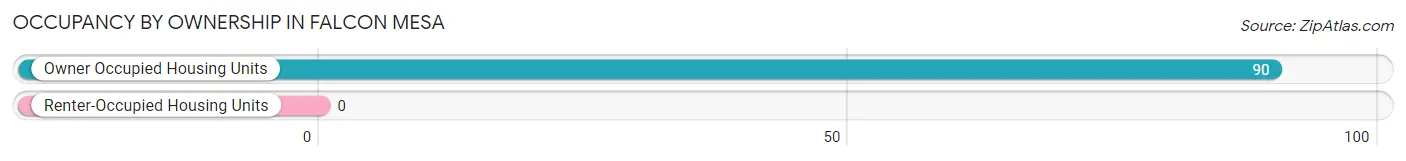
| Occupancy | # Housing Units | % Housing Units |
| Owner Occupied Housing Units | 90 | 100.0% |
| Renter-Occupied Housing Units | 0 | 0.0% |
| Total Occupied Housing Units | 90 | 100.0% |
Occupancy by Household Size in Falcon Mesa
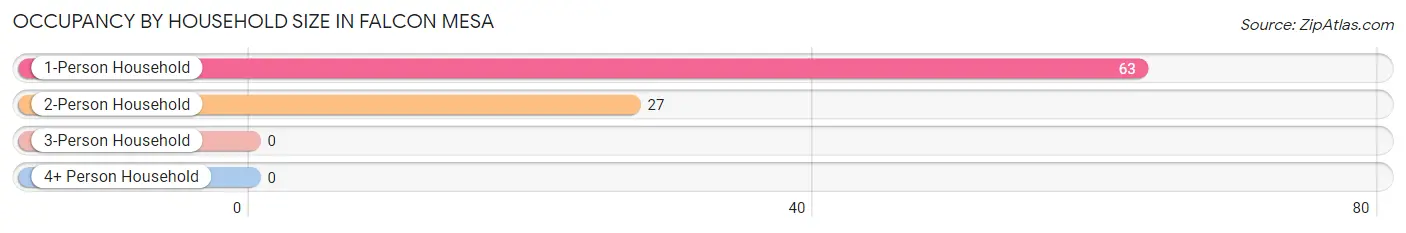
| Household Size | # Housing Units | % Housing Units |
| 1-Person Household | 63 | 70.0% |
| 2-Person Household | 27 | 30.0% |
| 3-Person Household | 0 | 0.0% |
| 4+ Person Household | 0 | 0.0% |
| Total Housing Units | 90 | 100.0% |
Occupancy by Ownership by Household Size in Falcon Mesa
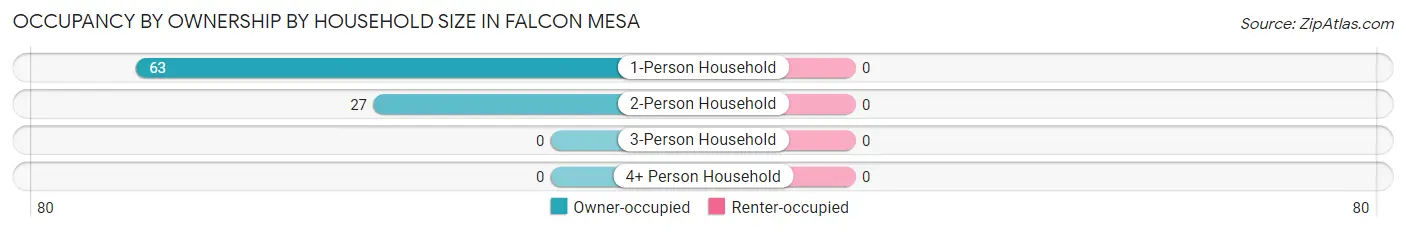
| Household Size | Owner-occupied | Renter-occupied |
| 1-Person Household | 63 (100.0%) | 0 (0.0%) |
| 2-Person Household | 27 (100.0%) | 0 (0.0%) |
| 3-Person Household | 0 (0.0%) | 0 (0.0%) |
| 4+ Person Household | 0 (0.0%) | 0 (0.0%) |
| Total Housing Units | 90 (100.0%) | 0 (0.0%) |
Occupancy by Educational Attainment in Falcon Mesa
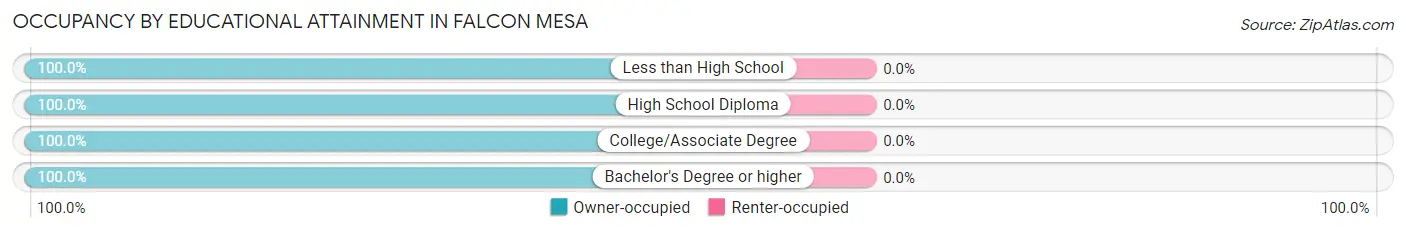
| Household Size | Owner-occupied | Renter-occupied |
| Less than High School | 13 (100.0%) | 0 (0.0%) |
| High School Diploma | 21 (100.0%) | 0 (0.0%) |
| College/Associate Degree | 43 (100.0%) | 0 (0.0%) |
| Bachelor's Degree or higher | 13 (100.0%) | 0 (0.0%) |
Occupancy by Age of Householder in Falcon Mesa
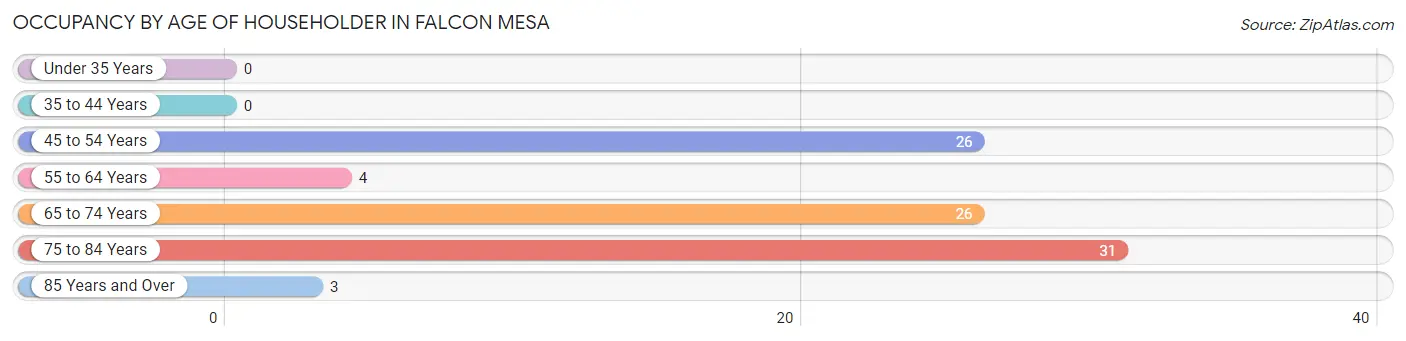
| Age Bracket | # Households | % Households |
| Under 35 Years | 0 | 0.0% |
| 35 to 44 Years | 0 | 0.0% |
| 45 to 54 Years | 26 | 28.9% |
| 55 to 64 Years | 4 | 4.4% |
| 65 to 74 Years | 26 | 28.9% |
| 75 to 84 Years | 31 | 34.4% |
| 85 Years and Over | 3 | 3.3% |
| Total | 90 | 100.0% |
Housing Finances in Falcon Mesa
Median Income by Occupancy in Falcon Mesa
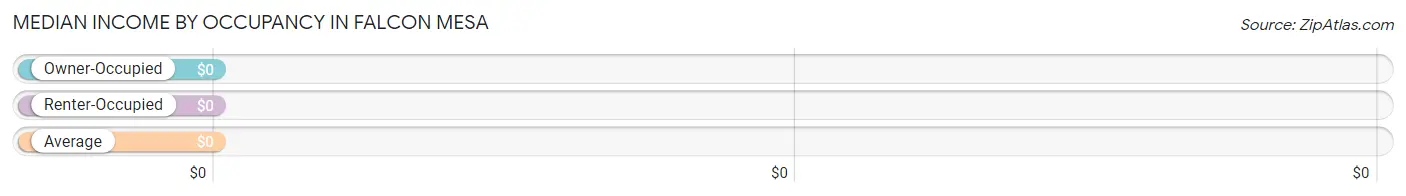
| Occupancy Type | # Households | Median Income |
| Owner-Occupied | 90 (100.0%) | $0 |
| Renter-Occupied | 0 (0.0%) | $0 |
| Average | 90 (100.0%) | $0 |
Occupancy by Householder Income Bracket in Falcon Mesa
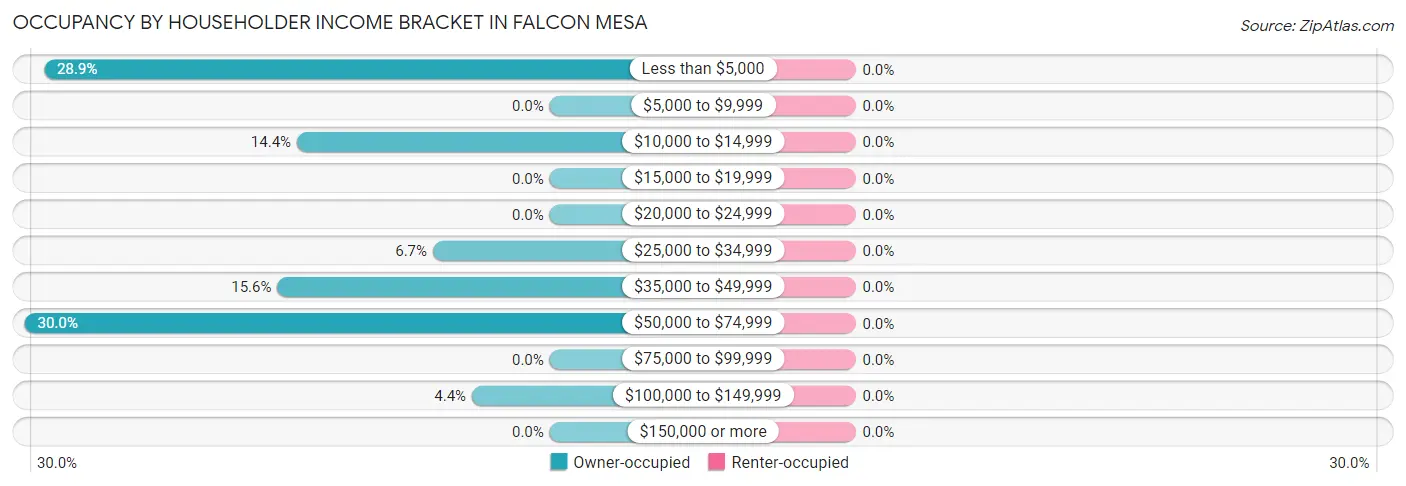
| Income Bracket | Owner-occupied | Renter-occupied |
| Less than $5,000 | 26 (28.9%) | 0 (0.0%) |
| $5,000 to $9,999 | 0 (0.0%) | 0 (0.0%) |
| $10,000 to $14,999 | 13 (14.4%) | 0 (0.0%) |
| $15,000 to $19,999 | 0 (0.0%) | 0 (0.0%) |
| $20,000 to $24,999 | 0 (0.0%) | 0 (0.0%) |
| $25,000 to $34,999 | 6 (6.7%) | 0 (0.0%) |
| $35,000 to $49,999 | 14 (15.6%) | 0 (0.0%) |
| $50,000 to $74,999 | 27 (30.0%) | 0 (0.0%) |
| $75,000 to $99,999 | 0 (0.0%) | 0 (0.0%) |
| $100,000 to $149,999 | 4 (4.4%) | 0 (0.0%) |
| $150,000 or more | 0 (0.0%) | 0 (0.0%) |
| Total | 90 (100.0%) | 0 (0.0%) |
Monthly Housing Cost Tiers in Falcon Mesa
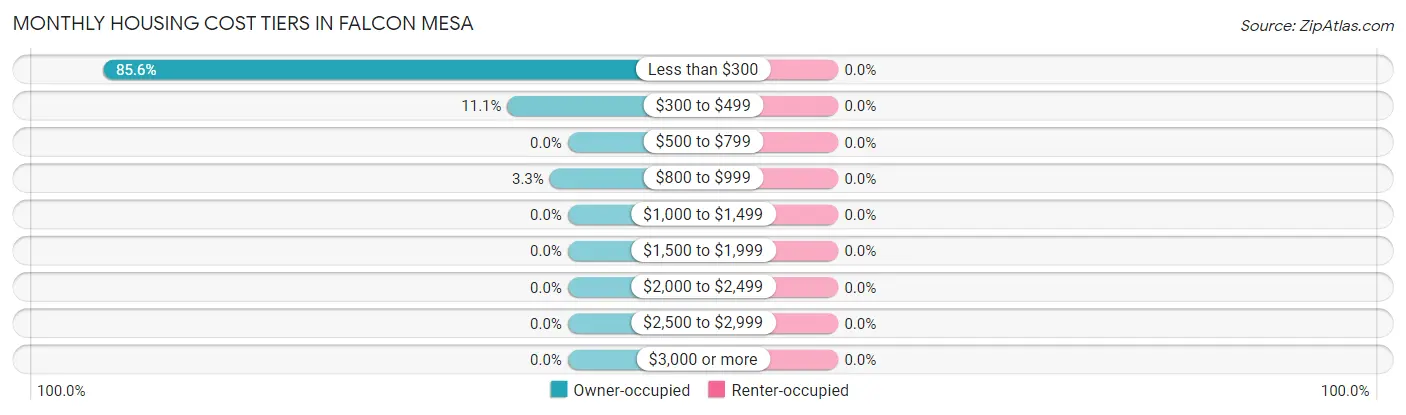
| Monthly Cost | Owner-occupied | Renter-occupied |
| Less than $300 | 77 (85.6%) | 0 (0.0%) |
| $300 to $499 | 10 (11.1%) | 0 (0.0%) |
| $500 to $799 | 0 (0.0%) | 0 (0.0%) |
| $800 to $999 | 3 (3.3%) | 0 (0.0%) |
| $1,000 to $1,499 | 0 (0.0%) | 0 (0.0%) |
| $1,500 to $1,999 | 0 (0.0%) | 0 (0.0%) |
| $2,000 to $2,499 | 0 (0.0%) | 0 (0.0%) |
| $2,500 to $2,999 | 0 (0.0%) | 0 (0.0%) |
| $3,000 or more | 0 (0.0%) | 0 (0.0%) |
| Total | 90 (100.0%) | 0 (0.0%) |
Physical Housing Characteristics in Falcon Mesa
Housing Structures in Falcon Mesa
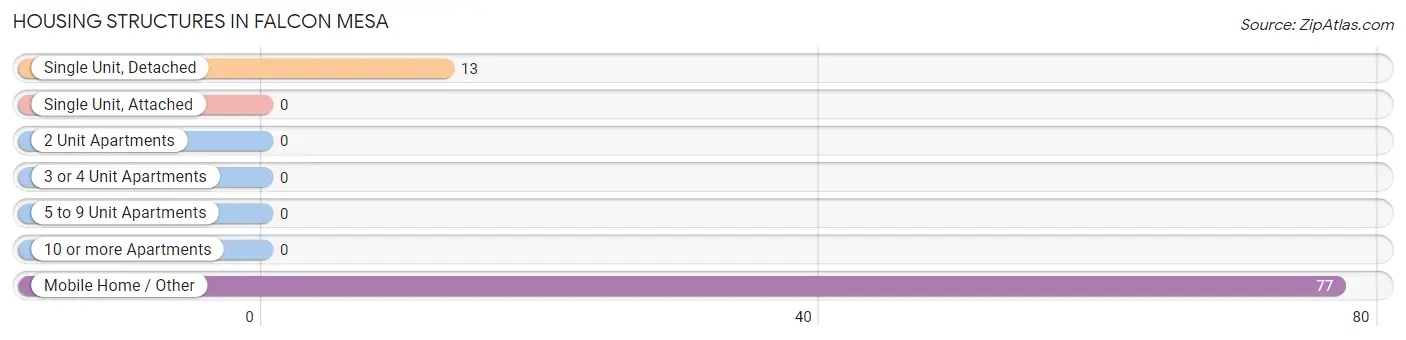
| Structure Type | # Housing Units | % Housing Units |
| Single Unit, Detached | 13 | 14.4% |
| Single Unit, Attached | 0 | 0.0% |
| 2 Unit Apartments | 0 | 0.0% |
| 3 or 4 Unit Apartments | 0 | 0.0% |
| 5 to 9 Unit Apartments | 0 | 0.0% |
| 10 or more Apartments | 0 | 0.0% |
| Mobile Home / Other | 77 | 85.6% |
| Total | 90 | 100.0% |
Housing Structures by Occupancy in Falcon Mesa
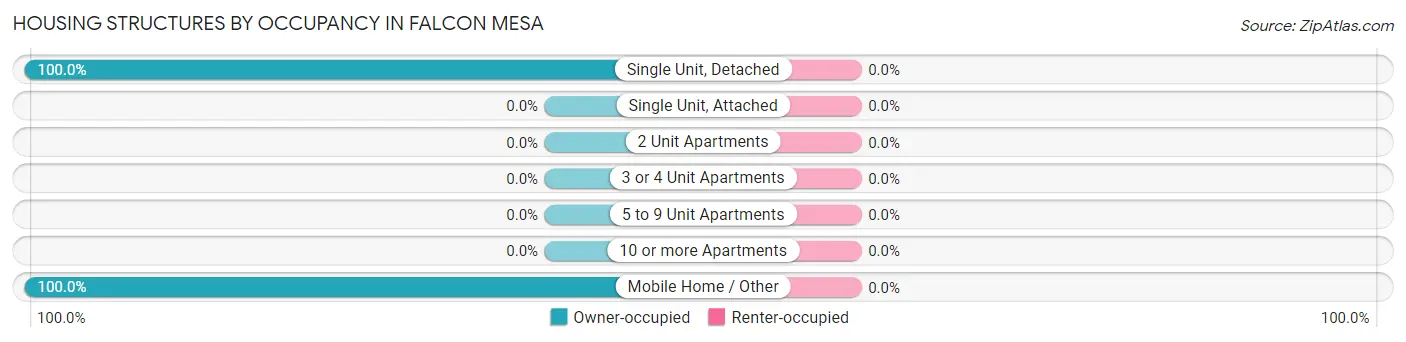
| Structure Type | Owner-occupied | Renter-occupied |
| Single Unit, Detached | 13 (100.0%) | 0 (0.0%) |
| Single Unit, Attached | 0 (0.0%) | 0 (0.0%) |
| 2 Unit Apartments | 0 (0.0%) | 0 (0.0%) |
| 3 or 4 Unit Apartments | 0 (0.0%) | 0 (0.0%) |
| 5 to 9 Unit Apartments | 0 (0.0%) | 0 (0.0%) |
| 10 or more Apartments | 0 (0.0%) | 0 (0.0%) |
| Mobile Home / Other | 77 (100.0%) | 0 (0.0%) |
| Total | 90 (100.0%) | 0 (0.0%) |
Housing Structures by Number of Rooms in Falcon Mesa
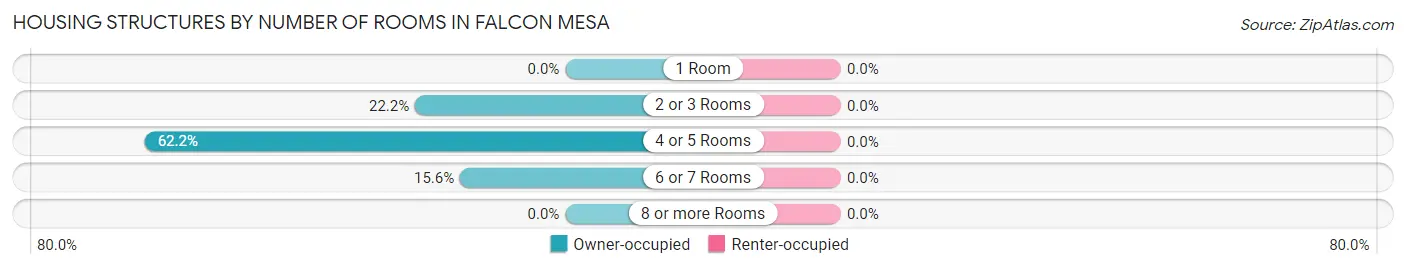
| Number of Rooms | Owner-occupied | Renter-occupied |
| 1 Room | 0 (0.0%) | 0 (0.0%) |
| 2 or 3 Rooms | 20 (22.2%) | 0 (0.0%) |
| 4 or 5 Rooms | 56 (62.2%) | 0 (0.0%) |
| 6 or 7 Rooms | 14 (15.6%) | 0 (0.0%) |
| 8 or more Rooms | 0 (0.0%) | 0 (0.0%) |
| Total | 90 (100.0%) | 0 (0.0%) |
Housing Structure by Heating Type in Falcon Mesa
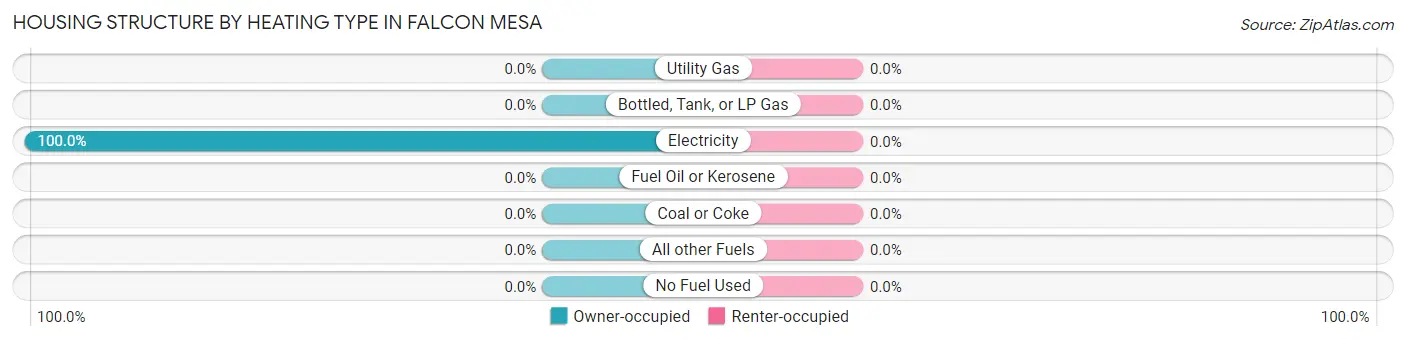
| Heating Type | Owner-occupied | Renter-occupied |
| Utility Gas | 0 (0.0%) | 0 (0.0%) |
| Bottled, Tank, or LP Gas | 0 (0.0%) | 0 (0.0%) |
| Electricity | 90 (100.0%) | 0 (0.0%) |
| Fuel Oil or Kerosene | 0 (0.0%) | 0 (0.0%) |
| Coal or Coke | 0 (0.0%) | 0 (0.0%) |
| All other Fuels | 0 (0.0%) | 0 (0.0%) |
| No Fuel Used | 0 (0.0%) | 0 (0.0%) |
| Total | 90 (100.0%) | 0 (0.0%) |
Household Vehicle Usage in Falcon Mesa
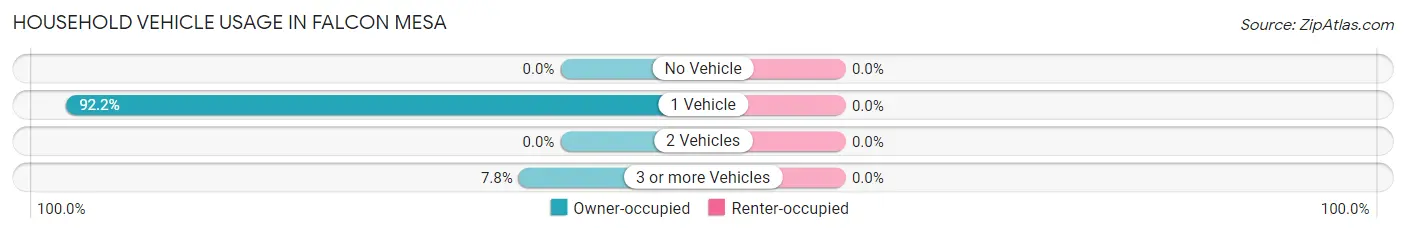
| Vehicles per Household | Owner-occupied | Renter-occupied |
| No Vehicle | 0 (0.0%) | 0 (0.0%) |
| 1 Vehicle | 83 (92.2%) | 0 (0.0%) |
| 2 Vehicles | 0 (0.0%) | 0 (0.0%) |
| 3 or more Vehicles | 7 (7.8%) | 0 (0.0%) |
| Total | 90 (100.0%) | 0 (0.0%) |
Real Estate & Mortgages in Falcon Mesa
Real Estate and Mortgage Overview in Falcon Mesa
| Characteristic | Without Mortgage | With Mortgage |
| Housing Units | 90 | 0 |
| Median Property Value | - | - |
| Median Household Income | - | - |
| Monthly Housing Costs | $249 | $0 |
| Real Estate Taxes | $199 | $0 |
Property Value by Mortgage Status in Falcon Mesa
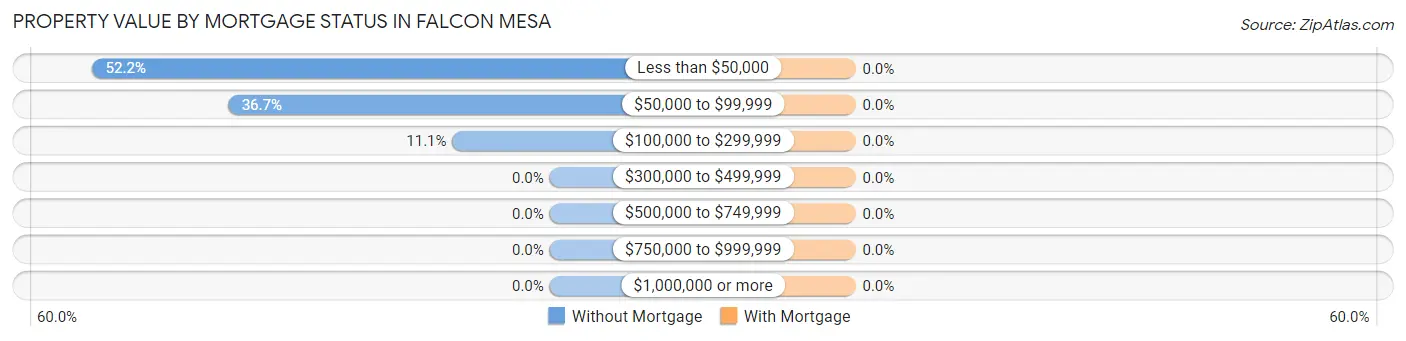
| Property Value | Without Mortgage | With Mortgage |
| Less than $50,000 | 47 (52.2%) | 0 (0.0%) |
| $50,000 to $99,999 | 33 (36.7%) | 0 (0.0%) |
| $100,000 to $299,999 | 10 (11.1%) | 0 (0.0%) |
| $300,000 to $499,999 | 0 (0.0%) | 0 (0.0%) |
| $500,000 to $749,999 | 0 (0.0%) | 0 (0.0%) |
| $750,000 to $999,999 | 0 (0.0%) | 0 (0.0%) |
| $1,000,000 or more | 0 (0.0%) | 0 (0.0%) |
| Total | 90 (100.0%) | 0 (0.0%) |
Household Income by Mortgage Status in Falcon Mesa
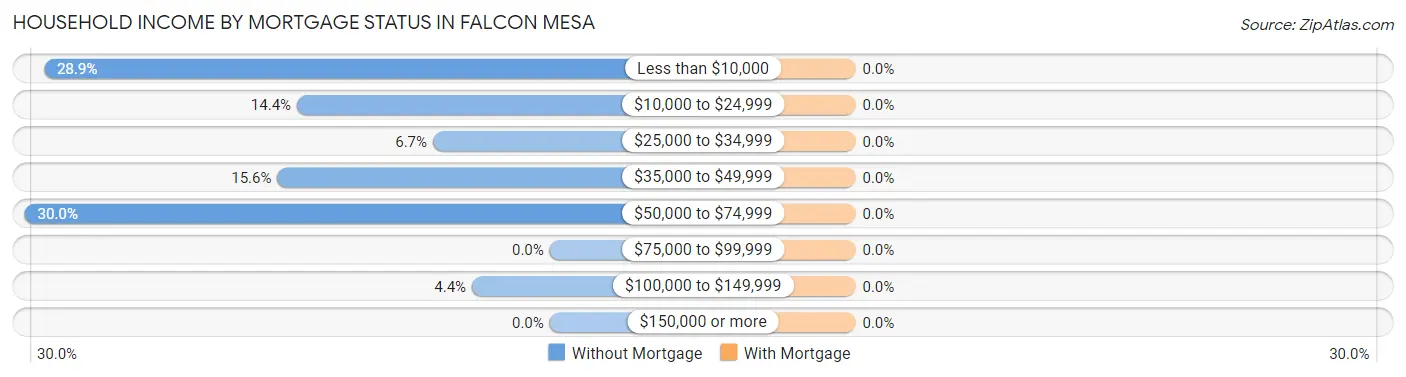
| Household Income | Without Mortgage | With Mortgage |
| Less than $10,000 | 26 (28.9%) | 0 (0.0%) |
| $10,000 to $24,999 | 13 (14.4%) | 0 (0.0%) |
| $25,000 to $34,999 | 6 (6.7%) | 0 (0.0%) |
| $35,000 to $49,999 | 14 (15.6%) | 0 (0.0%) |
| $50,000 to $74,999 | 27 (30.0%) | 0 (0.0%) |
| $75,000 to $99,999 | 0 (0.0%) | 0 (0.0%) |
| $100,000 to $149,999 | 4 (4.4%) | 0 (0.0%) |
| $150,000 or more | 0 (0.0%) | 0 (0.0%) |
| Total | 90 (100.0%) | 0 (0.0%) |
Property Value to Household Income Ratio in Falcon Mesa
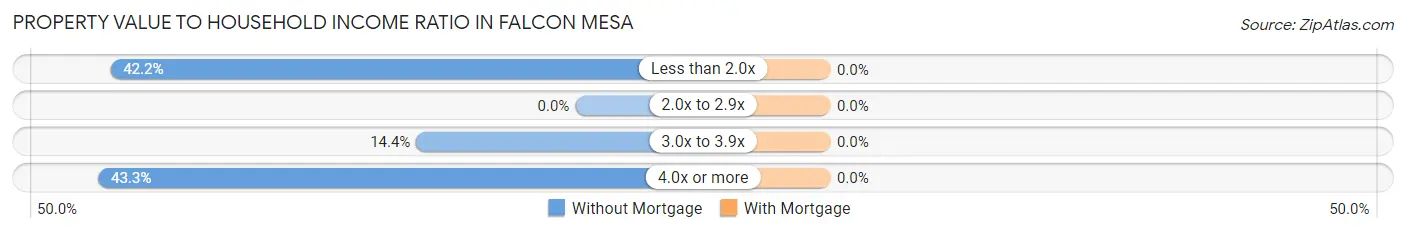
| Value-to-Income Ratio | Without Mortgage | With Mortgage |
| Less than 2.0x | 38 (42.2%) | 0 (0.0%) |
| 2.0x to 2.9x | 0 (0.0%) | 0 (0.0%) |
| 3.0x to 3.9x | 13 (14.4%) | 0 (0.0%) |
| 4.0x or more | 39 (43.3%) | 0 (0.0%) |
| Total | 90 (100.0%) | 0 (0.0%) |
Real Estate Taxes by Mortgage Status in Falcon Mesa
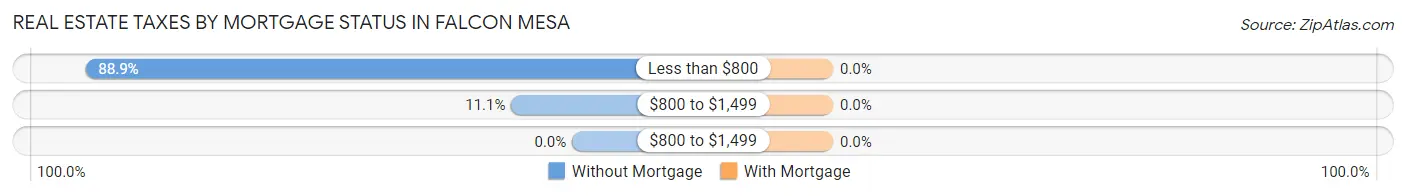
| Property Taxes | Without Mortgage | With Mortgage |
| Less than $800 | 80 (88.9%) | 0 (0.0%) |
| $800 to $1,499 | 10 (11.1%) | 0 (0.0%) |
| $800 to $1,499 | 0 (0.0%) | 0 (0.0%) |
| Total | 90 (100.0%) | 0 (0.0%) |
Health & Disability in Falcon Mesa
Health Insurance Coverage by Age in Falcon Mesa
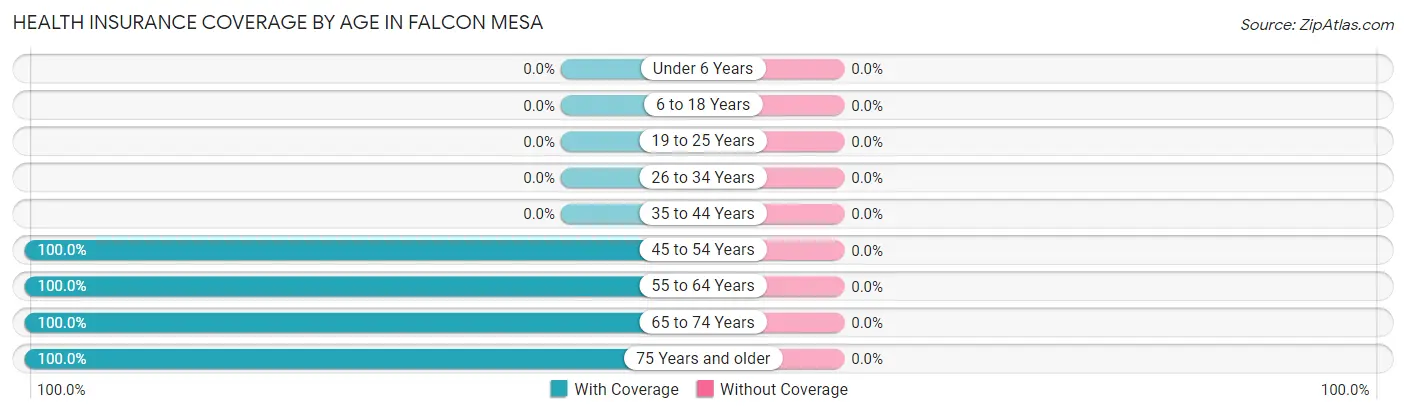
| Age Bracket | With Coverage | Without Coverage |
| Under 6 Years | 0 (0.0%) | 0 (0.0%) |
| 6 to 18 Years | 0 (0.0%) | 0 (0.0%) |
| 19 to 25 Years | 0 (0.0%) | 0 (0.0%) |
| 26 to 34 Years | 0 (0.0%) | 0 (0.0%) |
| 35 to 44 Years | 0 (0.0%) | 0 (0.0%) |
| 45 to 54 Years | 26 (100.0%) | 0 (0.0%) |
| 55 to 64 Years | 5 (100.0%) | 0 (0.0%) |
| 65 to 74 Years | 49 (100.0%) | 0 (0.0%) |
| 75 Years and older | 38 (100.0%) | 0 (0.0%) |
| Total | 118 (100.0%) | 0 (0.0%) |
Health Insurance Coverage by Citizenship Status in Falcon Mesa
| Citizenship Status | With Coverage | Without Coverage |
| Native Born | 0 (0.0%) | 0 (0.0%) |
| Foreign Born, Citizen | 0 (0.0%) | 0 (0.0%) |
| Foreign Born, not a Citizen | 0 (0.0%) | 0 (0.0%) |
Health Insurance Coverage by Household Income in Falcon Mesa
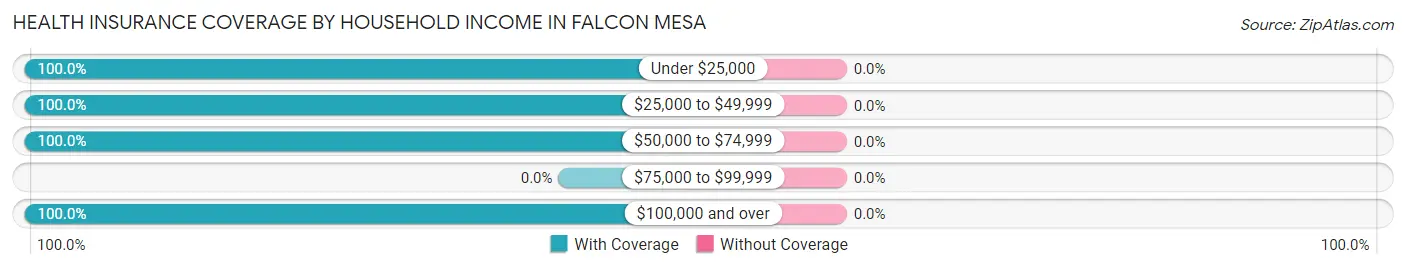
| Household Income | With Coverage | Without Coverage |
| Under $25,000 | 39 (100.0%) | 0 (0.0%) |
| $25,000 to $49,999 | 26 (100.0%) | 0 (0.0%) |
| $50,000 to $74,999 | 48 (100.0%) | 0 (0.0%) |
| $75,000 to $99,999 | 0 (0.0%) | 0 (0.0%) |
| $100,000 and over | 5 (100.0%) | 0 (0.0%) |
Public vs Private Health Insurance Coverage by Age in Falcon Mesa
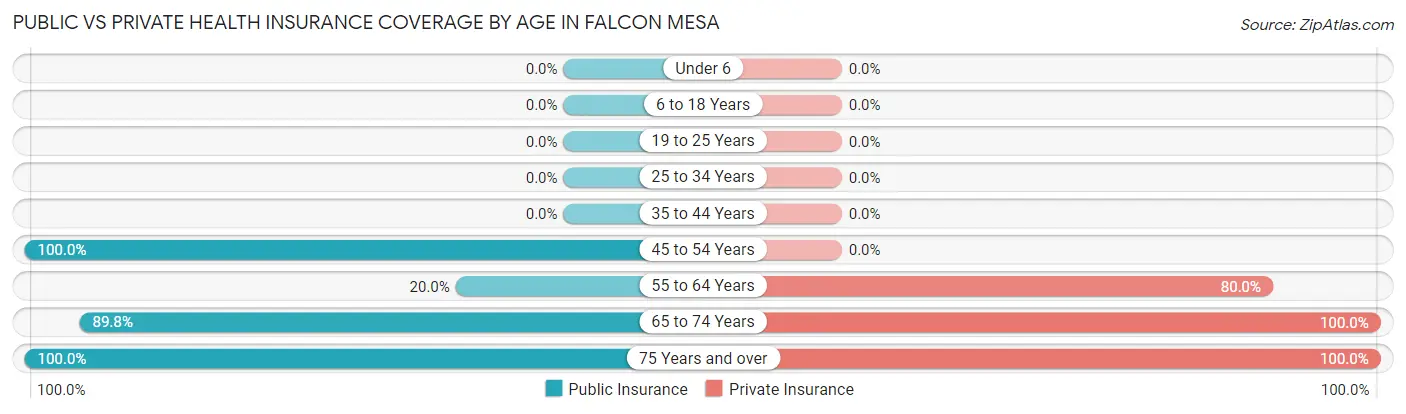
| Age Bracket | Public Insurance | Private Insurance |
| Under 6 | 0 (0.0%) | 0 (0.0%) |
| 6 to 18 Years | 0 (0.0%) | 0 (0.0%) |
| 19 to 25 Years | 0 (0.0%) | 0 (0.0%) |
| 25 to 34 Years | 0 (0.0%) | 0 (0.0%) |
| 35 to 44 Years | 0 (0.0%) | 0 (0.0%) |
| 45 to 54 Years | 26 (100.0%) | 0 (0.0%) |
| 55 to 64 Years | 1 (20.0%) | 4 (80.0%) |
| 65 to 74 Years | 44 (89.8%) | 49 (100.0%) |
| 75 Years and over | 38 (100.0%) | 38 (100.0%) |
| Total | 109 (92.4%) | 91 (77.1%) |
Disability Status by Sex by Age in Falcon Mesa
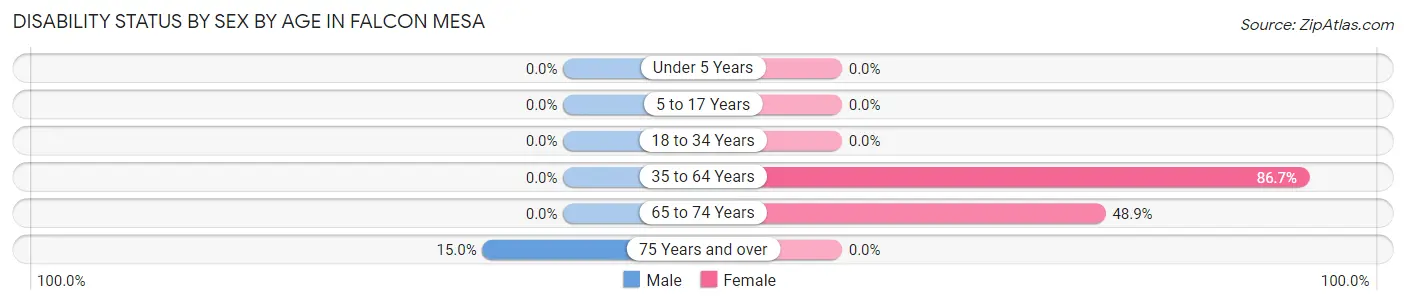
| Age Bracket | Male | Female |
| Under 5 Years | 0 (0.0%) | 0 (0.0%) |
| 5 to 17 Years | 0 (0.0%) | 0 (0.0%) |
| 18 to 34 Years | 0 (0.0%) | 0 (0.0%) |
| 35 to 64 Years | 0 (0.0%) | 26 (86.7%) |
| 65 to 74 Years | 0 (0.0%) | 23 (48.9%) |
| 75 Years and over | 3 (15.0%) | 0 (0.0%) |
Disability Class by Sex by Age in Falcon Mesa
Disability Class: Hearing Difficulty
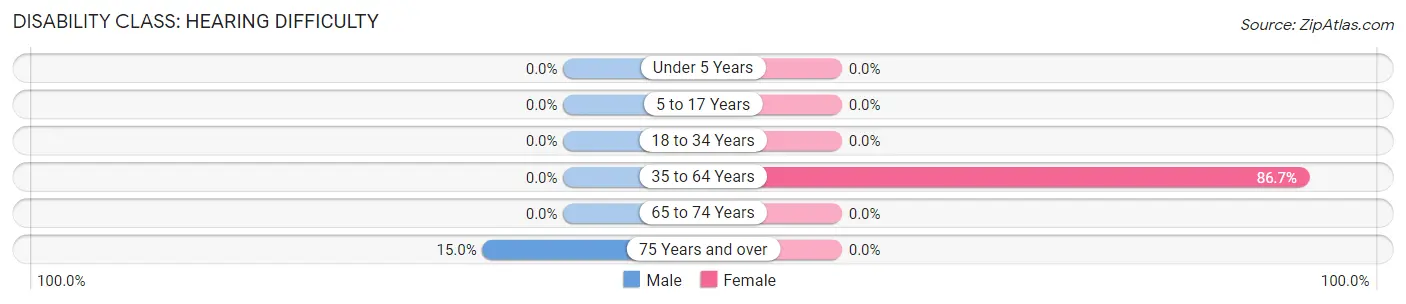
| Age Bracket | Male | Female |
| Under 5 Years | 0 (0.0%) | 0 (0.0%) |
| 5 to 17 Years | 0 (0.0%) | 0 (0.0%) |
| 18 to 34 Years | 0 (0.0%) | 0 (0.0%) |
| 35 to 64 Years | 0 (0.0%) | 26 (86.7%) |
| 65 to 74 Years | 0 (0.0%) | 0 (0.0%) |
| 75 Years and over | 3 (15.0%) | 0 (0.0%) |
Disability Class: Vision Difficulty
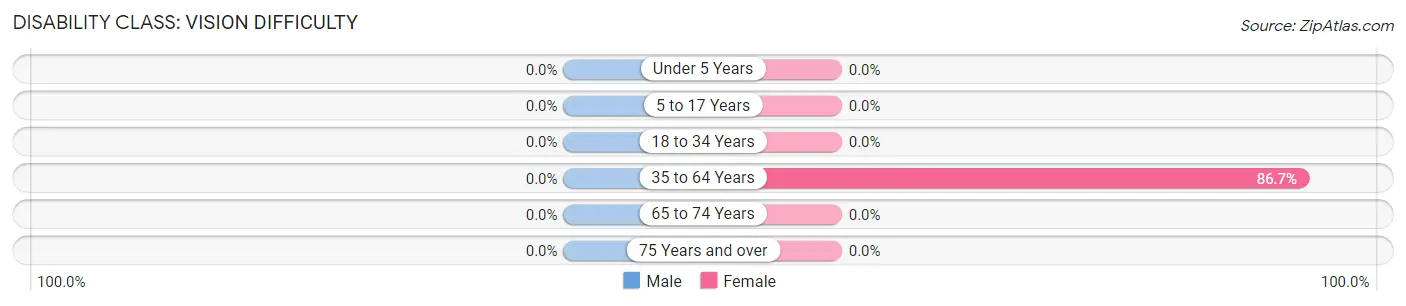
| Age Bracket | Male | Female |
| Under 5 Years | 0 (0.0%) | 0 (0.0%) |
| 5 to 17 Years | 0 (0.0%) | 0 (0.0%) |
| 18 to 34 Years | 0 (0.0%) | 0 (0.0%) |
| 35 to 64 Years | 0 (0.0%) | 26 (86.7%) |
| 65 to 74 Years | 0 (0.0%) | 0 (0.0%) |
| 75 Years and over | 0 (0.0%) | 0 (0.0%) |
Disability Class: Cognitive Difficulty
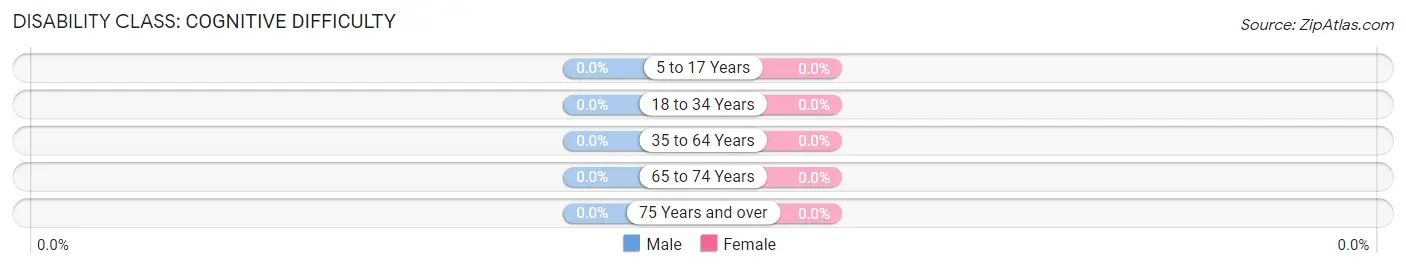
| Age Bracket | Male | Female |
| 5 to 17 Years | 0 (0.0%) | 0 (0.0%) |
| 18 to 34 Years | 0 (0.0%) | 0 (0.0%) |
| 35 to 64 Years | 0 (0.0%) | 0 (0.0%) |
| 65 to 74 Years | 0 (0.0%) | 0 (0.0%) |
| 75 Years and over | 0 (0.0%) | 0 (0.0%) |
Disability Class: Ambulatory Difficulty
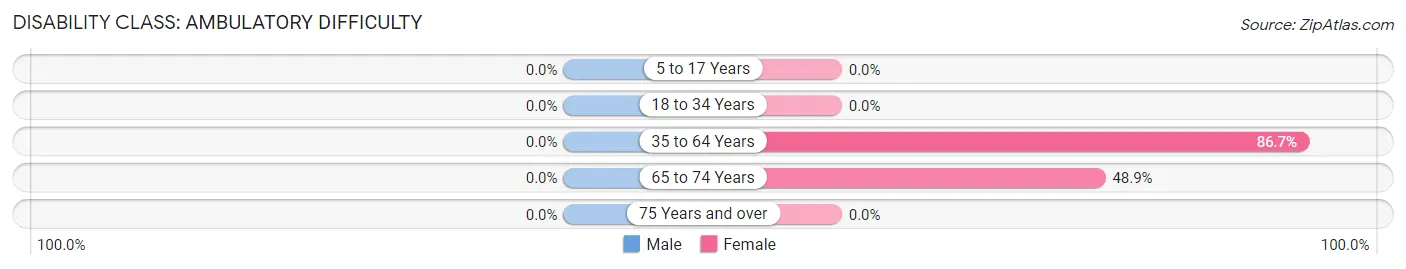
| Age Bracket | Male | Female |
| 5 to 17 Years | 0 (0.0%) | 0 (0.0%) |
| 18 to 34 Years | 0 (0.0%) | 0 (0.0%) |
| 35 to 64 Years | 0 (0.0%) | 26 (86.7%) |
| 65 to 74 Years | 0 (0.0%) | 23 (48.9%) |
| 75 Years and over | 0 (0.0%) | 0 (0.0%) |
Disability Class: Self-Care Difficulty
| Age Bracket | Male | Female |
| 5 to 17 Years | 0 (0.0%) | 0 (0.0%) |
| 18 to 34 Years | 0 (0.0%) | 0 (0.0%) |
| 35 to 64 Years | 0 (0.0%) | 0 (0.0%) |
| 65 to 74 Years | 0 (0.0%) | 0 (0.0%) |
| 75 Years and over | 0 (0.0%) | 0 (0.0%) |
Technology Access in Falcon Mesa
Computing Device Access in Falcon Mesa
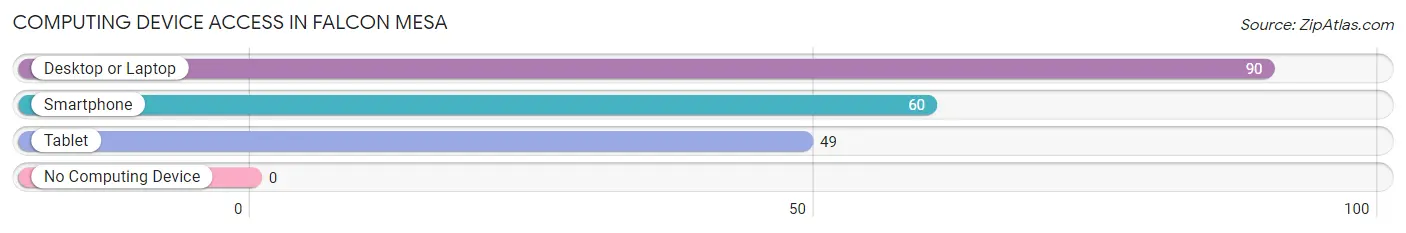
| Device Type | # Households | % Households |
| Desktop or Laptop | 90 | 100.0% |
| Smartphone | 60 | 66.7% |
| Tablet | 49 | 54.4% |
| No Computing Device | 0 | 0.0% |
| Total | 90 | 100.0% |
Internet Access in Falcon Mesa
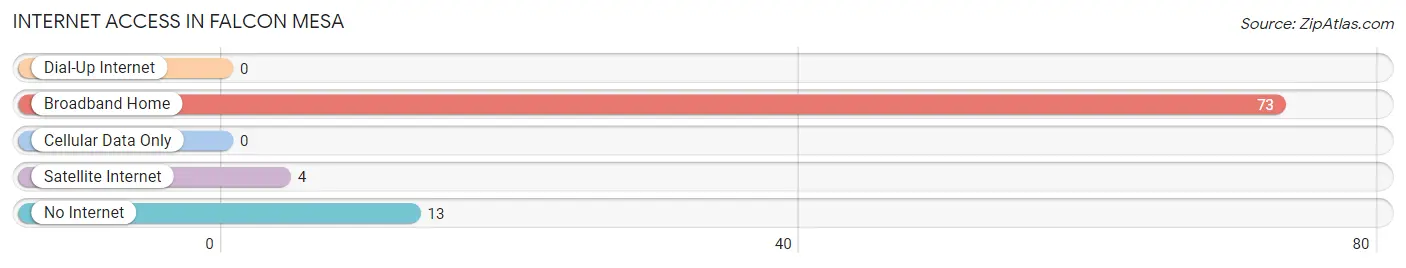
| Internet Type | # Households | % Households |
| Dial-Up Internet | 0 | 0.0% |
| Broadband Home | 73 | 81.1% |
| Cellular Data Only | 0 | 0.0% |
| Satellite Internet | 4 | 4.4% |
| No Internet | 13 | 14.4% |
| Total | 90 | 100.0% |
Falcon Mesa Summary
Falcon Mesa is a small town located in the western part of Texas, in the county of El Paso. It is situated on the banks of the Rio Grande, and is part of the El Paso metropolitan area. The town has a population of approximately 1,500 people, and is known for its rural charm and small-town atmosphere.
History
Falcon Mesa was founded in 1881 by a group of settlers from the nearby town of El Paso. The settlers were looking for a place to settle and start a new life, and they chose the area around Falcon Mesa because of its proximity to the Rio Grande. The town was named after the nearby Falcon Mesa, which is a large mesa that rises up from the desert floor.
The town quickly grew and prospered, and by the early 1900s it had become a thriving community. The town was home to a variety of businesses, including a general store, a blacksmith, a saloon, and a hotel. The town also had a school, a post office, and a church.
In the early 1900s, the town was also home to a large number of Mexican immigrants, who had come to the area to work in the local mines and ranches. The town was also home to a large number of Native Americans, who had been living in the area for centuries.
Geography
Falcon Mesa is located in the western part of Texas, in the county of El Paso. It is situated on the banks of the Rio Grande, and is part of the El Paso metropolitan area. The town is located at an elevation of 4,000 feet, and is surrounded by the Chihuahuan Desert.
The town is located in a semi-arid climate, with hot summers and mild winters. The average annual temperature is around 70 degrees Fahrenheit, and the average annual precipitation is around 10 inches.
Economy
The economy of Falcon Mesa is largely based on agriculture and ranching. The town is home to a number of farms and ranches, which produce a variety of crops and livestock. The town is also home to a number of small businesses, including restaurants, stores, and other services.
The town is also home to a number of oil and gas wells, which provide jobs and income to the local economy. The town is also home to a number of manufacturing plants, which produce a variety of products.
Demographics
As of the 2010 census, the population of Falcon Mesa was 1,500 people. The town is predominantly Hispanic, with a large majority of the population being of Mexican descent. The town is also home to a small number of Native Americans, as well as a small number of African Americans and other ethnicities.
The median household income in Falcon Mesa is around $30,000, and the median home value is around $90,000. The town has a high rate of poverty, with around 25% of the population living below the poverty line.
Conclusion
Falcon Mesa is a small town located in the western part of Texas, in the county of El Paso. The town has a population of approximately 1,500 people, and is known for its rural charm and small-town atmosphere. The town is predominantly Hispanic, with a large majority of the population being of Mexican descent. The economy of Falcon Mesa is largely based on agriculture and ranching, and the town is also home to a number of small businesses, oil and gas wells, and manufacturing plants.
Common Questions
What is Per Capita Income in Falcon Mesa?
Per Capita income in Falcon Mesa is $26,119.
What is the Median Family Income in Falcon Mesa?
Median Family Income in Falcon Mesa is $73,309.
What is Inequality or Gini Index in Falcon Mesa?
Inequality or Gini Index in Falcon Mesa is 0.50.
What is the Total Population of Falcon Mesa?
Total Population of Falcon Mesa is 118.
What is the Total Male Population of Falcon Mesa?
Total Male Population of Falcon Mesa is 23.
What is the Total Female Population of Falcon Mesa?
Total Female Population of Falcon Mesa is 95.
What is the Ratio of Males per 100 Females in Falcon Mesa?
There are 24.21 Males per 100 Females in Falcon Mesa.
What is the Ratio of Females per 100 Males in Falcon Mesa?
There are 413.04 Females per 100 Males in Falcon Mesa.
What is the Median Population Age in Falcon Mesa?
Median Population Age in Falcon Mesa is 72.5 Years.
What is the Average Family Size in Falcon Mesa
Average Family Size in Falcon Mesa is 2.2 People.
What is the Average Household Size in Falcon Mesa
Average Household Size in Falcon Mesa is 1.3 People.
How Large is the Labor Force in Falcon Mesa?
There are 29 People in the Labor Forcein in Falcon Mesa.
What is the Percentage of People in the Labor Force in Falcon Mesa?
24.6% of People are in the Labor Force in Falcon Mesa.
What is the Unemployment Rate in Falcon Mesa?
Unemployment Rate in Falcon Mesa is 89.7%.