Zip Codes with the Highest Percentage of Population Employed in Transportation & Warehousing in North Richland Hills, TX
RELATED REPORTS & OPTIONS
Transportation & Warehousing
North Richland Hills
Compare Zip Codes
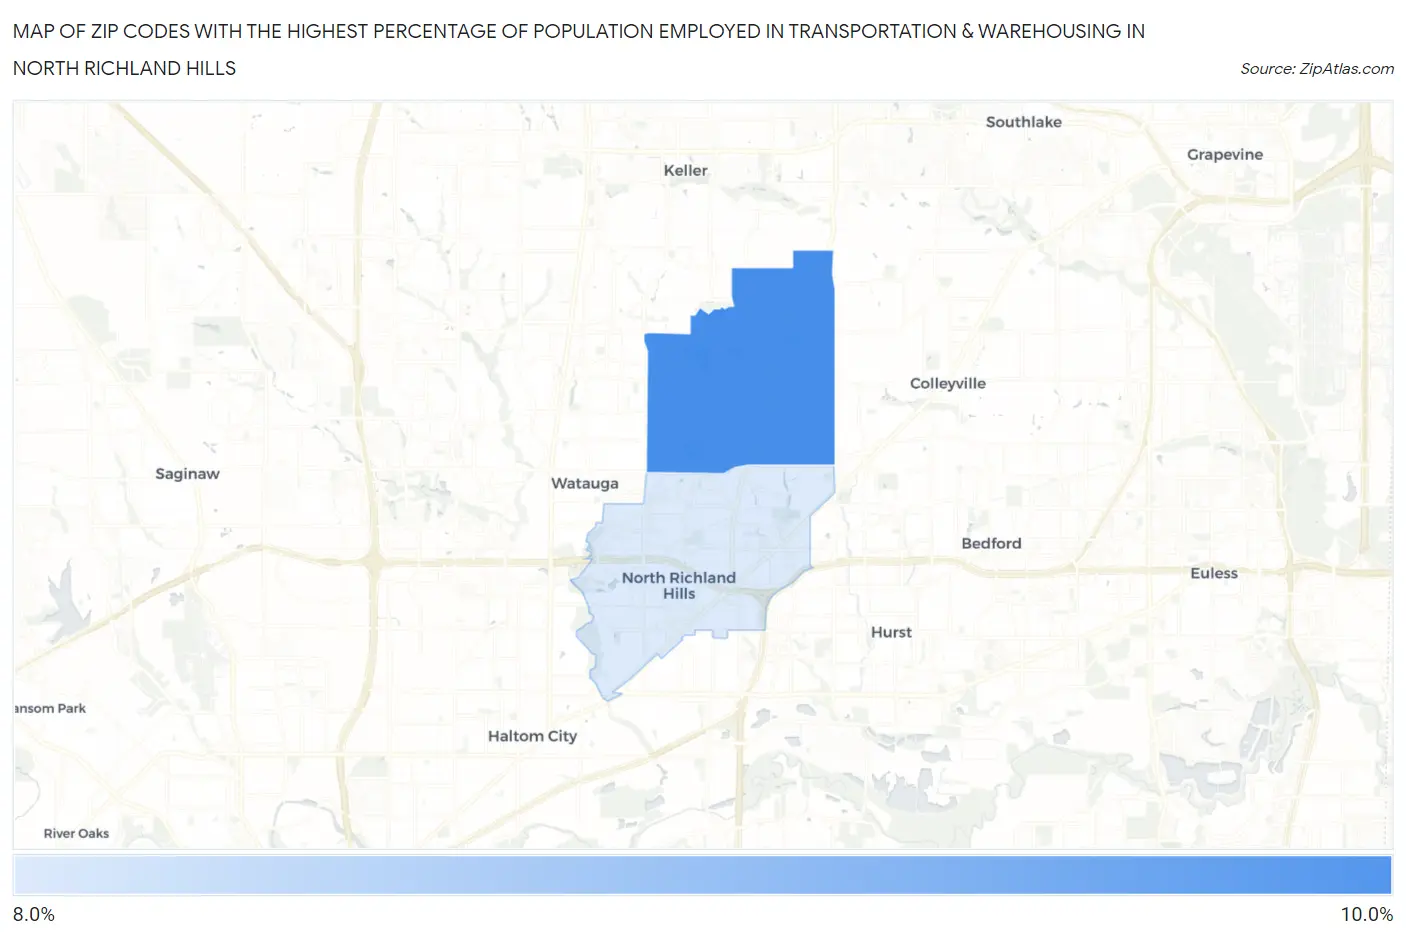
Map of Zip Codes with the Highest Percentage of Population Employed in Transportation & Warehousing in North Richland Hills
8.2%
8.9%
Zip Codes with the Highest Percentage of Population Employed in Transportation & Warehousing in North Richland Hills, TX
| Zip Code | % Employed | vs State | vs National | |
| 1. | 76182 | 8.9% | 5.5%(+3.43)#273 | 4.9%(+3.99)#3,778 |
| 2. | 76180 | 8.2% | 5.5%(+2.69)#327 | 4.9%(+3.24)#4,648 |
1
Common Questions
What are the Top Zip Codes with the Highest Percentage of Population Employed in Transportation & Warehousing in North Richland Hills, TX?
Top Zip Codes with the Highest Percentage of Population Employed in Transportation & Warehousing in North Richland Hills, TX are:
What zip code has the Highest Percentage of Population Employed in Transportation & Warehousing in North Richland Hills, TX?
76182 has the Highest Percentage of Population Employed in Transportation & Warehousing in North Richland Hills, TX with 8.9%.
What is the Percentage of Population Employed in Transportation & Warehousing in North Richland Hills, TX?
Percentage of Population Employed in Transportation & Warehousing in North Richland Hills is 8.4%.
What is the Percentage of Population Employed in Transportation & Warehousing in Texas?
Percentage of Population Employed in Transportation & Warehousing in Texas is 5.5%.
What is the Percentage of Population Employed in Transportation & Warehousing in the United States?
Percentage of Population Employed in Transportation & Warehousing in the United States is 4.9%.