Zip Codes with the Highest Percentage of Population Employed in Office & Administration in Nashville, TN
RELATED REPORTS & OPTIONS
Office & Administration
Nashville
Compare Zip Codes
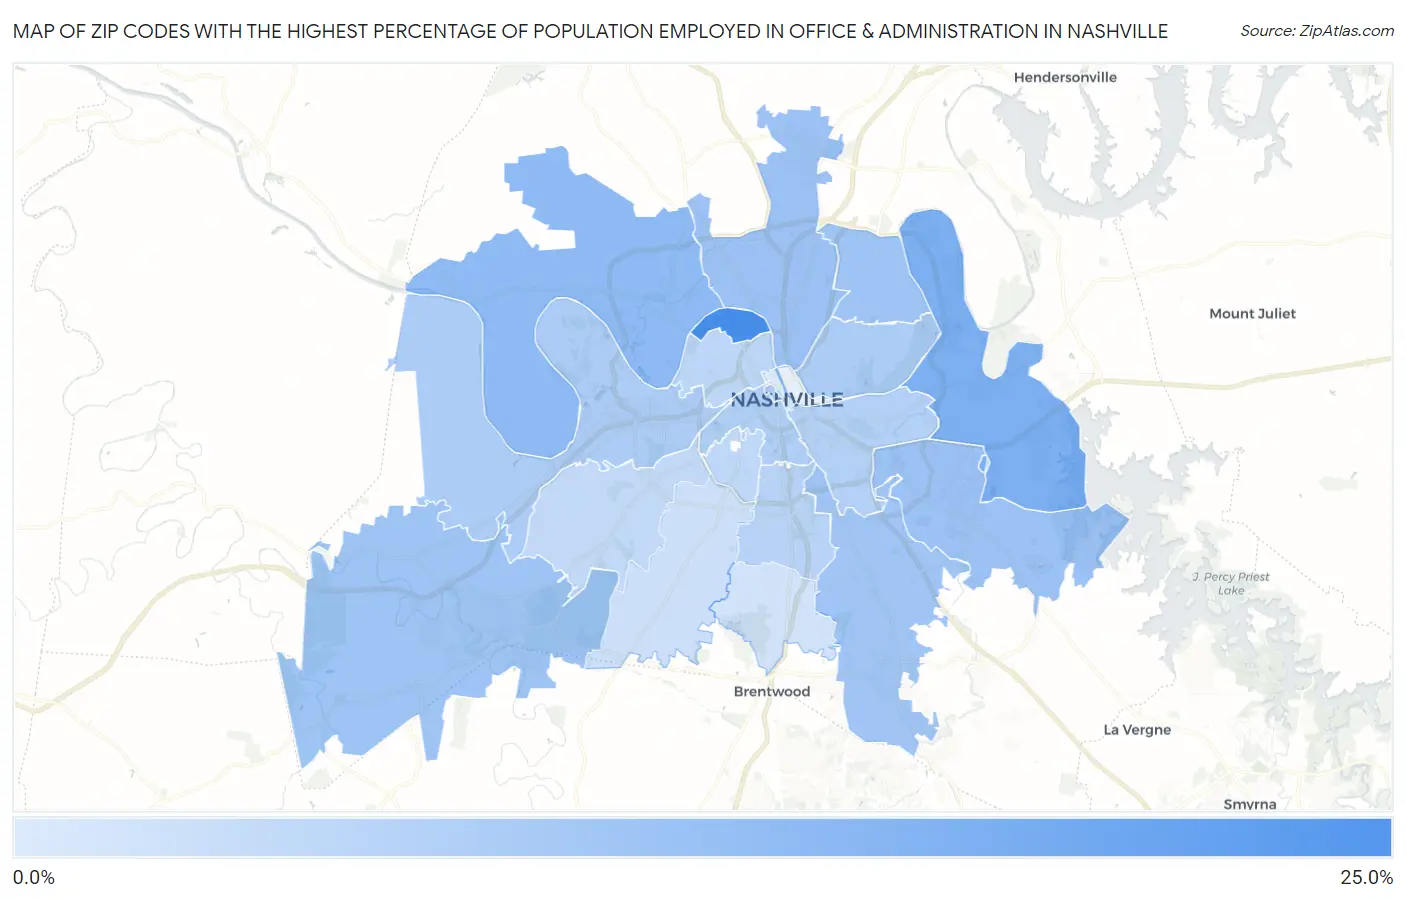
Map of Zip Codes with the Highest Percentage of Population Employed in Office & Administration in Nashville
3.2%
22.3%
Zip Codes with the Highest Percentage of Population Employed in Office & Administration in Nashville, TN
| Zip Code | % Employed | vs State | vs National | |
| 1. | 37228 | 22.3% | 11.3%(+11.0)#11 | 10.9%(+11.5)#1,247 |
| 2. | 37214 | 15.3% | 11.3%(+4.02)#73 | 10.9%(+4.48)#4,158 |
| 3. | 37218 | 12.8% | 11.3%(+1.44)#162 | 10.9%(+1.90)#8,654 |
| 4. | 37207 | 11.4% | 11.3%(+0.037)#246 | 10.9%(+0.498)#12,705 |
| 5. | 37217 | 11.2% | 11.3%(-0.093)#261 | 10.9%(+0.369)#13,132 |
| 6. | 37221 | 10.9% | 11.3%(-0.452)#278 | 10.9%(+0.010)#14,314 |
| 7. | 37216 | 10.8% | 11.3%(-0.530)#280 | 10.9%(-0.068)#14,544 |
| 8. | 37211 | 10.5% | 11.3%(-0.797)#296 | 10.9%(-0.336)#15,401 |
| 9. | 37206 | 9.1% | 11.3%(-2.21)#399 | 10.9%(-1.75)#19,924 |
| 10. | 37209 | 9.0% | 11.3%(-2.33)#409 | 10.9%(-1.87)#20,296 |
| 11. | 37203 | 8.6% | 11.3%(-2.74)#425 | 10.9%(-2.28)#21,492 |
| 12. | 37219 | 8.5% | 11.3%(-2.80)#428 | 10.9%(-2.34)#21,650 |
| 13. | 37210 | 8.2% | 11.3%(-3.07)#444 | 10.9%(-2.61)#22,396 |
| 14. | 37204 | 7.5% | 11.3%(-3.81)#472 | 10.9%(-3.35)#24,129 |
| 15. | 37208 | 6.9% | 11.3%(-4.38)#497 | 10.9%(-3.92)#25,321 |
| 16. | 37212 | 6.7% | 11.3%(-4.64)#508 | 10.9%(-4.18)#25,798 |
| 17. | 37205 | 6.6% | 11.3%(-4.73)#511 | 10.9%(-4.27)#25,938 |
| 18. | 37215 | 5.1% | 11.3%(-6.18)#544 | 10.9%(-5.72)#27,971 |
| 19. | 37220 | 4.5% | 11.3%(-6.84)#554 | 10.9%(-6.38)#28,604 |
| 20. | 37201 | 3.2% | 11.3%(-8.13)#573 | 10.9%(-7.66)#29,557 |
1
Common Questions
What are the Top 10 Zip Codes with the Highest Percentage of Population Employed in Office & Administration in Nashville, TN?
Top 10 Zip Codes with the Highest Percentage of Population Employed in Office & Administration in Nashville, TN are:
What zip code has the Highest Percentage of Population Employed in Office & Administration in Nashville, TN?
37228 has the Highest Percentage of Population Employed in Office & Administration in Nashville, TN with 22.3%.
What is the Percentage of Population Employed in Office & Administration in Nashville, TN?
Percentage of Population Employed in Office & Administration in Nashville is 10.7%.
What is the Percentage of Population Employed in Office & Administration in Tennessee?
Percentage of Population Employed in Office & Administration in Tennessee is 11.3%.
What is the Percentage of Population Employed in Office & Administration in the United States?
Percentage of Population Employed in Office & Administration in the United States is 10.9%.