Zip Codes with the Highest Percentage of Population Employed in Office & Administration in Cookeville, TN
RELATED REPORTS & OPTIONS
Office & Administration
Cookeville
Compare Zip Codes
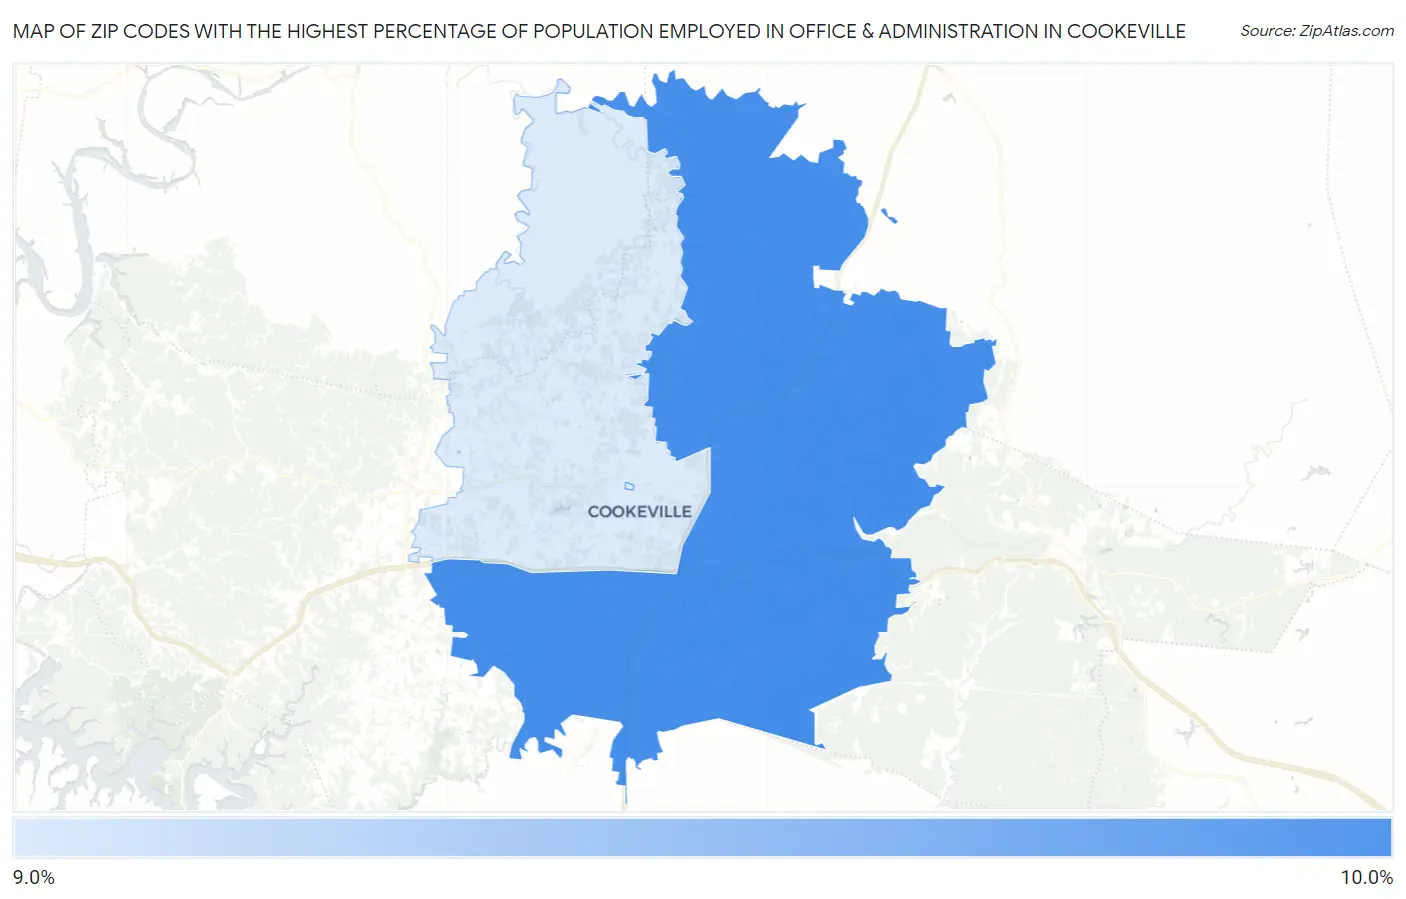
Map of Zip Codes with the Highest Percentage of Population Employed in Office & Administration in Cookeville
9.2%
9.4%
Zip Codes with the Highest Percentage of Population Employed in Office & Administration in Cookeville, TN
| Zip Code | % Employed | vs State | vs National | |
| 1. | 38506 | 9.4% | 11.3%(-1.88)#375 | 10.9%(-1.42)#18,957 |
| 2. | 38501 | 9.2% | 11.3%(-2.14)#394 | 10.9%(-1.68)#19,734 |
1
Common Questions
What are the Top Zip Codes with the Highest Percentage of Population Employed in Office & Administration in Cookeville, TN?
Top Zip Codes with the Highest Percentage of Population Employed in Office & Administration in Cookeville, TN are:
What zip code has the Highest Percentage of Population Employed in Office & Administration in Cookeville, TN?
38506 has the Highest Percentage of Population Employed in Office & Administration in Cookeville, TN with 9.4%.
What is the Percentage of Population Employed in Office & Administration in Cookeville, TN?
Percentage of Population Employed in Office & Administration in Cookeville is 7.6%.
What is the Percentage of Population Employed in Office & Administration in Tennessee?
Percentage of Population Employed in Office & Administration in Tennessee is 11.3%.
What is the Percentage of Population Employed in Office & Administration in the United States?
Percentage of Population Employed in Office & Administration in the United States is 10.9%.