Zip Codes with the Highest Percentage of Population Employed in Office & Administration in Tennessee
RELATED REPORTS & OPTIONS
Office & Administration
Tennessee
Compare Zip Codes
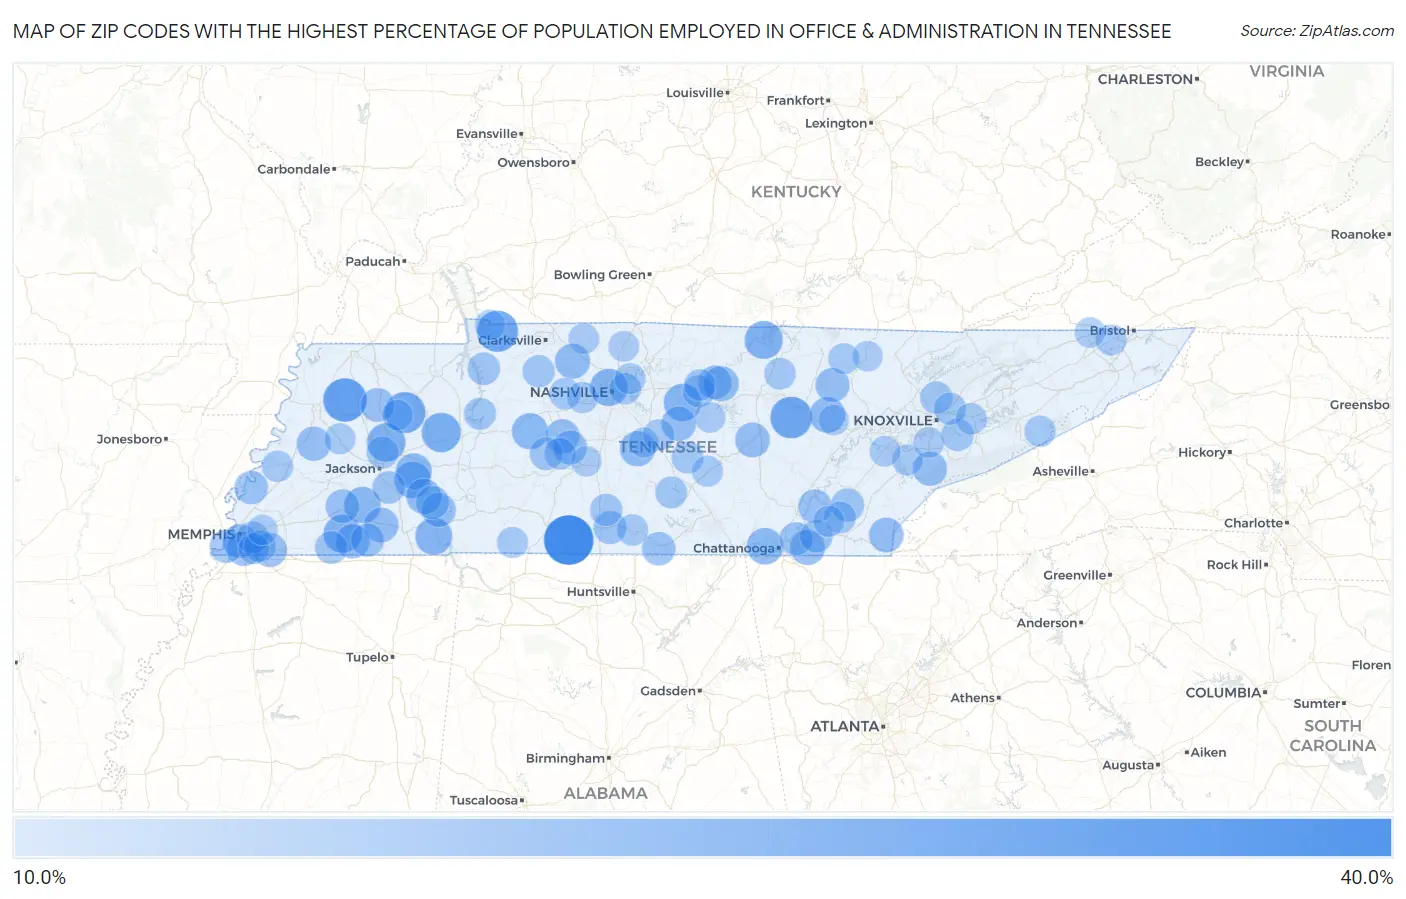
Map of Zip Codes with the Highest Percentage of Population Employed in Office & Administration in Tennessee
10.0%
40.0%
Zip Codes with the Highest Percentage of Population Employed in Office & Administration in Tennessee
| Zip Code | % Employed | vs State | vs National | |
| 1. | 38460 | 36.7% | 11.3%(+25.4)#1 | 10.9%(+25.8)#341 |
| 2. | 38389 | 29.4% | 11.3%(+18.1)#2 | 10.9%(+18.6)#587 |
| 3. | 38578 | 27.3% | 11.3%(+16.0)#3 | 10.9%(+16.4)#737 |
| 4. | 37023 | 26.7% | 11.3%(+15.4)#4 | 10.9%(+15.8)#770 |
| 5. | 38258 | 26.4% | 11.3%(+15.1)#5 | 10.9%(+15.5)#799 |
| 6. | 38387 | 24.4% | 11.3%(+13.1)#6 | 10.9%(+13.6)#976 |
| 7. | 38355 | 23.5% | 11.3%(+12.2)#7 | 10.9%(+12.6)#1,090 |
| 8. | 38042 | 22.9% | 11.3%(+11.6)#8 | 10.9%(+12.1)#1,162 |
| 9. | 38551 | 22.9% | 11.3%(+11.6)#9 | 10.9%(+12.1)#1,163 |
| 10. | 37184 | 22.4% | 11.3%(+11.0)#10 | 10.9%(+11.5)#1,241 |
| 11. | 37228 | 22.3% | 11.3%(+11.0)#11 | 10.9%(+11.5)#1,247 |
| 12. | 38376 | 21.9% | 11.3%(+10.6)#12 | 10.9%(+11.1)#1,318 |
| 13. | 38381 | 21.2% | 11.3%(+9.90)#13 | 10.9%(+10.4)#1,436 |
| 14. | 38352 | 21.1% | 11.3%(+9.83)#14 | 10.9%(+10.3)#1,454 |
| 15. | 37419 | 21.1% | 11.3%(+9.81)#15 | 10.9%(+10.3)#1,460 |
| 16. | 37137 | 20.9% | 11.3%(+9.57)#16 | 10.9%(+10.0)#1,500 |
| 17. | 38345 | 20.6% | 11.3%(+9.29)#17 | 10.9%(+9.75)#1,558 |
| 18. | 38558 | 20.3% | 11.3%(+9.00)#18 | 10.9%(+9.46)#1,615 |
| 19. | 37153 | 19.7% | 11.3%(+8.38)#19 | 10.9%(+8.84)#1,765 |
| 20. | 37035 | 19.7% | 11.3%(+8.36)#20 | 10.9%(+8.82)#1,771 |
| 21. | 38332 | 19.6% | 11.3%(+8.28)#21 | 10.9%(+8.74)#1,792 |
| 22. | 38552 | 19.5% | 11.3%(+8.22)#22 | 10.9%(+8.68)#1,805 |
| 23. | 37315 | 19.3% | 11.3%(+8.01)#23 | 10.9%(+8.47)#1,862 |
| 24. | 38559 | 19.2% | 11.3%(+7.90)#24 | 10.9%(+8.36)#1,904 |
| 25. | 37333 | 19.2% | 11.3%(+7.86)#25 | 10.9%(+8.32)#1,914 |
| 26. | 38044 | 19.1% | 11.3%(+7.75)#26 | 10.9%(+8.22)#1,943 |
| 27. | 37118 | 18.9% | 11.3%(+7.56)#27 | 10.9%(+8.02)#2,016 |
| 28. | 38067 | 18.8% | 11.3%(+7.50)#28 | 10.9%(+7.96)#2,041 |
| 29. | 38116 | 18.8% | 11.3%(+7.44)#29 | 10.9%(+7.90)#2,054 |
| 30. | 38037 | 18.6% | 11.3%(+7.24)#30 | 10.9%(+7.70)#2,123 |
| 31. | 37726 | 18.5% | 11.3%(+7.21)#31 | 10.9%(+7.67)#2,134 |
| 32. | 38106 | 18.5% | 11.3%(+7.18)#32 | 10.9%(+7.64)#2,143 |
| 33. | 37878 | 18.5% | 11.3%(+7.18)#33 | 10.9%(+7.64)#2,145 |
| 34. | 38476 | 18.5% | 11.3%(+7.16)#34 | 10.9%(+7.62)#2,150 |
| 35. | 38125 | 18.4% | 11.3%(+7.13)#35 | 10.9%(+7.59)#2,166 |
| 36. | 38482 | 18.4% | 11.3%(+7.11)#36 | 10.9%(+7.57)#2,174 |
| 37. | 38361 | 18.4% | 11.3%(+7.10)#37 | 10.9%(+7.56)#2,176 |
| 38. | 38560 | 18.2% | 11.3%(+6.86)#38 | 10.9%(+7.33)#2,257 |
| 39. | 38316 | 18.1% | 11.3%(+6.74)#39 | 10.9%(+7.21)#2,318 |
| 40. | 38075 | 18.0% | 11.3%(+6.68)#40 | 10.9%(+7.14)#2,356 |
| 41. | 37308 | 17.9% | 11.3%(+6.60)#41 | 10.9%(+7.06)#2,397 |
| 42. | 37328 | 17.7% | 11.3%(+6.39)#42 | 10.9%(+6.85)#2,482 |
| 43. | 38359 | 17.7% | 11.3%(+6.37)#43 | 10.9%(+6.83)#2,492 |
| 44. | 38023 | 17.6% | 11.3%(+6.26)#44 | 10.9%(+6.72)#2,545 |
| 45. | 38109 | 17.5% | 11.3%(+6.18)#45 | 10.9%(+6.64)#2,592 |
| 46. | 38052 | 17.4% | 11.3%(+6.10)#46 | 10.9%(+6.56)#2,626 |
| 47. | 37370 | 17.4% | 11.3%(+6.10)#47 | 10.9%(+6.56)#2,630 |
| 48. | 38459 | 17.4% | 11.3%(+6.03)#48 | 10.9%(+6.50)#2,672 |
| 49. | 37416 | 17.2% | 11.3%(+5.84)#49 | 10.9%(+6.30)#2,775 |
| 50. | 38454 | 17.1% | 11.3%(+5.74)#50 | 10.9%(+6.20)#2,810 |
| 51. | 37353 | 16.9% | 11.3%(+5.60)#51 | 10.9%(+6.06)#2,893 |
| 52. | 38366 | 16.7% | 11.3%(+5.39)#52 | 10.9%(+5.86)#3,011 |
| 53. | 37175 | 16.7% | 11.3%(+5.35)#53 | 10.9%(+5.81)#3,034 |
| 54. | 38046 | 16.7% | 11.3%(+5.35)#54 | 10.9%(+5.81)#3,066 |
| 55. | 37865 | 16.5% | 11.3%(+5.23)#55 | 10.9%(+5.69)#3,133 |
| 56. | 37047 | 16.5% | 11.3%(+5.18)#56 | 10.9%(+5.64)#3,172 |
| 57. | 37938 | 16.5% | 11.3%(+5.17)#57 | 10.9%(+5.63)#3,180 |
| 58. | 37051 | 16.3% | 11.3%(+5.02)#58 | 10.9%(+5.48)#3,304 |
| 59. | 38547 | 16.2% | 11.3%(+4.86)#59 | 10.9%(+5.33)#3,409 |
| 60. | 37134 | 16.1% | 11.3%(+4.83)#60 | 10.9%(+5.29)#3,452 |
| 61. | 37924 | 16.1% | 11.3%(+4.83)#61 | 10.9%(+5.29)#3,455 |
| 62. | 38362 | 16.1% | 11.3%(+4.81)#62 | 10.9%(+5.27)#3,468 |
| 63. | 38152 | 16.1% | 11.3%(+4.76)#63 | 10.9%(+5.22)#3,501 |
| 64. | 38115 | 16.0% | 11.3%(+4.71)#64 | 10.9%(+5.17)#3,528 |
| 65. | 37310 | 15.9% | 11.3%(+4.57)#65 | 10.9%(+5.04)#3,648 |
| 66. | 37026 | 15.8% | 11.3%(+4.53)#66 | 10.9%(+4.99)#3,694 |
| 67. | 37360 | 15.8% | 11.3%(+4.47)#67 | 10.9%(+4.93)#3,747 |
| 68. | 38487 | 15.7% | 11.3%(+4.36)#68 | 10.9%(+4.82)#3,852 |
| 69. | 37187 | 15.5% | 11.3%(+4.22)#69 | 10.9%(+4.68)#3,970 |
| 70. | 38580 | 15.5% | 11.3%(+4.20)#70 | 10.9%(+4.66)#3,989 |
| 71. | 38563 | 15.5% | 11.3%(+4.14)#71 | 10.9%(+4.60)#4,051 |
| 72. | 37334 | 15.3% | 11.3%(+4.03)#72 | 10.9%(+4.49)#4,150 |
| 73. | 37214 | 15.3% | 11.3%(+4.02)#73 | 10.9%(+4.48)#4,158 |
| 74. | 37132 | 15.3% | 11.3%(+4.01)#74 | 10.9%(+4.47)#4,177 |
| 75. | 37727 | 15.3% | 11.3%(+3.96)#75 | 10.9%(+4.42)#4,233 |
| 76. | 38041 | 15.2% | 11.3%(+3.92)#76 | 10.9%(+4.38)#4,275 |
| 77. | 37764 | 15.2% | 11.3%(+3.85)#77 | 10.9%(+4.31)#4,352 |
| 78. | 37143 | 15.1% | 11.3%(+3.74)#78 | 10.9%(+4.20)#4,485 |
| 79. | 38504 | 15.0% | 11.3%(+3.68)#79 | 10.9%(+4.14)#4,558 |
| 80. | 37138 | 14.9% | 11.3%(+3.61)#80 | 10.9%(+4.07)#4,640 |
| 81. | 38463 | 14.9% | 11.3%(+3.60)#81 | 10.9%(+4.06)#4,658 |
| 82. | 37312 | 14.9% | 11.3%(+3.57)#82 | 10.9%(+4.03)#4,713 |
| 83. | 37357 | 14.8% | 11.3%(+3.53)#83 | 10.9%(+3.99)#4,775 |
| 84. | 37742 | 14.8% | 11.3%(+3.52)#84 | 10.9%(+3.98)#4,783 |
| 85. | 38001 | 14.8% | 11.3%(+3.50)#85 | 10.9%(+3.96)#4,808 |
| 86. | 37701 | 14.8% | 11.3%(+3.48)#86 | 10.9%(+3.94)#4,842 |
| 87. | 37617 | 14.7% | 11.3%(+3.40)#87 | 10.9%(+3.86)#4,944 |
| 88. | 38118 | 14.7% | 11.3%(+3.39)#88 | 10.9%(+3.85)#4,954 |
| 89. | 37032 | 14.6% | 11.3%(+3.29)#89 | 10.9%(+3.75)#5,103 |
| 90. | 37774 | 14.6% | 11.3%(+3.26)#90 | 10.9%(+3.72)#5,155 |
| 91. | 37188 | 14.4% | 11.3%(+3.09)#91 | 10.9%(+3.55)#5,383 |
| 92. | 38220 | 14.4% | 11.3%(+3.08)#92 | 10.9%(+3.54)#5,407 |
| 93. | 37059 | 14.4% | 11.3%(+3.05)#93 | 10.9%(+3.51)#5,441 |
| 94. | 38401 | 14.3% | 11.3%(+2.98)#94 | 10.9%(+3.44)#5,528 |
| 95. | 37665 | 14.3% | 11.3%(+2.97)#95 | 10.9%(+3.44)#5,531 |
| 96. | 37755 | 14.3% | 11.3%(+2.94)#96 | 10.9%(+3.40)#5,626 |
| 97. | 37723 | 14.3% | 11.3%(+2.94)#97 | 10.9%(+3.40)#5,632 |
| 98. | 38134 | 14.2% | 11.3%(+2.93)#98 | 10.9%(+3.39)#5,649 |
| 99. | 37028 | 14.2% | 11.3%(+2.87)#99 | 10.9%(+3.33)#5,725 |
| 100. | 37128 | 14.1% | 11.3%(+2.82)#100 | 10.9%(+3.28)#5,807 |
Common Questions
What are the Top 10 Zip Codes with the Highest Percentage of Population Employed in Office & Administration in Tennessee?
Top 10 Zip Codes with the Highest Percentage of Population Employed in Office & Administration in Tennessee are:
What zip code has the Highest Percentage of Population Employed in Office & Administration in Tennessee?
38460 has the Highest Percentage of Population Employed in Office & Administration in Tennessee with 36.7%.
What is the Percentage of Population Employed in Office & Administration in the State of Tennessee?
Percentage of Population Employed in Office & Administration in Tennessee is 11.3%.
What is the Percentage of Population Employed in Office & Administration in the United States?
Percentage of Population Employed in Office & Administration in the United States is 10.9%.