Zip Codes with the Highest Percentage of Population Employed in Office & Administration in Crossville, TN
RELATED REPORTS & OPTIONS
Office & Administration
Crossville
Compare Zip Codes
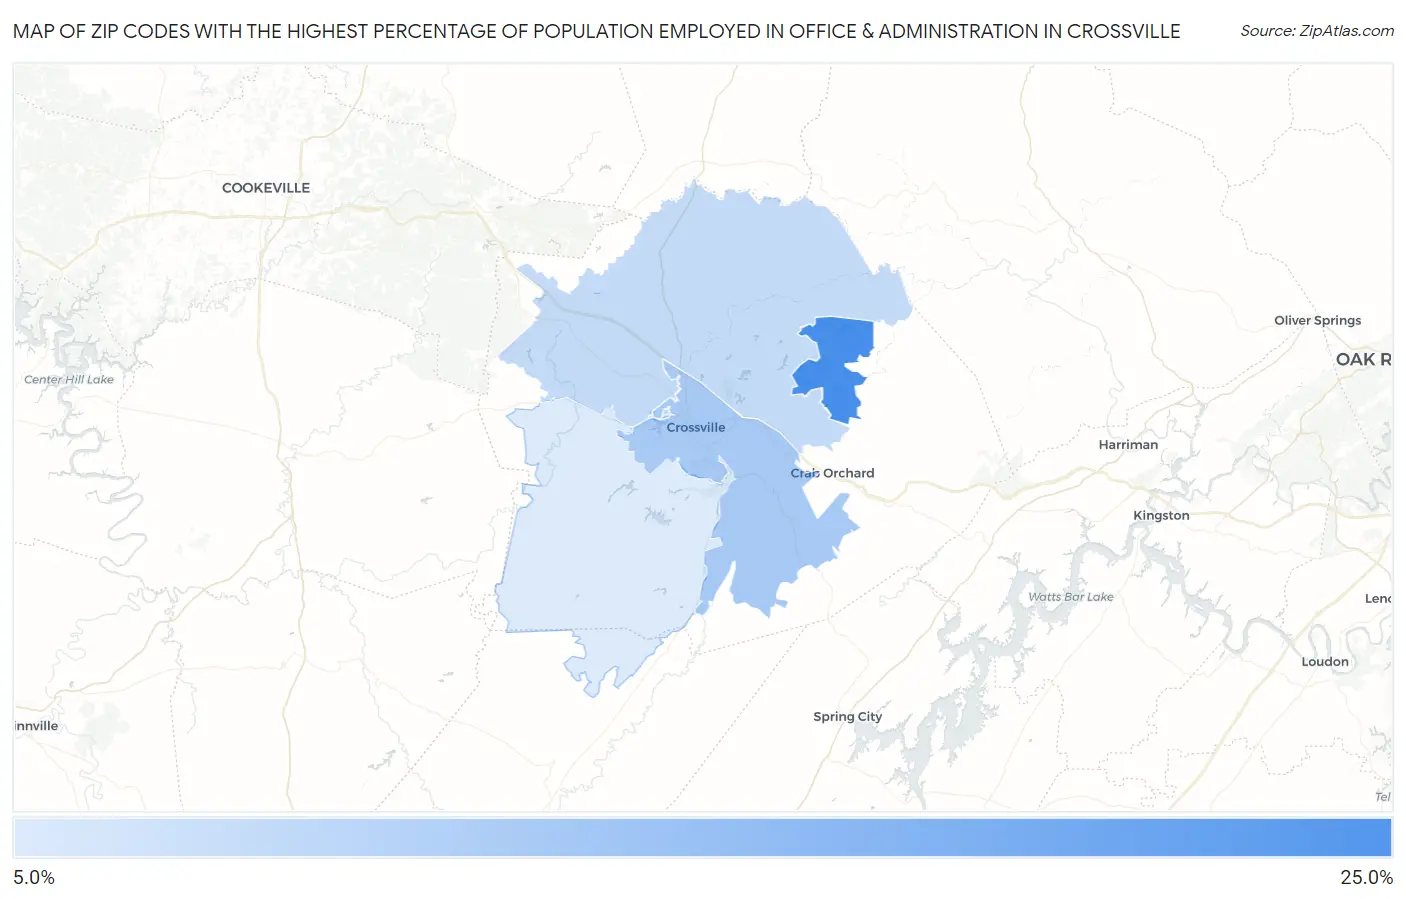
Map of Zip Codes with the Highest Percentage of Population Employed in Office & Administration in Crossville
8.4%
20.3%
Zip Codes with the Highest Percentage of Population Employed in Office & Administration in Crossville, TN
| Zip Code | % Employed | vs State | vs National | |
| 1. | 38558 | 20.3% | 11.3%(+9.00)#18 | 10.9%(+9.46)#1,615 |
| 2. | 38555 | 12.5% | 11.3%(+1.13)#174 | 10.9%(+1.59)#9,434 |
| 3. | 38571 | 10.2% | 11.3%(-1.08)#313 | 10.9%(-0.616)#16,355 |
| 4. | 38572 | 8.4% | 11.3%(-2.95)#438 | 10.9%(-2.49)#22,044 |
1
Common Questions
What are the Top 3 Zip Codes with the Highest Percentage of Population Employed in Office & Administration in Crossville, TN?
Top 3 Zip Codes with the Highest Percentage of Population Employed in Office & Administration in Crossville, TN are:
What zip code has the Highest Percentage of Population Employed in Office & Administration in Crossville, TN?
38558 has the Highest Percentage of Population Employed in Office & Administration in Crossville, TN with 20.3%.
What is the Percentage of Population Employed in Office & Administration in Crossville, TN?
Percentage of Population Employed in Office & Administration in Crossville is 12.5%.
What is the Percentage of Population Employed in Office & Administration in Tennessee?
Percentage of Population Employed in Office & Administration in Tennessee is 11.3%.
What is the Percentage of Population Employed in Office & Administration in the United States?
Percentage of Population Employed in Office & Administration in the United States is 10.9%.