Zip Codes with the Highest Percentage of Population Employed in Community & Social Service in Memphis, TN
RELATED REPORTS & OPTIONS
Community & Social Service
Memphis
Compare Zip Codes
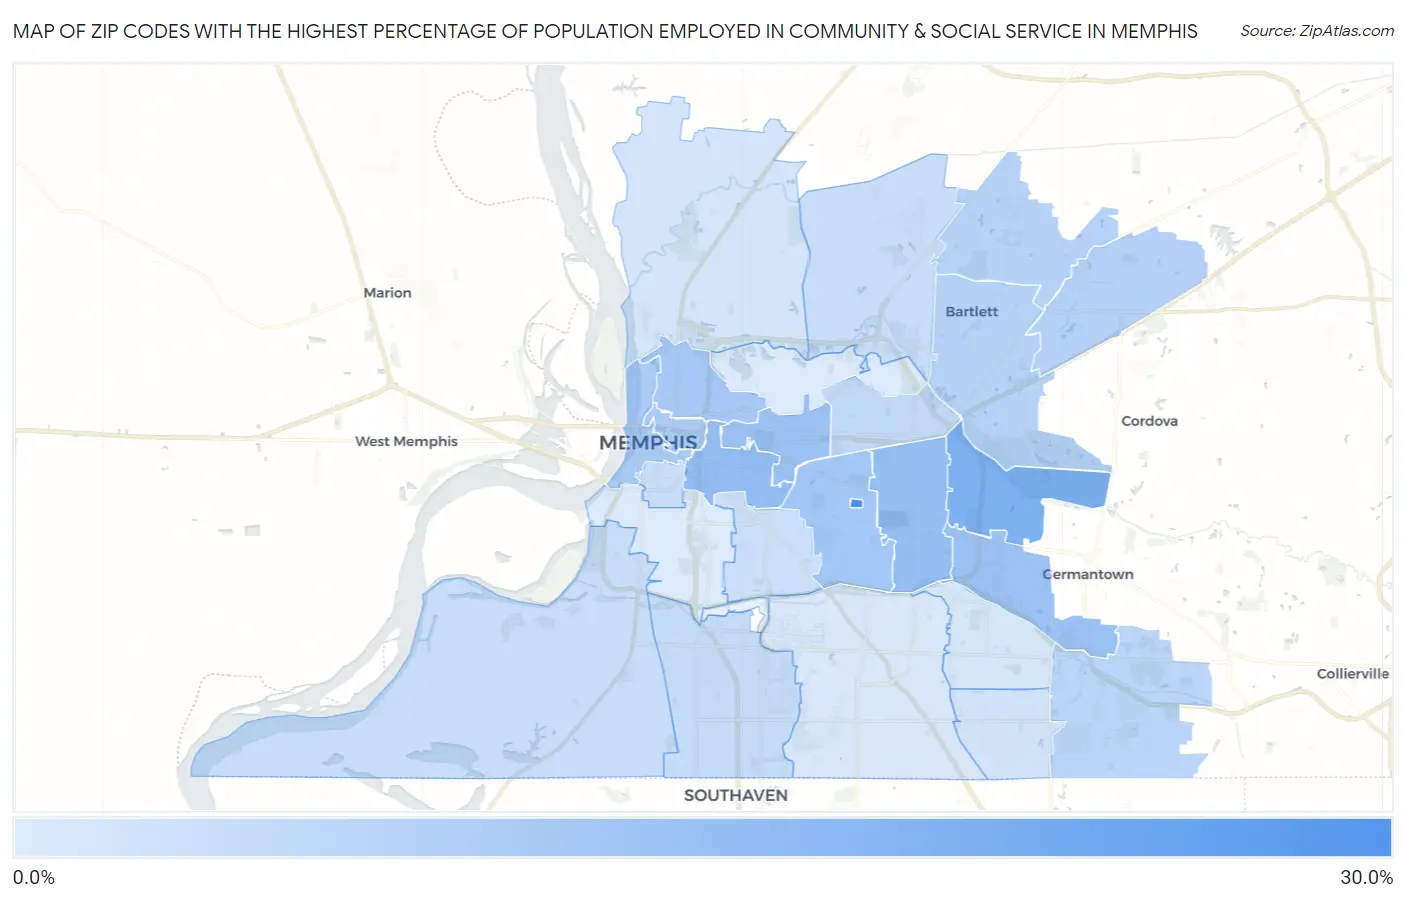
Map of Zip Codes with the Highest Percentage of Population Employed in Community & Social Service in Memphis
3.8%
29.4%
Zip Codes with the Highest Percentage of Population Employed in Community & Social Service in Memphis, TN
| Zip Code | % Employed | vs State | vs National | |
| 1. | 38152 | 29.4% | 10.4%(+19.0)#4 | 11.2%(+18.2)#616 |
| 2. | 38120 | 19.4% | 10.4%(+9.03)#29 | 11.2%(+8.21)#2,224 |
| 3. | 38104 | 15.6% | 10.4%(+5.18)#61 | 11.2%(+4.36)#4,426 |
| 4. | 38117 | 15.1% | 10.4%(+4.75)#67 | 11.2%(+3.93)#4,833 |
| 5. | 38112 | 14.6% | 10.4%(+4.16)#80 | 11.2%(+3.35)#5,412 |
| 6. | 38119 | 14.1% | 10.4%(+3.74)#88 | 11.2%(+2.92)#5,914 |
| 7. | 38111 | 12.8% | 10.4%(+2.42)#121 | 11.2%(+1.61)#7,852 |
| 8. | 38107 | 12.8% | 10.4%(+2.38)#123 | 11.2%(+1.57)#7,924 |
| 9. | 38103 | 12.0% | 10.4%(+1.64)#144 | 11.2%(+0.821)#9,301 |
| 10. | 38105 | 11.7% | 10.4%(+1.34)#156 | 11.2%(+0.520)#9,911 |
| 11. | 38133 | 10.3% | 10.4%(-0.082)#217 | 11.2%(-0.899)#13,319 |
| 12. | 38135 | 10.1% | 10.4%(-0.294)#228 | 11.2%(-1.11)#13,860 |
| 13. | 38134 | 9.8% | 10.4%(-0.569)#247 | 11.2%(-1.39)#14,572 |
| 14. | 38125 | 9.2% | 10.4%(-1.21)#278 | 11.2%(-2.02)#16,289 |
| 15. | 38122 | 8.0% | 10.4%(-2.42)#344 | 11.2%(-3.24)#19,633 |
| 16. | 38116 | 7.5% | 10.4%(-2.94)#387 | 11.2%(-3.76)#21,006 |
| 17. | 38128 | 7.2% | 10.4%(-3.18)#403 | 11.2%(-3.99)#21,588 |
| 18. | 38109 | 7.0% | 10.4%(-3.44)#417 | 11.2%(-4.26)#22,242 |
| 19. | 38126 | 6.9% | 10.4%(-3.53)#424 | 11.2%(-4.35)#22,463 |
| 20. | 38114 | 6.3% | 10.4%(-4.09)#455 | 11.2%(-4.91)#23,713 |
| 21. | 38141 | 5.5% | 10.4%(-4.90)#490 | 11.2%(-5.72)#25,336 |
| 22. | 38127 | 5.3% | 10.4%(-5.05)#501 | 11.2%(-5.87)#25,633 |
| 23. | 38115 | 4.9% | 10.4%(-5.51)#515 | 11.2%(-6.32)#26,365 |
| 24. | 38118 | 4.5% | 10.4%(-5.88)#525 | 11.2%(-6.70)#26,921 |
| 25. | 38106 | 3.8% | 10.4%(-6.57)#546 | 11.2%(-7.38)#27,766 |
| 26. | 38108 | 3.8% | 10.4%(-6.57)#548 | 11.2%(-7.39)#27,771 |
1
Common Questions
What are the Top 10 Zip Codes with the Highest Percentage of Population Employed in Community & Social Service in Memphis, TN?
Top 10 Zip Codes with the Highest Percentage of Population Employed in Community & Social Service in Memphis, TN are:
What zip code has the Highest Percentage of Population Employed in Community & Social Service in Memphis, TN?
38152 has the Highest Percentage of Population Employed in Community & Social Service in Memphis, TN with 29.4%.
What is the Percentage of Population Employed in Community & Social Service in Memphis, TN?
Percentage of Population Employed in Community & Social Service in Memphis is 9.6%.
What is the Percentage of Population Employed in Community & Social Service in Tennessee?
Percentage of Population Employed in Community & Social Service in Tennessee is 10.4%.
What is the Percentage of Population Employed in Community & Social Service in the United States?
Percentage of Population Employed in Community & Social Service in the United States is 11.2%.