Zip Codes with the Highest Percentage of Population Employed in Community & Social Service in Maryville, TN
RELATED REPORTS & OPTIONS
Community & Social Service
Maryville
Compare Zip Codes
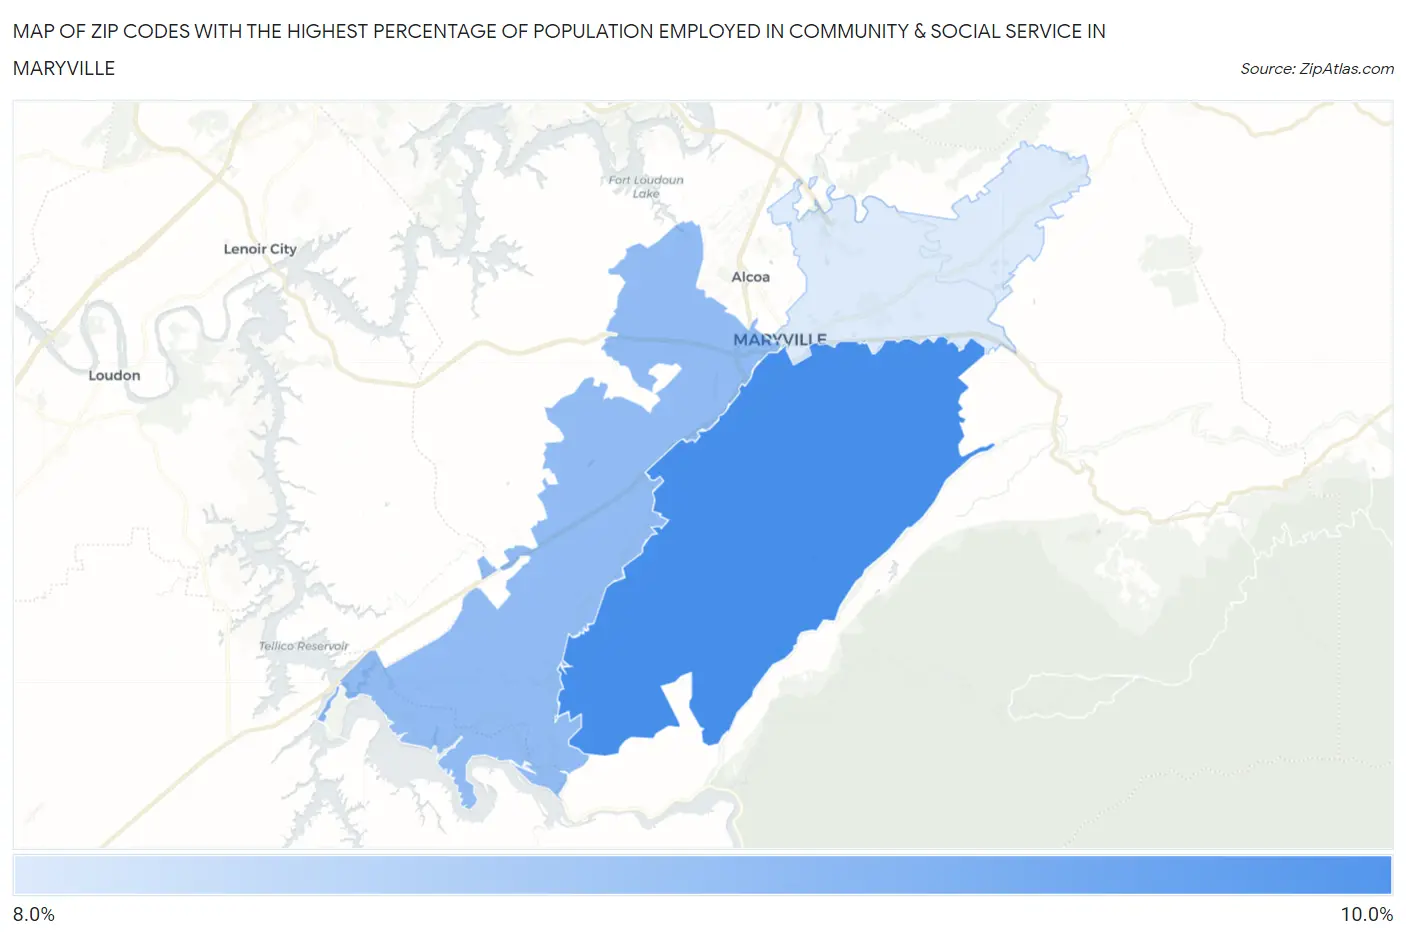
Map of Zip Codes with the Highest Percentage of Population Employed in Community & Social Service in Maryville
8.4%
9.8%
Zip Codes with the Highest Percentage of Population Employed in Community & Social Service in Maryville, TN
| Zip Code | % Employed | vs State | vs National | |
| 1. | 37803 | 9.8% | 10.4%(-0.585)#249 | 11.2%(-1.40)#14,609 |
| 2. | 37801 | 9.1% | 10.4%(-1.27)#280 | 11.2%(-2.09)#16,458 |
| 3. | 37804 | 8.4% | 10.4%(-1.97)#318 | 11.2%(-2.79)#18,376 |
1
Common Questions
What are the Top Zip Codes with the Highest Percentage of Population Employed in Community & Social Service in Maryville, TN?
Top Zip Codes with the Highest Percentage of Population Employed in Community & Social Service in Maryville, TN are:
What zip code has the Highest Percentage of Population Employed in Community & Social Service in Maryville, TN?
37803 has the Highest Percentage of Population Employed in Community & Social Service in Maryville, TN with 9.8%.
What is the Percentage of Population Employed in Community & Social Service in Maryville, TN?
Percentage of Population Employed in Community & Social Service in Maryville is 13.8%.
What is the Percentage of Population Employed in Community & Social Service in Tennessee?
Percentage of Population Employed in Community & Social Service in Tennessee is 10.4%.
What is the Percentage of Population Employed in Community & Social Service in the United States?
Percentage of Population Employed in Community & Social Service in the United States is 11.2%.