Zip Codes with the Highest Percentage of Population Employed in Community & Social Service in Tennessee
RELATED REPORTS & OPTIONS
Community & Social Service
Tennessee
Compare Zip Codes
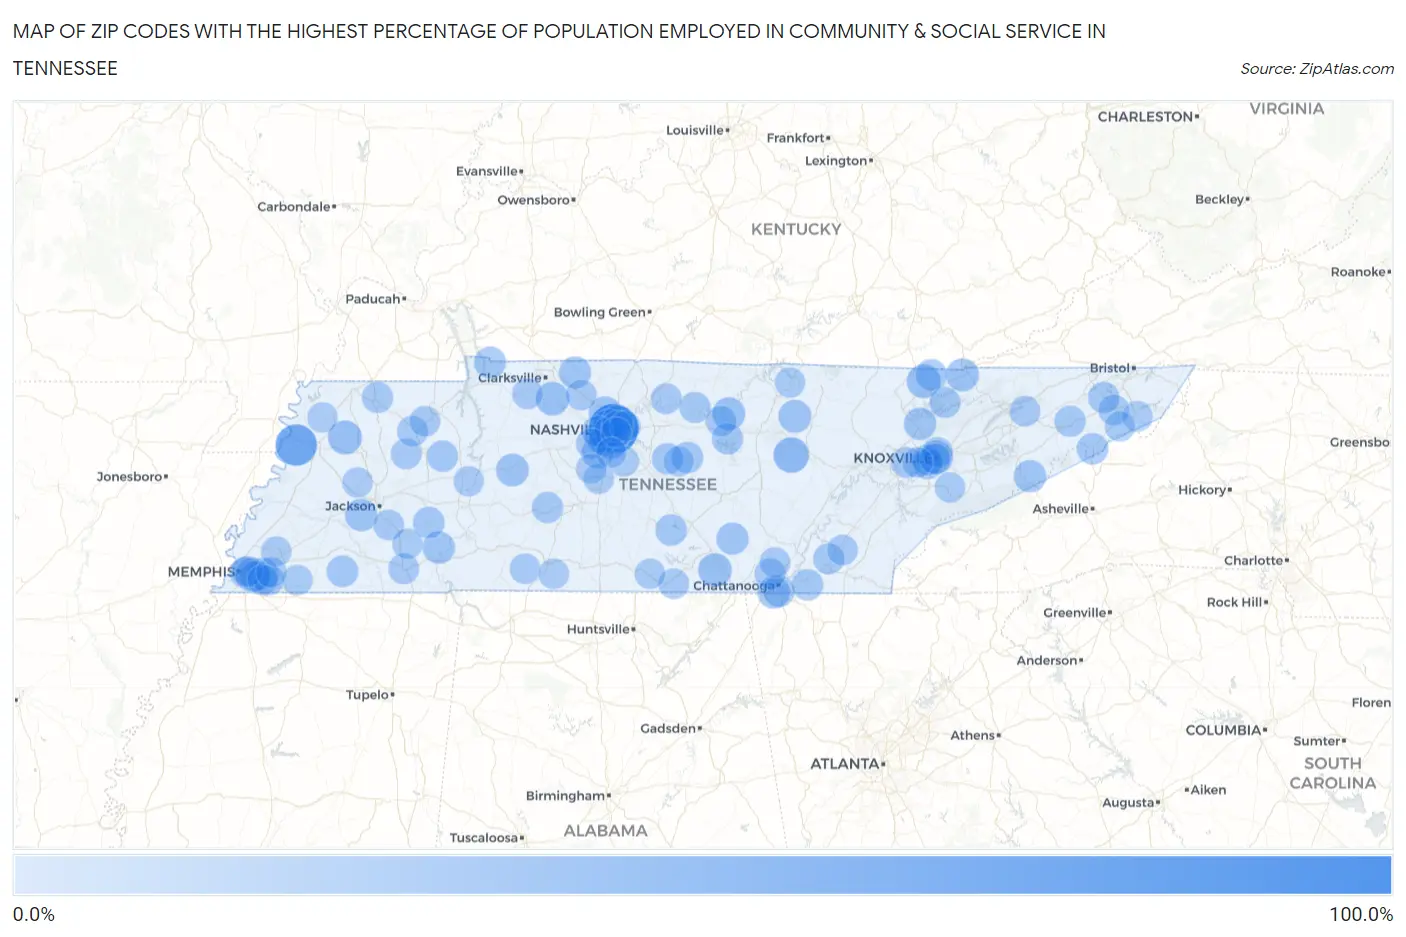
Map of Zip Codes with the Highest Percentage of Population Employed in Community & Social Service in Tennessee
0.0%
100.0%
Zip Codes with the Highest Percentage of Population Employed in Community & Social Service in Tennessee
| Zip Code | % Employed | vs State | vs National | |
| 1. | 37213 | 100.0% | 10.4%(+89.6)#1 | 11.2%(+88.8)#16 |
| 2. | 38047 | 62.3% | 10.4%(+51.9)#2 | 11.2%(+51.1)#76 |
| 3. | 38578 | 36.4% | 10.4%(+26.0)#3 | 11.2%(+25.1)#366 |
| 4. | 38152 | 29.4% | 10.4%(+19.0)#4 | 11.2%(+18.2)#616 |
| 5. | 38389 | 29.4% | 10.4%(+19.0)#5 | 11.2%(+18.2)#619 |
| 6. | 37729 | 28.8% | 10.4%(+18.4)#6 | 11.2%(+17.6)#644 |
| 7. | 37375 | 27.9% | 10.4%(+17.5)#7 | 11.2%(+16.7)#699 |
| 8. | 37171 | 27.5% | 10.4%(+17.1)#8 | 11.2%(+16.3)#731 |
| 9. | 37902 | 27.1% | 10.4%(+16.7)#9 | 11.2%(+15.9)#757 |
| 10. | 38564 | 25.2% | 10.4%(+14.8)#10 | 11.2%(+13.9)#953 |
| 11. | 37212 | 25.1% | 10.4%(+14.7)#11 | 11.2%(+13.9)#964 |
| 12. | 37724 | 24.8% | 10.4%(+14.4)#12 | 11.2%(+13.6)#996 |
| 13. | 38554 | 24.8% | 10.4%(+14.4)#13 | 11.2%(+13.5)#1,014 |
| 14. | 37140 | 24.0% | 10.4%(+13.6)#14 | 11.2%(+12.7)#1,115 |
| 15. | 37220 | 23.5% | 10.4%(+13.1)#15 | 11.2%(+12.3)#1,192 |
| 16. | 38391 | 23.1% | 10.4%(+12.7)#16 | 11.2%(+11.8)#1,268 |
| 17. | 37189 | 22.9% | 10.4%(+12.5)#17 | 11.2%(+11.7)#1,288 |
| 18. | 38361 | 22.9% | 10.4%(+12.5)#18 | 11.2%(+11.7)#1,294 |
| 19. | 37828 | 22.7% | 10.4%(+12.3)#19 | 11.2%(+11.4)#1,334 |
| 20. | 37350 | 22.1% | 10.4%(+11.7)#20 | 11.2%(+10.8)#1,467 |
| 21. | 37753 | 21.9% | 10.4%(+11.5)#21 | 11.2%(+10.6)#1,505 |
| 22. | 37010 | 21.7% | 10.4%(+11.3)#22 | 11.2%(+10.5)#1,528 |
| 23. | 37205 | 21.5% | 10.4%(+11.1)#23 | 11.2%(+10.3)#1,601 |
| 24. | 37313 | 21.4% | 10.4%(+11.0)#24 | 11.2%(+10.2)#1,604 |
| 25. | 37215 | 20.5% | 10.4%(+10.1)#25 | 11.2%(+9.31)#1,856 |
| 26. | 37204 | 20.3% | 10.4%(+9.95)#26 | 11.2%(+9.13)#1,919 |
| 27. | 37028 | 19.9% | 10.4%(+9.46)#27 | 11.2%(+8.64)#2,063 |
| 28. | 37069 | 19.7% | 10.4%(+9.29)#28 | 11.2%(+8.47)#2,130 |
| 29. | 38120 | 19.4% | 10.4%(+9.03)#29 | 11.2%(+8.21)#2,224 |
| 30. | 37228 | 19.2% | 10.4%(+8.79)#30 | 11.2%(+7.98)#2,315 |
| 31. | 38042 | 19.2% | 10.4%(+8.78)#31 | 11.2%(+7.96)#2,320 |
| 32. | 37715 | 19.1% | 10.4%(+8.75)#32 | 11.2%(+7.93)#2,332 |
| 33. | 37410 | 19.1% | 10.4%(+8.72)#33 | 11.2%(+7.90)#2,346 |
| 34. | 38368 | 18.9% | 10.4%(+8.46)#34 | 11.2%(+7.64)#2,450 |
| 35. | 37203 | 18.8% | 10.4%(+8.42)#35 | 11.2%(+7.61)#2,459 |
| 36. | 37360 | 18.7% | 10.4%(+8.33)#36 | 11.2%(+7.51)#2,504 |
| 37. | 37657 | 18.7% | 10.4%(+8.31)#37 | 11.2%(+7.50)#2,508 |
| 38. | 37016 | 18.3% | 10.4%(+7.88)#38 | 11.2%(+7.07)#2,677 |
| 39. | 37216 | 18.3% | 10.4%(+7.86)#39 | 11.2%(+7.04)#2,694 |
| 40. | 37315 | 18.0% | 10.4%(+7.59)#40 | 11.2%(+6.78)#2,817 |
| 41. | 37085 | 18.0% | 10.4%(+7.57)#41 | 11.2%(+6.76)#2,830 |
| 42. | 38318 | 17.9% | 10.4%(+7.53)#42 | 11.2%(+6.72)#2,854 |
| 43. | 38582 | 17.9% | 10.4%(+7.52)#43 | 11.2%(+6.71)#2,859 |
| 44. | 38461 | 17.8% | 10.4%(+7.43)#44 | 11.2%(+6.61)#2,909 |
| 45. | 37206 | 17.4% | 10.4%(+7.04)#45 | 11.2%(+6.22)#3,091 |
| 46. | 37616 | 17.4% | 10.4%(+7.02)#46 | 11.2%(+6.20)#3,108 |
| 47. | 37615 | 17.2% | 10.4%(+6.82)#47 | 11.2%(+6.00)#3,240 |
| 48. | 37151 | 16.9% | 10.4%(+6.51)#48 | 11.2%(+5.69)#3,444 |
| 49. | 37209 | 16.8% | 10.4%(+6.45)#49 | 11.2%(+5.64)#3,478 |
| 50. | 38237 | 16.7% | 10.4%(+6.33)#50 | 11.2%(+5.52)#3,552 |
| 51. | 37866 | 16.3% | 10.4%(+5.89)#51 | 11.2%(+5.07)#3,850 |
| 52. | 37312 | 16.2% | 10.4%(+5.85)#52 | 11.2%(+5.03)#3,877 |
| 53. | 38552 | 16.1% | 10.4%(+5.69)#53 | 11.2%(+4.88)#4,007 |
| 54. | 37405 | 16.1% | 10.4%(+5.66)#54 | 11.2%(+4.84)#4,031 |
| 55. | 38375 | 15.9% | 10.4%(+5.53)#55 | 11.2%(+4.71)#4,124 |
| 56. | 37932 | 15.9% | 10.4%(+5.51)#56 | 11.2%(+4.69)#4,143 |
| 57. | 37919 | 15.9% | 10.4%(+5.50)#57 | 11.2%(+4.68)#4,155 |
| 58. | 38235 | 15.8% | 10.4%(+5.39)#58 | 11.2%(+4.58)#4,251 |
| 59. | 37909 | 15.8% | 10.4%(+5.37)#59 | 11.2%(+4.55)#4,278 |
| 60. | 37917 | 15.7% | 10.4%(+5.27)#60 | 11.2%(+4.45)#4,360 |
| 61. | 38104 | 15.6% | 10.4%(+5.18)#61 | 11.2%(+4.36)#4,426 |
| 62. | 37031 | 15.5% | 10.4%(+5.07)#62 | 11.2%(+4.26)#4,529 |
| 63. | 37142 | 15.4% | 10.4%(+4.97)#63 | 11.2%(+4.16)#4,636 |
| 64. | 37916 | 15.3% | 10.4%(+4.94)#64 | 11.2%(+4.12)#4,675 |
| 65. | 37146 | 15.2% | 10.4%(+4.81)#65 | 11.2%(+4.00)#4,788 |
| 66. | 37891 | 15.2% | 10.4%(+4.77)#66 | 11.2%(+3.96)#4,817 |
| 67. | 38117 | 15.1% | 10.4%(+4.75)#67 | 11.2%(+3.93)#4,833 |
| 68. | 38138 | 15.1% | 10.4%(+4.70)#68 | 11.2%(+3.89)#4,871 |
| 69. | 38201 | 15.0% | 10.4%(+4.57)#69 | 11.2%(+3.75)#5,001 |
| 70. | 37309 | 14.9% | 10.4%(+4.51)#70 | 11.2%(+3.69)#5,050 |
| 71. | 38366 | 14.8% | 10.4%(+4.43)#71 | 11.2%(+3.61)#5,136 |
| 72. | 37345 | 14.8% | 10.4%(+4.37)#72 | 11.2%(+3.56)#5,185 |
| 73. | 37614 | 14.8% | 10.4%(+4.37)#73 | 11.2%(+3.55)#5,190 |
| 74. | 37221 | 14.8% | 10.4%(+4.36)#74 | 11.2%(+3.54)#5,201 |
| 75. | 37377 | 14.7% | 10.4%(+4.33)#75 | 11.2%(+3.51)#5,239 |
| 76. | 38231 | 14.7% | 10.4%(+4.27)#76 | 11.2%(+3.45)#5,300 |
| 77. | 38334 | 14.7% | 10.4%(+4.27)#77 | 11.2%(+3.45)#5,302 |
| 78. | 37135 | 14.6% | 10.4%(+4.22)#78 | 11.2%(+3.40)#5,347 |
| 79. | 37214 | 14.6% | 10.4%(+4.17)#79 | 11.2%(+3.35)#5,405 |
| 80. | 38112 | 14.6% | 10.4%(+4.16)#80 | 11.2%(+3.35)#5,412 |
| 81. | 38486 | 14.5% | 10.4%(+4.05)#81 | 11.2%(+3.24)#5,529 |
| 82. | 37658 | 14.4% | 10.4%(+3.99)#82 | 11.2%(+3.17)#5,602 |
| 83. | 38337 | 14.4% | 10.4%(+3.98)#83 | 11.2%(+3.16)#5,620 |
| 84. | 38468 | 14.4% | 10.4%(+3.97)#84 | 11.2%(+3.15)#5,627 |
| 85. | 37210 | 14.2% | 10.4%(+3.82)#85 | 11.2%(+3.00)#5,814 |
| 86. | 37886 | 14.2% | 10.4%(+3.81)#86 | 11.2%(+2.99)#5,825 |
| 87. | 37923 | 14.2% | 10.4%(+3.77)#87 | 11.2%(+2.95)#5,871 |
| 88. | 38119 | 14.1% | 10.4%(+3.74)#88 | 11.2%(+2.92)#5,914 |
| 89. | 37179 | 14.1% | 10.4%(+3.70)#89 | 11.2%(+2.88)#5,971 |
| 90. | 37118 | 14.0% | 10.4%(+3.63)#90 | 11.2%(+2.82)#6,055 |
| 91. | 38066 | 14.0% | 10.4%(+3.60)#91 | 11.2%(+2.79)#6,085 |
| 92. | 37027 | 13.9% | 10.4%(+3.54)#92 | 11.2%(+2.73)#6,169 |
| 93. | 38018 | 13.9% | 10.4%(+3.54)#93 | 11.2%(+2.72)#6,177 |
| 94. | 37692 | 13.9% | 10.4%(+3.50)#94 | 11.2%(+2.69)#6,216 |
| 95. | 37348 | 13.9% | 10.4%(+3.46)#95 | 11.2%(+2.65)#6,259 |
| 96. | 38002 | 13.8% | 10.4%(+3.42)#96 | 11.2%(+2.60)#6,327 |
| 97. | 38573 | 13.8% | 10.4%(+3.41)#97 | 11.2%(+2.60)#6,332 |
| 98. | 38240 | 13.8% | 10.4%(+3.41)#98 | 11.2%(+2.60)#6,333 |
| 99. | 38380 | 13.7% | 10.4%(+3.34)#99 | 11.2%(+2.53)#6,431 |
| 100. | 37064 | 13.5% | 10.4%(+3.14)#100 | 11.2%(+2.32)#6,695 |
Common Questions
What are the Top 10 Zip Codes with the Highest Percentage of Population Employed in Community & Social Service in Tennessee?
Top 10 Zip Codes with the Highest Percentage of Population Employed in Community & Social Service in Tennessee are:
What zip code has the Highest Percentage of Population Employed in Community & Social Service in Tennessee?
37213 has the Highest Percentage of Population Employed in Community & Social Service in Tennessee with 100.0%.
What is the Percentage of Population Employed in Community & Social Service in the State of Tennessee?
Percentage of Population Employed in Community & Social Service in Tennessee is 10.4%.
What is the Percentage of Population Employed in Community & Social Service in the United States?
Percentage of Population Employed in Community & Social Service in the United States is 11.2%.