Zip Codes with the Highest Percentage of Population with a Degree in Communications in Portland, OR

RELATED REPORTS & OPTIONS

Communications
Population
Families and Households
Female Fertility
Female Fertility (Unmarried)
Race (Community Size)
Race (Percentage)
Ancestry (Community Size)
AfghanAfricanAlaska NativeAlaskan AthabascanAlbanianAleutAlsatianAmericanApacheArabArgentineanArmenianAustralianAustrianBahamianBangladeshiBasqueBelgianBelizeanBhutaneseBlackfeetBolivianBrazilianBritishBritish West IndianBulgarianBurmeseCajunCambodianCanadianCelticCentral AmericanCentral American IndianCherokeeCheyenneChickasawChileanChineseChippewaChoctawColombianColvilleCosta RicanCreeCreekCroatianCubanCzechCzechoslovakianDanishDelawareDominicanDutchEastern EuropeanEcuadorianEgyptianEnglishEstonianEthiopianEuropeanFijianFilipinoFinnishFrenchFrench American IndianFrench CanadianGermanGerman RussianGhanaianGreekGuamanian / ChamorroGuatemalanGuyaneseHaitianHonduranHopiHungarianIcelanderIndian (Asian)IndonesianInupiatIranianIraqiIrishIroquoisIsraeliItalianJamaicanJapaneseJordanianKenyanKoreanLaotianLatvianLebaneseLiberianLithuanianLumbeeLuxembourgerMacedonianMalaysianMalteseMarshalleseMexicanMexican American IndianMongolianMoroccanNative HawaiianNavajoNepaleseNew ZealanderNicaraguanNigerianNorthern EuropeanNorwegianOkinawanOsagePaiutePakistaniPalestinianPanamanianParaguayanPennsylvania GermanPeruvianPimaPolishPortuguesePotawatomiPuebloPuerto RicanPuget Sound SalishRomanianRussianSalvadoranSamoanScandinavianScotch-IrishScottishSeminoleSenegaleseSerbianShoshoneSierra LeoneanSiouxSlavicSlovakSloveneSomaliSouth AfricanSouth AmericanSouth American IndianSoviet UnionSpaniardSpanishSpanish AmericanSpanish American IndianSri LankanSubsaharan AfricanSwedishSwissSyrianThaiTlingit-HaidaTonganTrinidadian and TobagonianTsimshianTurkishUgandanUkrainianUruguayanUteVenezuelanVietnameseWelshWest IndianYakamaYaquiYugoslavianYup'ik
Ancestry (Percentage)
AfghanAfricanAlaska NativeAlaskan AthabascanAlbanianAleutAlsatianAmericanApacheArabArgentineanArmenianAustralianAustrianBahamianBangladeshiBasqueBelgianBelizeanBhutaneseBlackfeetBolivianBrazilianBritishBritish West IndianBulgarianBurmeseCajunCambodianCanadianCelticCentral AmericanCentral American IndianCherokeeCheyenneChickasawChileanChineseChippewaChoctawColombianColvilleCosta RicanCreeCreekCroatianCubanCzechCzechoslovakianDanishDelawareDominicanDutchEastern EuropeanEcuadorianEgyptianEnglishEstonianEthiopianEuropeanFijianFilipinoFinnishFrenchFrench American IndianFrench CanadianGermanGerman RussianGhanaianGreekGuamanian / ChamorroGuatemalanGuyaneseHaitianHonduranHopiHungarianIcelanderIndian (Asian)IndonesianInupiatIranianIraqiIrishIroquoisIsraeliItalianJamaicanJapaneseJordanianKenyanKoreanLaotianLatvianLebaneseLiberianLithuanianLumbeeLuxembourgerMacedonianMalaysianMalteseMarshalleseMexicanMexican American IndianMongolianMoroccanNative HawaiianNavajoNepaleseNew ZealanderNicaraguanNigerianNorthern EuropeanNorwegianOkinawanOsagePaiutePakistaniPalestinianPanamanianParaguayanPennsylvania GermanPeruvianPimaPolishPortuguesePotawatomiPuebloPuerto RicanPuget Sound SalishRomanianRussianSalvadoranSamoanScandinavianScotch-IrishScottishSeminoleSenegaleseSerbianShoshoneSierra LeoneanSiouxSlavicSlovakSloveneSomaliSouth AfricanSouth AmericanSouth American IndianSoviet UnionSpaniardSpanishSpanish AmericanSpanish American IndianSri LankanSubsaharan AfricanSwedishSwissSyrianThaiTlingit-HaidaTonganTrinidadian and TobagonianTsimshianTurkishUgandanUkrainianUruguayanUteVenezuelanVietnameseWelshWest IndianYakamaYaquiYugoslavianYup'ik
Immigrant Origin (Total)
AfghanistanAfricaArgentinaArmeniaAsiaAustraliaAustriaBahamasBangladeshBarbadosBelarusBelgiumBelizeBosnia and HerzegovinaBrazilBulgariaBurma / MyanmarCambodiaCameroonCanadaCaribbeanCentral AmericaChileChinaColombiaCongoCosta RicaCroatiaCubaCzechoslovakiaDenmarkDominican RepublicEastern AfricaEastern AsiaEastern EuropeEcuadorEgyptEl SalvadorEnglandEritreaEthiopiaEuropeFijiFranceGermanyGhanaGreeceGuatemalaHaitiHondurasHong KongHungaryIndiaIndonesiaIranIraqIrelandIsraelItalyJamaicaJapanJordanKazakhstanKenyaKoreaKuwaitLaosLatin AmericaLatviaLebanonLiberiaLithuaniaMalaysiaMexicoMicronesiaMiddle AfricaMoldovaMoroccoNepalNetherlandsNicaraguaNigeriaNorth MacedoniaNorthern AfricaNorthern EuropeNorwayOceaniaPakistanPanamaPeruPhilippinesPolandPortugalRomaniaRussiaSaudi ArabiaScotlandSerbiaSingaporeSomaliaSouth AfricaSouth AmericaSouth Central AsiaSouth Eastern AsiaSouthern EuropeSpainSri LankaSudanSwedenSwitzerlandSyriaTaiwanThailandTrinidad and TobagoTurkeyUgandaUkraineUruguayUzbekistanVenezuelaVietnamWestern AfricaWestern AsiaWestern EuropeYemen
Immigrant Origin (Percentage)
AfghanistanAfricaArgentinaArmeniaAsiaAustraliaAustriaBahamasBangladeshBarbadosBelarusBelgiumBelizeBosnia and HerzegovinaBrazilBulgariaBurma / MyanmarCambodiaCameroonCanadaCaribbeanCentral AmericaChileChinaColombiaCongoCosta RicaCroatiaCubaCzechoslovakiaDenmarkDominican RepublicEastern AfricaEastern AsiaEastern EuropeEcuadorEgyptEl SalvadorEnglandEritreaEthiopiaEuropeFijiFranceGermanyGhanaGreeceGuatemalaHaitiHondurasHong KongHungaryIndiaIndonesiaIranIraqIrelandIsraelItalyJamaicaJapanJordanKazakhstanKenyaKoreaKuwaitLaosLatin AmericaLatviaLebanonLiberiaLithuaniaMalaysiaMexicoMicronesiaMiddle AfricaMoldovaMoroccoNepalNetherlandsNicaraguaNigeriaNorth MacedoniaNorthern AfricaNorthern EuropeNorwayOceaniaPakistanPanamaPeruPhilippinesPolandPortugalRomaniaRussiaSaudi ArabiaScotlandSerbiaSingaporeSomaliaSouth AfricaSouth AmericaSouth Central AsiaSouth Eastern AsiaSouthern EuropeSpainSri LankaSudanSwedenSwitzerlandSyriaTaiwanThailandTrinidad and TobagoTurkeyUgandaUkraineUruguayUzbekistanVenezuelaVietnamWestern AfricaWestern AsiaWestern EuropeYemen
Income
Income (Families)
Income (Households)
Poverty
Poverty (Families)
Unemployment
Employment Occupations
Employment Industries
Employer Class
Commute Time
Commute Means
School Enrollment
Education by Degree Field
Occupancy
Finances
Physical Characteristics
Portland
Compare Zip Codes
Comparison Subject

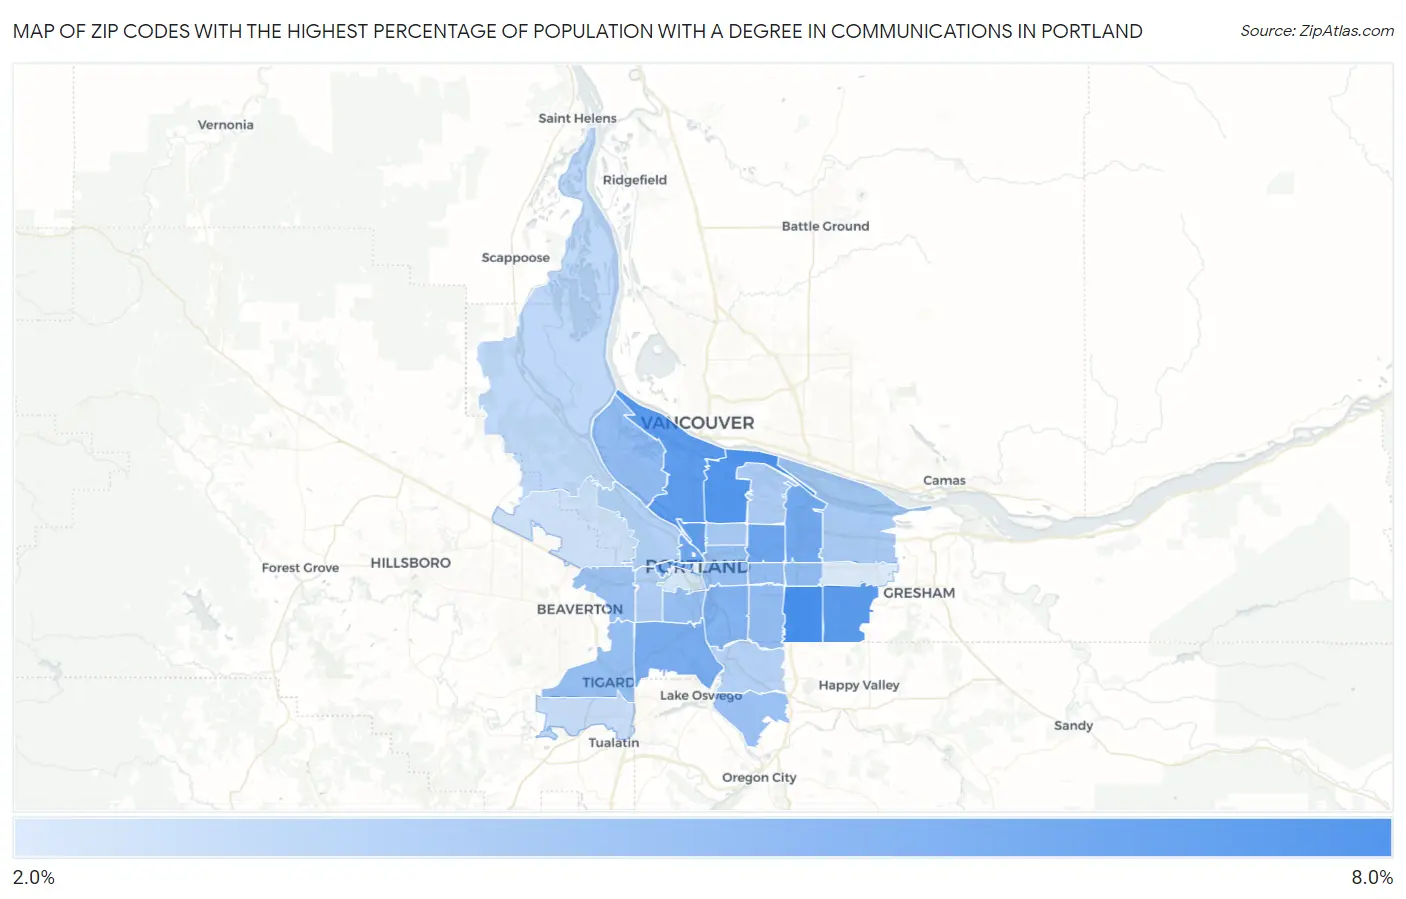
Map of Zip Codes with the Highest Percentage of Population with a Degree in Communications in Portland

0.0%
8.0%
Zip Codes with the Highest Percentage of Population with a Degree in Communications in Portland Map

Zip Codes with the Highest Percentage of Population with a Degree in Communications in Portland, OR

Zip Code % Graduates vs State vs National
1.972667.9%4.3%(+3.62)#334.1%(+3.74)#1,951
2.972117.5%4.3%(+3.20)#344.1%(+3.32)#2,233
3.972367.2%4.3%(+2.93)#374.1%(+3.05)#2,449
4.972177.1%4.3%(+2.83)#394.1%(+2.94)#2,535
5.972277.0%4.3%(+2.70)#404.1%(+2.82)#2,647
6.972136.5%4.3%(+2.21)#494.1%(+2.32)#3,182
7.972096.4%4.3%(+2.10)#504.1%(+2.22)#3,303
8.972206.3%4.3%(+2.04)#514.1%(+2.16)#3,374
9.972196.1%4.3%(+1.80)#534.1%(+1.92)#3,705
10.972055.9%4.3%(+1.65)#584.1%(+1.77)#3,934
11.972025.7%4.3%(+1.46)#614.1%(+1.58)#4,228
12.972035.3%4.3%(+1.01)#714.1%(+1.13)#5,119
13.972165.2%4.3%(+0.962)#734.1%(+1.08)#5,213
14.972065.2%4.3%(+0.907)#774.1%(+1.03)#5,332
15.972155.1%4.3%(+0.859)#824.1%(+0.979)#5,427
16.972235.1%4.3%(+0.810)#834.1%(+0.930)#5,541
17.972325.0%4.3%(+0.787)#844.1%(+0.906)#5,600
18.972145.0%4.3%(+0.759)#854.1%(+0.878)#5,657
19.972394.9%4.3%(+0.692)#874.1%(+0.812)#5,815
20.972254.8%4.3%(+0.580)#914.1%(+0.699)#6,100
21.972674.8%4.3%(+0.576)#934.1%(+0.695)#6,112
22.972124.4%4.3%(+0.189)#1054.1%(+0.309)#7,121
23.972304.4%4.3%(+0.141)#1074.1%(+0.261)#7,262
24.972184.3%4.3%(+0.015)#1154.1%(+0.134)#7,671
25.972214.1%4.3%(-0.166)#1254.1%(-0.046)#8,275
26.972104.0%4.3%(-0.222)#1284.1%(-0.103)#8,466
27.972223.9%4.3%(-0.323)#1334.1%(-0.203)#8,806
28.972313.6%4.3%(-0.661)#1524.1%(-0.542)#9,974
29.972243.2%4.3%(-1.01)#1694.1%(-0.890)#11,282
30.972293.0%4.3%(-1.23)#1774.1%(-1.12)#12,126
31.972012.8%4.3%(-1.43)#1844.1%(-1.31)#12,903
32.972332.6%4.3%(-1.69)#1974.1%(-1.57)#13,930

Common Questions

What are the Top 10 Zip Codes with the Highest Percentage of Population with a Degree in Communications in Portland, OR?
Top 10 Zip Codes with the Highest Percentage of Population with a Degree in Communications in Portland, OR are:
#1
7.9%
#2
7.5%
#3
7.2%
#4
7.1%
#5
7.0%
#6
6.5%
#7
6.4%
#8
6.3%
#9
6.1%
#10
5.9%
What zip code has the Highest Percentage of Population with a Degree in Communications in Portland, OR?
97266 has the Highest Percentage of Population with a Degree in Communications in Portland, OR with 7.9%.
What is the Percentage of Population with a Degree in Communications in Portland, OR?
Percentage of Population with a Degree in Communications in Portland is 5.6%.
What is the Percentage of Population with a Degree in Communications in Oregon?
Percentage of Population with a Degree in Communications in Oregon is 4.3%.
What is the Percentage of Population with a Degree in Communications in the United States?
Percentage of Population with a Degree in Communications in the United States is 4.1%.