Zip Codes with the Highest Percentage of Population with a Degree in Communications in Oregon
RELATED REPORTS & OPTIONS
Communications
Oregon
Compare Zip Codes
Map of Zip Codes with the Highest Percentage of Population with a Degree in Communications in Oregon
0.0%
40.0%
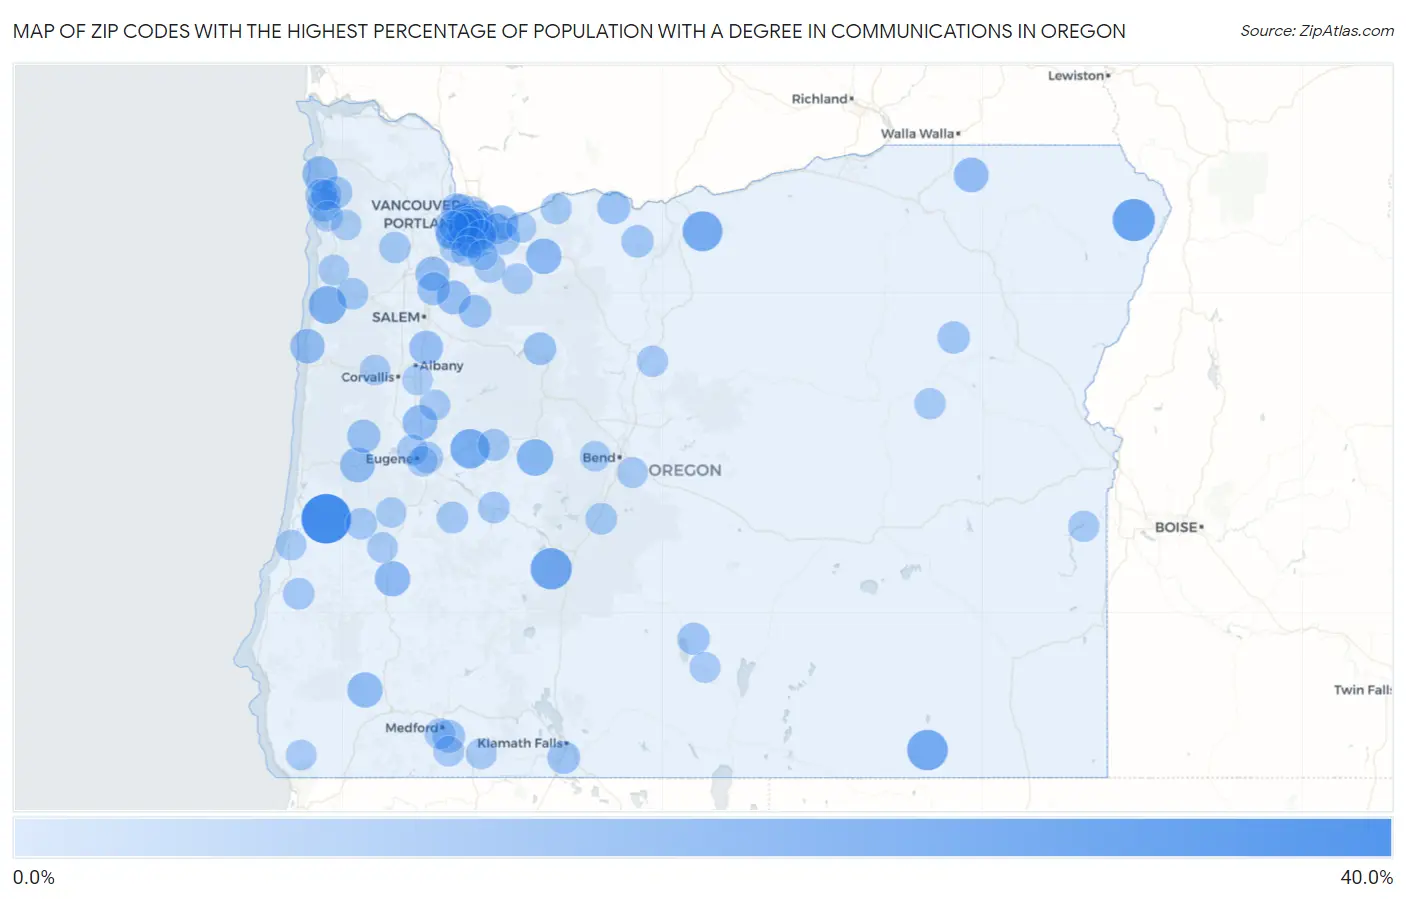
Zip Codes with the Highest Percentage of Population with a Degree in Communications in Oregon
| Zip Code | % Graduates | vs State | vs National | |
| 1. | 97473 | 37.9% | 4.3% (+33.7)#1 | 4.1% (+33.8)#90 |
| 2. | 97842 | 25.0% | 4.3% (+20.7)#2 | 4.1% (+20.9)#221 |
| 3. | 97733 | 23.3% | 4.3% (+19.1)#3 | 4.1% (+19.2)#243 |
| 4. | 97710 | 22.2% | 4.3% (+18.0)#4 | 4.1% (+18.1)#270 |
| 5. | 97039 | 21.0% | 4.3% (+16.7)#5 | 4.1% (+16.8)#303 |
| 6. | 97489 | 19.8% | 4.3% (+15.5)#6 | 4.1% (+15.6)#344 |
| 7. | 97368 | 17.1% | 4.3% (+12.9)#7 | 4.1% (+13.0)#435 |
| 8. | 97413 | 15.2% | 4.3% (+11.0)#8 | 4.1% (+11.1)#535 |
| 9. | 97067 | 13.3% | 4.3% (+9.07)#9 | 4.1% (+9.19)#678 |
| 10. | 97495 | 13.0% | 4.3% (+8.75)#10 | 4.1% (+8.87)#707 |
| 11. | 97532 | 12.9% | 4.3% (+8.62)#11 | 4.1% (+8.74)#718 |
| 12. | 97102 | 12.4% | 4.3% (+8.15)#12 | 4.1% (+8.27)#772 |
| 13. | 97490 | 12.1% | 4.3% (+7.87)#13 | 4.1% (+7.99)#802 |
| 14. | 97446 | 12.1% | 4.3% (+7.83)#14 | 4.1% (+7.95)#811 |
| 15. | 97886 | 12.1% | 4.3% (+7.81)#15 | 4.1% (+7.93)#814 |
| 16. | 97369 | 11.5% | 4.3% (+7.28)#16 | 4.1% (+7.40)#889 |
| 17. | 97060 | 11.1% | 4.3% (+6.83)#17 | 4.1% (+6.95)#970 |
| 18. | 97137 | 11.0% | 4.3% (+6.76)#18 | 4.1% (+6.88)#979 |
| 19. | 97373 | 10.4% | 4.3% (+6.19)#19 | 4.1% (+6.31)#1,066 |
| 20. | 97352 | 10.4% | 4.3% (+6.18)#20 | 4.1% (+6.30)#1,067 |
| 21. | 97136 | 9.6% | 4.3% (+5.34)#21 | 4.1% (+5.46)#1,240 |
| 22. | 97040 | 9.4% | 4.3% (+5.19)#22 | 4.1% (+5.31)#1,288 |
| 23. | 97412 | 9.4% | 4.3% (+5.12)#23 | 4.1% (+5.24)#1,309 |
| 24. | 97026 | 9.0% | 4.3% (+4.71)#24 | 4.1% (+4.83)#1,450 |
| 25. | 97634 | 8.6% | 4.3% (+4.37)#25 | 4.1% (+4.49)#1,581 |
| 26. | 97535 | 8.6% | 4.3% (+4.33)#26 | 4.1% (+4.45)#1,600 |
| 27. | 97375 | 8.5% | 4.3% (+4.26)#27 | 4.1% (+4.38)#1,625 |
| 28. | 97342 | 8.3% | 4.3% (+4.08)#28 | 4.1% (+4.20)#1,722 |
| 29. | 97877 | 8.2% | 4.3% (+3.91)#29 | 4.1% (+4.03)#1,790 |
| 30. | 97021 | 8.0% | 4.3% (+3.73)#30 | 4.1% (+3.85)#1,892 |
| 31. | 97009 | 7.9% | 4.3% (+3.65)#31 | 4.1% (+3.77)#1,938 |
| 32. | 97640 | 7.9% | 4.3% (+3.64)#32 | 4.1% (+3.76)#1,943 |
| 33. | 97266 | 7.9% | 4.3% (+3.62)#33 | 4.1% (+3.74)#1,951 |
| 34. | 97211 | 7.5% | 4.3% (+3.20)#34 | 4.1% (+3.32)#2,233 |
| 35. | 97131 | 7.4% | 4.3% (+3.18)#35 | 4.1% (+3.30)#2,244 |
| 36. | 97130 | 7.3% | 4.3% (+3.04)#36 | 4.1% (+3.16)#2,342 |
| 37. | 97236 | 7.2% | 4.3% (+2.93)#37 | 4.1% (+3.05)#2,449 |
| 38. | 97488 | 7.2% | 4.3% (+2.92)#38 | 4.1% (+3.04)#2,455 |
| 39. | 97217 | 7.1% | 4.3% (+2.83)#39 | 4.1% (+2.94)#2,535 |
| 40. | 97227 | 7.0% | 4.3% (+2.70)#40 | 4.1% (+2.82)#2,647 |
| 41. | 97463 | 6.8% | 4.3% (+2.59)#41 | 4.1% (+2.71)#2,753 |
| 42. | 97739 | 6.8% | 4.3% (+2.58)#42 | 4.1% (+2.70)#2,764 |
| 43. | 97434 | 6.8% | 4.3% (+2.56)#43 | 4.1% (+2.68)#2,778 |
| 44. | 97005 | 6.8% | 4.3% (+2.53)#44 | 4.1% (+2.65)#2,800 |
| 45. | 97347 | 6.7% | 4.3% (+2.49)#45 | 4.1% (+2.61)#2,864 |
| 46. | 97148 | 6.7% | 4.3% (+2.40)#46 | 4.1% (+2.52)#2,965 |
| 47. | 97436 | 6.5% | 4.3% (+2.27)#47 | 4.1% (+2.39)#3,108 |
| 48. | 97423 | 6.5% | 4.3% (+2.26)#48 | 4.1% (+2.38)#3,120 |
| 49. | 97213 | 6.5% | 4.3% (+2.21)#49 | 4.1% (+2.32)#3,182 |
| 50. | 97209 | 6.4% | 4.3% (+2.10)#50 | 4.1% (+2.22)#3,303 |
| 51. | 97220 | 6.3% | 4.3% (+2.04)#51 | 4.1% (+2.16)#3,374 |
| 52. | 97008 | 6.3% | 4.3% (+2.00)#52 | 4.1% (+2.12)#3,414 |
| 53. | 97219 | 6.1% | 4.3% (+1.80)#53 | 4.1% (+1.92)#3,705 |
| 54. | 97741 | 6.0% | 4.3% (+1.78)#54 | 4.1% (+1.90)#3,721 |
| 55. | 97913 | 6.0% | 4.3% (+1.77)#55 | 4.1% (+1.89)#3,733 |
| 56. | 97014 | 6.0% | 4.3% (+1.71)#56 | 4.1% (+1.83)#3,837 |
| 57. | 97477 | 5.9% | 4.3% (+1.65)#57 | 4.1% (+1.77)#3,927 |
| 58. | 97205 | 5.9% | 4.3% (+1.65)#58 | 4.1% (+1.77)#3,934 |
| 59. | 97869 | 5.8% | 4.3% (+1.55)#59 | 4.1% (+1.67)#4,107 |
| 60. | 97404 | 5.8% | 4.3% (+1.52)#60 | 4.1% (+1.64)#4,158 |
| 61. | 97202 | 5.7% | 4.3% (+1.46)#61 | 4.1% (+1.58)#4,228 |
| 62. | 97015 | 5.7% | 4.3% (+1.46)#62 | 4.1% (+1.58)#4,230 |
| 63. | 97027 | 5.5% | 4.3% (+1.20)#63 | 4.1% (+1.32)#4,724 |
| 64. | 97520 | 5.4% | 4.3% (+1.18)#64 | 4.1% (+1.30)#4,787 |
| 65. | 97147 | 5.4% | 4.3% (+1.13)#65 | 4.1% (+1.25)#4,866 |
| 66. | 97327 | 5.4% | 4.3% (+1.12)#66 | 4.1% (+1.24)#4,896 |
| 67. | 97636 | 5.3% | 4.3% (+1.08)#67 | 4.1% (+1.20)#4,969 |
| 68. | 97702 | 5.3% | 4.3% (+1.07)#68 | 4.1% (+1.19)#4,977 |
| 69. | 97501 | 5.3% | 4.3% (+1.07)#69 | 4.1% (+1.19)#4,980 |
| 70. | 97023 | 5.3% | 4.3% (+1.05)#70 | 4.1% (+1.17)#5,034 |
| 71. | 97203 | 5.3% | 4.3% (+1.01)#71 | 4.1% (+1.13)#5,119 |
| 72. | 97004 | 5.2% | 4.3% (+0.966)#72 | 4.1% (+1.09)#5,202 |
| 73. | 97216 | 5.2% | 4.3% (+0.962)#73 | 4.1% (+1.08)#5,213 |
| 74. | 97540 | 5.2% | 4.3% (+0.946)#74 | 4.1% (+1.07)#5,254 |
| 75. | 97112 | 5.2% | 4.3% (+0.940)#75 | 4.1% (+1.06)#5,264 |
| 76. | 97062 | 5.2% | 4.3% (+0.914)#76 | 4.1% (+1.03)#5,318 |
| 77. | 97206 | 5.2% | 4.3% (+0.907)#77 | 4.1% (+1.03)#5,332 |
| 78. | 97462 | 5.2% | 4.3% (+0.899)#78 | 4.1% (+1.02)#5,348 |
| 79. | 97080 | 5.1% | 4.3% (+0.889)#79 | 4.1% (+1.01)#5,368 |
| 80. | 97034 | 5.1% | 4.3% (+0.885)#80 | 4.1% (+1.00)#5,379 |
| 81. | 97389 | 5.1% | 4.3% (+0.874)#81 | 4.1% (+0.993)#5,399 |
| 82. | 97215 | 5.1% | 4.3% (+0.859)#82 | 4.1% (+0.979)#5,427 |
| 83. | 97223 | 5.1% | 4.3% (+0.810)#83 | 4.1% (+0.930)#5,541 |
| 84. | 97232 | 5.0% | 4.3% (+0.787)#84 | 4.1% (+0.906)#5,600 |
| 85. | 97214 | 5.0% | 4.3% (+0.759)#85 | 4.1% (+0.878)#5,657 |
| 86. | 97415 | 5.0% | 4.3% (+0.730)#86 | 4.1% (+0.849)#5,741 |
| 87. | 97239 | 4.9% | 4.3% (+0.692)#87 | 4.1% (+0.812)#5,815 |
| 88. | 97459 | 4.9% | 4.3% (+0.672)#88 | 4.1% (+0.791)#5,866 |
| 89. | 97086 | 4.9% | 4.3% (+0.653)#89 | 4.1% (+0.772)#5,906 |
| 90. | 97370 | 4.9% | 4.3% (+0.639)#90 | 4.1% (+0.758)#5,933 |
| 91. | 97225 | 4.8% | 4.3% (+0.580)#91 | 4.1% (+0.699)#6,100 |
| 92. | 97403 | 4.8% | 4.3% (+0.578)#92 | 4.1% (+0.698)#6,105 |
| 93. | 97267 | 4.8% | 4.3% (+0.576)#93 | 4.1% (+0.695)#6,112 |
| 94. | 97703 | 4.8% | 4.3% (+0.571)#94 | 4.1% (+0.690)#6,124 |
| 95. | 97107 | 4.8% | 4.3% (+0.570)#95 | 4.1% (+0.690)#6,125 |
| 96. | 97068 | 4.8% | 4.3% (+0.543)#96 | 4.1% (+0.662)#6,184 |
| 97. | 97141 | 4.8% | 4.3% (+0.537)#97 | 4.1% (+0.657)#6,195 |
| 98. | 97435 | 4.7% | 4.3% (+0.409)#98 | 4.1% (+0.528)#6,514 |
| 99. | 97045 | 4.6% | 4.3% (+0.381)#99 | 4.1% (+0.501)#6,588 |
| 100. | 97019 | 4.6% | 4.3% (+0.296)#100 | 4.1% (+0.415)#6,818 |
Common Questions
What are the Top 10 Zip Codes with the Highest Percentage of Population with a Degree in Communications in Oregon?
Top 10 Zip Codes with the Highest Percentage of Population with a Degree in Communications in Oregon are:
What zip code has the Highest Percentage of Population with a Degree in Communications in Oregon?
97473 has the Highest Percentage of Population with a Degree in Communications in Oregon with 37.9%.
What is the Percentage of Population with a Degree in Communications in the State of Oregon?
Percentage of Population with a Degree in Communications in Oregon is 4.3%.
What is the Percentage of Population with a Degree in Communications in the United States?
Percentage of Population with a Degree in Communications in the United States is 4.1%.