Bunnlevel, NC Map & Demographics
Bunnlevel Map
Bunnlevel Overview
$33,125
PER CAPITA INCOME
$84,583
AVG FAMILY INCOME
$69,265
AVG HOUSEHOLD INCOME
5.3%
WAGE / INCOME GAP [ % ]
94.7¢/ $1
WAGE / INCOME GAP [ $ ]
0.33
INEQUALITY / GINI INDEX
1,011
TOTAL POPULATION
594
MALE POPULATION
417
FEMALE POPULATION
142.45
MALES / 100 FEMALES
70.20
FEMALES / 100 MALES
46.3
MEDIAN AGE
3.1
AVG FAMILY SIZE
2.6
AVG HOUSEHOLD SIZE
565
LABOR FORCE [ PEOPLE ]
60.8%
PERCENT IN LABOR FORCE
Bunnlevel Zip Codes
Income in Bunnlevel
Income Overview in Bunnlevel
Per Capita Income in Bunnlevel is $33,125, while median incomes of families and households are $84,583 and $69,265 respectively.
| Characteristic | Number | Measure |
| Per Capita Income | 1,011 | $33,125 |
| Median Family Income | 269 | $84,583 |
| Mean Family Income | 269 | $86,174 |
| Median Household Income | 392 | $69,265 |
| Mean Household Income | 392 | $72,394 |
| Income Deficit | 269 | $0 |
| Wage / Income Gap (%) | 1,011 | 5.31% |
| Wage / Income Gap ($) | 1,011 | 94.69¢ per $1 |
| Gini / Inequality Index | 1,011 | 0.33 |
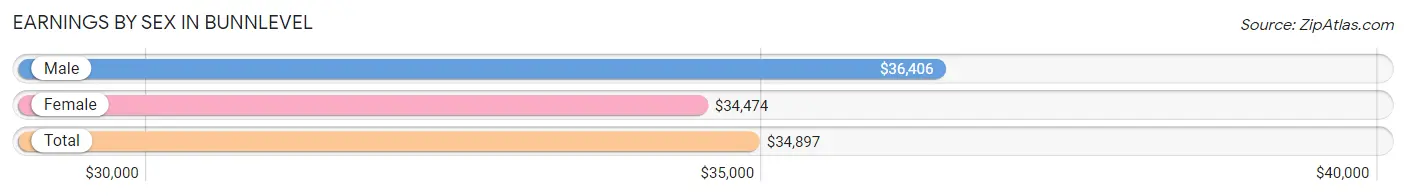
Earnings by Sex in Bunnlevel
Average Earnings in Bunnlevel are $34,897, $36,406 for men and $34,474 for women, a difference of 5.3%.
| Sex | Number | Average Earnings |
| Male | 347 (58.3%) | $36,406 |
| Female | 248 (41.7%) | $34,474 |
| Total | 595 (100.0%) | $34,897 |
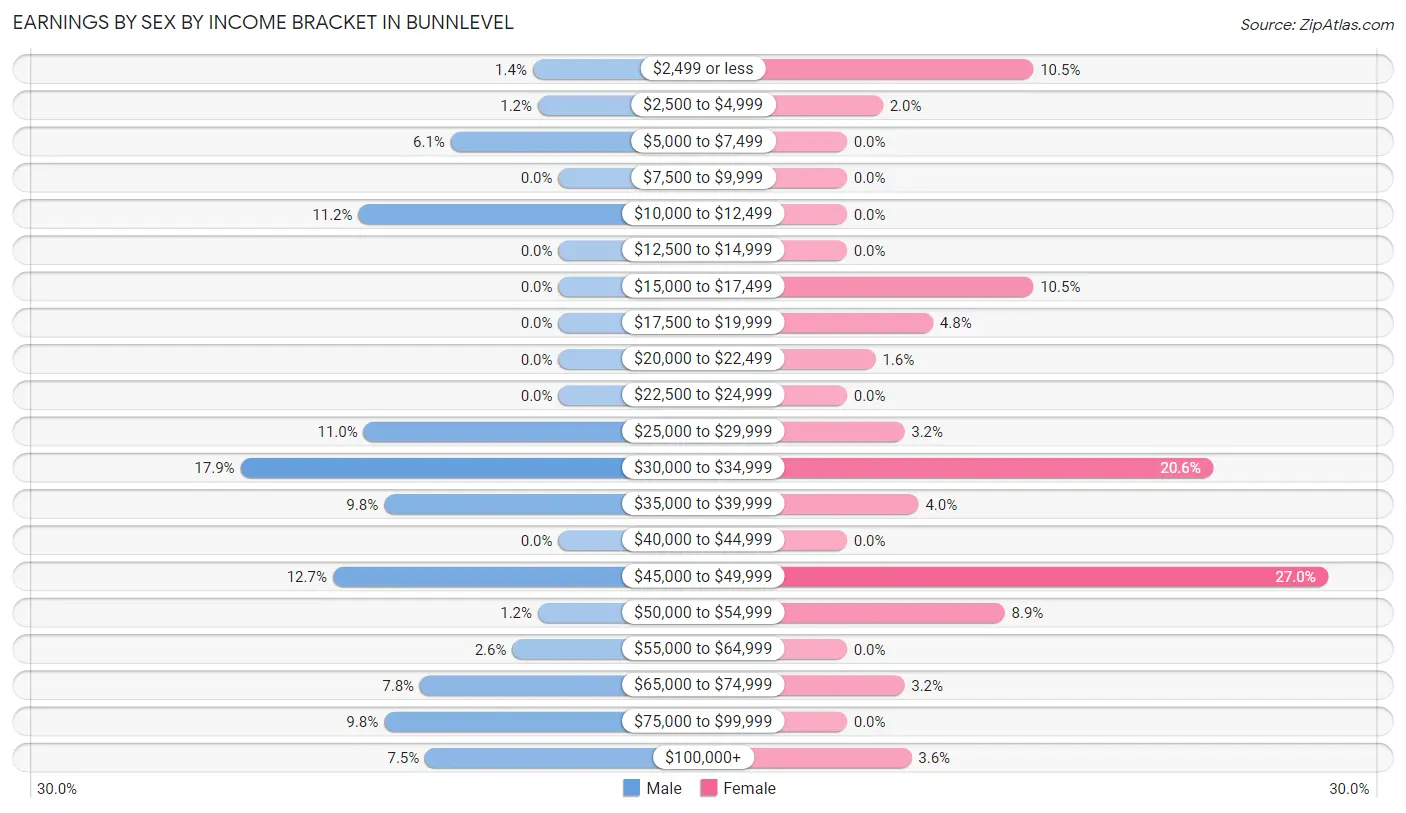
Earnings by Sex by Income Bracket in Bunnlevel
The most common earnings brackets in Bunnlevel are $30,000 to $34,999 for men (62 | 17.9%) and $45,000 to $49,999 for women (67 | 27.0%).
| Income | Male | Female |
| $2,499 or less | 5 (1.4%) | 26 (10.5%) |
| $2,500 to $4,999 | 4 (1.1%) | 5 (2.0%) |
| $5,000 to $7,499 | 21 (6.0%) | 0 (0.0%) |
| $7,500 to $9,999 | 0 (0.0%) | 0 (0.0%) |
| $10,000 to $12,499 | 39 (11.2%) | 0 (0.0%) |
| $12,500 to $14,999 | 0 (0.0%) | 0 (0.0%) |
| $15,000 to $17,499 | 0 (0.0%) | 26 (10.5%) |
| $17,500 to $19,999 | 0 (0.0%) | 12 (4.8%) |
| $20,000 to $22,499 | 0 (0.0%) | 4 (1.6%) |
| $22,500 to $24,999 | 0 (0.0%) | 0 (0.0%) |
| $25,000 to $29,999 | 38 (11.0%) | 8 (3.2%) |
| $30,000 to $34,999 | 62 (17.9%) | 51 (20.6%) |
| $35,000 to $39,999 | 34 (9.8%) | 10 (4.0%) |
| $40,000 to $44,999 | 0 (0.0%) | 0 (0.0%) |
| $45,000 to $49,999 | 44 (12.7%) | 67 (27.0%) |
| $50,000 to $54,999 | 4 (1.1%) | 22 (8.9%) |
| $55,000 to $64,999 | 9 (2.6%) | 0 (0.0%) |
| $65,000 to $74,999 | 27 (7.8%) | 8 (3.2%) |
| $75,000 to $99,999 | 34 (9.8%) | 0 (0.0%) |
| $100,000+ | 26 (7.5%) | 9 (3.6%) |
| Total | 347 (100.0%) | 248 (100.0%) |
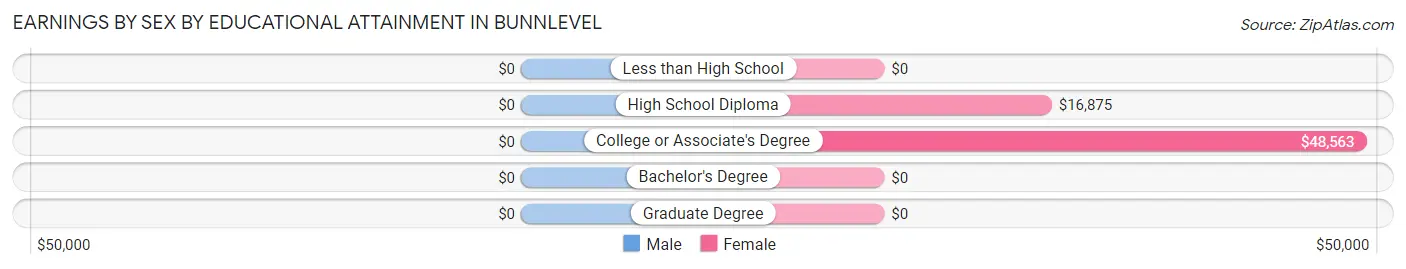
Earnings by Sex by Educational Attainment in Bunnlevel
| Educational Attainment | Male Income | Female Income |
| Less than High School | - | - |
| High School Diploma | - | - |
| College or Associate's Degree | - | - |
| Bachelor's Degree | - | - |
| Graduate Degree | - | - |
| Total | $39,615 | $37,250 |
Family Income in Bunnlevel
Family Income Brackets in Bunnlevel
According to the Bunnlevel family income data, there are 84 families falling into the $75,000 to $99,999 income range, which is the most common income bracket and makes up 31.2% of all families.
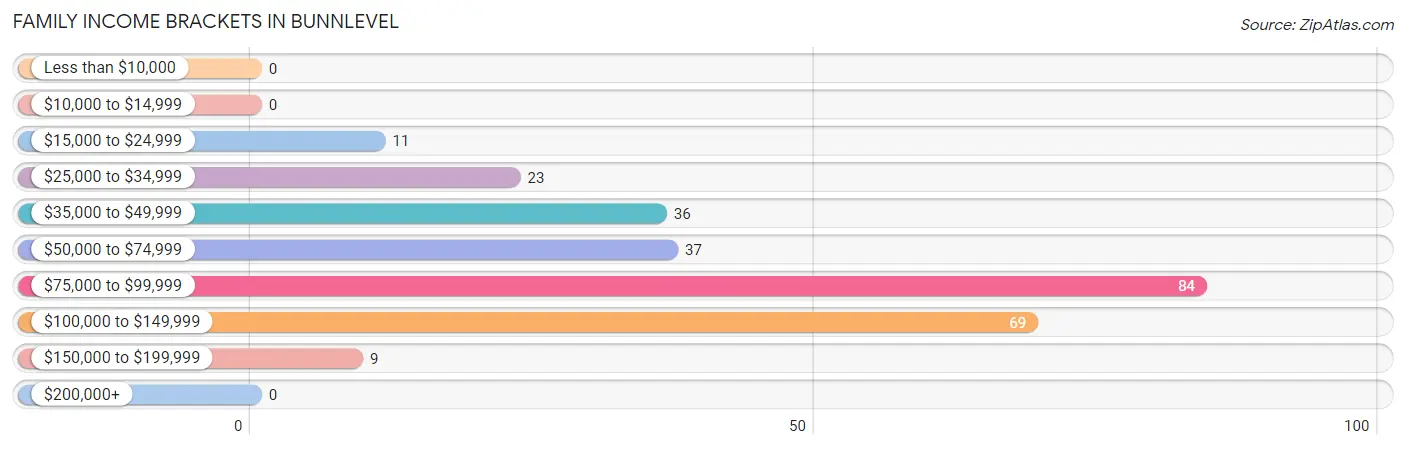
| Income Bracket | # Families | % Families |
| Less than $10,000 | 0 | 0.0% |
| $10,000 to $14,999 | 0 | 0.0% |
| $15,000 to $24,999 | 11 | 4.1% |
| $25,000 to $34,999 | 23 | 8.6% |
| $35,000 to $49,999 | 36 | 13.4% |
| $50,000 to $74,999 | 37 | 13.8% |
| $75,000 to $99,999 | 84 | 31.2% |
| $100,000 to $149,999 | 69 | 25.7% |
| $150,000 to $199,999 | 9 | 3.3% |
| $200,000+ | 0 | 0.0% |
Family Income by Famaliy Size in Bunnlevel
4-person families (20 | 7.4%) account for the highest median family income in Bunnlevel with $137,917 per family, while 2-person families (193 | 71.8%) have the highest median income of $40,677 per family member.
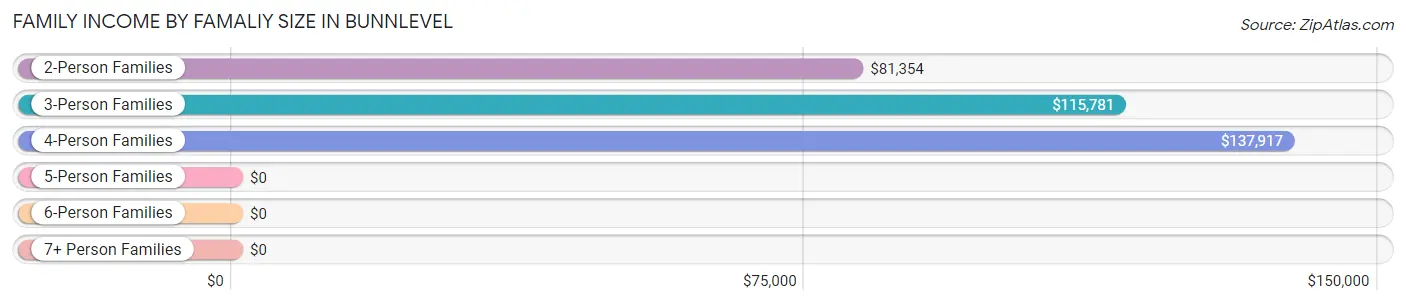
| Income Bracket | # Families | Median Income |
| 2-Person Families | 193 (71.8%) | $81,354 |
| 3-Person Families | 47 (17.5%) | $115,781 |
| 4-Person Families | 20 (7.4%) | $137,917 |
| 5-Person Families | 9 (3.4%) | $0 |
| 6-Person Families | 0 (0.0%) | $0 |
| 7+ Person Families | 0 (0.0%) | $0 |
| Total | 269 (100.0%) | $84,583 |
Family Income by Number of Earners in Bunnlevel
The median family income in Bunnlevel is $84,583, with families comprising 3+ earners (21) having the highest median family income of $137,813, while families with no earners (66) have the lowest median family income of $43,516, accounting for 7.8% and 24.5% of families, respectively.
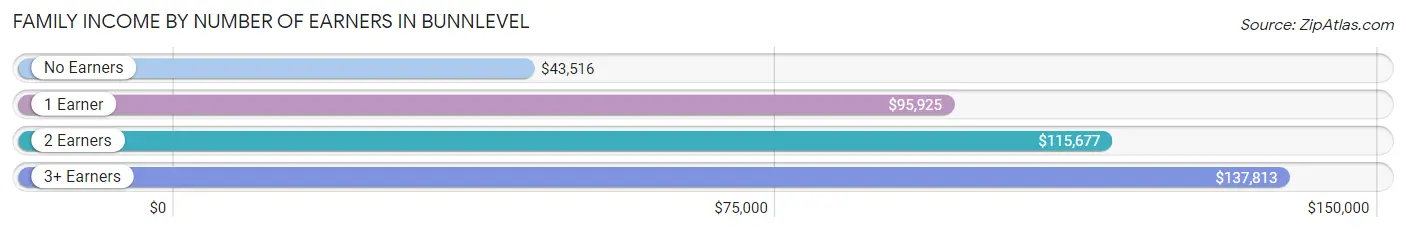
| Number of Earners | # Families | Median Income |
| No Earners | 66 (24.5%) | $43,516 |
| 1 Earner | 81 (30.1%) | $95,925 |
| 2 Earners | 101 (37.6%) | $115,677 |
| 3+ Earners | 21 (7.8%) | $137,813 |
| Total | 269 (100.0%) | $84,583 |
Household Income in Bunnlevel
Household Income Brackets in Bunnlevel
With 90 households falling in the category, the $75,000 to $99,999 income range is the most frequent in Bunnlevel, accounting for 23.0% of all households.

| Income Bracket | # Households | % Households |
| Less than $10,000 | 0 | 0.0% |
| $10,000 to $14,999 | 21 | 5.4% |
| $15,000 to $24,999 | 46 | 11.7% |
| $25,000 to $34,999 | 44 | 11.2% |
| $35,000 to $49,999 | 36 | 9.2% |
| $50,000 to $74,999 | 72 | 18.4% |
| $75,000 to $99,999 | 90 | 23.0% |
| $100,000 to $149,999 | 74 | 18.9% |
| $150,000 to $199,999 | 9 | 2.3% |
| $200,000+ | 0 | 0.0% |
Household Income by Householder Age in Bunnlevel
The median household income in Bunnlevel is $69,265, with the highest median household income of $73,056 found in the 65+ years age bracket for the primary householder. A total of 166 households (42.3%) fall into this category. Meanwhile, the 15 to 24 years age bracket for the primary householder has the lowest median household income of $0, with 17 households (4.3%) in this group.
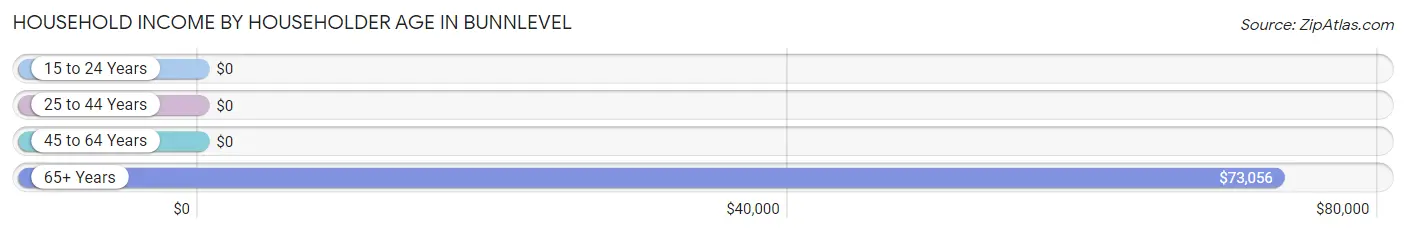
| Income Bracket | # Households | Median Income |
| 15 to 24 Years | 17 (4.3%) | $0 |
| 25 to 44 Years | 98 (25.0%) | $0 |
| 45 to 64 Years | 111 (28.3%) | $0 |
| 65+ Years | 166 (42.3%) | $73,056 |
| Total | 392 (100.0%) | $69,265 |
Poverty in Bunnlevel
Income Below Poverty by Sex and Age in Bunnlevel
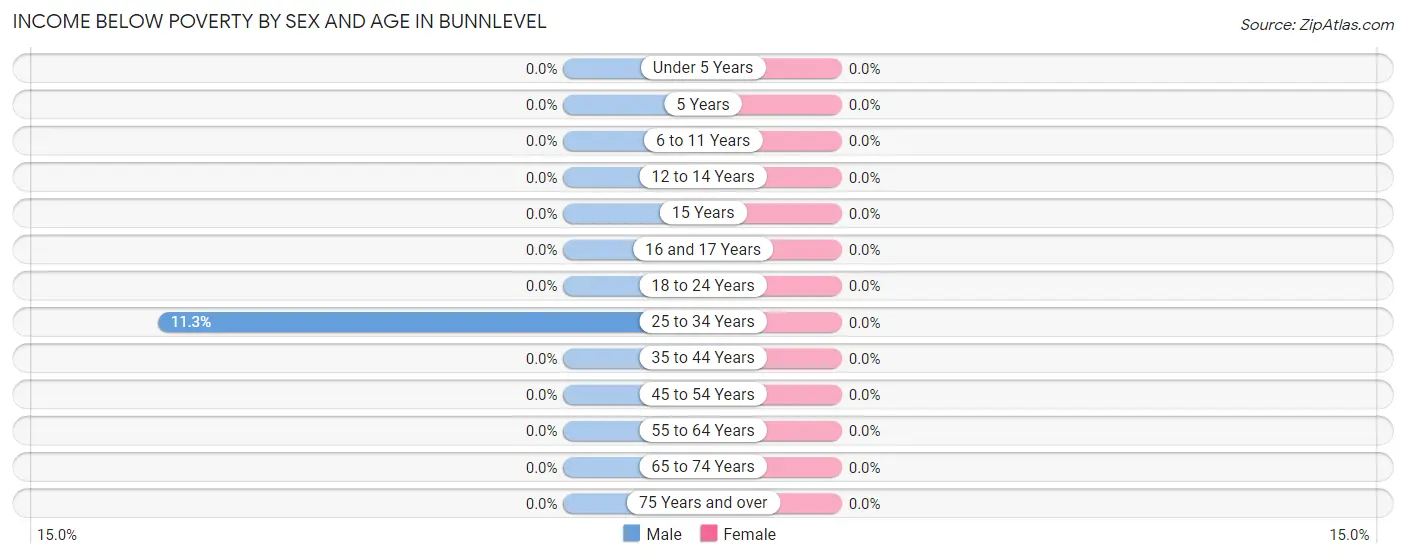
| Age Bracket | Male | Female |
| Under 5 Years | 0 (0.0%) | 0 (0.0%) |
| 5 Years | 0 (0.0%) | 0 (0.0%) |
| 6 to 11 Years | 0 (0.0%) | 0 (0.0%) |
| 12 to 14 Years | 0 (0.0%) | 0 (0.0%) |
| 15 Years | 0 (0.0%) | 0 (0.0%) |
| 16 and 17 Years | 0 (0.0%) | 0 (0.0%) |
| 18 to 24 Years | 0 (0.0%) | 0 (0.0%) |
| 25 to 34 Years | 21 (11.3%) | 0 (0.0%) |
| 35 to 44 Years | 0 (0.0%) | 0 (0.0%) |
| 45 to 54 Years | 0 (0.0%) | 0 (0.0%) |
| 55 to 64 Years | 0 (0.0%) | 0 (0.0%) |
| 65 to 74 Years | 0 (0.0%) | 0 (0.0%) |
| 75 Years and over | 0 (0.0%) | 0 (0.0%) |
| Total | 21 (3.5%) | 0 (0.0%) |
Income Above Poverty by Sex and Age in Bunnlevel
According to the poverty statistics in Bunnlevel, males aged under 5 years and females aged under 5 years are the age groups that are most secure financially, with 100.0% of males and 100.0% of females in these age groups living above the poverty line.
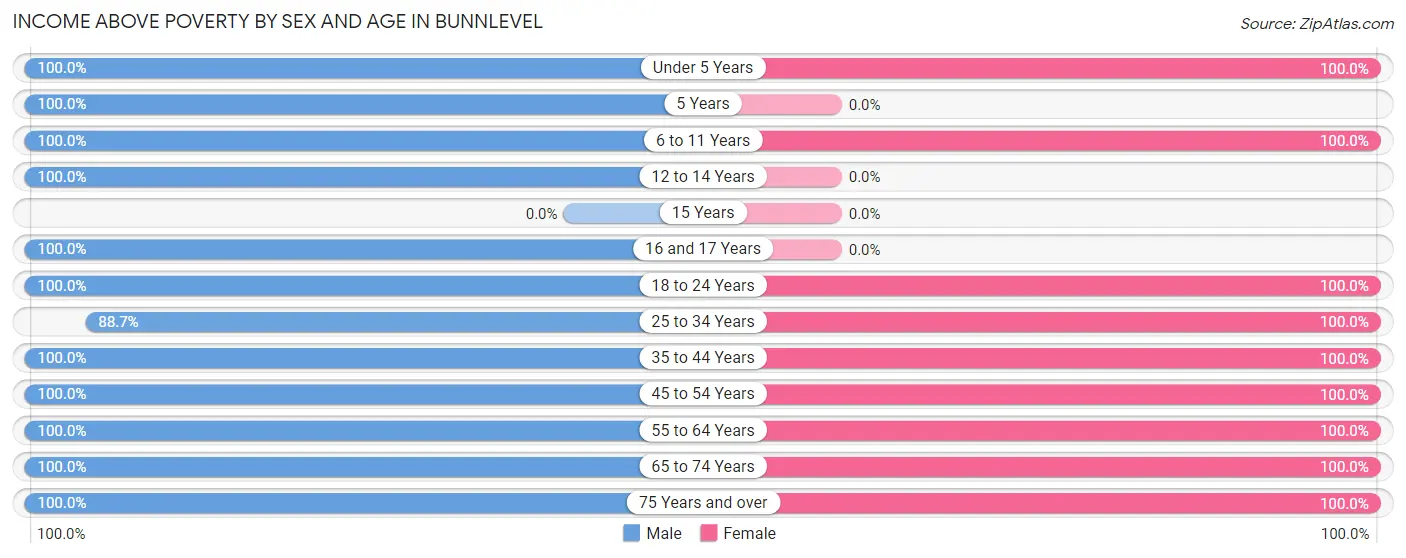
| Age Bracket | Male | Female |
| Under 5 Years | 13 (100.0%) | 12 (100.0%) |
| 5 Years | 14 (100.0%) | 0 (0.0%) |
| 6 to 11 Years | 9 (100.0%) | 7 (100.0%) |
| 12 to 14 Years | 3 (100.0%) | 0 (0.0%) |
| 15 Years | 0 (0.0%) | 0 (0.0%) |
| 16 and 17 Years | 12 (100.0%) | 0 (0.0%) |
| 18 to 24 Years | 75 (100.0%) | 34 (100.0%) |
| 25 to 34 Years | 165 (88.7%) | 38 (100.0%) |
| 35 to 44 Years | 33 (100.0%) | 30 (100.0%) |
| 45 to 54 Years | 65 (100.0%) | 50 (100.0%) |
| 55 to 64 Years | 75 (100.0%) | 79 (100.0%) |
| 65 to 74 Years | 91 (100.0%) | 135 (100.0%) |
| 75 Years and over | 18 (100.0%) | 9 (100.0%) |
| Total | 573 (96.5%) | 394 (100.0%) |
Income Below Poverty Among Married-Couple Families in Bunnlevel
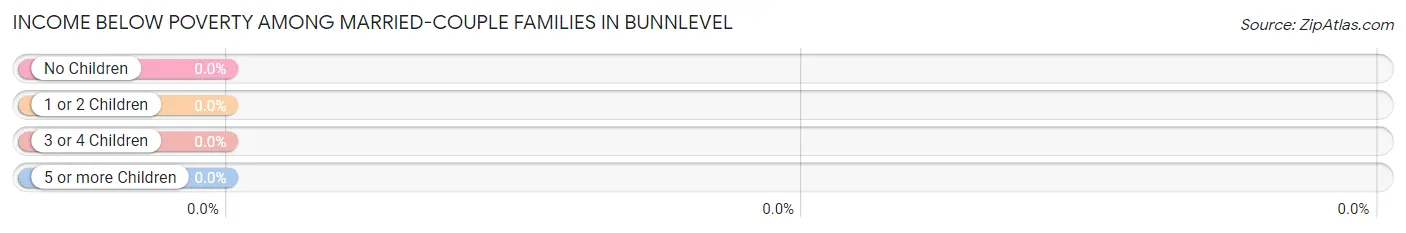
| Children | Above Poverty | Below Poverty |
| No Children | 158 (100.0%) | 0 (0.0%) |
| 1 or 2 Children | 19 (100.0%) | 0 (0.0%) |
| 3 or 4 Children | 9 (100.0%) | 0 (0.0%) |
| 5 or more Children | 0 (0.0%) | 0 (0.0%) |
| Total | 186 (100.0%) | 0 (0.0%) |
Income Below Poverty Among Single-Parent Households in Bunnlevel
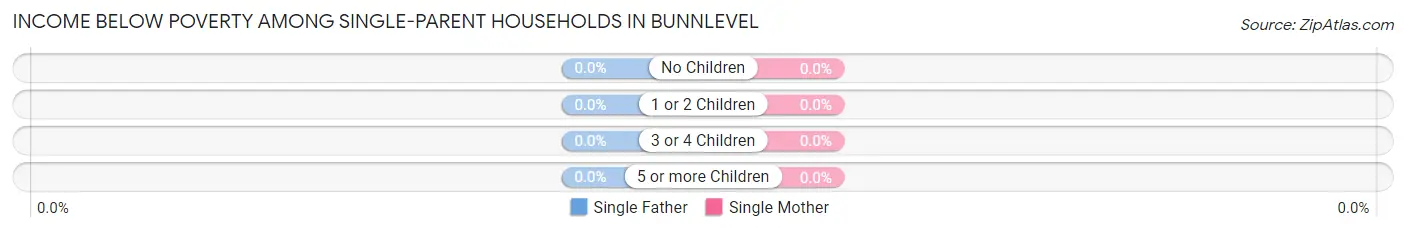
| Children | Single Father | Single Mother |
| No Children | 0 (0.0%) | 0 (0.0%) |
| 1 or 2 Children | 0 (0.0%) | 0 (0.0%) |
| 3 or 4 Children | 0 (0.0%) | 0 (0.0%) |
| 5 or more Children | 0 (0.0%) | 0 (0.0%) |
| Total | 0 (0.0%) | 0 (0.0%) |
Income Below Poverty Among Married-Couple vs Single-Parent Households in Bunnlevel
| Children | Married-Couple Families | Single-Parent Households |
| No Children | 0 (0.0%) | 0 (0.0%) |
| 1 or 2 Children | 0 (0.0%) | 0 (0.0%) |
| 3 or 4 Children | 0 (0.0%) | 0 (0.0%) |
| 5 or more Children | 0 (0.0%) | 0 (0.0%) |
| Total | 0 (0.0%) | 0 (0.0%) |
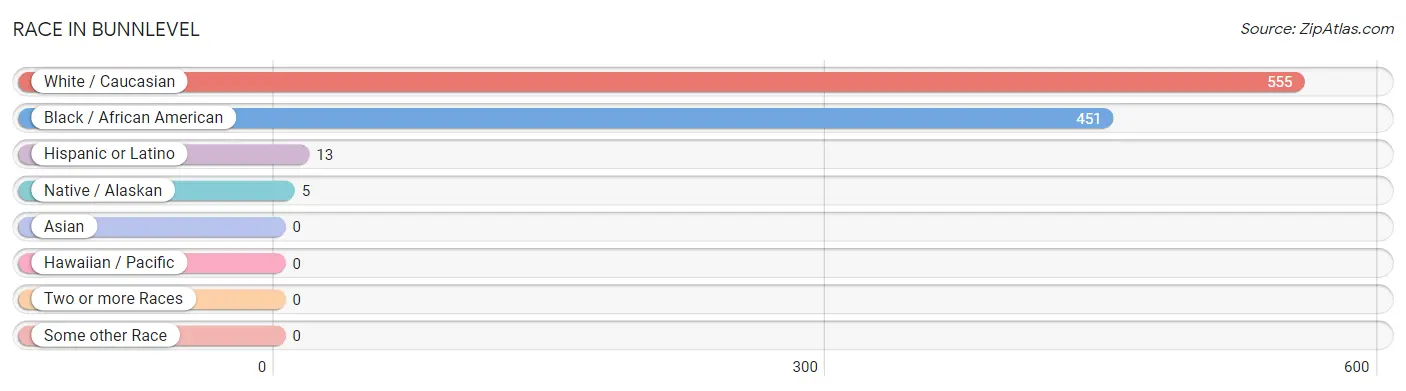
Race in Bunnlevel
The most populous races in Bunnlevel are White / Caucasian (555 | 54.9%), Black / African American (451 | 44.6%), and Hispanic or Latino (13 | 1.3%).
| Race | # Population | % Population |
| Asian | 0 | 0.0% |
| Black / African American | 451 | 44.6% |
| Hawaiian / Pacific | 0 | 0.0% |
| Hispanic or Latino | 13 | 1.3% |
| Native / Alaskan | 5 | 0.5% |
| White / Caucasian | 555 | 54.9% |
| Two or more Races | 0 | 0.0% |
| Some other Race | 0 | 0.0% |
| Total | 1,011 | 100.0% |
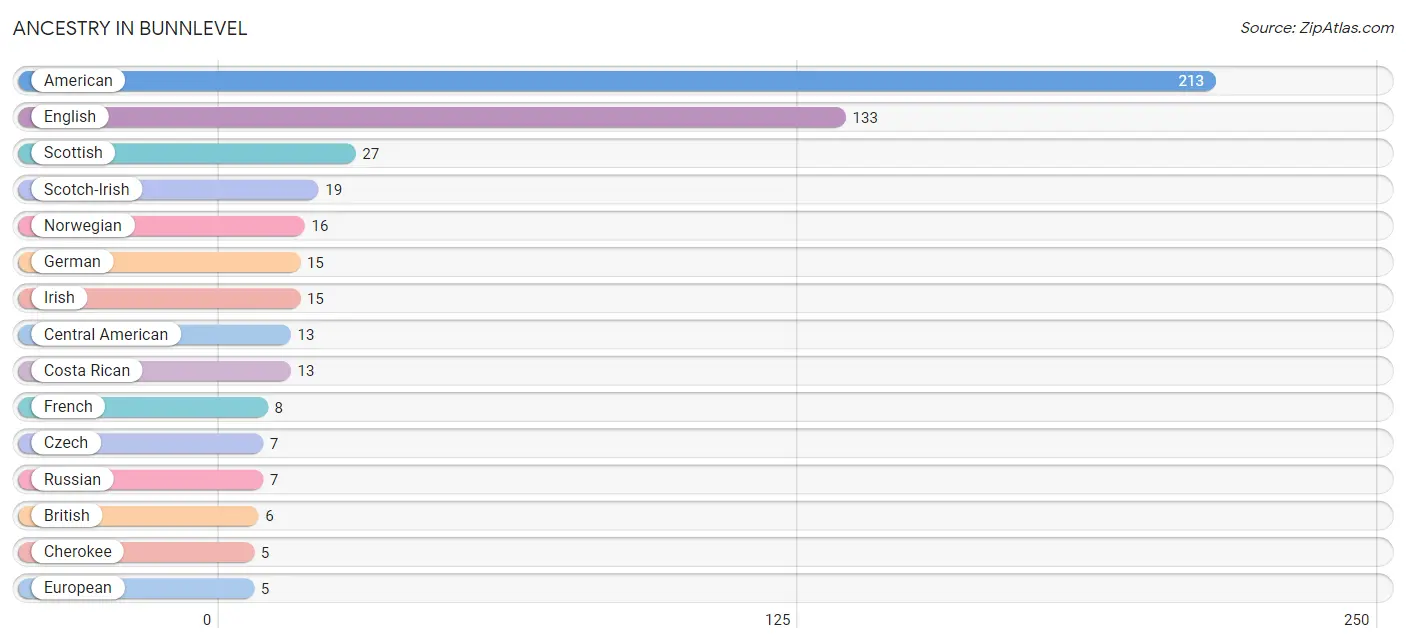
Ancestry in Bunnlevel
The most populous ancestries reported in Bunnlevel are American (213 | 21.1%), English (133 | 13.2%), Scottish (27 | 2.7%), Scotch-Irish (19 | 1.9%), and Norwegian (16 | 1.6%), together accounting for 40.4% of all Bunnlevel residents.
| Ancestry | # Population | % Population |
| American | 213 | 21.1% |
| British | 6 | 0.6% |
| Central American | 13 | 1.3% |
| Cherokee | 5 | 0.5% |
| Costa Rican | 13 | 1.3% |
| Czech | 7 | 0.7% |
| English | 133 | 13.2% |
| European | 5 | 0.5% |
| French | 8 | 0.8% |
| German | 15 | 1.5% |
| Irish | 15 | 1.5% |
| Norwegian | 16 | 1.6% |
| Polish | 4 | 0.4% |
| Russian | 7 | 0.7% |
| Scotch-Irish | 19 | 1.9% |
| Scottish | 27 | 2.7% | View All 16 Rows |
Immigrants in Bunnlevel

| Immigration Origin | # Population | % Population | View All 0 Rows |
Sex and Age in Bunnlevel
Sex and Age in Bunnlevel
The most populous age groups in Bunnlevel are 30 to 34 Years (125 | 21.0%) for men and 65 to 69 Years (108 | 25.9%) for women.
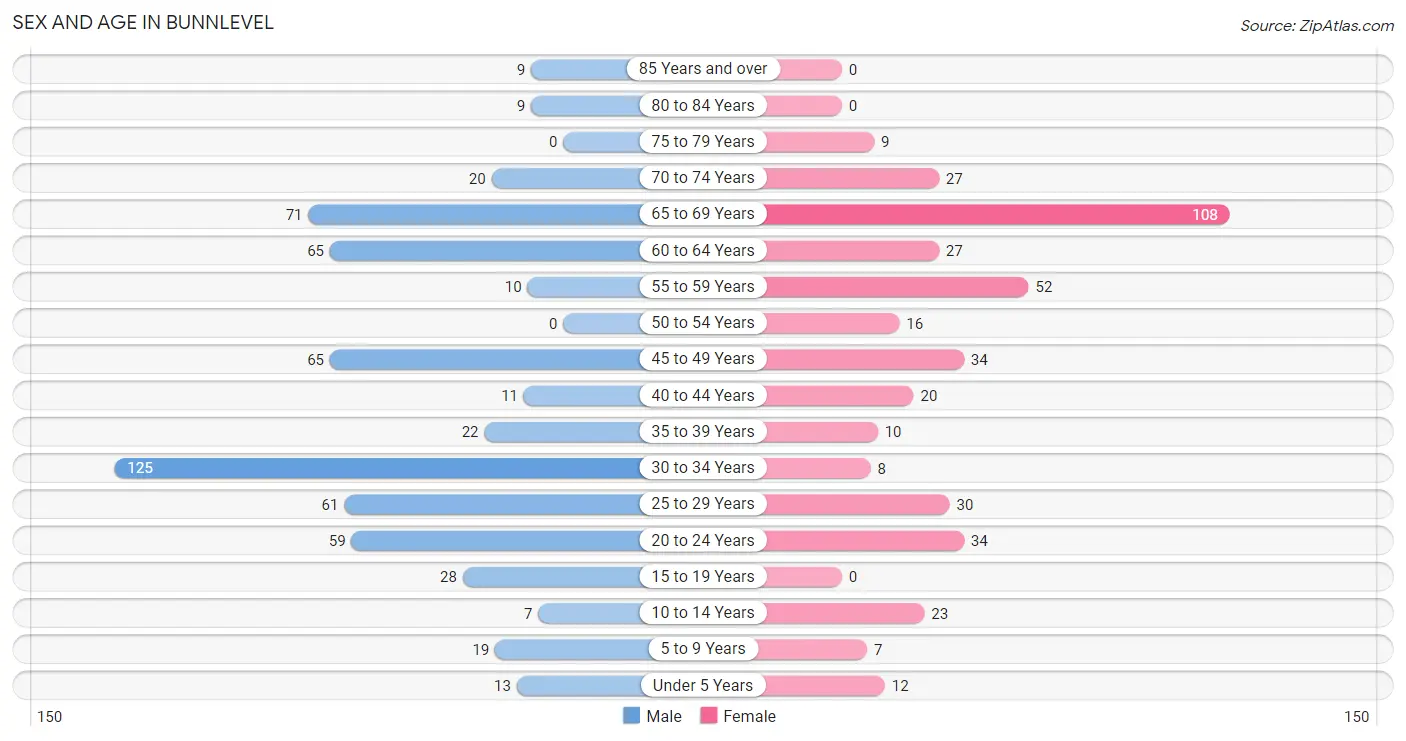
| Age Bracket | Male | Female |
| Under 5 Years | 13 (2.2%) | 12 (2.9%) |
| 5 to 9 Years | 19 (3.2%) | 7 (1.7%) |
| 10 to 14 Years | 7 (1.2%) | 23 (5.5%) |
| 15 to 19 Years | 28 (4.7%) | 0 (0.0%) |
| 20 to 24 Years | 59 (9.9%) | 34 (8.2%) |
| 25 to 29 Years | 61 (10.3%) | 30 (7.2%) |
| 30 to 34 Years | 125 (21.0%) | 8 (1.9%) |
| 35 to 39 Years | 22 (3.7%) | 10 (2.4%) |
| 40 to 44 Years | 11 (1.8%) | 20 (4.8%) |
| 45 to 49 Years | 65 (10.9%) | 34 (8.2%) |
| 50 to 54 Years | 0 (0.0%) | 16 (3.8%) |
| 55 to 59 Years | 10 (1.7%) | 52 (12.5%) |
| 60 to 64 Years | 65 (10.9%) | 27 (6.5%) |
| 65 to 69 Years | 71 (11.9%) | 108 (25.9%) |
| 70 to 74 Years | 20 (3.4%) | 27 (6.5%) |
| 75 to 79 Years | 0 (0.0%) | 9 (2.2%) |
| 80 to 84 Years | 9 (1.5%) | 0 (0.0%) |
| 85 Years and over | 9 (1.5%) | 0 (0.0%) |
| Total | 594 (100.0%) | 417 (100.0%) |
Families and Households in Bunnlevel
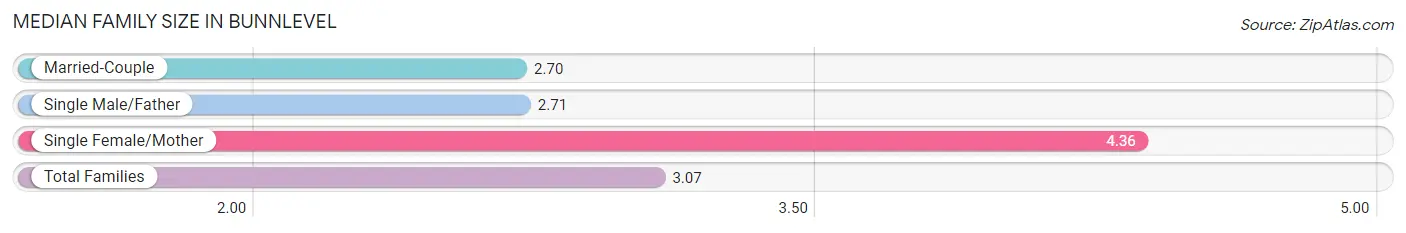
Median Family Size in Bunnlevel
The median family size in Bunnlevel is 3.07 persons per family, with single female/mother families (59 | 21.9%) accounting for the largest median family size of 4.36 persons per family. On the other hand, married-couple families (186 | 69.1%) represent the smallest median family size with 2.70 persons per family.
| Family Type | # Families | Family Size |
| Married-Couple | 186 (69.1%) | 2.70 |
| Single Male/Father | 24 (8.9%) | 2.71 |
| Single Female/Mother | 59 (21.9%) | 4.36 |
| Total Families | 269 (100.0%) | 3.07 |
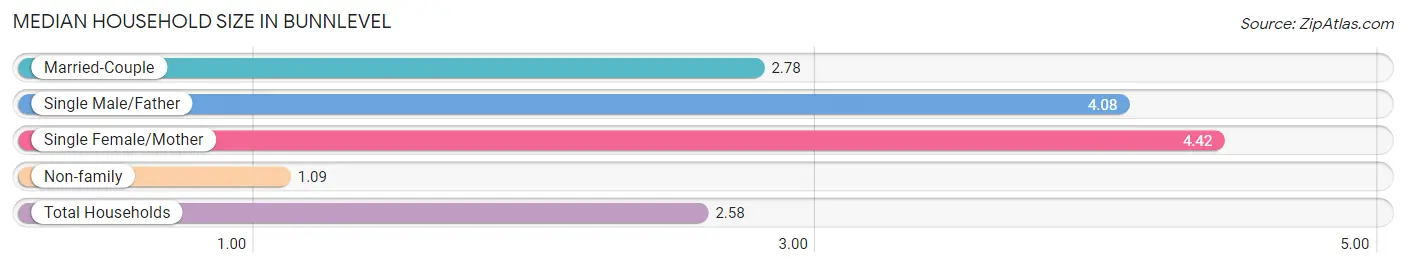
Median Household Size in Bunnlevel
The median household size in Bunnlevel is 2.58 persons per household, with single female/mother households (59 | 15.0%) accounting for the largest median household size of 4.42 persons per household. non-family households (123 | 31.4%) represent the smallest median household size with 1.09 persons per household.
| Household Type | # Households | Household Size |
| Married-Couple | 186 (47.4%) | 2.78 |
| Single Male/Father | 24 (6.1%) | 4.08 |
| Single Female/Mother | 59 (15.0%) | 4.42 |
| Non-family | 123 (31.4%) | 1.09 |
| Total Households | 392 (100.0%) | 2.58 |
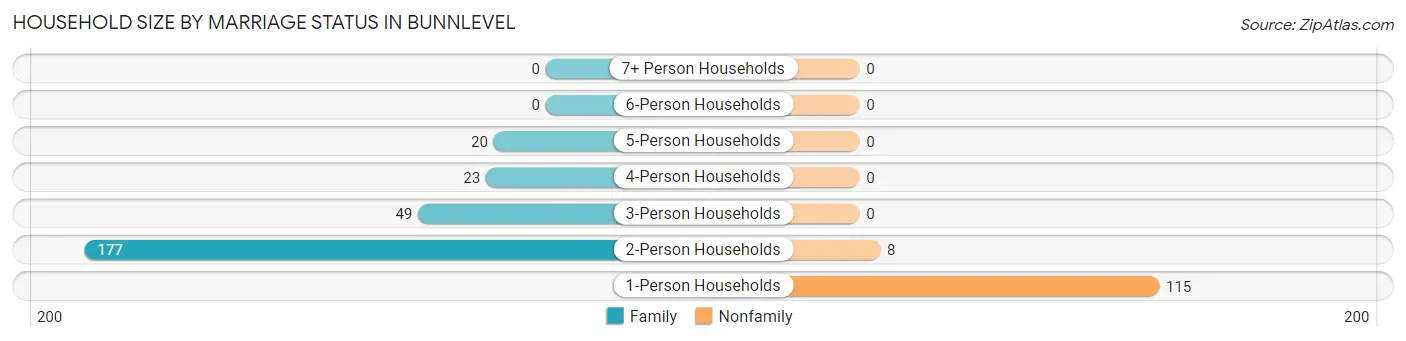
Household Size by Marriage Status in Bunnlevel
Out of a total of 392 households in Bunnlevel, 269 (68.6%) are family households, while 123 (31.4%) are nonfamily households. The most numerous type of family households are 2-person households, comprising 177, and the most common type of nonfamily households are 1-person households, comprising 115.
| Household Size | Family Households | Nonfamily Households |
| 1-Person Households | - | 115 (29.3%) |
| 2-Person Households | 177 (45.2%) | 8 (2.0%) |
| 3-Person Households | 49 (12.5%) | 0 (0.0%) |
| 4-Person Households | 23 (5.9%) | 0 (0.0%) |
| 5-Person Households | 20 (5.1%) | 0 (0.0%) |
| 6-Person Households | 0 (0.0%) | 0 (0.0%) |
| 7+ Person Households | 0 (0.0%) | 0 (0.0%) |
| Total | 269 (68.6%) | 123 (31.4%) |
Female Fertility in Bunnlevel
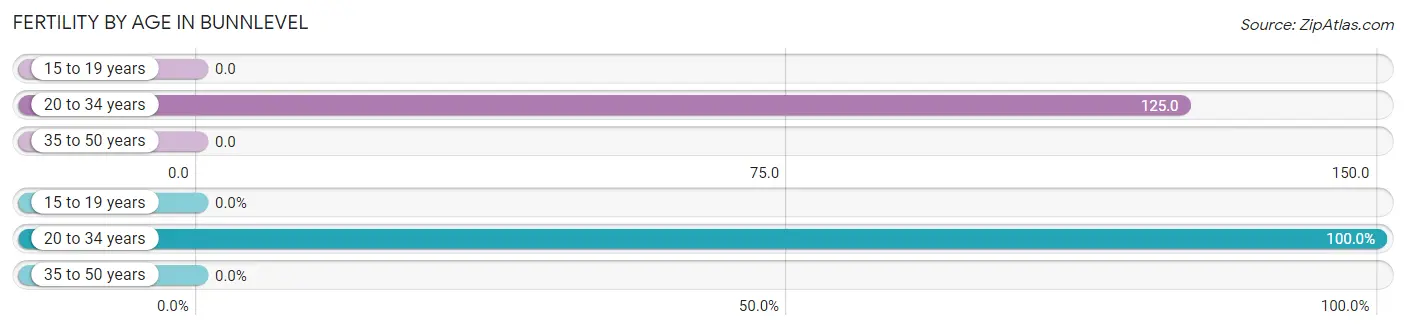
Fertility by Age in Bunnlevel
Average fertility rate in Bunnlevel is 66.0 births per 1,000 women. Women in the age bracket of 20 to 34 years have the highest fertility rate with 125.0 births per 1,000 women. Women in the age bracket of 20 to 34 years acount for 100.0% of all women with births.
| Age Bracket | Women with Births | Births / 1,000 Women |
| 15 to 19 years | 0 (0.0%) | 0.0 |
| 20 to 34 years | 9 (100.0%) | 125.0 |
| 35 to 50 years | 0 (0.0%) | 0.0 |
| Total | 9 (100.0%) | 66.0 |
Fertility by Age by Marriage Status in Bunnlevel
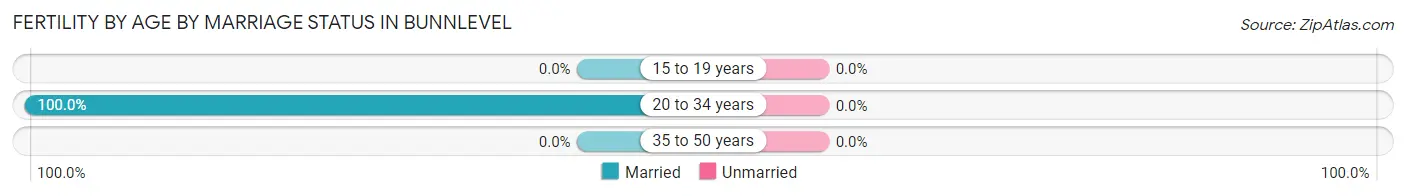
| Age Bracket | Married | Unmarried |
| 15 to 19 years | 0 (0.0%) | 0 (0.0%) |
| 20 to 34 years | 9 (100.0%) | 0 (0.0%) |
| 35 to 50 years | 0 (0.0%) | 0 (0.0%) |
| Total | 9 (100.0%) | 0 (0.0%) |
Fertility by Education in Bunnlevel
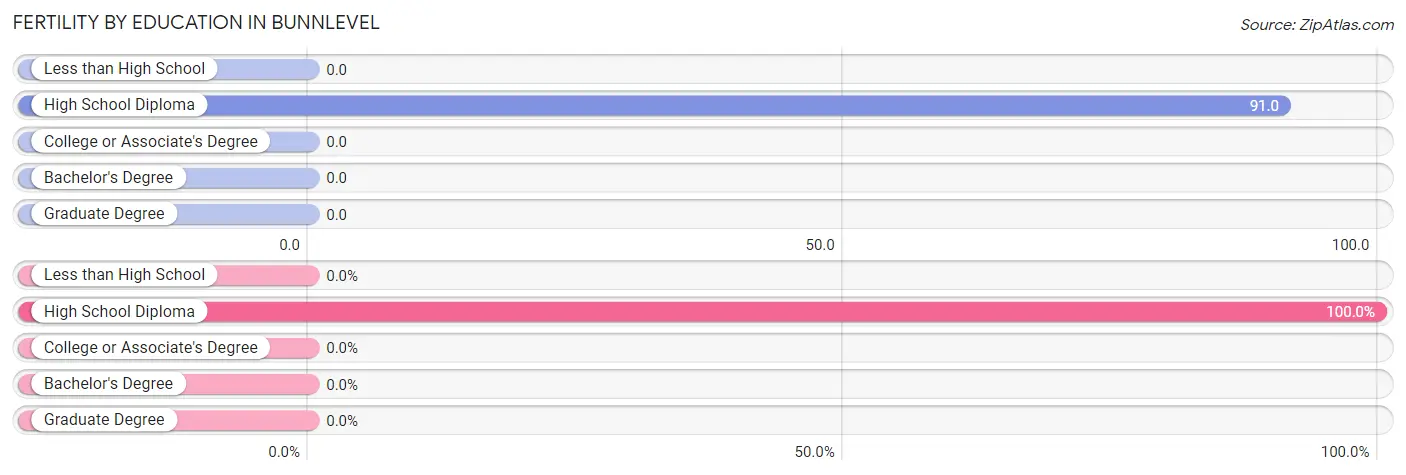
| Educational Attainment | Women with Births | Births / 1,000 Women |
| Less than High School | 0 (0.0%) | 0.0 |
| High School Diploma | 9 (100.0%) | 91.0 |
| College or Associate's Degree | 0 (0.0%) | 0.0 |
| Bachelor's Degree | 0 (0.0%) | 0.0 |
| Graduate Degree | 0 (0.0%) | 0.0 |
| Total | 9 (100.0%) | 66.0 |
Fertility by Education by Marriage Status in Bunnlevel
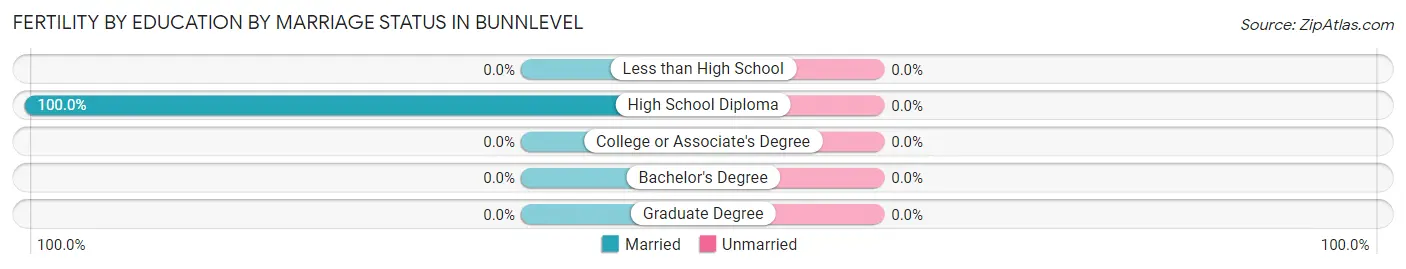
| Educational Attainment | Married | Unmarried |
| Less than High School | 0 (0.0%) | 0 (0.0%) |
| High School Diploma | 9 (100.0%) | 0 (0.0%) |
| College or Associate's Degree | 0 (0.0%) | 0 (0.0%) |
| Bachelor's Degree | 0 (0.0%) | 0 (0.0%) |
| Graduate Degree | 0 (0.0%) | 0 (0.0%) |
| Total | 9 (100.0%) | 0 (0.0%) |
Employment Characteristics in Bunnlevel
Employment by Class of Employer in Bunnlevel
Among the 560 employed individuals in Bunnlevel, private company employees (512 | 91.4%), state government employees (28 | 5.0%), and self-employed (not incorporated) (8 | 1.4%) make up the most common classes of employment.
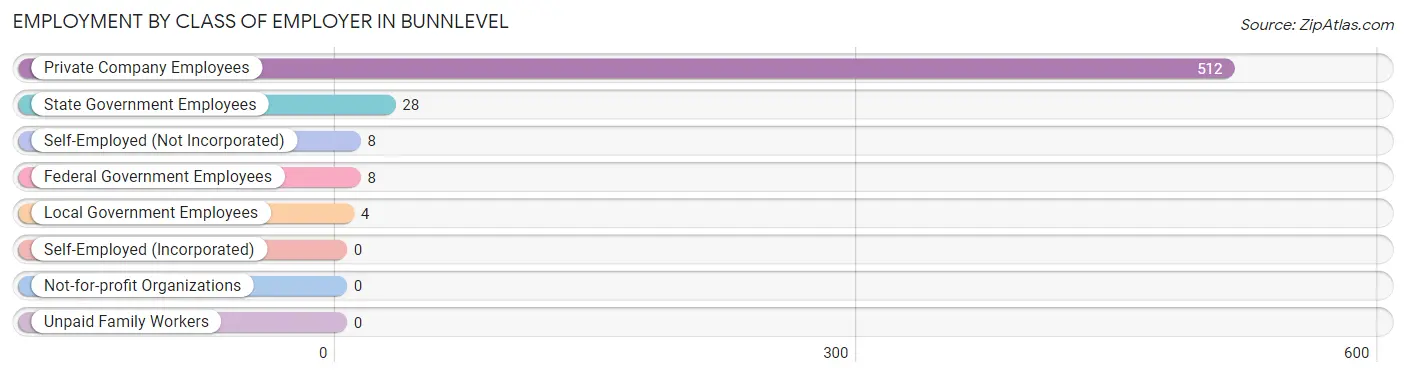
| Employer Class | # Employees | % Employees |
| Private Company Employees | 512 | 91.4% |
| Self-Employed (Incorporated) | 0 | 0.0% |
| Self-Employed (Not Incorporated) | 8 | 1.4% |
| Not-for-profit Organizations | 0 | 0.0% |
| Local Government Employees | 4 | 0.7% |
| State Government Employees | 28 | 5.0% |
| Federal Government Employees | 8 | 1.4% |
| Unpaid Family Workers | 0 | 0.0% |
| Total | 560 | 100.0% |
Employment Status by Age in Bunnlevel
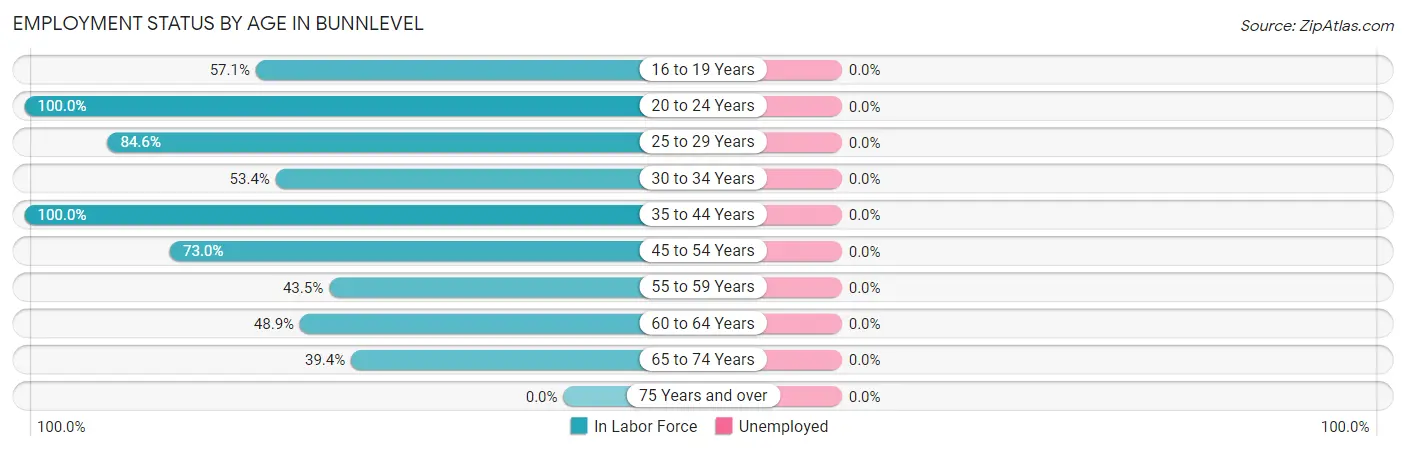
| Age Bracket | In Labor Force | Unemployed |
| 16 to 19 Years | 16 (57.1%) | 0 (0.0%) |
| 20 to 24 Years | 93 (100.0%) | 0 (0.0%) |
| 25 to 29 Years | 77 (84.6%) | 0 (0.0%) |
| 30 to 34 Years | 71 (53.4%) | 0 (0.0%) |
| 35 to 44 Years | 63 (100.0%) | 0 (0.0%) |
| 45 to 54 Years | 84 (73.0%) | 0 (0.0%) |
| 55 to 59 Years | 27 (43.5%) | 0 (0.0%) |
| 60 to 64 Years | 45 (48.9%) | 0 (0.0%) |
| 65 to 74 Years | 89 (39.4%) | 0 (0.0%) |
| 75 Years and over | 0 (0.0%) | 0 (0.0%) |
| Total | 565 (60.8%) | 0 (0.0%) |
Employment Status by Educational Attainment in Bunnlevel
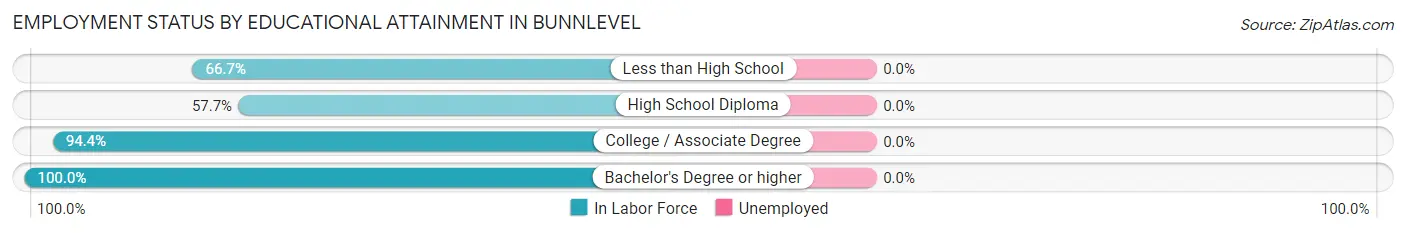
| Educational Attainment | In Labor Force | Unemployed |
| Less than High School | 12 (66.7%) | 0 (0.0%) |
| High School Diploma | 246 (57.7%) | 0 (0.0%) |
| College / Associate Degree | 51 (94.4%) | 0 (0.0%) |
| Bachelor's Degree or higher | 58 (100.0%) | 0 (0.0%) |
| Total | 367 (66.0%) | 0 (0.0%) |
Employment Occupations by Sex in Bunnlevel
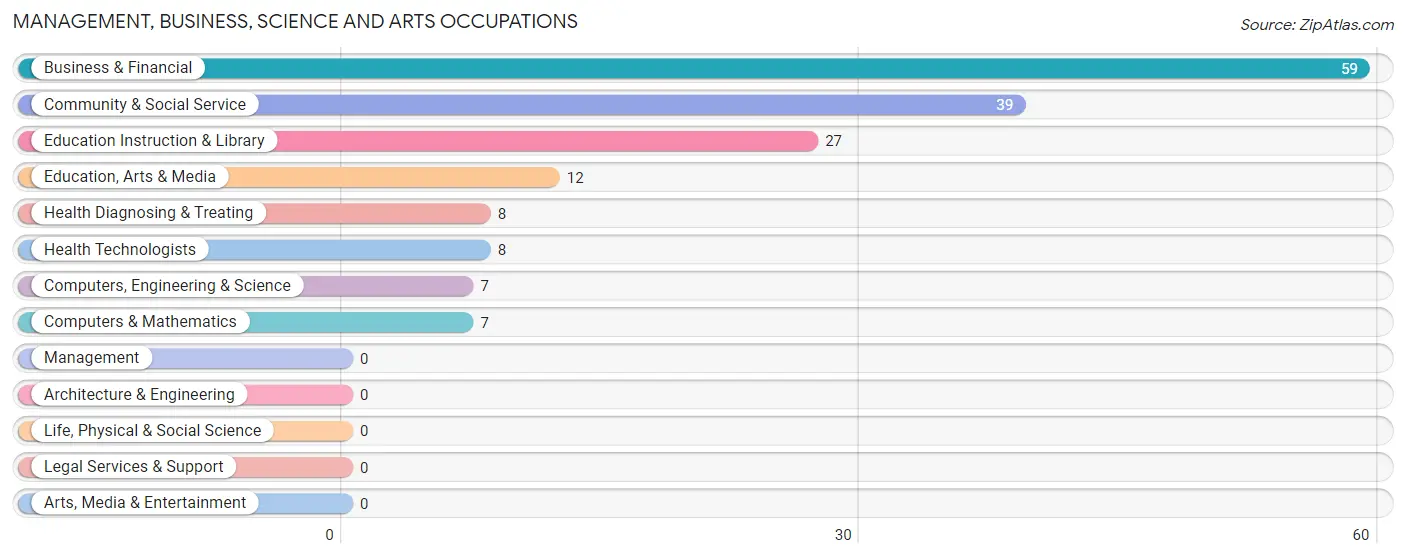
Management, Business, Science and Arts Occupations
The most common Management, Business, Science and Arts occupations in Bunnlevel are Business & Financial (59 | 10.4%), Community & Social Service (39 | 6.9%), Education Instruction & Library (27 | 4.8%), Education, Arts & Media (12 | 2.1%), and Health Diagnosing & Treating (8 | 1.4%).
Management, Business, Science and Arts Occupations by Sex
Within the Management, Business, Science and Arts occupations in Bunnlevel, the most male-oriented occupations are Computers, Engineering & Science (100.0%), and Computers & Mathematics (100.0%), while the most female-oriented occupations are Business & Financial (100.0%), Community & Social Service (100.0%), and Education, Arts & Media (100.0%).
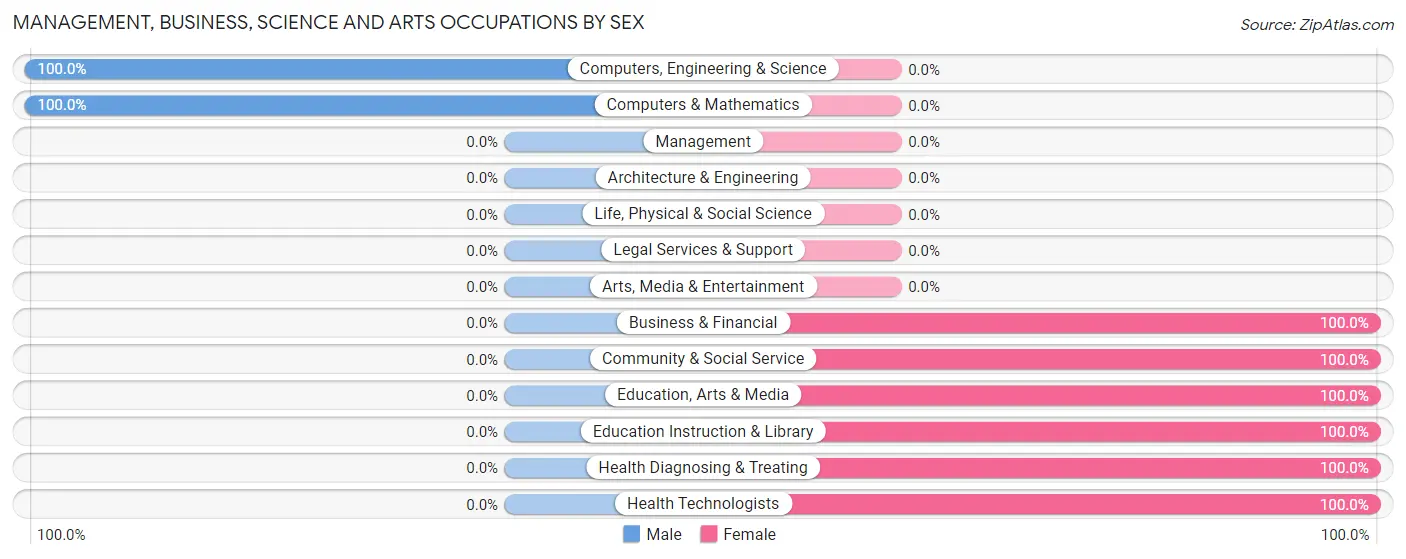
| Occupation | Male | Female |
| Management | 0 (0.0%) | 0 (0.0%) |
| Business & Financial | 0 (0.0%) | 59 (100.0%) |
| Computers, Engineering & Science | 7 (100.0%) | 0 (0.0%) |
| Computers & Mathematics | 7 (100.0%) | 0 (0.0%) |
| Architecture & Engineering | 0 (0.0%) | 0 (0.0%) |
| Life, Physical & Social Science | 0 (0.0%) | 0 (0.0%) |
| Community & Social Service | 0 (0.0%) | 39 (100.0%) |
| Education, Arts & Media | 0 (0.0%) | 12 (100.0%) |
| Legal Services & Support | 0 (0.0%) | 0 (0.0%) |
| Education Instruction & Library | 0 (0.0%) | 27 (100.0%) |
| Arts, Media & Entertainment | 0 (0.0%) | 0 (0.0%) |
| Health Diagnosing & Treating | 0 (0.0%) | 8 (100.0%) |
| Health Technologists | 0 (0.0%) | 8 (100.0%) |
| Total (Category) | 7 (6.2%) | 106 (93.8%) |
| Total (Overall) | 338 (59.8%) | 227 (40.2%) |
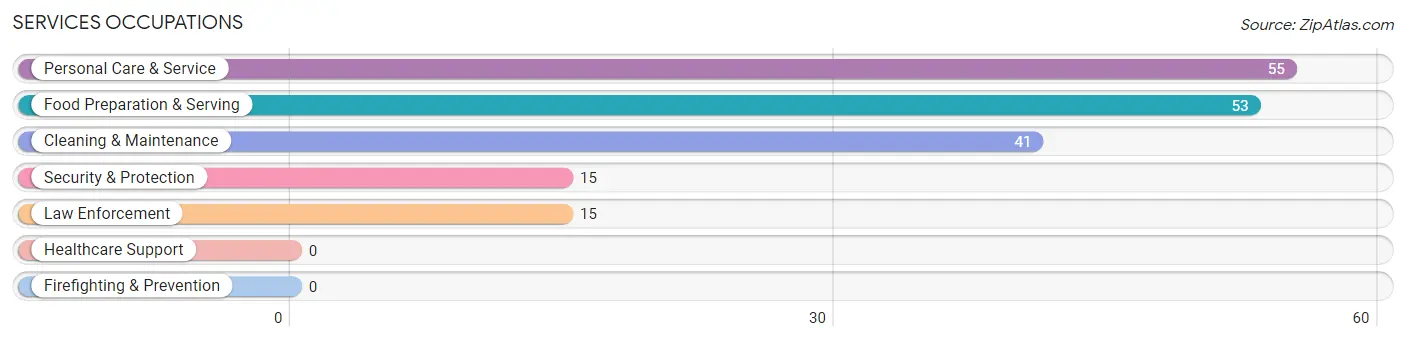
Services Occupations
The most common Services occupations in Bunnlevel are Personal Care & Service (55 | 9.7%), Food Preparation & Serving (53 | 9.4%), Cleaning & Maintenance (41 | 7.3%), Security & Protection (15 | 2.6%), and Law Enforcement (15 | 2.6%).
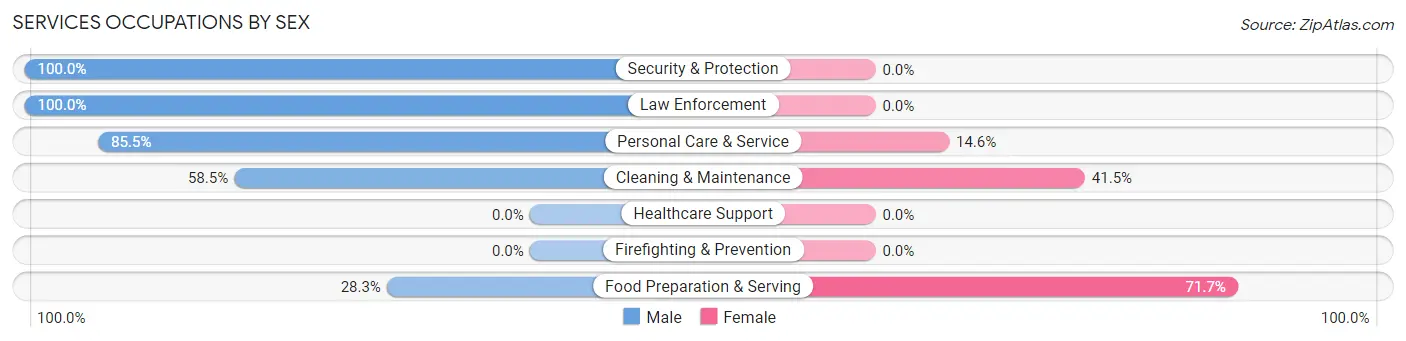
Services Occupations by Sex
Within the Services occupations in Bunnlevel, the most male-oriented occupations are Security & Protection (100.0%), Law Enforcement (100.0%), and Personal Care & Service (85.5%), while the most female-oriented occupations are Food Preparation & Serving (71.7%), Cleaning & Maintenance (41.5%), and Personal Care & Service (14.5%).
| Occupation | Male | Female |
| Healthcare Support | 0 (0.0%) | 0 (0.0%) |
| Security & Protection | 15 (100.0%) | 0 (0.0%) |
| Firefighting & Prevention | 0 (0.0%) | 0 (0.0%) |
| Law Enforcement | 15 (100.0%) | 0 (0.0%) |
| Food Preparation & Serving | 15 (28.3%) | 38 (71.7%) |
| Cleaning & Maintenance | 24 (58.5%) | 17 (41.5%) |
| Personal Care & Service | 47 (85.5%) | 8 (14.5%) |
| Total (Category) | 101 (61.6%) | 63 (38.4%) |
| Total (Overall) | 338 (59.8%) | 227 (40.2%) |
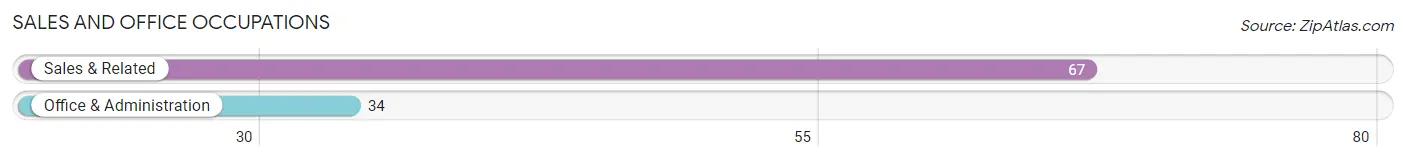
Sales and Office Occupations
The most common Sales and Office occupations in Bunnlevel are Sales & Related (67 | 11.9%), and Office & Administration (34 | 6.0%).
Sales and Office Occupations by Sex
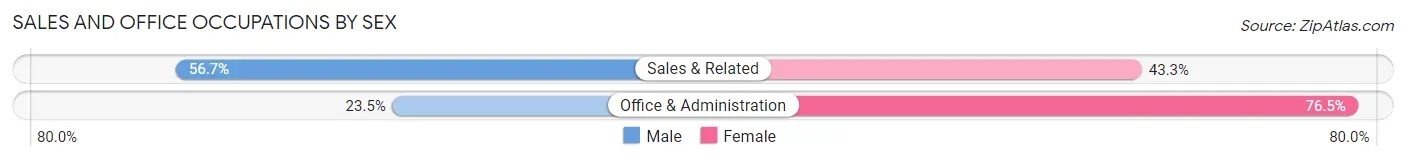
| Occupation | Male | Female |
| Sales & Related | 38 (56.7%) | 29 (43.3%) |
| Office & Administration | 8 (23.5%) | 26 (76.5%) |
| Total (Category) | 46 (45.5%) | 55 (54.5%) |
| Total (Overall) | 338 (59.8%) | 227 (40.2%) |
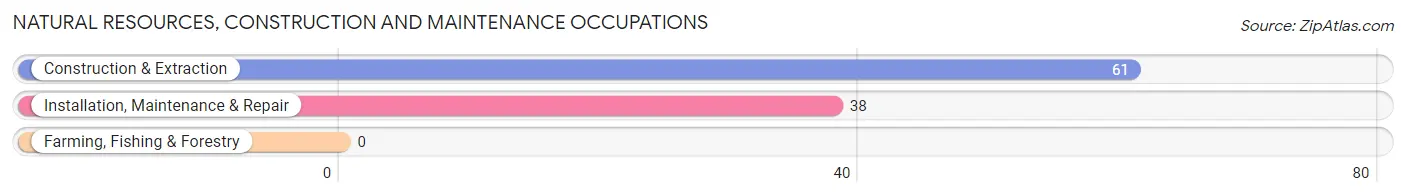
Natural Resources, Construction and Maintenance Occupations
The most common Natural Resources, Construction and Maintenance occupations in Bunnlevel are Construction & Extraction (61 | 10.8%), and Installation, Maintenance & Repair (38 | 6.7%).
Natural Resources, Construction and Maintenance Occupations by Sex
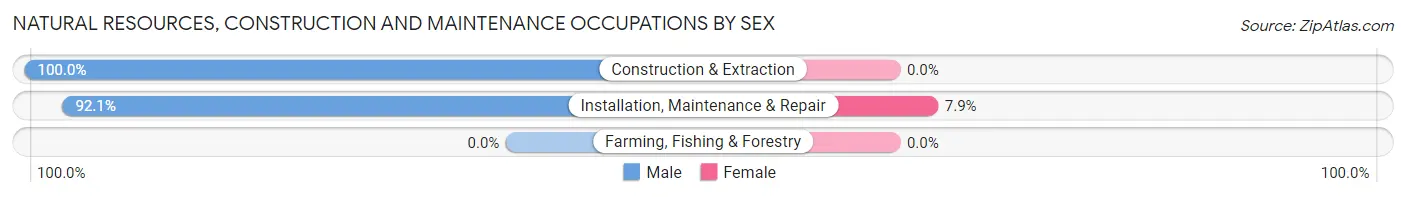
| Occupation | Male | Female |
| Farming, Fishing & Forestry | 0 (0.0%) | 0 (0.0%) |
| Construction & Extraction | 61 (100.0%) | 0 (0.0%) |
| Installation, Maintenance & Repair | 35 (92.1%) | 3 (7.9%) |
| Total (Category) | 96 (97.0%) | 3 (3.0%) |
| Total (Overall) | 338 (59.8%) | 227 (40.2%) |
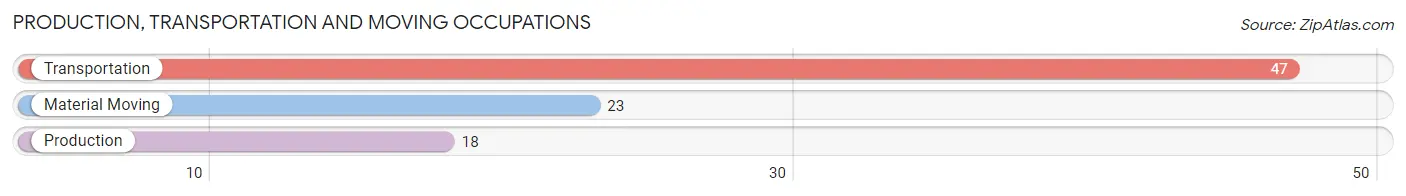
Production, Transportation and Moving Occupations
The most common Production, Transportation and Moving occupations in Bunnlevel are Transportation (47 | 8.3%), Material Moving (23 | 4.1%), and Production (18 | 3.2%).
Production, Transportation and Moving Occupations by Sex
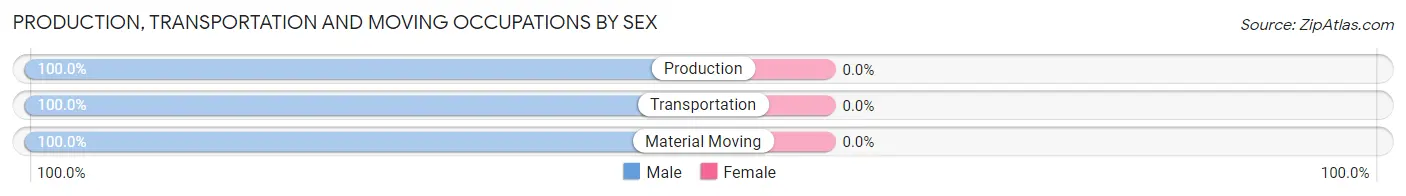
| Occupation | Male | Female |
| Production | 18 (100.0%) | 0 (0.0%) |
| Transportation | 47 (100.0%) | 0 (0.0%) |
| Material Moving | 23 (100.0%) | 0 (0.0%) |
| Total (Category) | 88 (100.0%) | 0 (0.0%) |
| Total (Overall) | 338 (59.8%) | 227 (40.2%) |
Employment Industries by Sex in Bunnlevel
Employment Industries in Bunnlevel
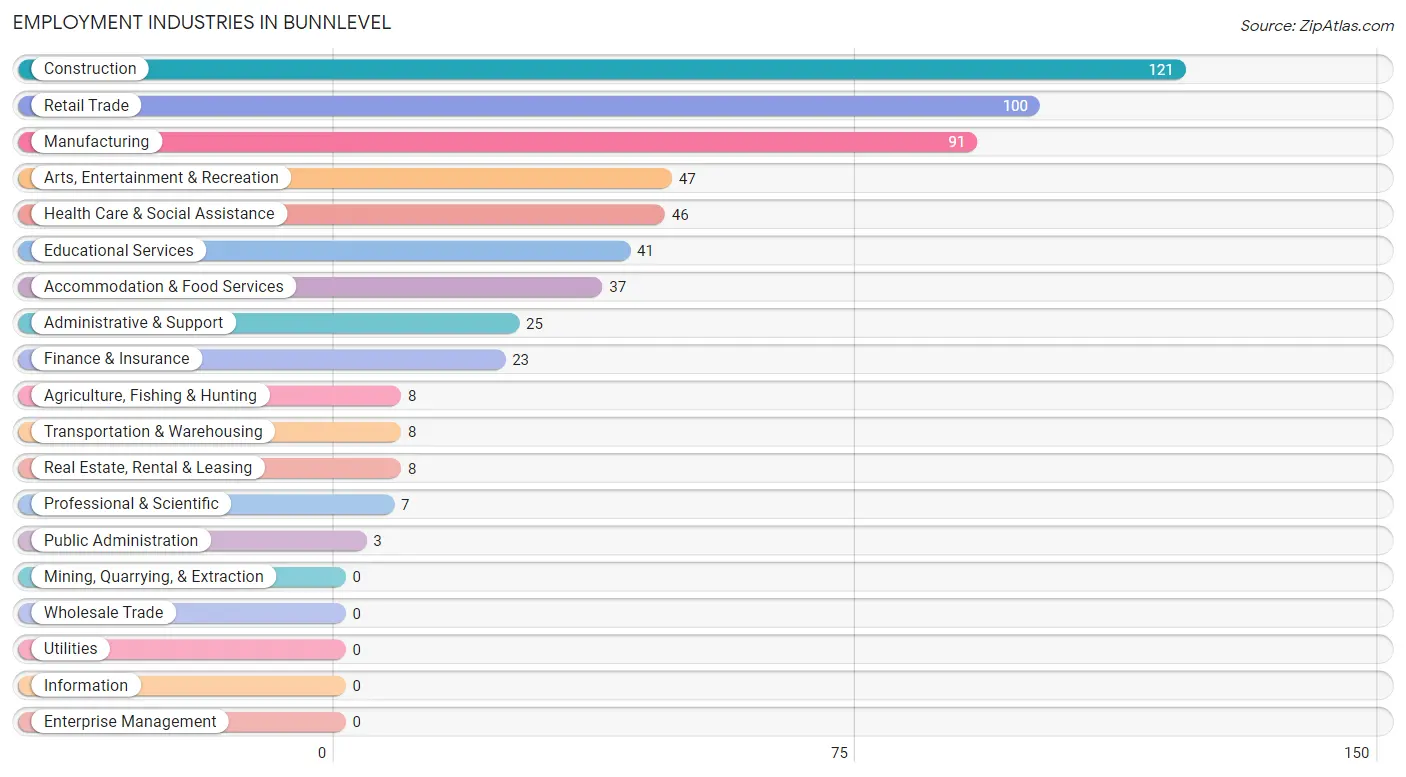
The major employment industries in Bunnlevel include Construction (121 | 21.4%), Retail Trade (100 | 17.7%), Manufacturing (91 | 16.1%), Arts, Entertainment & Recreation (47 | 8.3%), and Health Care & Social Assistance (46 | 8.1%).
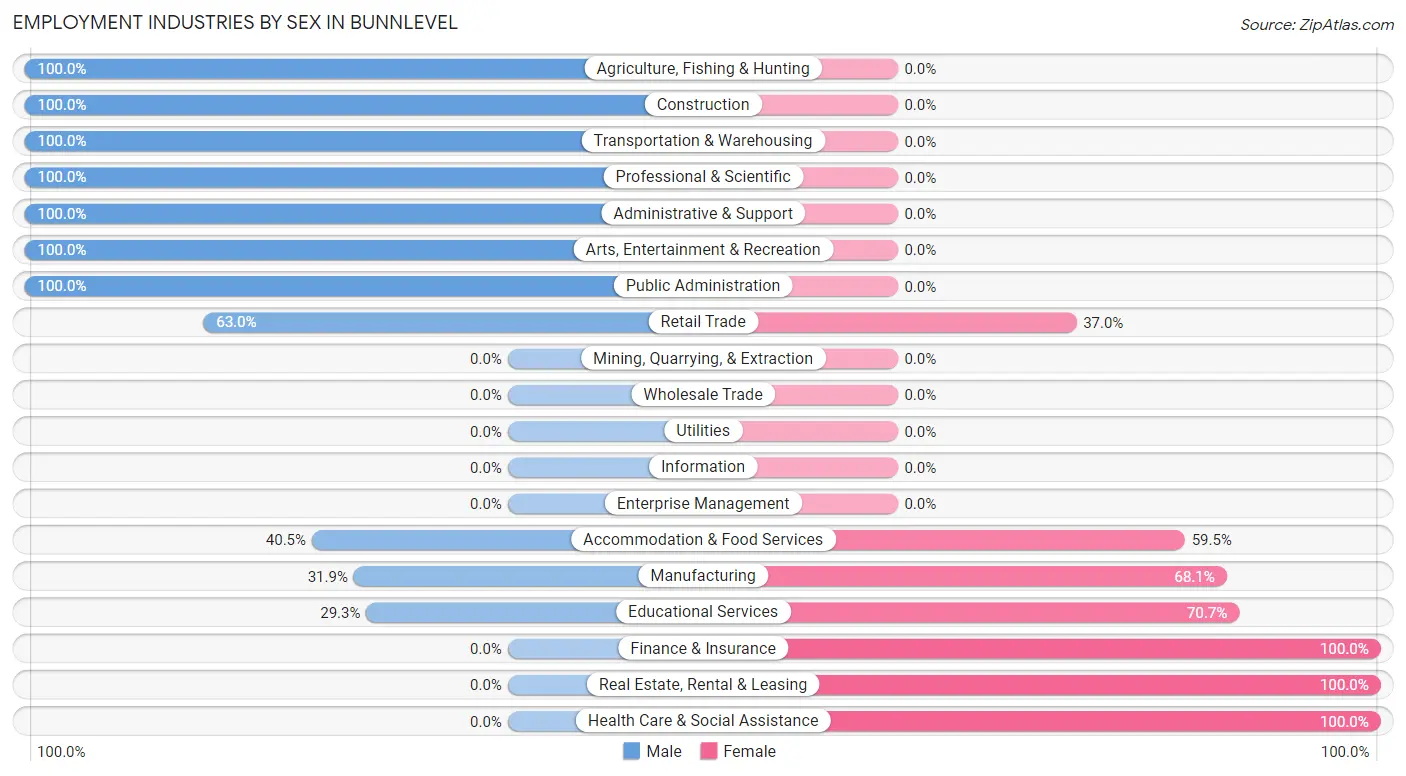
Employment Industries by Sex in Bunnlevel
The Bunnlevel industries that see more men than women are Agriculture, Fishing & Hunting (100.0%), Construction (100.0%), and Transportation & Warehousing (100.0%), whereas the industries that tend to have a higher number of women are Finance & Insurance (100.0%), Real Estate, Rental & Leasing (100.0%), and Health Care & Social Assistance (100.0%).
| Industry | Male | Female |
| Agriculture, Fishing & Hunting | 8 (100.0%) | 0 (0.0%) |
| Mining, Quarrying, & Extraction | 0 (0.0%) | 0 (0.0%) |
| Construction | 121 (100.0%) | 0 (0.0%) |
| Manufacturing | 29 (31.9%) | 62 (68.1%) |
| Wholesale Trade | 0 (0.0%) | 0 (0.0%) |
| Retail Trade | 63 (63.0%) | 37 (37.0%) |
| Transportation & Warehousing | 8 (100.0%) | 0 (0.0%) |
| Utilities | 0 (0.0%) | 0 (0.0%) |
| Information | 0 (0.0%) | 0 (0.0%) |
| Finance & Insurance | 0 (0.0%) | 23 (100.0%) |
| Real Estate, Rental & Leasing | 0 (0.0%) | 8 (100.0%) |
| Professional & Scientific | 7 (100.0%) | 0 (0.0%) |
| Enterprise Management | 0 (0.0%) | 0 (0.0%) |
| Administrative & Support | 25 (100.0%) | 0 (0.0%) |
| Educational Services | 12 (29.3%) | 29 (70.7%) |
| Health Care & Social Assistance | 0 (0.0%) | 46 (100.0%) |
| Arts, Entertainment & Recreation | 47 (100.0%) | 0 (0.0%) |
| Accommodation & Food Services | 15 (40.5%) | 22 (59.5%) |
| Public Administration | 3 (100.0%) | 0 (0.0%) |
| Total | 338 (59.8%) | 227 (40.2%) |
Education in Bunnlevel
School Enrollment in Bunnlevel
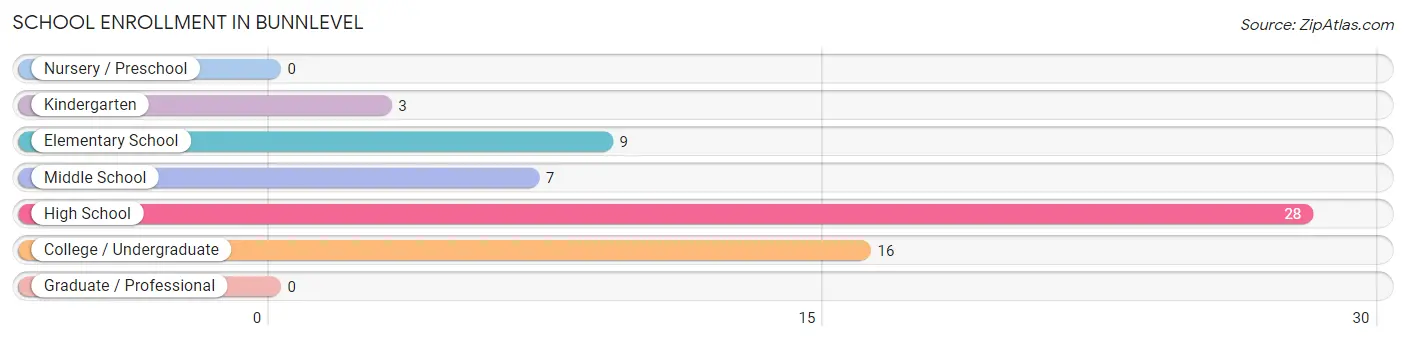
The most common levels of schooling among the 63 students in Bunnlevel are high school (28 | 44.4%), college / undergraduate (16 | 25.4%), and elementary school (9 | 14.3%).
| School Level | # Students | % Students |
| Nursery / Preschool | 0 | 0.0% |
| Kindergarten | 3 | 4.8% |
| Elementary School | 9 | 14.3% |
| Middle School | 7 | 11.1% |
| High School | 28 | 44.4% |
| College / Undergraduate | 16 | 25.4% |
| Graduate / Professional | 0 | 0.0% |
| Total | 63 | 100.0% |
School Enrollment by Age by Funding Source in Bunnlevel
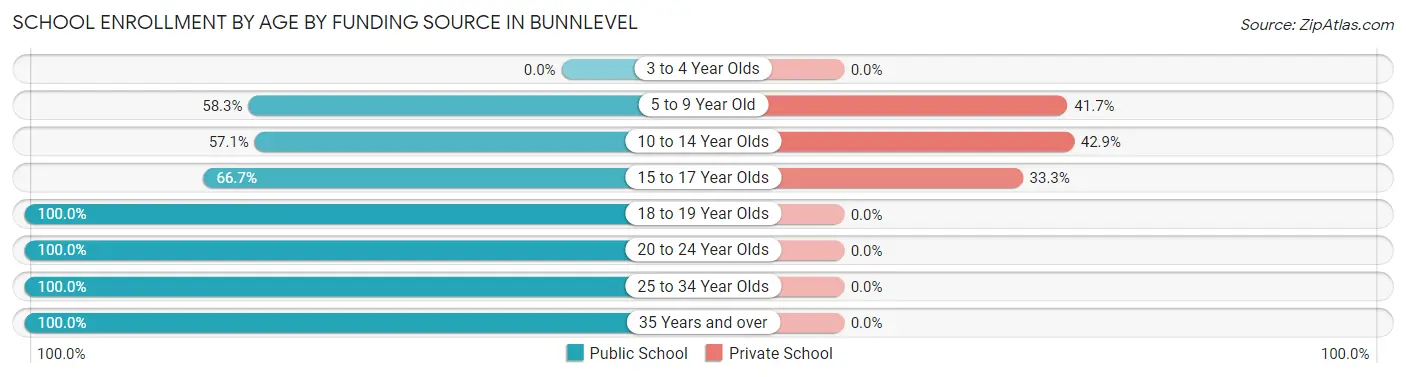
Out of a total of 63 students who are enrolled in schools in Bunnlevel, 12 (19.0%) attend a private institution, while the remaining 51 (81.0%) are enrolled in public schools. The age group of 10 to 14 year olds has the highest likelihood of being enrolled in private schools, with 3 (42.9% in the age bracket) enrolled. Conversely, the age group of 18 to 19 year olds has the lowest likelihood of being enrolled in a private school, with 16 (100.0% in the age bracket) attending a public institution.
| Age Bracket | Public School | Private School |
| 3 to 4 Year Olds | 0 (0.0%) | 0 (0.0%) |
| 5 to 9 Year Old | 7 (58.3%) | 5 (41.7%) |
| 10 to 14 Year Olds | 4 (57.1%) | 3 (42.9%) |
| 15 to 17 Year Olds | 8 (66.7%) | 4 (33.3%) |
| 18 to 19 Year Olds | 16 (100.0%) | 0 (0.0%) |
| 20 to 24 Year Olds | 4 (100.0%) | 0 (0.0%) |
| 25 to 34 Year Olds | 5 (100.0%) | 0 (0.0%) |
| 35 Years and over | 7 (100.0%) | 0 (0.0%) |
| Total | 51 (81.0%) | 12 (19.0%) |
Educational Attainment by Field of Study in Bunnlevel
Business (34 | 50.7%), arts & humanities (12 | 17.9%), bio, nature & agricultural (9 | 13.4%), science & technology (8 | 11.9%), and psychology (4 | 6.0%) are the most common fields of study among 67 individuals in Bunnlevel who have obtained a bachelor's degree or higher.
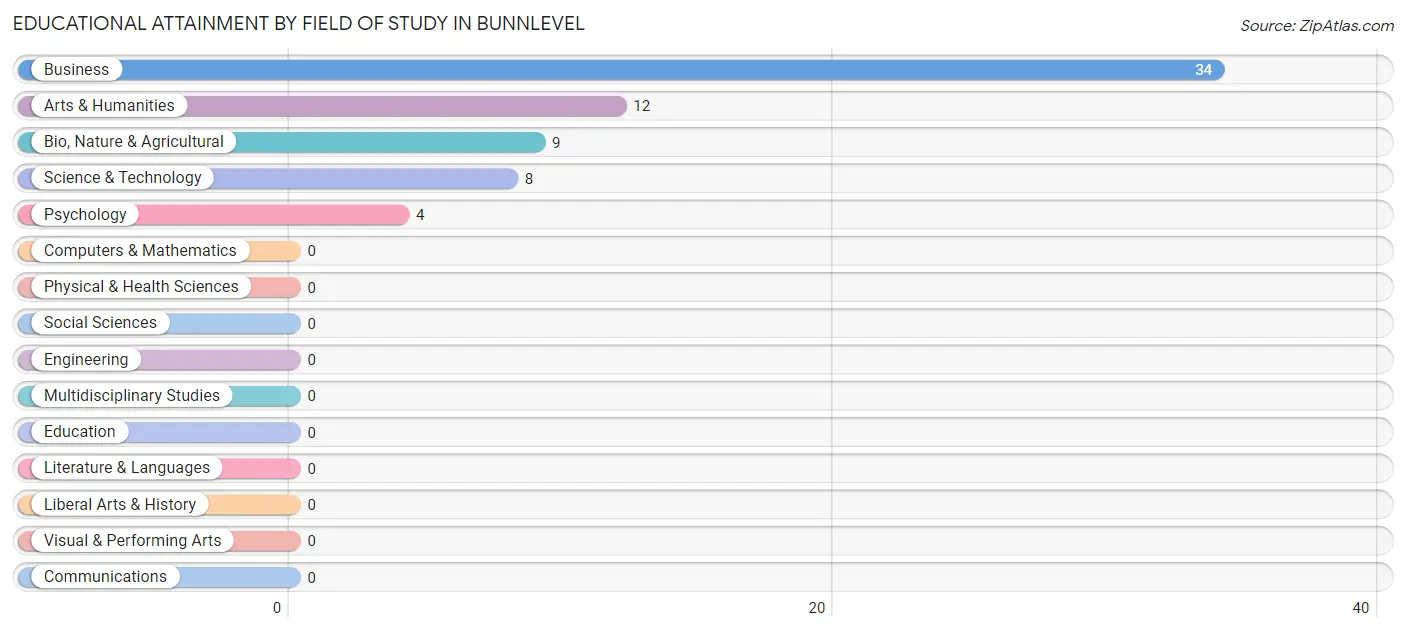
| Field of Study | # Graduates | % Graduates |
| Computers & Mathematics | 0 | 0.0% |
| Bio, Nature & Agricultural | 9 | 13.4% |
| Physical & Health Sciences | 0 | 0.0% |
| Psychology | 4 | 6.0% |
| Social Sciences | 0 | 0.0% |
| Engineering | 0 | 0.0% |
| Multidisciplinary Studies | 0 | 0.0% |
| Science & Technology | 8 | 11.9% |
| Business | 34 | 50.7% |
| Education | 0 | 0.0% |
| Literature & Languages | 0 | 0.0% |
| Liberal Arts & History | 0 | 0.0% |
| Visual & Performing Arts | 0 | 0.0% |
| Communications | 0 | 0.0% |
| Arts & Humanities | 12 | 17.9% |
| Total | 67 | 100.0% |
Transportation & Commute in Bunnlevel
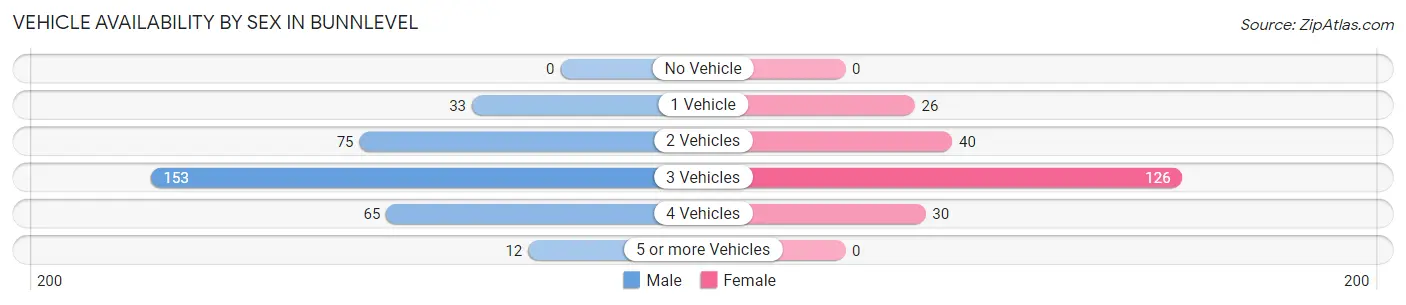
Vehicle Availability by Sex in Bunnlevel
The most prevalent vehicle ownership categories in Bunnlevel are males with 3 vehicles (153, accounting for 45.3%) and females with 3 vehicles (126, making up 68.9%).
| Vehicles Available | Male | Female |
| No Vehicle | 0 (0.0%) | 0 (0.0%) |
| 1 Vehicle | 33 (9.8%) | 26 (11.7%) |
| 2 Vehicles | 75 (22.2%) | 40 (18.0%) |
| 3 Vehicles | 153 (45.3%) | 126 (56.8%) |
| 4 Vehicles | 65 (19.2%) | 30 (13.5%) |
| 5 or more Vehicles | 12 (3.5%) | 0 (0.0%) |
| Total | 338 (100.0%) | 222 (100.0%) |
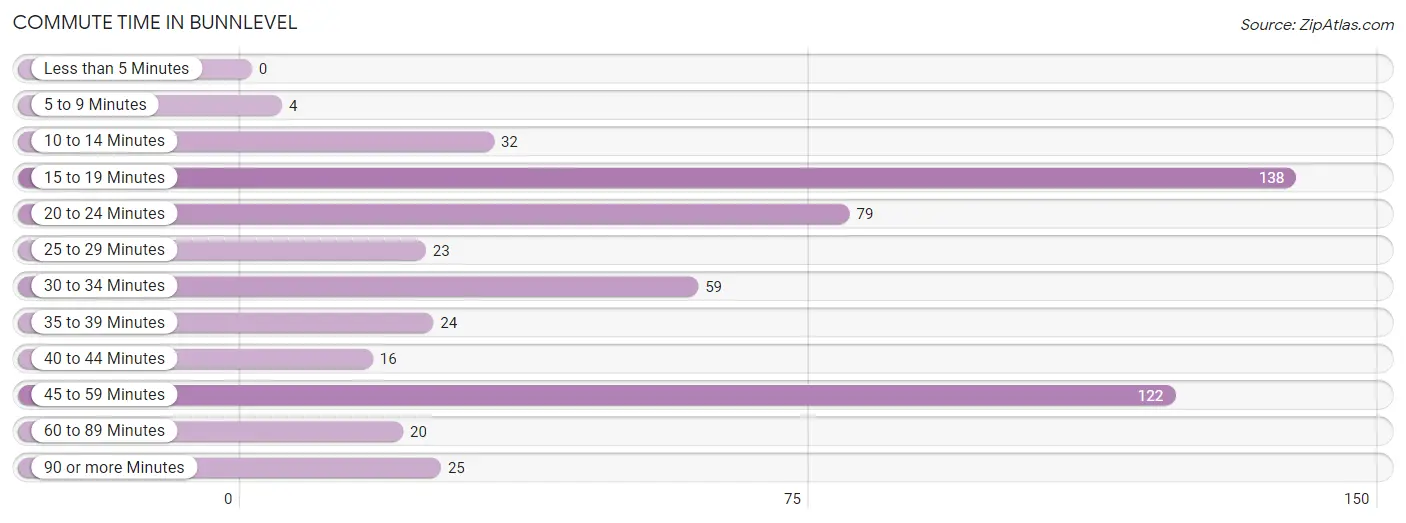
Commute Time in Bunnlevel
The most frequently occuring commute durations in Bunnlevel are 15 to 19 minutes (138 commuters, 25.5%), 45 to 59 minutes (122 commuters, 22.5%), and 20 to 24 minutes (79 commuters, 14.6%).
| Commute Time | # Commuters | % Commuters |
| Less than 5 Minutes | 0 | 0.0% |
| 5 to 9 Minutes | 4 | 0.7% |
| 10 to 14 Minutes | 32 | 5.9% |
| 15 to 19 Minutes | 138 | 25.5% |
| 20 to 24 Minutes | 79 | 14.6% |
| 25 to 29 Minutes | 23 | 4.2% |
| 30 to 34 Minutes | 59 | 10.9% |
| 35 to 39 Minutes | 24 | 4.4% |
| 40 to 44 Minutes | 16 | 2.9% |
| 45 to 59 Minutes | 122 | 22.5% |
| 60 to 89 Minutes | 20 | 3.7% |
| 90 or more Minutes | 25 | 4.6% |
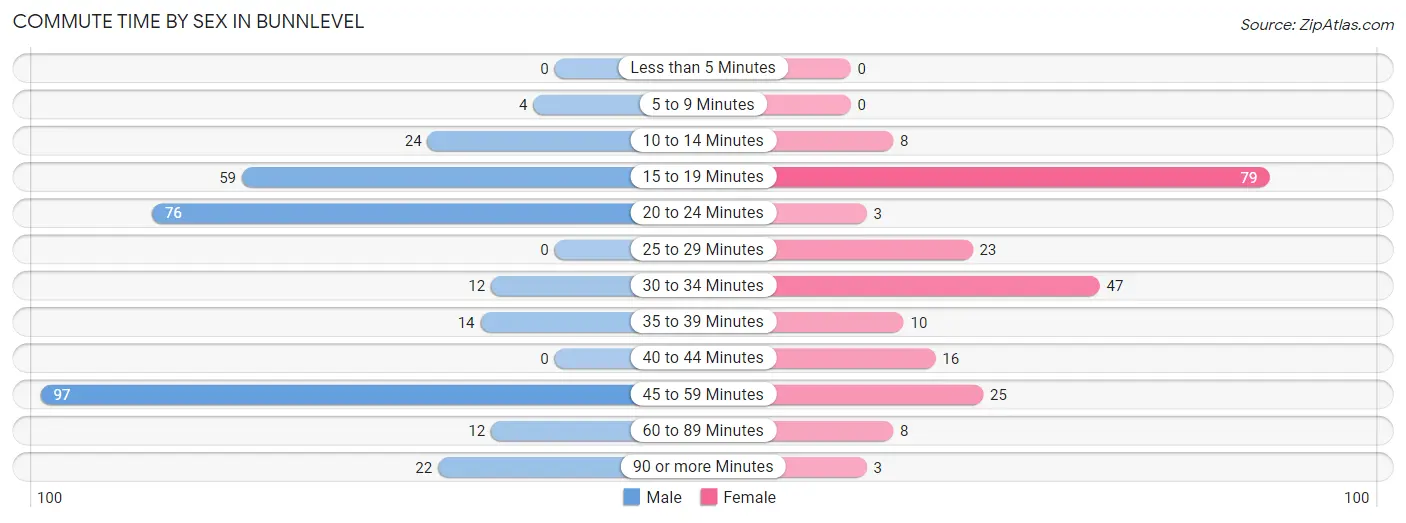
Commute Time by Sex in Bunnlevel
The most common commute times in Bunnlevel are 45 to 59 minutes (97 commuters, 30.3%) for males and 15 to 19 minutes (79 commuters, 35.6%) for females.
| Commute Time | Male | Female |
| Less than 5 Minutes | 0 (0.0%) | 0 (0.0%) |
| 5 to 9 Minutes | 4 (1.3%) | 0 (0.0%) |
| 10 to 14 Minutes | 24 (7.5%) | 8 (3.6%) |
| 15 to 19 Minutes | 59 (18.4%) | 79 (35.6%) |
| 20 to 24 Minutes | 76 (23.7%) | 3 (1.3%) |
| 25 to 29 Minutes | 0 (0.0%) | 23 (10.4%) |
| 30 to 34 Minutes | 12 (3.7%) | 47 (21.2%) |
| 35 to 39 Minutes | 14 (4.4%) | 10 (4.5%) |
| 40 to 44 Minutes | 0 (0.0%) | 16 (7.2%) |
| 45 to 59 Minutes | 97 (30.3%) | 25 (11.3%) |
| 60 to 89 Minutes | 12 (3.7%) | 8 (3.6%) |
| 90 or more Minutes | 22 (6.9%) | 3 (1.3%) |
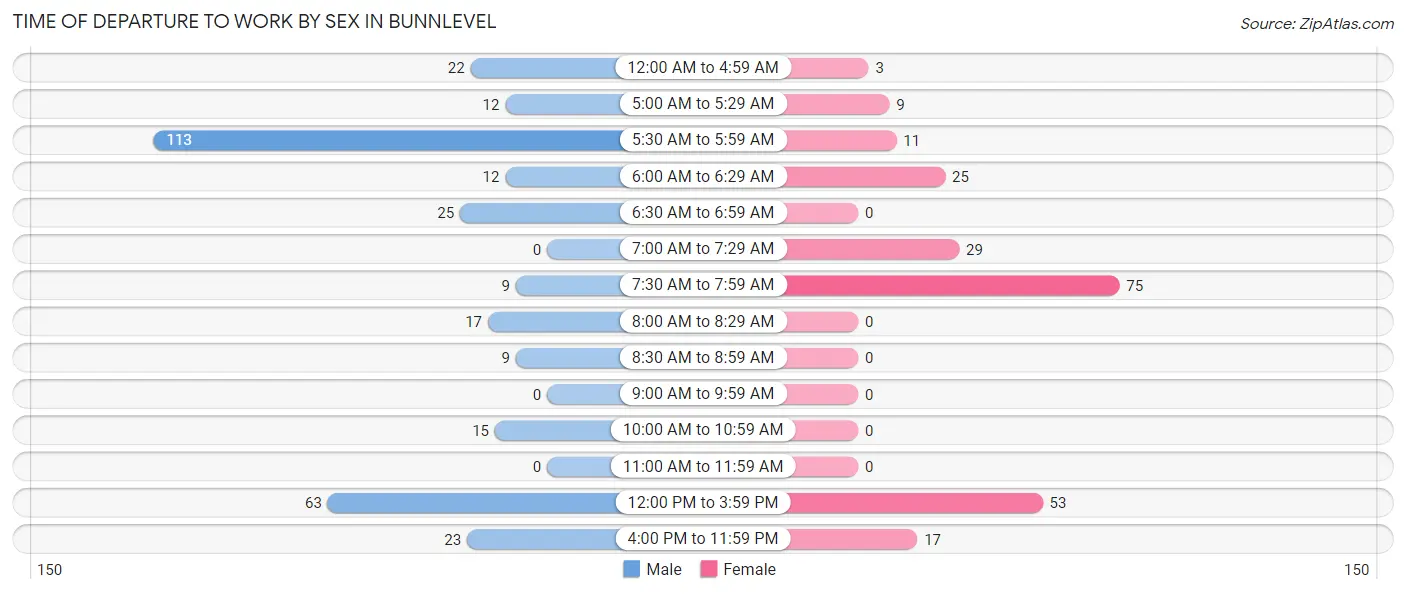
Time of Departure to Work by Sex in Bunnlevel
The most frequent times of departure to work in Bunnlevel are 5:30 AM to 5:59 AM (113, 35.3%) for males and 7:30 AM to 7:59 AM (75, 33.8%) for females.
| Time of Departure | Male | Female |
| 12:00 AM to 4:59 AM | 22 (6.9%) | 3 (1.3%) |
| 5:00 AM to 5:29 AM | 12 (3.7%) | 9 (4.1%) |
| 5:30 AM to 5:59 AM | 113 (35.3%) | 11 (5.0%) |
| 6:00 AM to 6:29 AM | 12 (3.7%) | 25 (11.3%) |
| 6:30 AM to 6:59 AM | 25 (7.8%) | 0 (0.0%) |
| 7:00 AM to 7:29 AM | 0 (0.0%) | 29 (13.1%) |
| 7:30 AM to 7:59 AM | 9 (2.8%) | 75 (33.8%) |
| 8:00 AM to 8:29 AM | 17 (5.3%) | 0 (0.0%) |
| 8:30 AM to 8:59 AM | 9 (2.8%) | 0 (0.0%) |
| 9:00 AM to 9:59 AM | 0 (0.0%) | 0 (0.0%) |
| 10:00 AM to 10:59 AM | 15 (4.7%) | 0 (0.0%) |
| 11:00 AM to 11:59 AM | 0 (0.0%) | 0 (0.0%) |
| 12:00 PM to 3:59 PM | 63 (19.7%) | 53 (23.9%) |
| 4:00 PM to 11:59 PM | 23 (7.2%) | 17 (7.7%) |
| Total | 320 (100.0%) | 222 (100.0%) |
Housing Occupancy in Bunnlevel
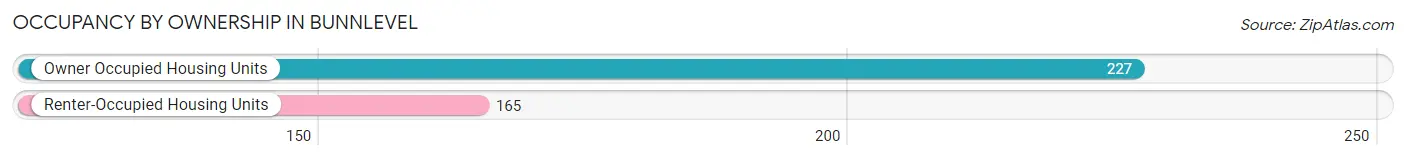
Occupancy by Ownership in Bunnlevel
Of the total 392 dwellings in Bunnlevel, owner-occupied units account for 227 (57.9%), while renter-occupied units make up 165 (42.1%).
| Occupancy | # Housing Units | % Housing Units |
| Owner Occupied Housing Units | 227 | 57.9% |
| Renter-Occupied Housing Units | 165 | 42.1% |
| Total Occupied Housing Units | 392 | 100.0% |
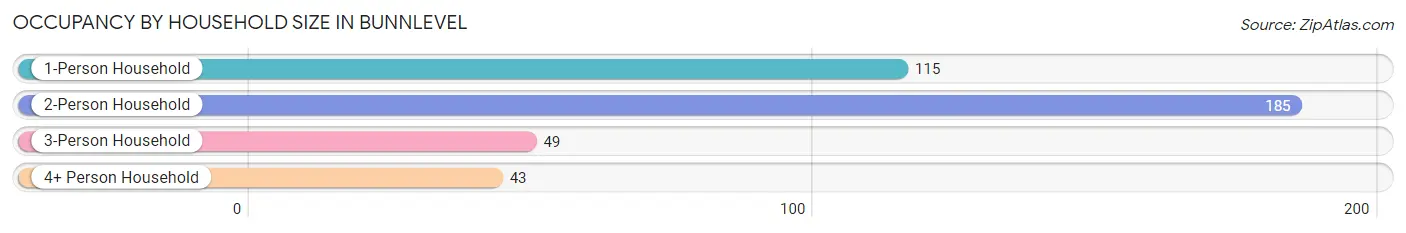
Occupancy by Household Size in Bunnlevel
| Household Size | # Housing Units | % Housing Units |
| 1-Person Household | 115 | 29.3% |
| 2-Person Household | 185 | 47.2% |
| 3-Person Household | 49 | 12.5% |
| 4+ Person Household | 43 | 11.0% |
| Total Housing Units | 392 | 100.0% |
Occupancy by Ownership by Household Size in Bunnlevel
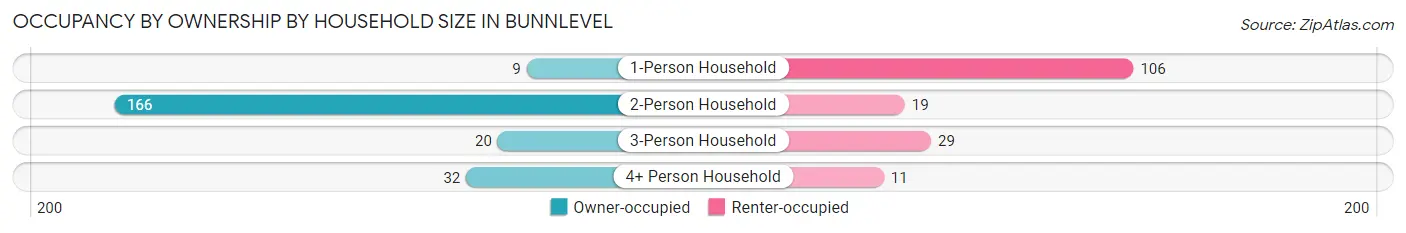
| Household Size | Owner-occupied | Renter-occupied |
| 1-Person Household | 9 (7.8%) | 106 (92.2%) |
| 2-Person Household | 166 (89.7%) | 19 (10.3%) |
| 3-Person Household | 20 (40.8%) | 29 (59.2%) |
| 4+ Person Household | 32 (74.4%) | 11 (25.6%) |
| Total Housing Units | 227 (57.9%) | 165 (42.1%) |
Occupancy by Educational Attainment in Bunnlevel
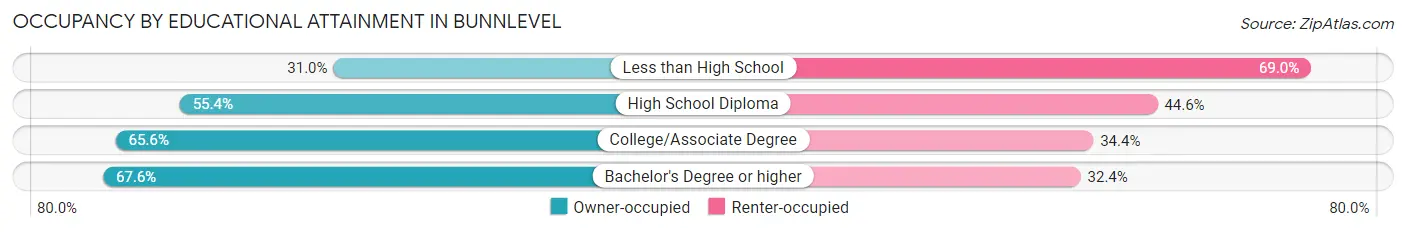
| Household Size | Owner-occupied | Renter-occupied |
| Less than High School | 9 (31.0%) | 20 (69.0%) |
| High School Diploma | 113 (55.4%) | 91 (44.6%) |
| College/Associate Degree | 80 (65.6%) | 42 (34.4%) |
| Bachelor's Degree or higher | 25 (67.6%) | 12 (32.4%) |
Occupancy by Age of Householder in Bunnlevel
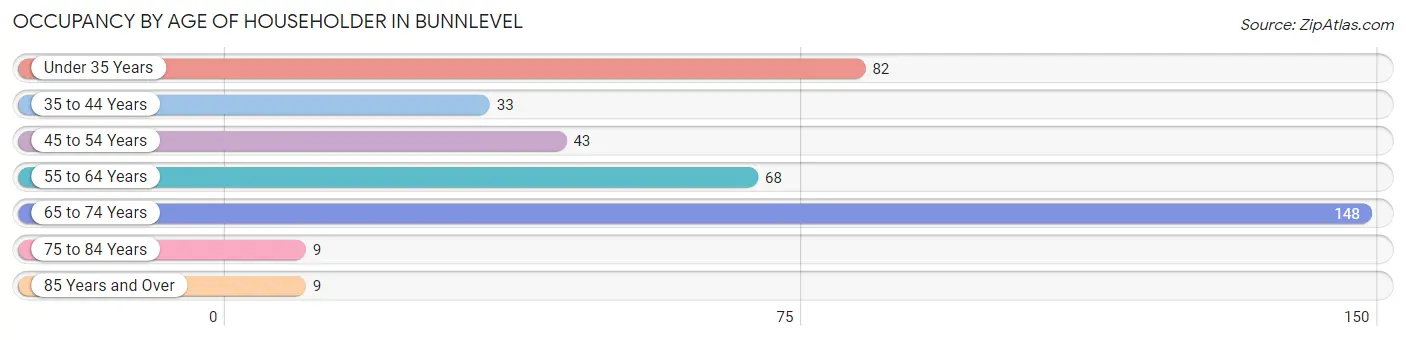
| Age Bracket | # Households | % Households |
| Under 35 Years | 82 | 20.9% |
| 35 to 44 Years | 33 | 8.4% |
| 45 to 54 Years | 43 | 11.0% |
| 55 to 64 Years | 68 | 17.3% |
| 65 to 74 Years | 148 | 37.8% |
| 75 to 84 Years | 9 | 2.3% |
| 85 Years and Over | 9 | 2.3% |
| Total | 392 | 100.0% |
Housing Finances in Bunnlevel
Median Income by Occupancy in Bunnlevel
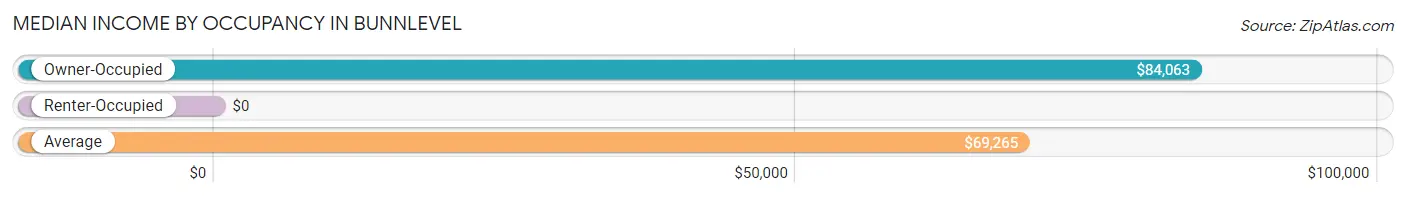
| Occupancy Type | # Households | Median Income |
| Owner-Occupied | 227 (57.9%) | $84,063 |
| Renter-Occupied | 165 (42.1%) | $0 |
| Average | 392 (100.0%) | $69,265 |
Occupancy by Householder Income Bracket in Bunnlevel
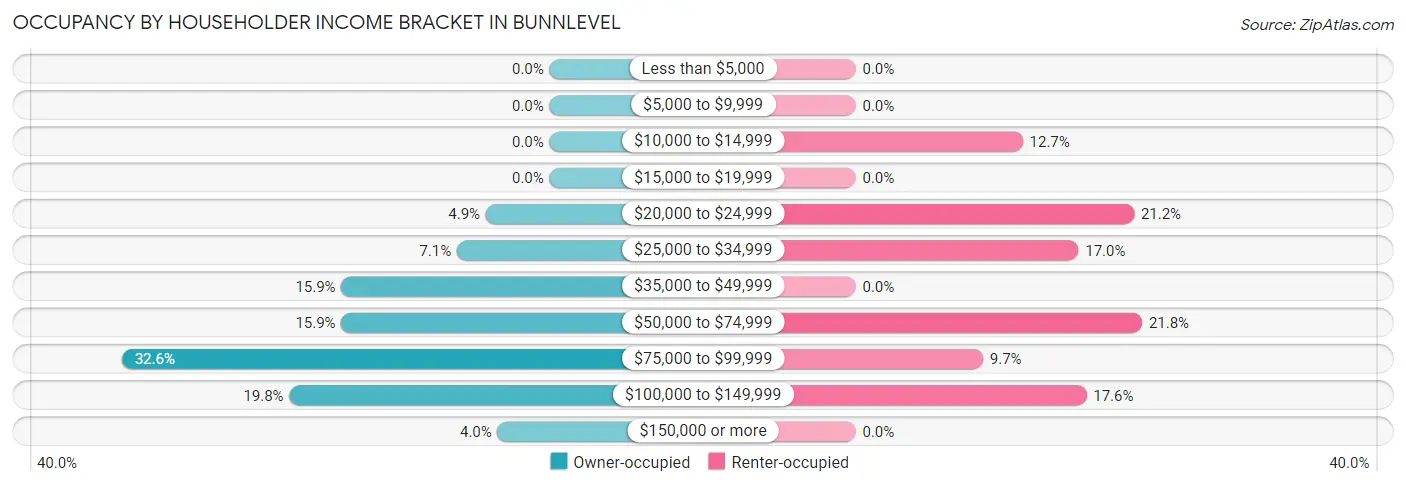
| Income Bracket | Owner-occupied | Renter-occupied |
| Less than $5,000 | 0 (0.0%) | 0 (0.0%) |
| $5,000 to $9,999 | 0 (0.0%) | 0 (0.0%) |
| $10,000 to $14,999 | 0 (0.0%) | 21 (12.7%) |
| $15,000 to $19,999 | 0 (0.0%) | 0 (0.0%) |
| $20,000 to $24,999 | 11 (4.9%) | 35 (21.2%) |
| $25,000 to $34,999 | 16 (7.0%) | 28 (17.0%) |
| $35,000 to $49,999 | 36 (15.9%) | 0 (0.0%) |
| $50,000 to $74,999 | 36 (15.9%) | 36 (21.8%) |
| $75,000 to $99,999 | 74 (32.6%) | 16 (9.7%) |
| $100,000 to $149,999 | 45 (19.8%) | 29 (17.6%) |
| $150,000 or more | 9 (4.0%) | 0 (0.0%) |
| Total | 227 (100.0%) | 165 (100.0%) |
Monthly Housing Cost Tiers in Bunnlevel
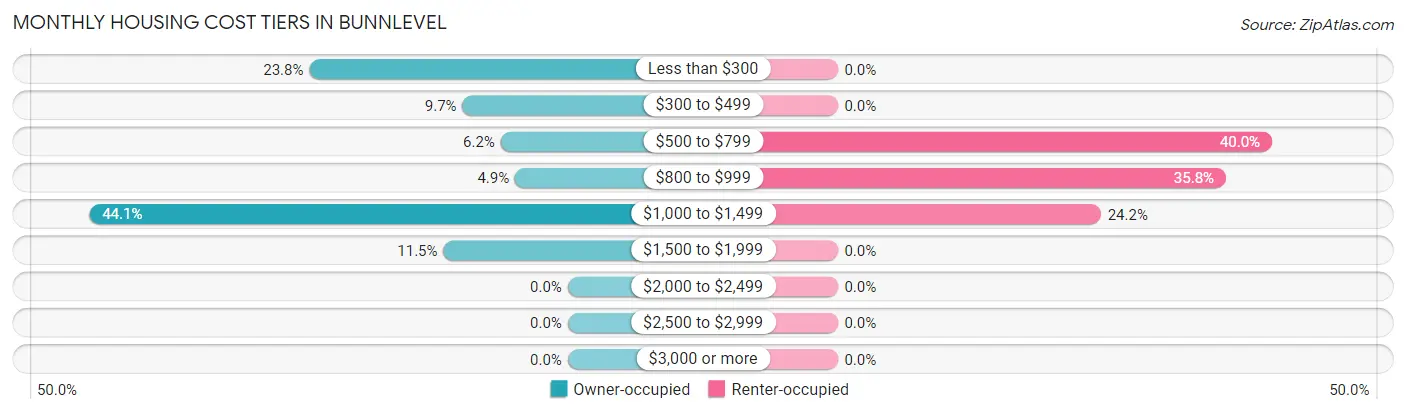
| Monthly Cost | Owner-occupied | Renter-occupied |
| Less than $300 | 54 (23.8%) | 0 (0.0%) |
| $300 to $499 | 22 (9.7%) | 0 (0.0%) |
| $500 to $799 | 14 (6.2%) | 66 (40.0%) |
| $800 to $999 | 11 (4.9%) | 59 (35.8%) |
| $1,000 to $1,499 | 100 (44.1%) | 40 (24.2%) |
| $1,500 to $1,999 | 26 (11.5%) | 0 (0.0%) |
| $2,000 to $2,499 | 0 (0.0%) | 0 (0.0%) |
| $2,500 to $2,999 | 0 (0.0%) | 0 (0.0%) |
| $3,000 or more | 0 (0.0%) | 0 (0.0%) |
| Total | 227 (100.0%) | 165 (100.0%) |
Physical Housing Characteristics in Bunnlevel
Housing Structures in Bunnlevel
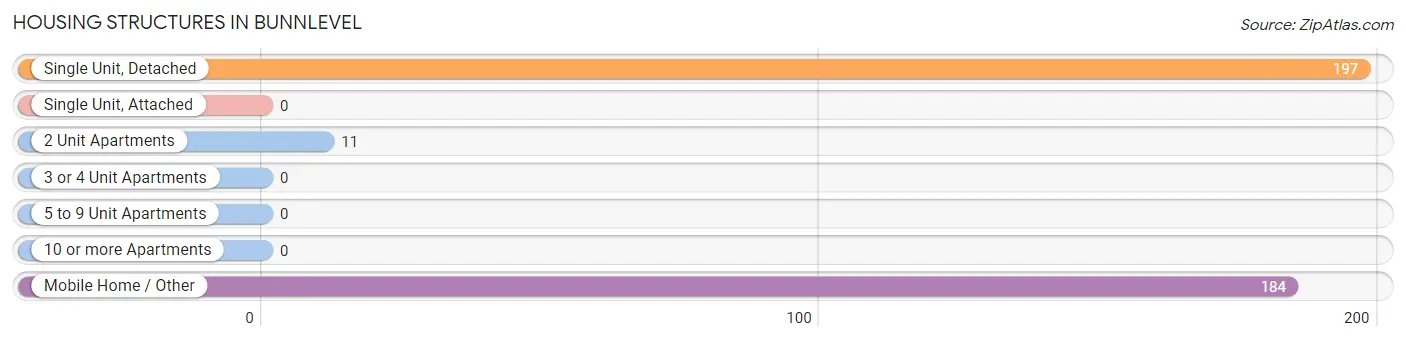
| Structure Type | # Housing Units | % Housing Units |
| Single Unit, Detached | 197 | 50.3% |
| Single Unit, Attached | 0 | 0.0% |
| 2 Unit Apartments | 11 | 2.8% |
| 3 or 4 Unit Apartments | 0 | 0.0% |
| 5 to 9 Unit Apartments | 0 | 0.0% |
| 10 or more Apartments | 0 | 0.0% |
| Mobile Home / Other | 184 | 46.9% |
| Total | 392 | 100.0% |
Housing Structures by Occupancy in Bunnlevel
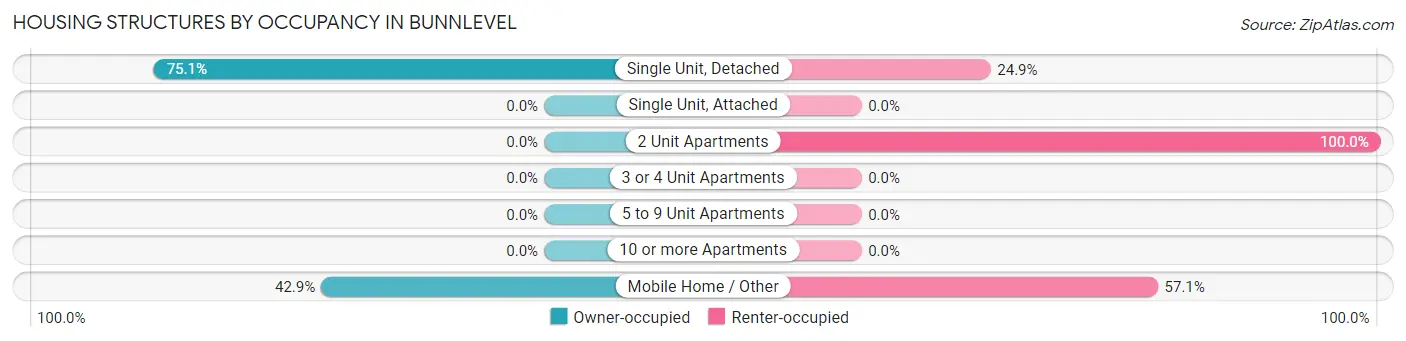
| Structure Type | Owner-occupied | Renter-occupied |
| Single Unit, Detached | 148 (75.1%) | 49 (24.9%) |
| Single Unit, Attached | 0 (0.0%) | 0 (0.0%) |
| 2 Unit Apartments | 0 (0.0%) | 11 (100.0%) |
| 3 or 4 Unit Apartments | 0 (0.0%) | 0 (0.0%) |
| 5 to 9 Unit Apartments | 0 (0.0%) | 0 (0.0%) |
| 10 or more Apartments | 0 (0.0%) | 0 (0.0%) |
| Mobile Home / Other | 79 (42.9%) | 105 (57.1%) |
| Total | 227 (57.9%) | 165 (42.1%) |
Housing Structures by Number of Rooms in Bunnlevel
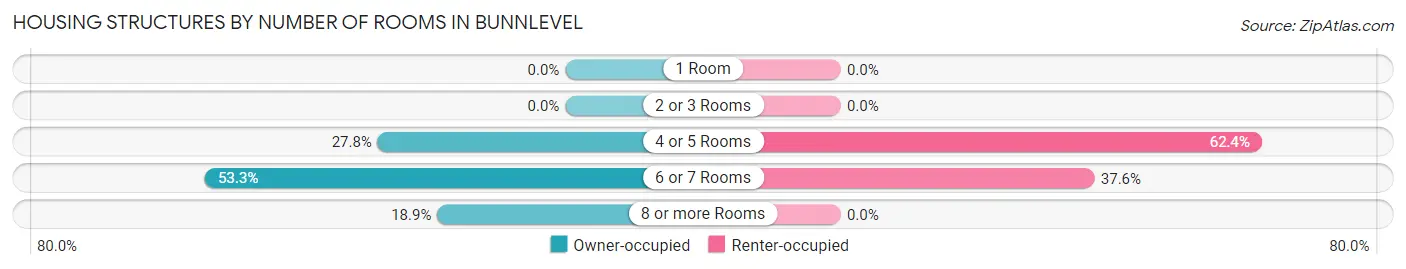
| Number of Rooms | Owner-occupied | Renter-occupied |
| 1 Room | 0 (0.0%) | 0 (0.0%) |
| 2 or 3 Rooms | 0 (0.0%) | 0 (0.0%) |
| 4 or 5 Rooms | 63 (27.8%) | 103 (62.4%) |
| 6 or 7 Rooms | 121 (53.3%) | 62 (37.6%) |
| 8 or more Rooms | 43 (18.9%) | 0 (0.0%) |
| Total | 227 (100.0%) | 165 (100.0%) |
Housing Structure by Heating Type in Bunnlevel
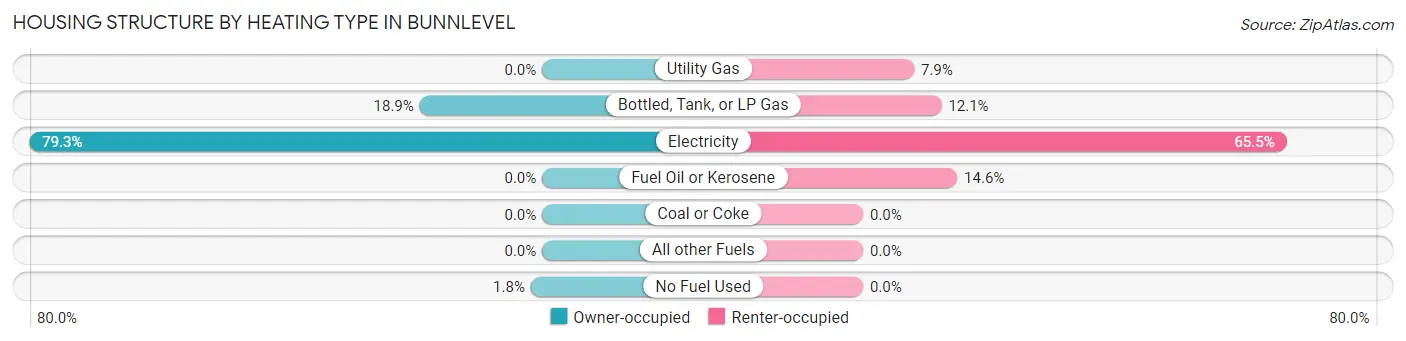
| Heating Type | Owner-occupied | Renter-occupied |
| Utility Gas | 0 (0.0%) | 13 (7.9%) |
| Bottled, Tank, or LP Gas | 43 (18.9%) | 20 (12.1%) |
| Electricity | 180 (79.3%) | 108 (65.4%) |
| Fuel Oil or Kerosene | 0 (0.0%) | 24 (14.5%) |
| Coal or Coke | 0 (0.0%) | 0 (0.0%) |
| All other Fuels | 0 (0.0%) | 0 (0.0%) |
| No Fuel Used | 4 (1.8%) | 0 (0.0%) |
| Total | 227 (100.0%) | 165 (100.0%) |
Household Vehicle Usage in Bunnlevel
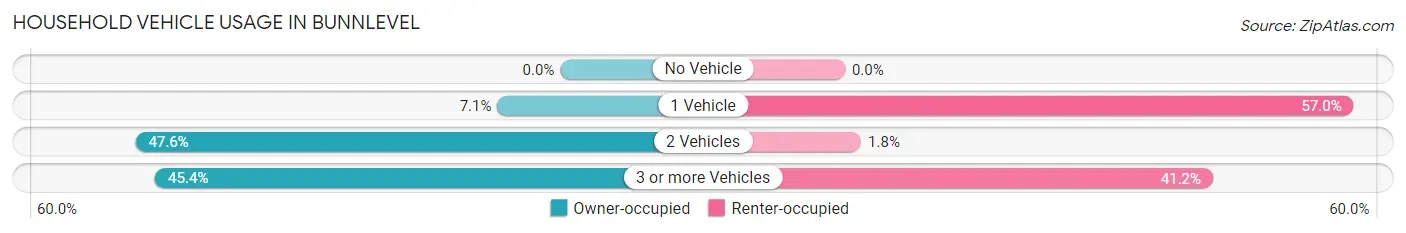
| Vehicles per Household | Owner-occupied | Renter-occupied |
| No Vehicle | 0 (0.0%) | 0 (0.0%) |
| 1 Vehicle | 16 (7.0%) | 94 (57.0%) |
| 2 Vehicles | 108 (47.6%) | 3 (1.8%) |
| 3 or more Vehicles | 103 (45.4%) | 68 (41.2%) |
| Total | 227 (100.0%) | 165 (100.0%) |
Real Estate & Mortgages in Bunnlevel
Real Estate and Mortgage Overview in Bunnlevel
| Characteristic | Without Mortgage | With Mortgage |
| Housing Units | 93 | 134 |
| Median Property Value | $67,500 | $226,600 |
| Median Household Income | $95,386 | $9 |
| Monthly Housing Costs | $293 | $0 |
| Real Estate Taxes | $528 | $0 |
Property Value by Mortgage Status in Bunnlevel
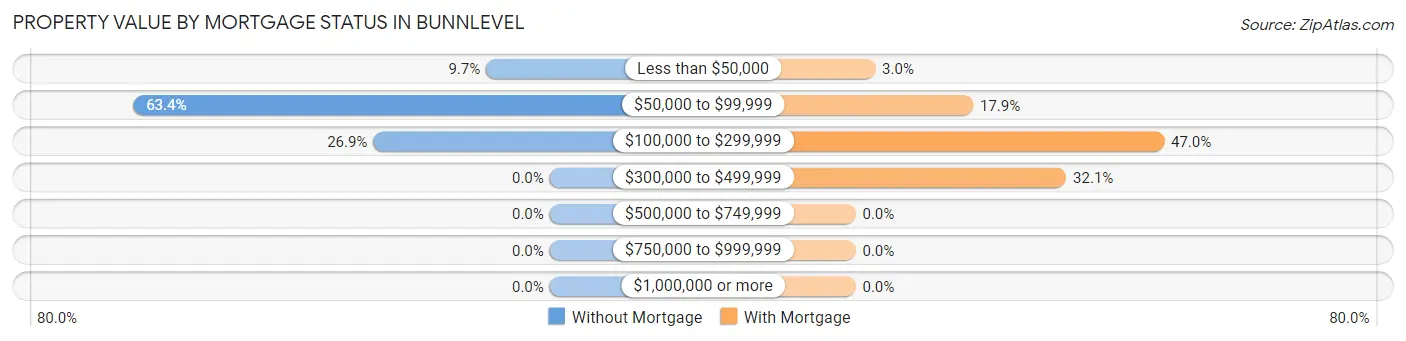
| Property Value | Without Mortgage | With Mortgage |
| Less than $50,000 | 9 (9.7%) | 4 (3.0%) |
| $50,000 to $99,999 | 59 (63.4%) | 24 (17.9%) |
| $100,000 to $299,999 | 25 (26.9%) | 63 (47.0%) |
| $300,000 to $499,999 | 0 (0.0%) | 43 (32.1%) |
| $500,000 to $749,999 | 0 (0.0%) | 0 (0.0%) |
| $750,000 to $999,999 | 0 (0.0%) | 0 (0.0%) |
| $1,000,000 or more | 0 (0.0%) | 0 (0.0%) |
| Total | 93 (100.0%) | 134 (100.0%) |
Household Income by Mortgage Status in Bunnlevel
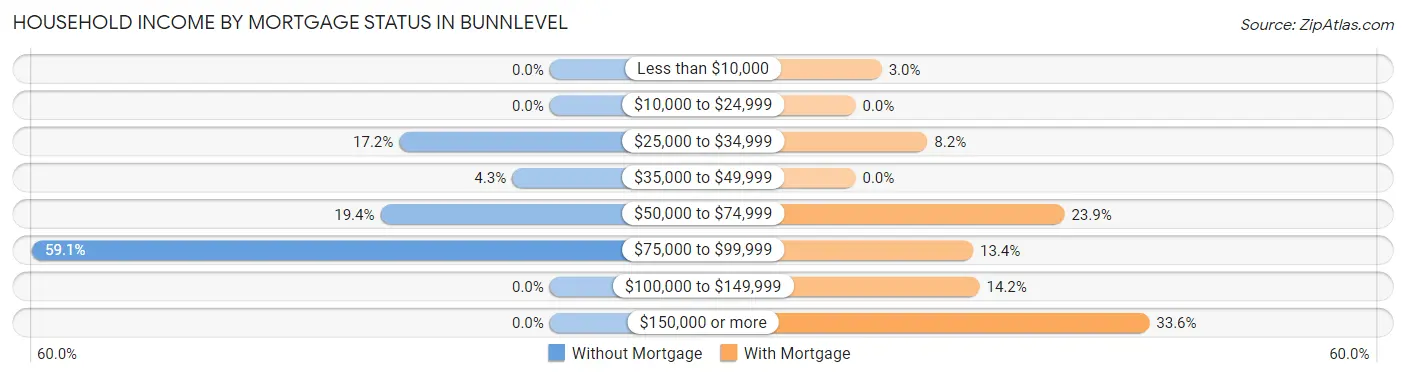
| Household Income | Without Mortgage | With Mortgage |
| Less than $10,000 | 0 (0.0%) | 4 (3.0%) |
| $10,000 to $24,999 | 0 (0.0%) | 0 (0.0%) |
| $25,000 to $34,999 | 16 (17.2%) | 11 (8.2%) |
| $35,000 to $49,999 | 4 (4.3%) | 0 (0.0%) |
| $50,000 to $74,999 | 18 (19.4%) | 32 (23.9%) |
| $75,000 to $99,999 | 55 (59.1%) | 18 (13.4%) |
| $100,000 to $149,999 | 0 (0.0%) | 19 (14.2%) |
| $150,000 or more | 0 (0.0%) | 45 (33.6%) |
| Total | 93 (100.0%) | 134 (100.0%) |
Property Value to Household Income Ratio in Bunnlevel
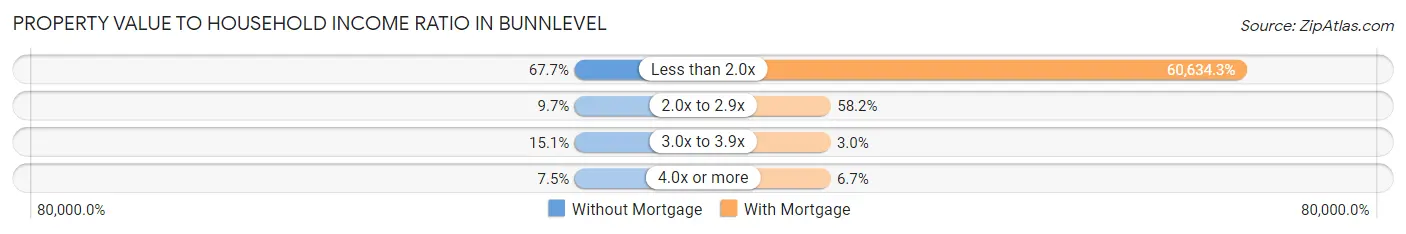
| Value-to-Income Ratio | Without Mortgage | With Mortgage |
| Less than 2.0x | 63 (67.7%) | 81,250 (60,634.3%) |
| 2.0x to 2.9x | 9 (9.7%) | 78 (58.2%) |
| 3.0x to 3.9x | 14 (15.0%) | 4 (3.0%) |
| 4.0x or more | 7 (7.5%) | 9 (6.7%) |
| Total | 93 (100.0%) | 134 (100.0%) |
Real Estate Taxes by Mortgage Status in Bunnlevel
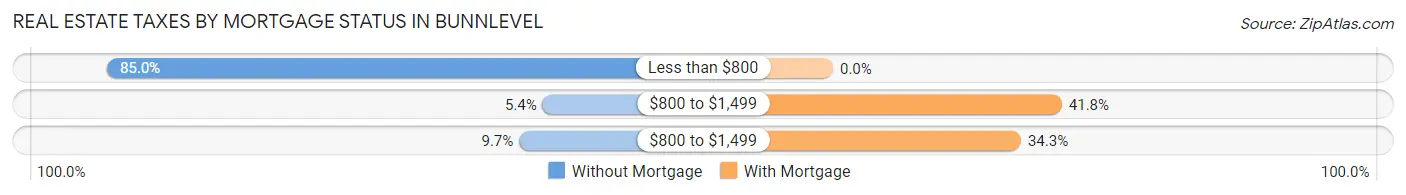
| Property Taxes | Without Mortgage | With Mortgage |
| Less than $800 | 79 (85.0%) | 0 (0.0%) |
| $800 to $1,499 | 5 (5.4%) | 56 (41.8%) |
| $800 to $1,499 | 9 (9.7%) | 46 (34.3%) |
| Total | 93 (100.0%) | 134 (100.0%) |
Health & Disability in Bunnlevel
Health Insurance Coverage by Age in Bunnlevel
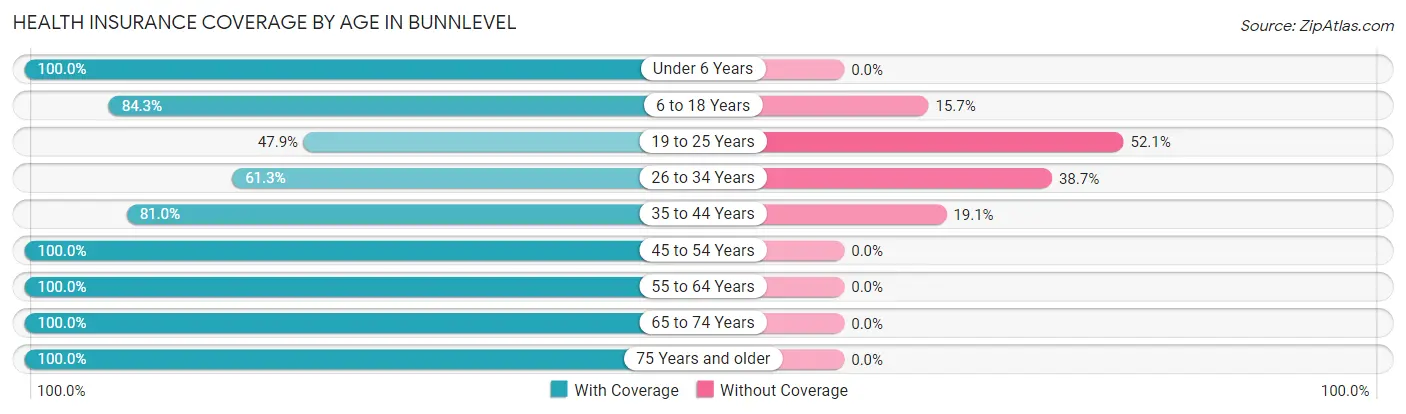
| Age Bracket | With Coverage | Without Coverage |
| Under 6 Years | 39 (100.0%) | 0 (0.0%) |
| 6 to 18 Years | 59 (84.3%) | 11 (15.7%) |
| 19 to 25 Years | 69 (47.9%) | 75 (52.1%) |
| 26 to 34 Years | 106 (61.3%) | 67 (38.7%) |
| 35 to 44 Years | 51 (80.9%) | 12 (19.1%) |
| 45 to 54 Years | 115 (100.0%) | 0 (0.0%) |
| 55 to 64 Years | 154 (100.0%) | 0 (0.0%) |
| 65 to 74 Years | 226 (100.0%) | 0 (0.0%) |
| 75 Years and older | 27 (100.0%) | 0 (0.0%) |
| Total | 846 (83.7%) | 165 (16.3%) |
Health Insurance Coverage by Citizenship Status in Bunnlevel
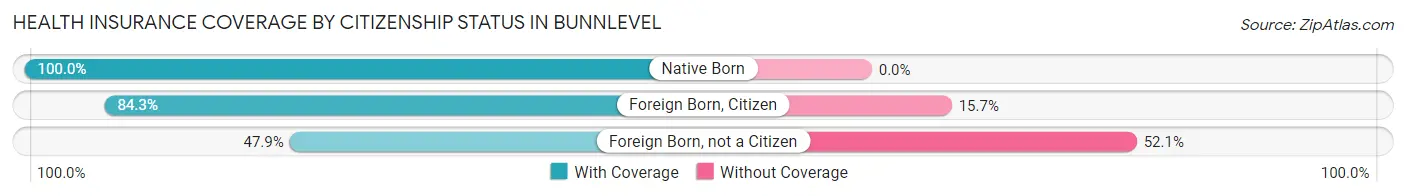
| Citizenship Status | With Coverage | Without Coverage |
| Native Born | 39 (100.0%) | 0 (0.0%) |
| Foreign Born, Citizen | 59 (84.3%) | 11 (15.7%) |
| Foreign Born, not a Citizen | 69 (47.9%) | 75 (52.1%) |
Health Insurance Coverage by Household Income in Bunnlevel
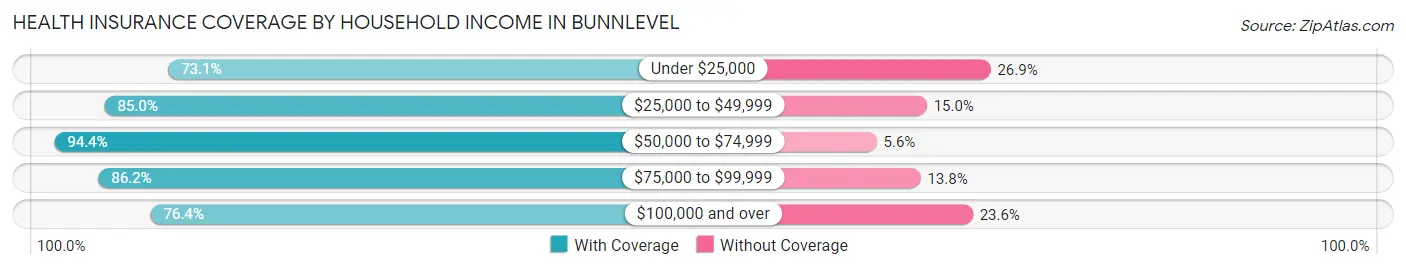
| Household Income | With Coverage | Without Coverage |
| Under $25,000 | 57 (73.1%) | 21 (26.9%) |
| $25,000 to $49,999 | 142 (85.0%) | 25 (15.0%) |
| $50,000 to $74,999 | 186 (94.4%) | 11 (5.6%) |
| $75,000 to $99,999 | 231 (86.2%) | 37 (13.8%) |
| $100,000 and over | 230 (76.4%) | 71 (23.6%) |
Public vs Private Health Insurance Coverage by Age in Bunnlevel
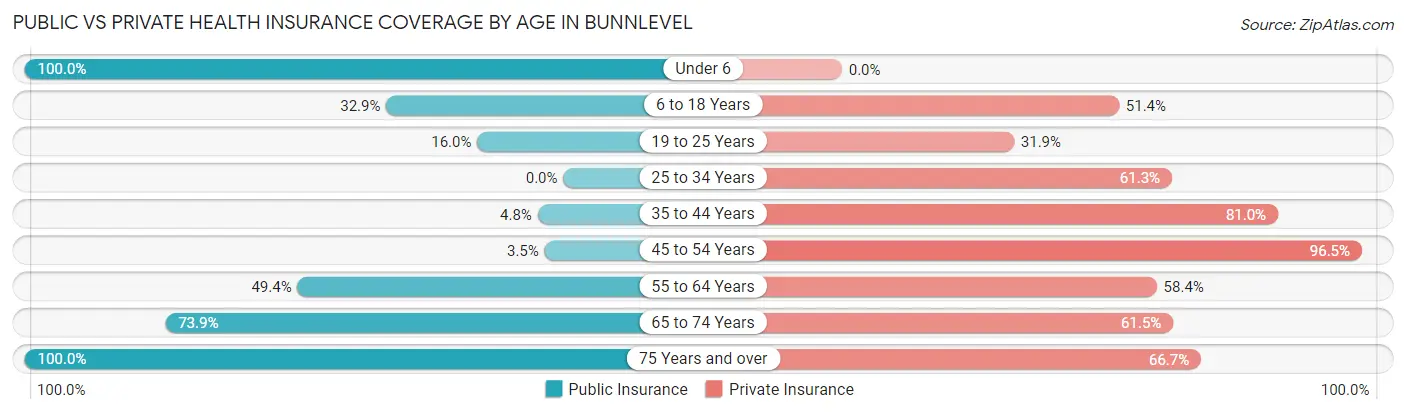
| Age Bracket | Public Insurance | Private Insurance |
| Under 6 | 39 (100.0%) | 0 (0.0%) |
| 6 to 18 Years | 23 (32.9%) | 36 (51.4%) |
| 19 to 25 Years | 23 (16.0%) | 46 (31.9%) |
| 25 to 34 Years | 0 (0.0%) | 106 (61.3%) |
| 35 to 44 Years | 3 (4.8%) | 51 (80.9%) |
| 45 to 54 Years | 4 (3.5%) | 111 (96.5%) |
| 55 to 64 Years | 76 (49.3%) | 90 (58.4%) |
| 65 to 74 Years | 167 (73.9%) | 139 (61.5%) |
| 75 Years and over | 27 (100.0%) | 18 (66.7%) |
| Total | 362 (35.8%) | 597 (59.1%) |
Disability Status by Sex by Age in Bunnlevel
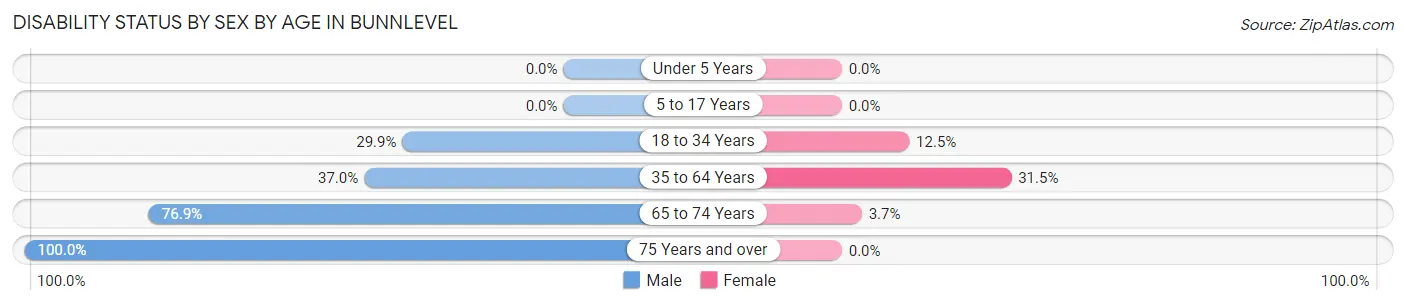
| Age Bracket | Male | Female |
| Under 5 Years | 0 (0.0%) | 0 (0.0%) |
| 5 to 17 Years | 0 (0.0%) | 0 (0.0%) |
| 18 to 34 Years | 78 (29.9%) | 9 (12.5%) |
| 35 to 64 Years | 64 (37.0%) | 50 (31.5%) |
| 65 to 74 Years | 70 (76.9%) | 5 (3.7%) |
| 75 Years and over | 18 (100.0%) | 0 (0.0%) |
Disability Class by Sex by Age in Bunnlevel
Disability Class: Hearing Difficulty
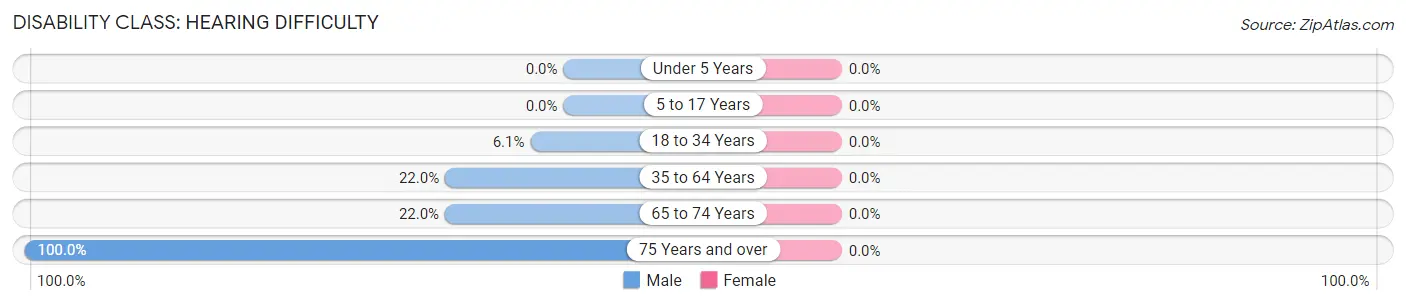
| Age Bracket | Male | Female |
| Under 5 Years | 0 (0.0%) | 0 (0.0%) |
| 5 to 17 Years | 0 (0.0%) | 0 (0.0%) |
| 18 to 34 Years | 16 (6.1%) | 0 (0.0%) |
| 35 to 64 Years | 38 (22.0%) | 0 (0.0%) |
| 65 to 74 Years | 20 (22.0%) | 0 (0.0%) |
| 75 Years and over | 18 (100.0%) | 0 (0.0%) |
Disability Class: Vision Difficulty
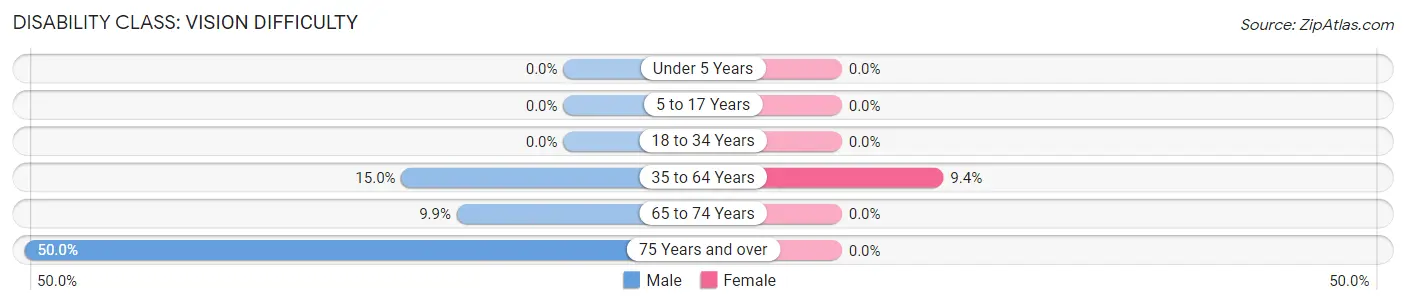
| Age Bracket | Male | Female |
| Under 5 Years | 0 (0.0%) | 0 (0.0%) |
| 5 to 17 Years | 0 (0.0%) | 0 (0.0%) |
| 18 to 34 Years | 0 (0.0%) | 0 (0.0%) |
| 35 to 64 Years | 26 (15.0%) | 15 (9.4%) |
| 65 to 74 Years | 9 (9.9%) | 0 (0.0%) |
| 75 Years and over | 9 (50.0%) | 0 (0.0%) |
Disability Class: Cognitive Difficulty
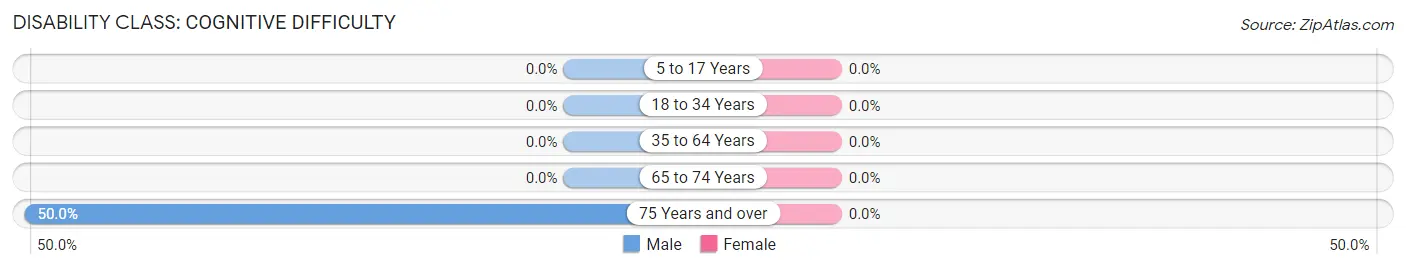
| Age Bracket | Male | Female |
| 5 to 17 Years | 0 (0.0%) | 0 (0.0%) |
| 18 to 34 Years | 0 (0.0%) | 0 (0.0%) |
| 35 to 64 Years | 0 (0.0%) | 0 (0.0%) |
| 65 to 74 Years | 0 (0.0%) | 0 (0.0%) |
| 75 Years and over | 9 (50.0%) | 0 (0.0%) |
Disability Class: Ambulatory Difficulty
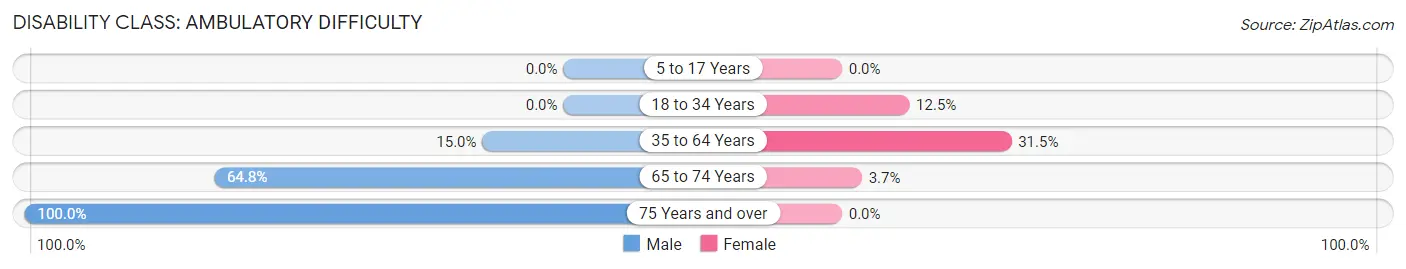
| Age Bracket | Male | Female |
| 5 to 17 Years | 0 (0.0%) | 0 (0.0%) |
| 18 to 34 Years | 0 (0.0%) | 9 (12.5%) |
| 35 to 64 Years | 26 (15.0%) | 50 (31.5%) |
| 65 to 74 Years | 59 (64.8%) | 5 (3.7%) |
| 75 Years and over | 18 (100.0%) | 0 (0.0%) |
Disability Class: Self-Care Difficulty
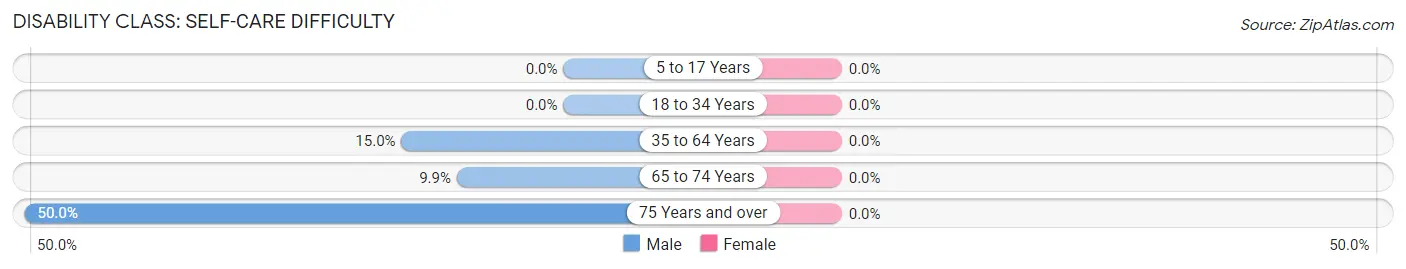
| Age Bracket | Male | Female |
| 5 to 17 Years | 0 (0.0%) | 0 (0.0%) |
| 18 to 34 Years | 0 (0.0%) | 0 (0.0%) |
| 35 to 64 Years | 26 (15.0%) | 0 (0.0%) |
| 65 to 74 Years | 9 (9.9%) | 0 (0.0%) |
| 75 Years and over | 9 (50.0%) | 0 (0.0%) |
Technology Access in Bunnlevel
Computing Device Access in Bunnlevel
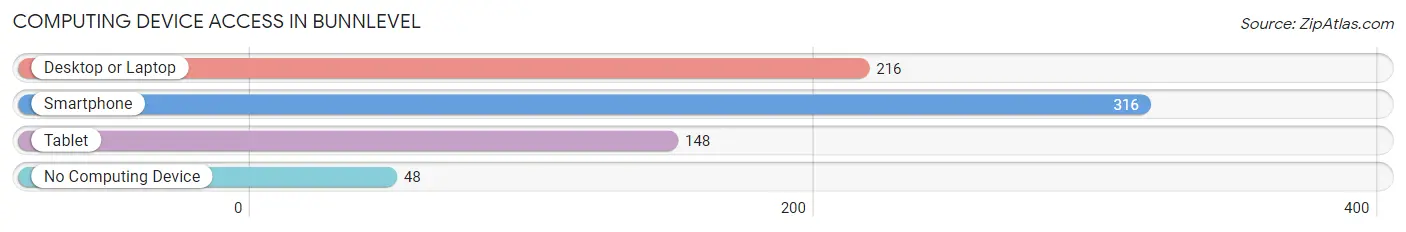
| Device Type | # Households | % Households |
| Desktop or Laptop | 216 | 55.1% |
| Smartphone | 316 | 80.6% |
| Tablet | 148 | 37.8% |
| No Computing Device | 48 | 12.2% |
| Total | 392 | 100.0% |
Internet Access in Bunnlevel
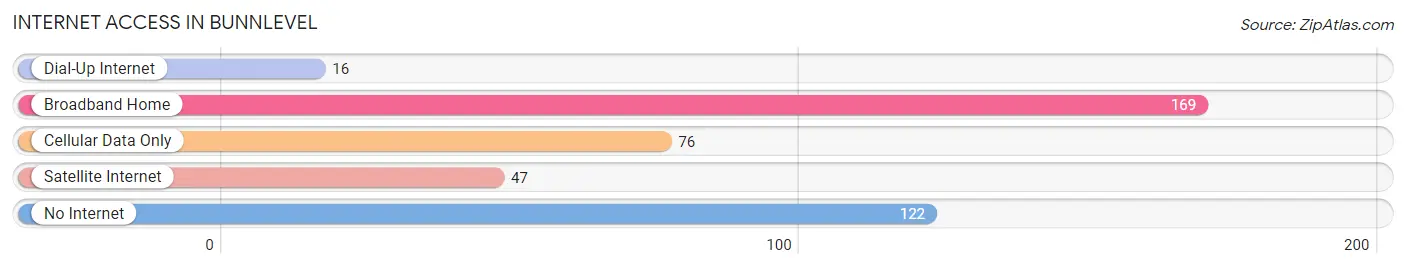
| Internet Type | # Households | % Households |
| Dial-Up Internet | 16 | 4.1% |
| Broadband Home | 169 | 43.1% |
| Cellular Data Only | 76 | 19.4% |
| Satellite Internet | 47 | 12.0% |
| No Internet | 122 | 31.1% |
| Total | 392 | 100.0% |
Bunnlevel Summary
Bunnlevel is a small unincorporated community located in Harnett County, North Carolina. It is situated in the Sandhills region of the state, approximately 20 miles south of Fayetteville and 30 miles north of Sanford. The population of Bunnlevel was estimated to be 1,845 in 2019.
History
The area that is now Bunnlevel was first settled in the late 1700s by a group of German immigrants. The town was originally known as “Bunns Level”, named after the family of John Bunn, who owned a large tract of land in the area. The town was officially incorporated in 1887.
In the early 1900s, Bunnlevel was a thriving agricultural community, with cotton, corn, and tobacco being the main crops. The town also had a sawmill, a gristmill, and a cotton gin. In the 1920s, the town began to decline as the railroad bypassed it and the Great Depression hit.
Geography
Bunnlevel is located in the Sandhills region of North Carolina, which is characterized by rolling hills and sandy soils. The town is situated in the Cape Fear River Basin, and is bordered by the towns of Lillington, Erwin, and Coats. The town is located at an elevation of approximately 200 feet above sea level.
Economy
The economy of Bunnlevel is largely based on agriculture. The town is home to several farms, which produce a variety of crops, including cotton, corn, soybeans, and tobacco. The town also has a few small businesses, including a convenience store, a gas station, and a few restaurants.
Demographics
As of the 2010 census, the population of Bunnlevel was 1,845. The racial makeup of the town was 79.3% White, 16.2% African American, 0.7% Native American, 0.3% Asian, and 3.5% from other races. The median household income was $37,917, and the median age was 38.7 years.
Conclusion
Bunnlevel is a small unincorporated community located in Harnett County, North Carolina. It is situated in the Sandhills region of the state, and has a population of approximately 1,845. The town’s economy is largely based on agriculture, and it is home to several farms that produce a variety of crops. The racial makeup of the town is 79.3% White, 16.2% African American, 0.7% Native American, 0.3% Asian, and 3.5% from other races. The median household income is $37,917, and the median age is 38.7 years.
Common Questions
What is Per Capita Income in Bunnlevel?
Per Capita income in Bunnlevel is $33,125.
What is the Median Family Income in Bunnlevel?
Median Family Income in Bunnlevel is $84,583.
What is the Median Household income in Bunnlevel?
Median Household Income in Bunnlevel is $69,265.
What is Income or Wage Gap in Bunnlevel?
Income or Wage Gap in Bunnlevel is 5.3%.
Women in Bunnlevel earn 94.7 cents for every dollar earned by a man.
What is Inequality or Gini Index in Bunnlevel?
Inequality or Gini Index in Bunnlevel is 0.33.
What is the Total Population of Bunnlevel?
Total Population of Bunnlevel is 1,011.
What is the Total Male Population of Bunnlevel?
Total Male Population of Bunnlevel is 594.
What is the Total Female Population of Bunnlevel?
Total Female Population of Bunnlevel is 417.
What is the Ratio of Males per 100 Females in Bunnlevel?
There are 142.45 Males per 100 Females in Bunnlevel.
What is the Ratio of Females per 100 Males in Bunnlevel?
There are 70.20 Females per 100 Males in Bunnlevel.
What is the Median Population Age in Bunnlevel?
Median Population Age in Bunnlevel is 46.3 Years.
What is the Average Family Size in Bunnlevel
Average Family Size in Bunnlevel is 3.1 People.
What is the Average Household Size in Bunnlevel
Average Household Size in Bunnlevel is 2.6 People.
How Large is the Labor Force in Bunnlevel?
There are 565 People in the Labor Forcein in Bunnlevel.
What is the Percentage of People in the Labor Force in Bunnlevel?
60.8% of People are in the Labor Force in Bunnlevel.