Zip Codes with the Highest Percentage of Population Employed in Administrative & Support Services in Hattiesburg, MS
RELATED REPORTS & OPTIONS
Administrative & Support Services
Hattiesburg
Compare Zip Codes
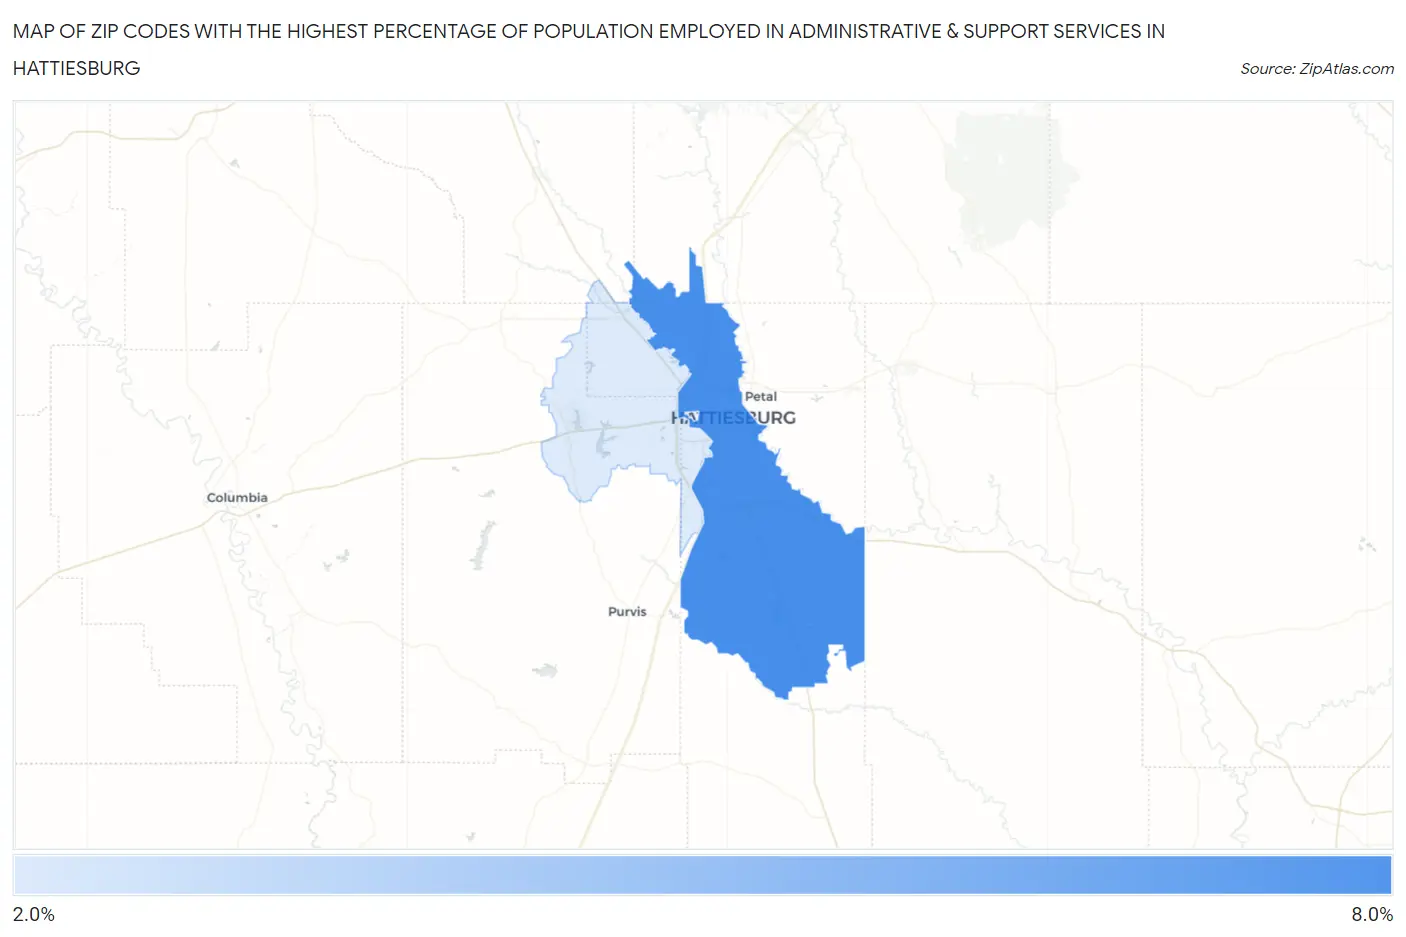
Map of Zip Codes with the Highest Percentage of Population Employed in Administrative & Support Services in Hattiesburg
2.8%
6.5%
Zip Codes with the Highest Percentage of Population Employed in Administrative & Support Services in Hattiesburg, MS
| Zip Code | % Employed | vs State | vs National | |
| 1. | 39401 | 6.5% | 3.4%(+3.05)#42 | 4.1%(+2.30)#3,981 |
| 2. | 39402 | 2.8% | 3.4%(-0.655)#185 | 4.1%(-1.40)#16,830 |
1
Common Questions
What are the Top Zip Codes with the Highest Percentage of Population Employed in Administrative & Support Services in Hattiesburg, MS?
Top Zip Codes with the Highest Percentage of Population Employed in Administrative & Support Services in Hattiesburg, MS are:
What zip code has the Highest Percentage of Population Employed in Administrative & Support Services in Hattiesburg, MS?
39401 has the Highest Percentage of Population Employed in Administrative & Support Services in Hattiesburg, MS with 6.5%.
What is the Percentage of Population Employed in Administrative & Support Services in Hattiesburg, MS?
Percentage of Population Employed in Administrative & Support Services in Hattiesburg is 5.0%.
What is the Percentage of Population Employed in Administrative & Support Services in Mississippi?
Percentage of Population Employed in Administrative & Support Services in Mississippi is 3.4%.
What is the Percentage of Population Employed in Administrative & Support Services in the United States?
Percentage of Population Employed in Administrative & Support Services in the United States is 4.1%.