Nellieburg, MS Map & Demographics
Nellieburg Map
Nellieburg Overview
$17,131
PER CAPITA INCOME
$37,589
AVG FAMILY INCOME
$33,009
AVG HOUSEHOLD INCOME
0.6%
WAGE / INCOME GAP [ % ]
99.4¢/ $1
WAGE / INCOME GAP [ $ ]
0.42
INEQUALITY / GINI INDEX
1,321
TOTAL POPULATION
601
MALE POPULATION
720
FEMALE POPULATION
83.47
MALES / 100 FEMALES
119.80
FEMALES / 100 MALES
41.2
MEDIAN AGE
3.1
AVG FAMILY SIZE
2.5
AVG HOUSEHOLD SIZE
498
LABOR FORCE [ PEOPLE ]
46.2%
PERCENT IN LABOR FORCE
3.6%
UNEMPLOYMENT RATE
Income in Nellieburg
Income Overview in Nellieburg
Per Capita Income in Nellieburg is $17,131, while median incomes of families and households are $37,589 and $33,009 respectively.
| Characteristic | Number | Measure |
| Per Capita Income | 1,321 | $17,131 |
| Median Family Income | 297 | $37,589 |
| Mean Family Income | 297 | $45,727 |
| Median Household Income | 459 | $33,009 |
| Mean Household Income | 459 | $38,693 |
| Income Deficit | 297 | $0 |
| Wage / Income Gap (%) | 1,321 | 0.65% |
| Wage / Income Gap ($) | 1,321 | 99.35¢ per $1 |
| Gini / Inequality Index | 1,321 | 0.42 |
Earnings by Sex in Nellieburg
Average Earnings in Nellieburg are $21,780, $21,875 for men and $21,733 for women, a difference of 0.6%.
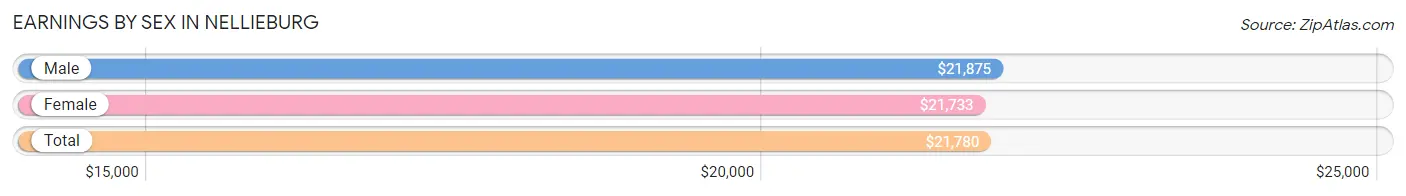
| Sex | Number | Average Earnings |
| Male | 277 (54.1%) | $21,875 |
| Female | 235 (45.9%) | $21,733 |
| Total | 512 (100.0%) | $21,780 |
Earnings by Sex by Income Bracket in Nellieburg
The most common earnings brackets in Nellieburg are $17,500 to $19,999 for men (73 | 26.4%) and $20,000 to $22,499 for women (44 | 18.7%).
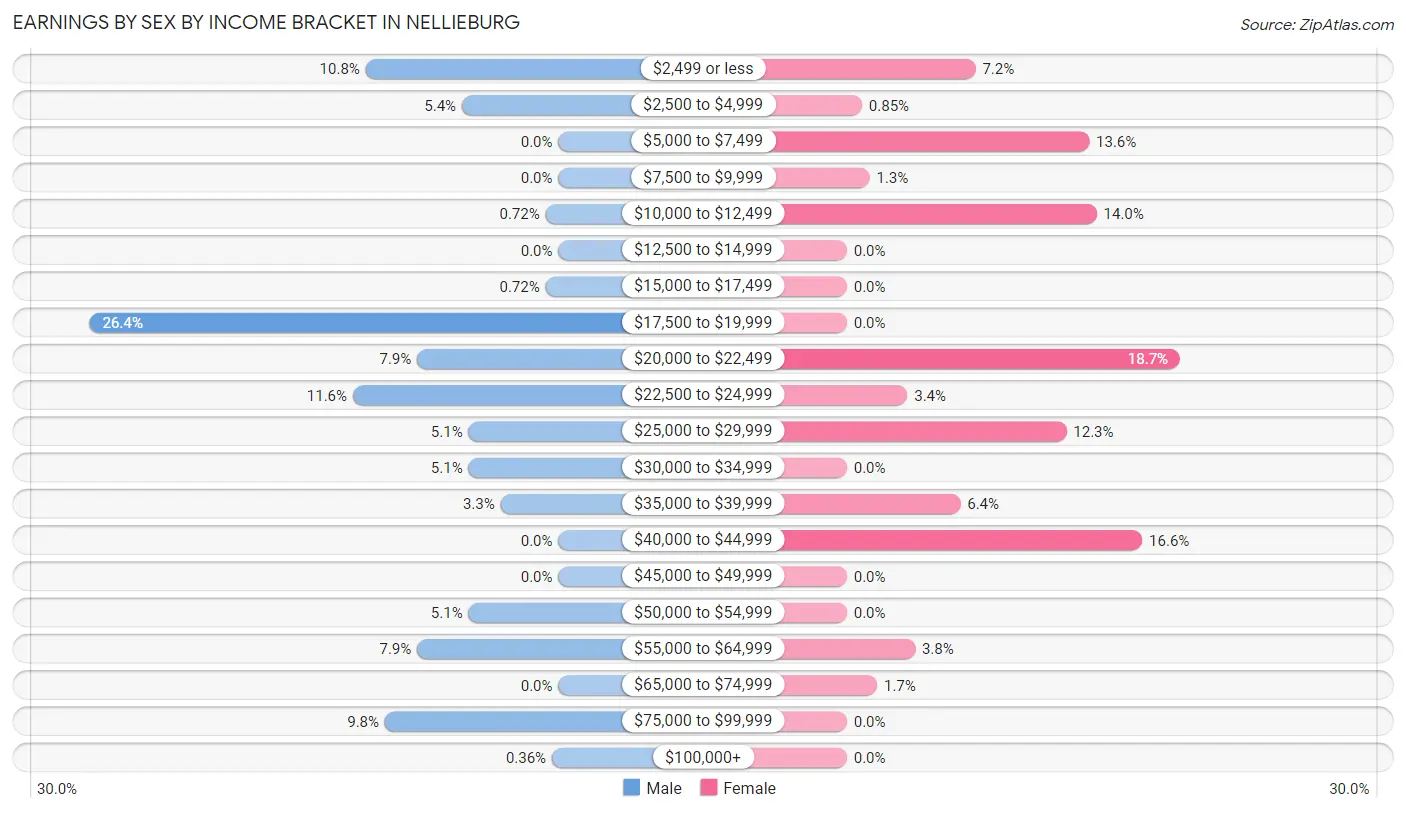
| Income | Male | Female |
| $2,499 or less | 30 (10.8%) | 17 (7.2%) |
| $2,500 to $4,999 | 15 (5.4%) | 2 (0.9%) |
| $5,000 to $7,499 | 0 (0.0%) | 32 (13.6%) |
| $7,500 to $9,999 | 0 (0.0%) | 3 (1.3%) |
| $10,000 to $12,499 | 2 (0.7%) | 33 (14.0%) |
| $12,500 to $14,999 | 0 (0.0%) | 0 (0.0%) |
| $15,000 to $17,499 | 2 (0.7%) | 0 (0.0%) |
| $17,500 to $19,999 | 73 (26.4%) | 0 (0.0%) |
| $20,000 to $22,499 | 22 (7.9%) | 44 (18.7%) |
| $22,500 to $24,999 | 32 (11.6%) | 8 (3.4%) |
| $25,000 to $29,999 | 14 (5.1%) | 29 (12.3%) |
| $30,000 to $34,999 | 14 (5.1%) | 0 (0.0%) |
| $35,000 to $39,999 | 9 (3.3%) | 15 (6.4%) |
| $40,000 to $44,999 | 0 (0.0%) | 39 (16.6%) |
| $45,000 to $49,999 | 0 (0.0%) | 0 (0.0%) |
| $50,000 to $54,999 | 14 (5.1%) | 0 (0.0%) |
| $55,000 to $64,999 | 22 (7.9%) | 9 (3.8%) |
| $65,000 to $74,999 | 0 (0.0%) | 4 (1.7%) |
| $75,000 to $99,999 | 27 (9.8%) | 0 (0.0%) |
| $100,000+ | 1 (0.4%) | 0 (0.0%) |
| Total | 277 (100.0%) | 235 (100.0%) |
Earnings by Sex by Educational Attainment in Nellieburg
Average earnings in Nellieburg are $22,656 for men and $22,045 for women, a difference of 2.7%. Men with an educational attainment of college or associate's degree enjoy the highest average annual earnings of $21,818, while those with high school diploma education earn the least with $19,932. Women with an educational attainment of college or associate's degree earn the most with the average annual earnings of $21,625, while those with less than high school education have the smallest earnings of $20,592.
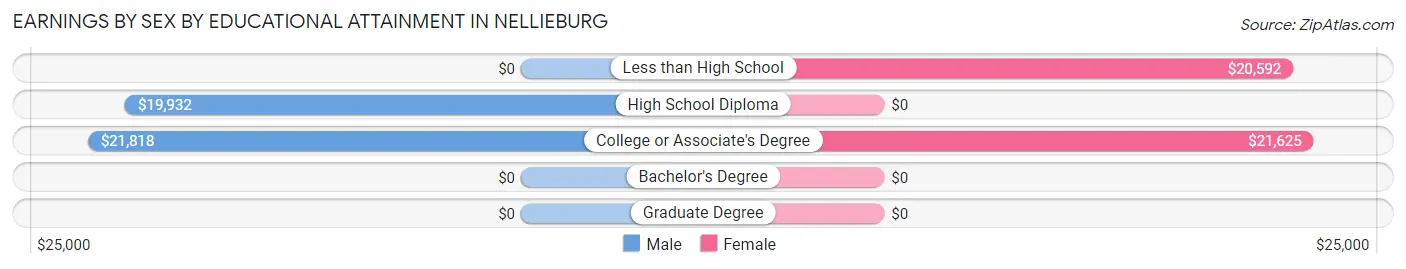
| Educational Attainment | Male Income | Female Income |
| Less than High School | - | - |
| High School Diploma | $19,932 | $0 |
| College or Associate's Degree | $21,818 | $21,625 |
| Bachelor's Degree | - | - |
| Graduate Degree | - | - |
| Total | $22,656 | $22,045 |
Family Income in Nellieburg
Family Income Brackets in Nellieburg
According to the Nellieburg family income data, there are 97 families falling into the $15,000 to $24,999 income range, which is the most common income bracket and makes up 32.7% of all families.
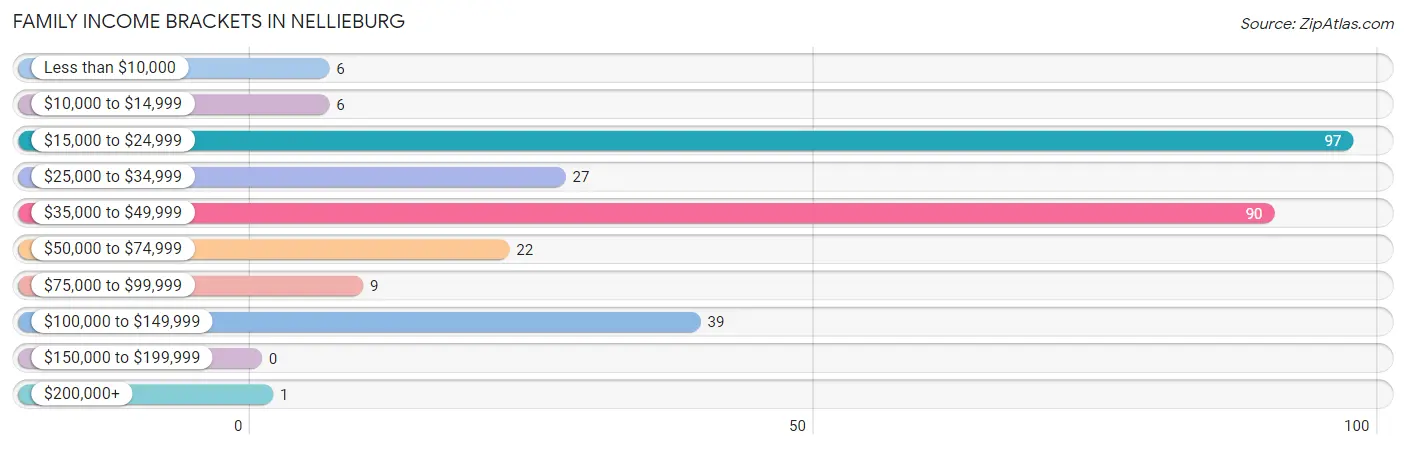
| Income Bracket | # Families | % Families |
| Less than $10,000 | 6 | 2.0% |
| $10,000 to $14,999 | 6 | 2.0% |
| $15,000 to $24,999 | 97 | 32.7% |
| $25,000 to $34,999 | 27 | 9.1% |
| $35,000 to $49,999 | 90 | 30.3% |
| $50,000 to $74,999 | 22 | 7.4% |
| $75,000 to $99,999 | 9 | 3.0% |
| $100,000 to $149,999 | 39 | 13.1% |
| $150,000 to $199,999 | 0 | 0.0% |
| $200,000+ | 1 | 0.3% |
Family Income by Famaliy Size in Nellieburg
2-person families (171 | 57.6%) account for the highest median family income in Nellieburg with $39,018 per family, while 2-person families (171 | 57.6%) have the highest median income of $19,509 per family member.
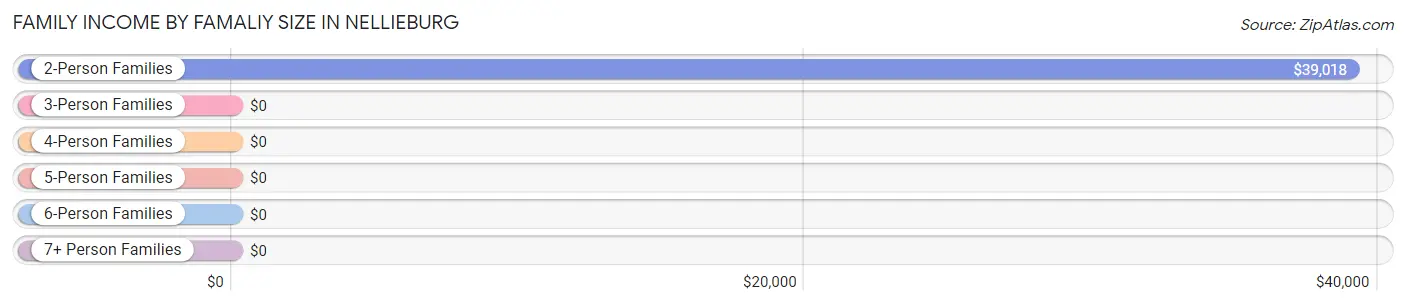
| Income Bracket | # Families | Median Income |
| 2-Person Families | 171 (57.6%) | $39,018 |
| 3-Person Families | 66 (22.2%) | $0 |
| 4-Person Families | 36 (12.1%) | $0 |
| 5-Person Families | 0 (0.0%) | $0 |
| 6-Person Families | 10 (3.4%) | $0 |
| 7+ Person Families | 14 (4.7%) | $0 |
| Total | 297 (100.0%) | $37,589 |
Family Income by Number of Earners in Nellieburg
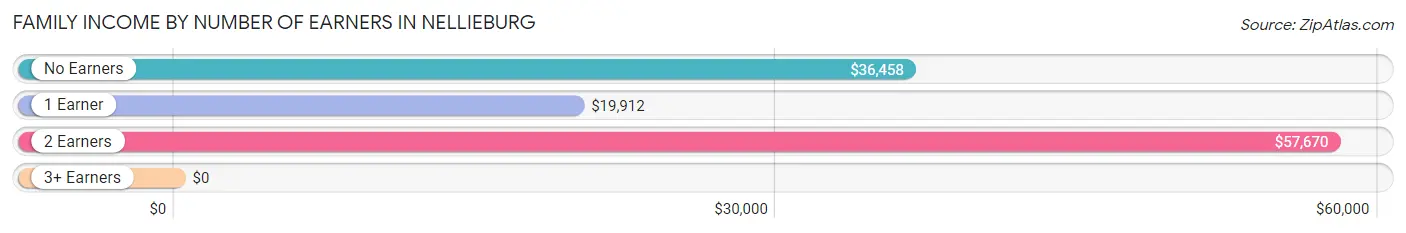
| Number of Earners | # Families | Median Income |
| No Earners | 38 (12.8%) | $36,458 |
| 1 Earner | 137 (46.1%) | $19,912 |
| 2 Earners | 97 (32.7%) | $57,670 |
| 3+ Earners | 25 (8.4%) | $0 |
| Total | 297 (100.0%) | $37,589 |
Household Income in Nellieburg
Household Income Brackets in Nellieburg
With 151 households falling in the category, the $15,000 to $24,999 income range is the most frequent in Nellieburg, accounting for 32.9% of all households.
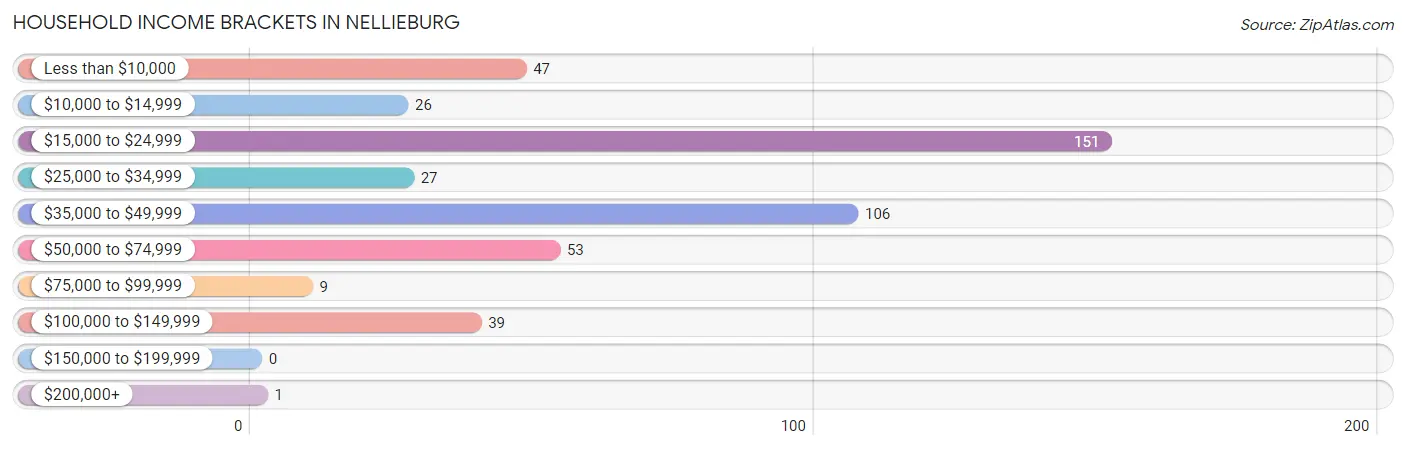
| Income Bracket | # Households | % Households |
| Less than $10,000 | 47 | 10.2% |
| $10,000 to $14,999 | 26 | 5.7% |
| $15,000 to $24,999 | 151 | 32.9% |
| $25,000 to $34,999 | 27 | 5.9% |
| $35,000 to $49,999 | 106 | 23.1% |
| $50,000 to $74,999 | 53 | 11.5% |
| $75,000 to $99,999 | 9 | 2.0% |
| $100,000 to $149,999 | 39 | 8.5% |
| $150,000 to $199,999 | 0 | 0.0% |
| $200,000+ | 1 | 0.2% |
Household Income by Householder Age in Nellieburg
The median household income in Nellieburg is $33,009, with the highest median household income of $37,083 found in the 45 to 64 years age bracket for the primary householder. A total of 166 households (36.2%) fall into this category.
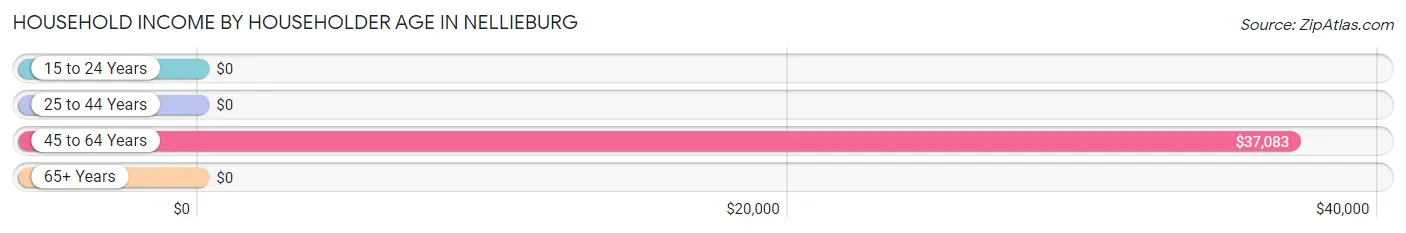
| Income Bracket | # Households | Median Income |
| 15 to 24 Years | 0 (0.0%) | $0 |
| 25 to 44 Years | 178 (38.8%) | $0 |
| 45 to 64 Years | 166 (36.2%) | $37,083 |
| 65+ Years | 115 (25.1%) | $0 |
| Total | 459 (100.0%) | $33,009 |
Poverty in Nellieburg
Income Below Poverty by Sex and Age in Nellieburg
With 37.4% poverty level for males and 54.7% for females among the residents of Nellieburg, under 5 year old males and 12 to 14 year old females are the most vulnerable to poverty, with 40 males (100.0%) and 32 females (100.0%) in their respective age groups living below the poverty level.
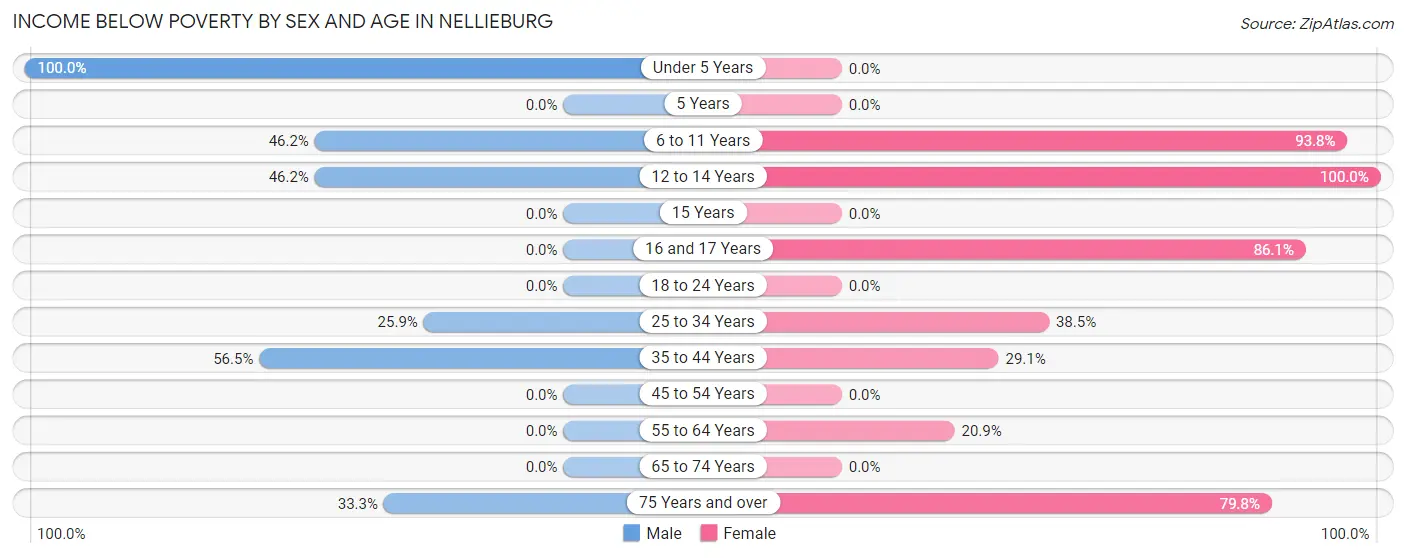
| Age Bracket | Male | Female |
| Under 5 Years | 40 (100.0%) | 0 (0.0%) |
| 5 Years | 0 (0.0%) | 0 (0.0%) |
| 6 to 11 Years | 24 (46.2%) | 76 (93.8%) |
| 12 to 14 Years | 12 (46.2%) | 32 (100.0%) |
| 15 Years | 0 (0.0%) | 0 (0.0%) |
| 16 and 17 Years | 0 (0.0%) | 93 (86.1%) |
| 18 to 24 Years | 0 (0.0%) | 0 (0.0%) |
| 25 to 34 Years | 14 (25.9%) | 10 (38.5%) |
| 35 to 44 Years | 105 (56.5%) | 32 (29.1%) |
| 45 to 54 Years | 0 (0.0%) | 0 (0.0%) |
| 55 to 64 Years | 0 (0.0%) | 18 (20.9%) |
| 65 to 74 Years | 0 (0.0%) | 0 (0.0%) |
| 75 Years and over | 7 (33.3%) | 83 (79.8%) |
| Total | 202 (37.4%) | 344 (54.7%) |
Income Above Poverty by Sex and Age in Nellieburg
According to the poverty statistics in Nellieburg, males aged 18 to 24 years and females aged 18 to 24 years are the age groups that are most secure financially, with 100.0% of males and 100.0% of females in these age groups living above the poverty line.
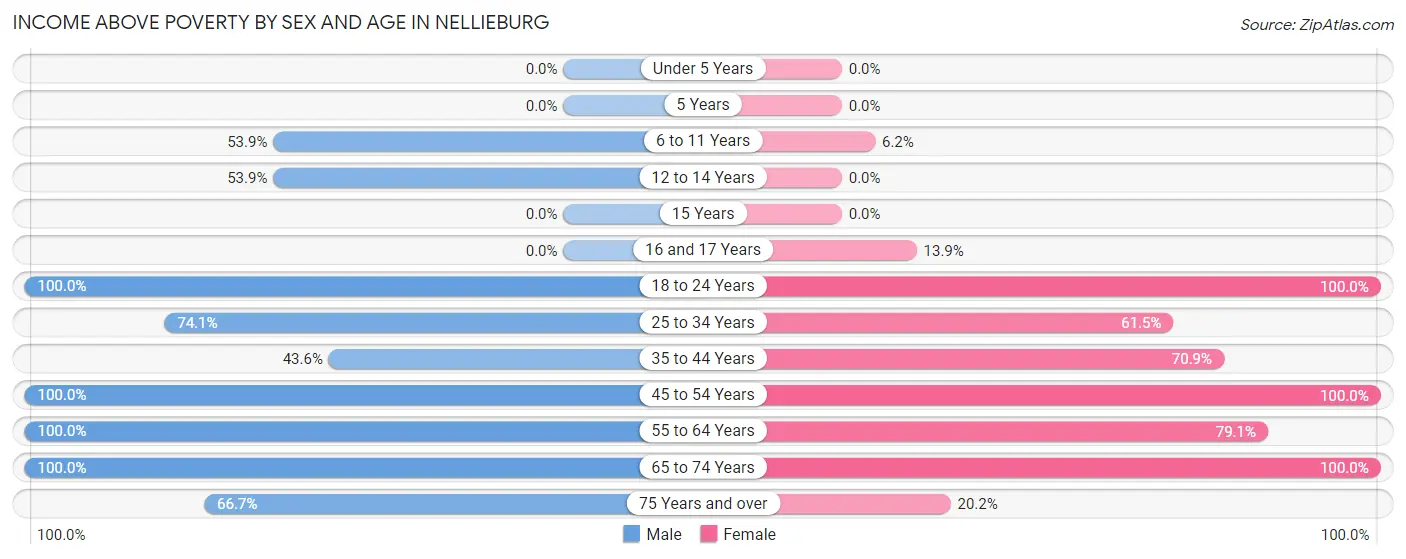
| Age Bracket | Male | Female |
| Under 5 Years | 0 (0.0%) | 0 (0.0%) |
| 5 Years | 0 (0.0%) | 0 (0.0%) |
| 6 to 11 Years | 28 (53.8%) | 5 (6.2%) |
| 12 to 14 Years | 14 (53.8%) | 0 (0.0%) |
| 15 Years | 0 (0.0%) | 0 (0.0%) |
| 16 and 17 Years | 0 (0.0%) | 15 (13.9%) |
| 18 to 24 Years | 33 (100.0%) | 4 (100.0%) |
| 25 to 34 Years | 40 (74.1%) | 16 (61.5%) |
| 35 to 44 Years | 81 (43.5%) | 78 (70.9%) |
| 45 to 54 Years | 77 (100.0%) | 44 (100.0%) |
| 55 to 64 Years | 49 (100.0%) | 68 (79.1%) |
| 65 to 74 Years | 2 (100.0%) | 34 (100.0%) |
| 75 Years and over | 14 (66.7%) | 21 (20.2%) |
| Total | 338 (62.6%) | 285 (45.3%) |
Income Below Poverty Among Married-Couple Families in Nellieburg
The poverty statistics for married-couple families in Nellieburg show that 17.3% or 30 of the total 173 families live below the poverty line. Families with 5 or more children have the highest poverty rate of 100.0%, comprising of 14 families. On the other hand, families with no children have the lowest poverty rate of 0.0%, which includes 0 families.
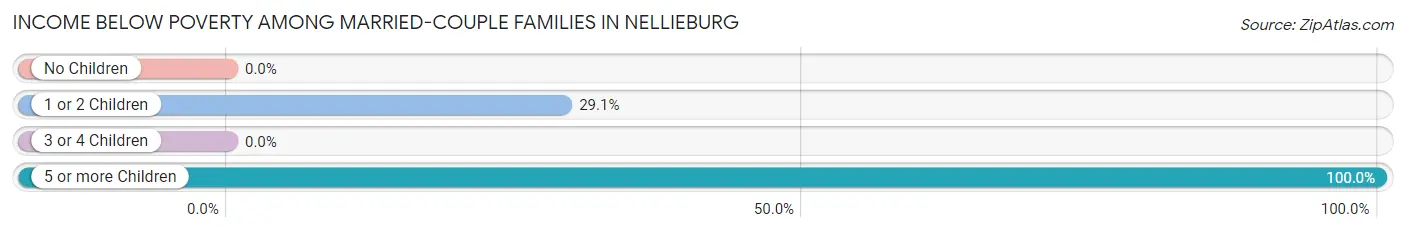
| Children | Above Poverty | Below Poverty |
| No Children | 104 (100.0%) | 0 (0.0%) |
| 1 or 2 Children | 39 (70.9%) | 16 (29.1%) |
| 3 or 4 Children | 0 (0.0%) | 0 (0.0%) |
| 5 or more Children | 0 (0.0%) | 14 (100.0%) |
| Total | 143 (82.7%) | 30 (17.3%) |
Income Below Poverty Among Single-Parent Households in Nellieburg
According to the poverty data in Nellieburg, 100.0% or 71 single-father households and 41.5% or 22 single-mother households are living below the poverty line. Among single-father households, those with 1 or 2 children have the highest poverty rate, with 71 households (100.0%) experiencing poverty. Likewise, among single-mother households, those with 1 or 2 children have the highest poverty rate, with 6 households (100.0%) falling below the poverty line.
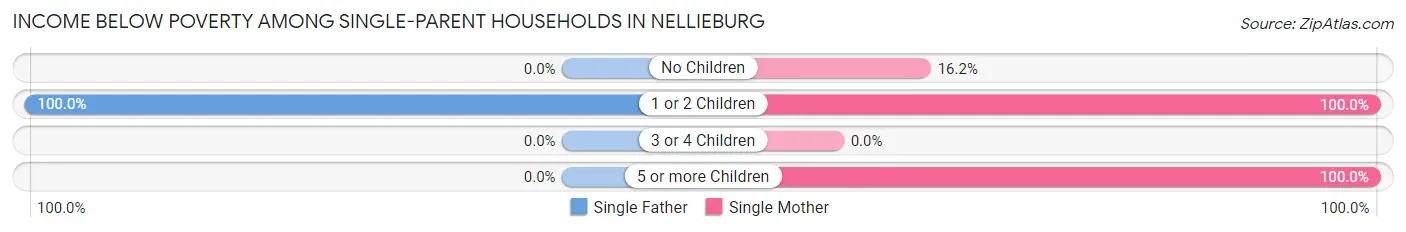
| Children | Single Father | Single Mother |
| No Children | 0 (0.0%) | 6 (16.2%) |
| 1 or 2 Children | 71 (100.0%) | 6 (100.0%) |
| 3 or 4 Children | 0 (0.0%) | 0 (0.0%) |
| 5 or more Children | 0 (0.0%) | 10 (100.0%) |
| Total | 71 (100.0%) | 22 (41.5%) |
Income Below Poverty Among Married-Couple vs Single-Parent Households in Nellieburg
The poverty data for Nellieburg shows that 30 of the married-couple family households (17.3%) and 93 of the single-parent households (75.0%) are living below the poverty level. Within the married-couple family households, those with 5 or more children have the highest poverty rate, with 14 households (100.0%) falling below the poverty line. Among the single-parent households, those with 1 or 2 children have the highest poverty rate, with 77 household (100.0%) living below poverty.
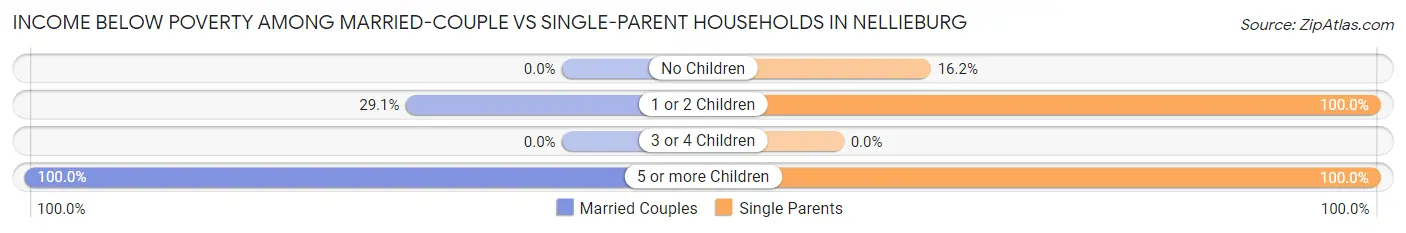
| Children | Married-Couple Families | Single-Parent Households |
| No Children | 0 (0.0%) | 6 (16.2%) |
| 1 or 2 Children | 16 (29.1%) | 77 (100.0%) |
| 3 or 4 Children | 0 (0.0%) | 0 (0.0%) |
| 5 or more Children | 14 (100.0%) | 10 (100.0%) |
| Total | 30 (17.3%) | 93 (75.0%) |
Race in Nellieburg
The most populous races in Nellieburg are White / Caucasian (907 | 68.7%), Black / African American (396 | 30.0%), and Asian (18 | 1.4%).
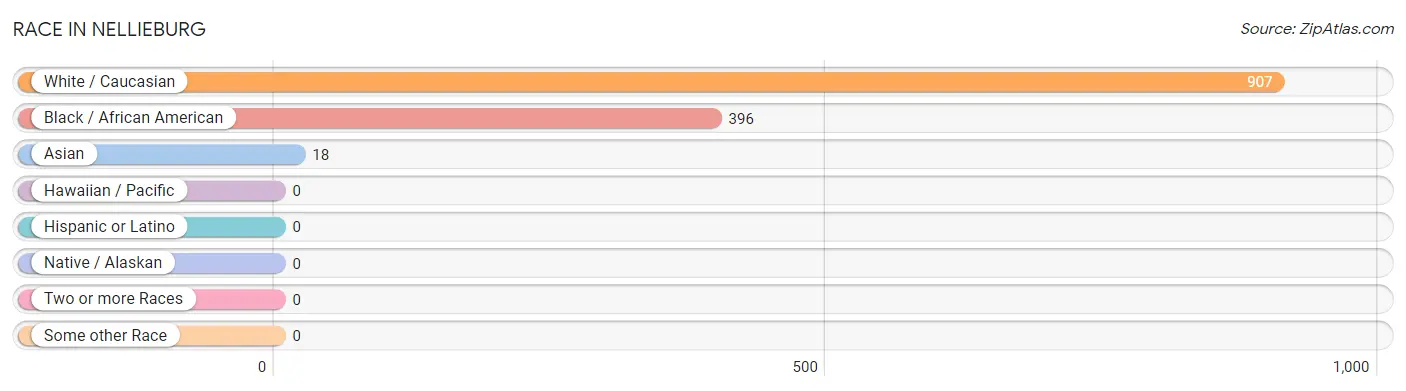
| Race | # Population | % Population |
| Asian | 18 | 1.4% |
| Black / African American | 396 | 30.0% |
| Hawaiian / Pacific | 0 | 0.0% |
| Hispanic or Latino | 0 | 0.0% |
| Native / Alaskan | 0 | 0.0% |
| White / Caucasian | 907 | 68.7% |
| Two or more Races | 0 | 0.0% |
| Some other Race | 0 | 0.0% |
| Total | 1,321 | 100.0% |
Ancestry in Nellieburg
The most populous ancestries reported in Nellieburg are Irish (200 | 15.1%), English (158 | 12.0%), American (122 | 9.2%), German (71 | 5.4%), and Scotch-Irish (25 | 1.9%), together accounting for 43.6% of all Nellieburg residents.
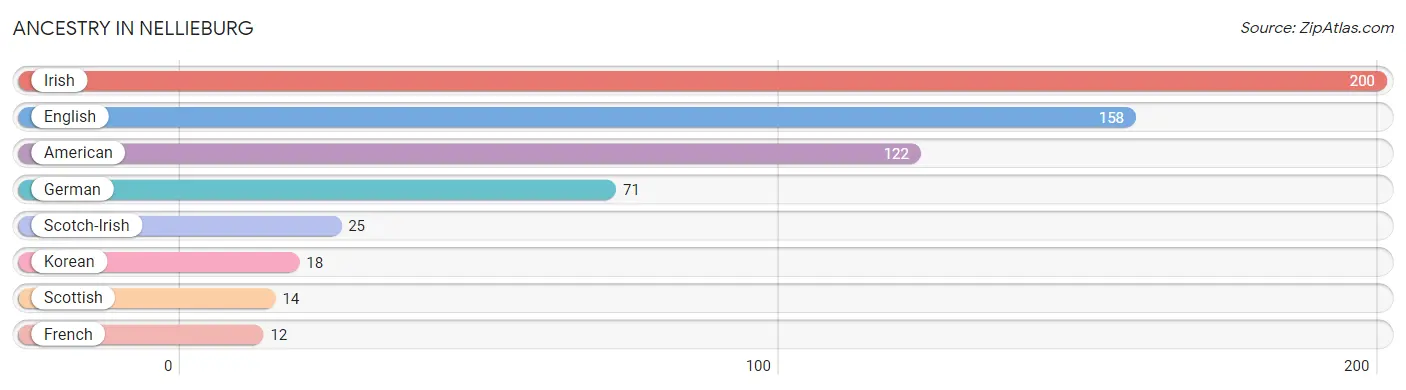
| Ancestry | # Population | % Population |
| American | 122 | 9.2% |
| English | 158 | 12.0% |
| French | 12 | 0.9% |
| German | 71 | 5.4% |
| Irish | 200 | 15.1% |
| Korean | 18 | 1.4% |
| Scotch-Irish | 25 | 1.9% |
| Scottish | 14 | 1.1% | View All 8 Rows |
Immigrants in Nellieburg
The most numerous immigrant groups reported in Nellieburg came from Asia (8 | 0.6%), Philippines (8 | 0.6%), and South Eastern Asia (8 | 0.6%), together accounting for 1.8% of all Nellieburg residents.
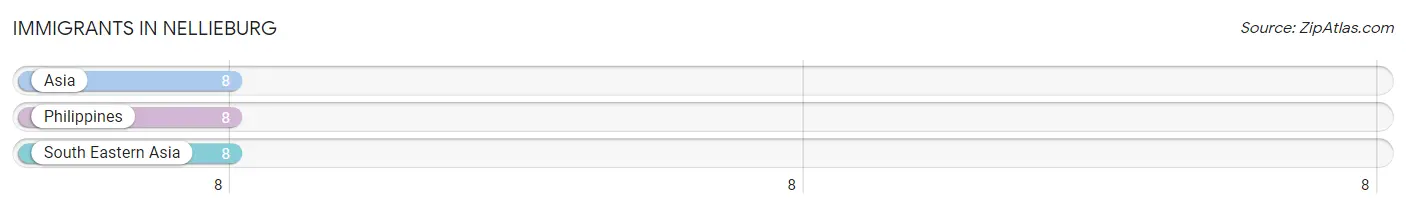
| Immigration Origin | # Population | % Population |
| Asia | 8 | 0.6% |
| Philippines | 8 | 0.6% |
| South Eastern Asia | 8 | 0.6% | View All 3 Rows |
Sex and Age in Nellieburg
Sex and Age in Nellieburg
The most populous age groups in Nellieburg are 40 to 44 Years (125 | 20.8%) for men and 15 to 19 Years (108 | 15.0%) for women.
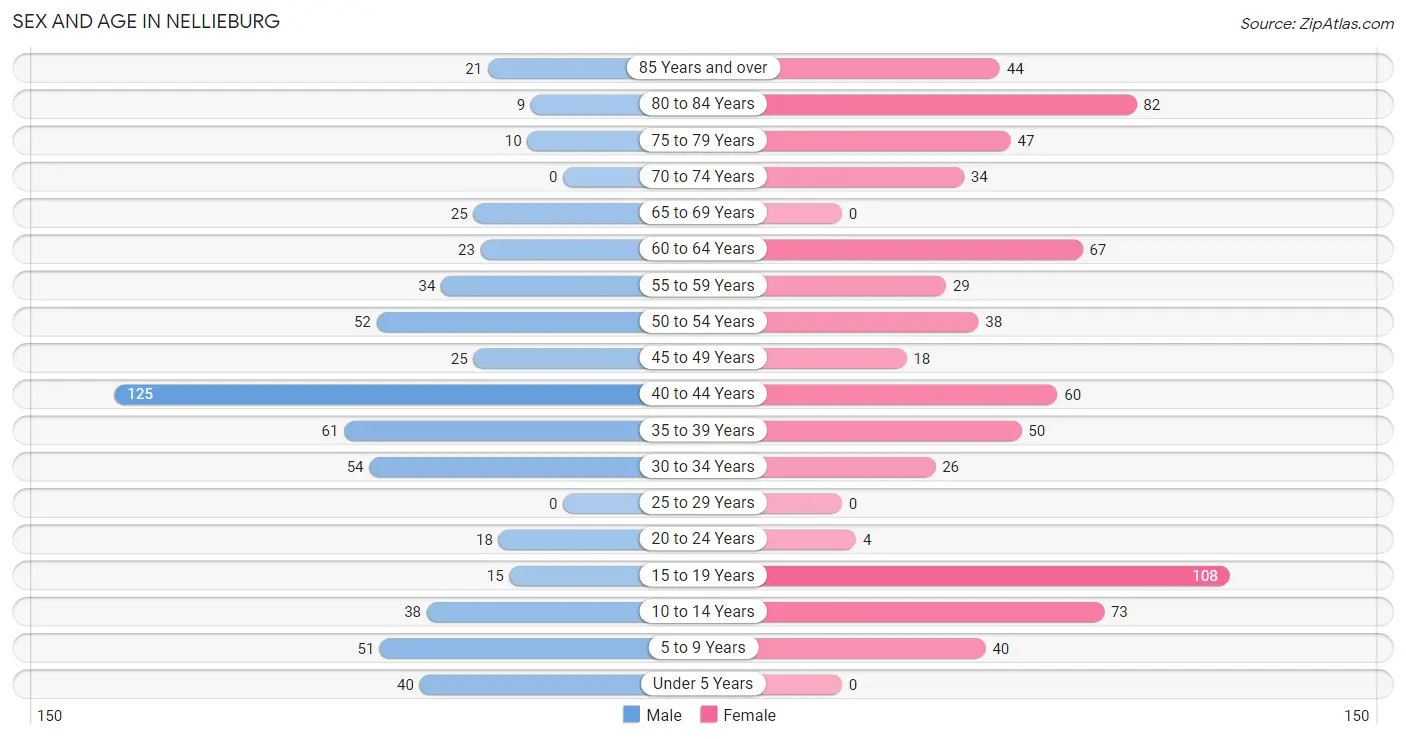
| Age Bracket | Male | Female |
| Under 5 Years | 40 (6.7%) | 0 (0.0%) |
| 5 to 9 Years | 51 (8.5%) | 40 (5.6%) |
| 10 to 14 Years | 38 (6.3%) | 73 (10.1%) |
| 15 to 19 Years | 15 (2.5%) | 108 (15.0%) |
| 20 to 24 Years | 18 (3.0%) | 4 (0.6%) |
| 25 to 29 Years | 0 (0.0%) | 0 (0.0%) |
| 30 to 34 Years | 54 (9.0%) | 26 (3.6%) |
| 35 to 39 Years | 61 (10.2%) | 50 (6.9%) |
| 40 to 44 Years | 125 (20.8%) | 60 (8.3%) |
| 45 to 49 Years | 25 (4.2%) | 18 (2.5%) |
| 50 to 54 Years | 52 (8.6%) | 38 (5.3%) |
| 55 to 59 Years | 34 (5.7%) | 29 (4.0%) |
| 60 to 64 Years | 23 (3.8%) | 67 (9.3%) |
| 65 to 69 Years | 25 (4.2%) | 0 (0.0%) |
| 70 to 74 Years | 0 (0.0%) | 34 (4.7%) |
| 75 to 79 Years | 10 (1.7%) | 47 (6.5%) |
| 80 to 84 Years | 9 (1.5%) | 82 (11.4%) |
| 85 Years and over | 21 (3.5%) | 44 (6.1%) |
| Total | 601 (100.0%) | 720 (100.0%) |
Families and Households in Nellieburg
Median Family Size in Nellieburg
The median family size in Nellieburg is 3.15 persons per family, with married-couple families (173 | 58.3%) accounting for the largest median family size of 3.5 persons per family. On the other hand, single male/father families (71 | 23.9%) represent the smallest median family size with 2.31 persons per family.
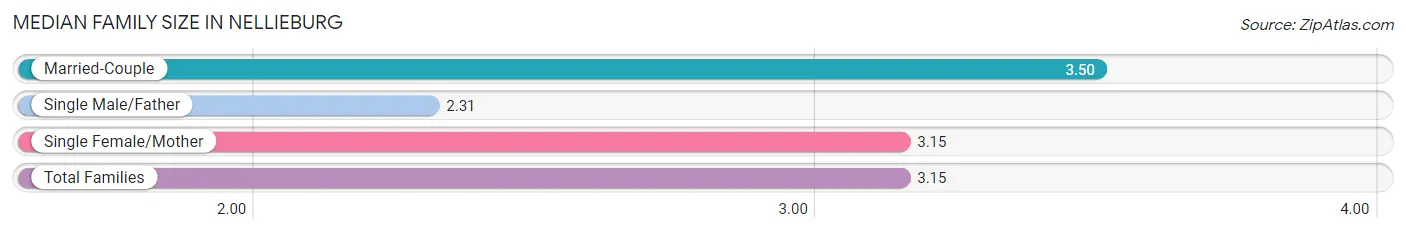
| Family Type | # Families | Family Size |
| Married-Couple | 173 (58.3%) | 3.50 |
| Single Male/Father | 71 (23.9%) | 2.31 |
| Single Female/Mother | 53 (17.8%) | 3.15 |
| Total Families | 297 (100.0%) | 3.15 |
Median Household Size in Nellieburg
The median household size in Nellieburg is 2.52 persons per household, with single female/mother households (53 | 11.6%) accounting for the largest median household size of 3.62 persons per household. non-family households (162 | 35.3%) represent the smallest median household size with 1.20 persons per household.
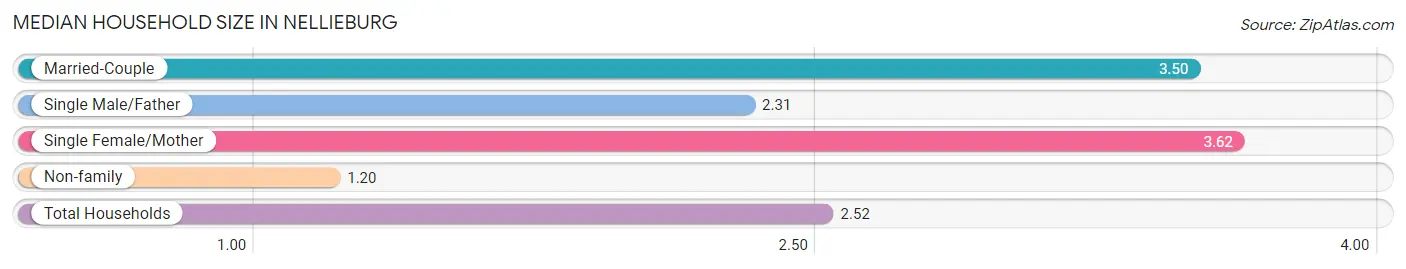
| Household Type | # Households | Household Size |
| Married-Couple | 173 (37.7%) | 3.50 |
| Single Male/Father | 71 (15.5%) | 2.31 |
| Single Female/Mother | 53 (11.6%) | 3.62 |
| Non-family | 162 (35.3%) | 1.20 |
| Total Households | 459 (100.0%) | 2.52 |
Household Size by Marriage Status in Nellieburg
Out of a total of 459 households in Nellieburg, 297 (64.7%) are family households, while 162 (35.3%) are nonfamily households. The most numerous type of family households are 2-person households, comprising 157, and the most common type of nonfamily households are 1-person households, comprising 128.
| Household Size | Family Households | Nonfamily Households |
| 1-Person Households | - | 128 (27.9%) |
| 2-Person Households | 157 (34.2%) | 34 (7.4%) |
| 3-Person Households | 66 (14.4%) | 0 (0.0%) |
| 4-Person Households | 50 (10.9%) | 0 (0.0%) |
| 5-Person Households | 0 (0.0%) | 0 (0.0%) |
| 6-Person Households | 10 (2.2%) | 0 (0.0%) |
| 7+ Person Households | 14 (3.0%) | 0 (0.0%) |
| Total | 297 (64.7%) | 162 (35.3%) |
Female Fertility in Nellieburg
Fertility by Age in Nellieburg
| Age Bracket | Women with Births | Births / 1,000 Women |
| 15 to 19 years | 0 (0.0%) | 0.0 |
| 20 to 34 years | 0 (0.0%) | 0.0 |
| 35 to 50 years | 0 (0.0%) | 0.0 |
| Total | 0 (0.0%) | 0.0 |
Fertility by Age by Marriage Status in Nellieburg
| Age Bracket | Married | Unmarried |
| 15 to 19 years | 0 (0.0%) | 0 (0.0%) |
| 20 to 34 years | 0 (0.0%) | 0 (0.0%) |
| 35 to 50 years | 0 (0.0%) | 0 (0.0%) |
| Total | 0 (0.0%) | 0 (0.0%) |
Fertility by Education in Nellieburg
| Educational Attainment | Women with Births | Births / 1,000 Women |
| Less than High School | 0 (0.0%) | 0.0 |
| High School Diploma | 0 (0.0%) | 0.0 |
| College or Associate's Degree | 0 (0.0%) | 0.0 |
| Bachelor's Degree | 0 (0.0%) | 0.0 |
| Graduate Degree | 0 (0.0%) | 0.0 |
| Total | 0 (0.0%) | 0.0 |
Fertility by Education by Marriage Status in Nellieburg
| Educational Attainment | Married | Unmarried |
| Less than High School | 0 (0.0%) | 0 (0.0%) |
| High School Diploma | 0 (0.0%) | 0 (0.0%) |
| College or Associate's Degree | 0 (0.0%) | 0 (0.0%) |
| Bachelor's Degree | 0 (0.0%) | 0 (0.0%) |
| Graduate Degree | 0 (0.0%) | 0 (0.0%) |
| Total | 0 (0.0%) | 0 (0.0%) |
Employment Characteristics in Nellieburg
Employment by Class of Employer in Nellieburg
Among the 480 employed individuals in Nellieburg, private company employees (328 | 68.3%), local government employees (57 | 11.9%), and not-for-profit organizations (50 | 10.4%) make up the most common classes of employment.
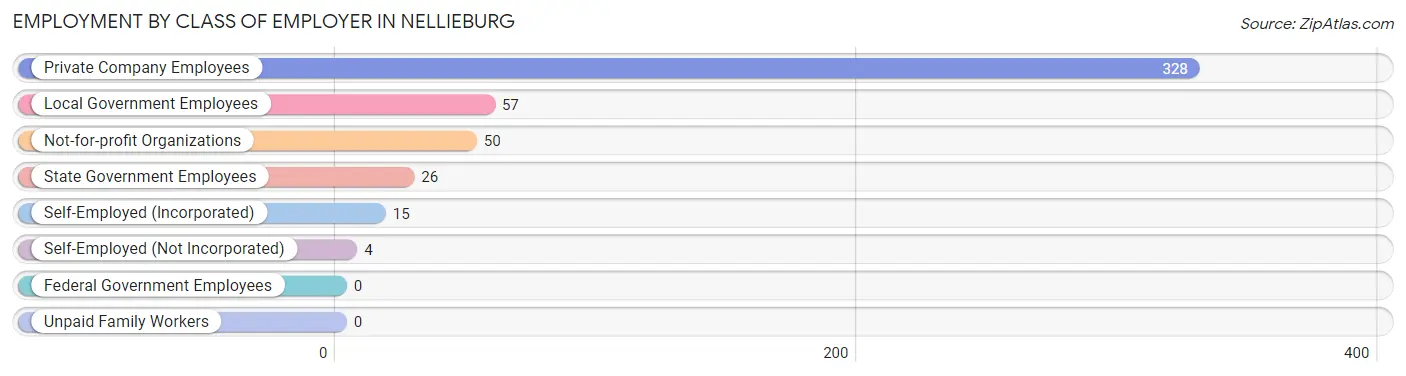
| Employer Class | # Employees | % Employees |
| Private Company Employees | 328 | 68.3% |
| Self-Employed (Incorporated) | 15 | 3.1% |
| Self-Employed (Not Incorporated) | 4 | 0.8% |
| Not-for-profit Organizations | 50 | 10.4% |
| Local Government Employees | 57 | 11.9% |
| State Government Employees | 26 | 5.4% |
| Federal Government Employees | 0 | 0.0% |
| Unpaid Family Workers | 0 | 0.0% |
| Total | 480 | 100.0% |
Employment Status by Age in Nellieburg
According to the labor force statistics for Nellieburg, out of the total population over 16 years of age (1,079), 46.2% or 498 individuals are in the labor force, with 3.6% or 18 of them unemployed. The age group with the highest labor force participation rate is 35 to 44 years, with 83.4% or 247 individuals in the labor force. Within the labor force, the 45 to 54 years age range has the highest percentage of unemployed individuals, with 26.1% or 18 of them being unemployed.
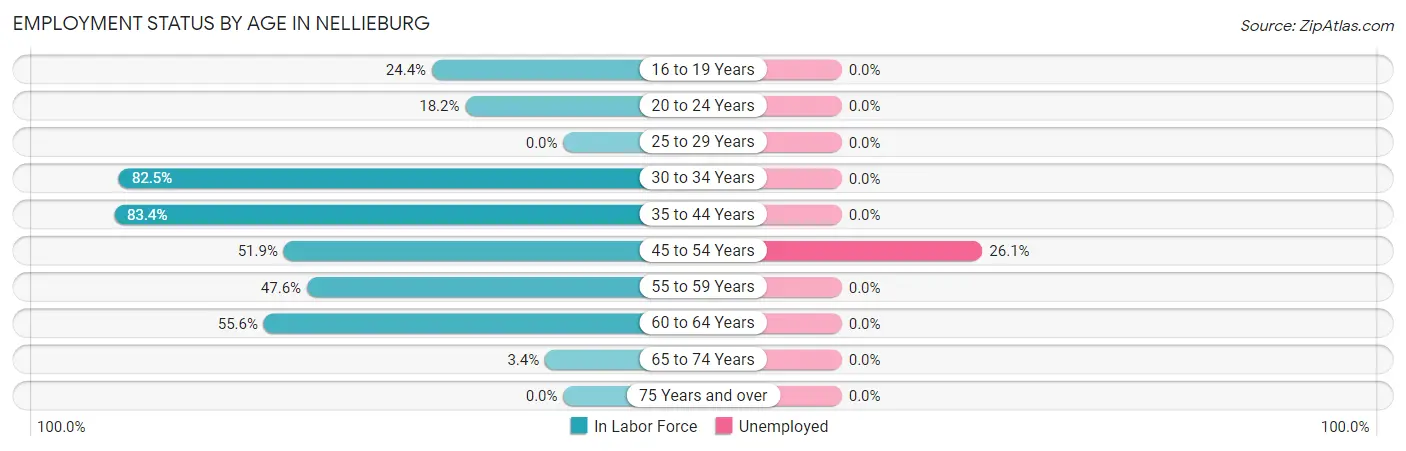
| Age Bracket | In Labor Force | Unemployed |
| 16 to 19 Years | 30 (24.4%) | 0 (0.0%) |
| 20 to 24 Years | 4 (18.2%) | 0 (0.0%) |
| 25 to 29 Years | 0 (0.0%) | 0 (0.0%) |
| 30 to 34 Years | 66 (82.5%) | 0 (0.0%) |
| 35 to 44 Years | 247 (83.4%) | 0 (0.0%) |
| 45 to 54 Years | 69 (51.9%) | 18 (26.1%) |
| 55 to 59 Years | 30 (47.6%) | 0 (0.0%) |
| 60 to 64 Years | 50 (55.6%) | 0 (0.0%) |
| 65 to 74 Years | 2 (3.4%) | 0 (0.0%) |
| 75 Years and over | 0 (0.0%) | 0 (0.0%) |
| Total | 498 (46.2%) | 18 (3.6%) |
Employment Status by Educational Attainment in Nellieburg
According to labor force statistics for Nellieburg, 69.8% of individuals (462) out of the total population between 25 and 64 years of age (662) are in the labor force, with 3.9% or 18 of them being unemployed. The group with the highest labor force participation rate are those with the educational attainment of high school diploma, with 80.9% or 229 individuals in the labor force. Within the labor force, individuals with college / associate degree education have the highest percentage of unemployment, with 13.1% or 18 of them being unemployed.
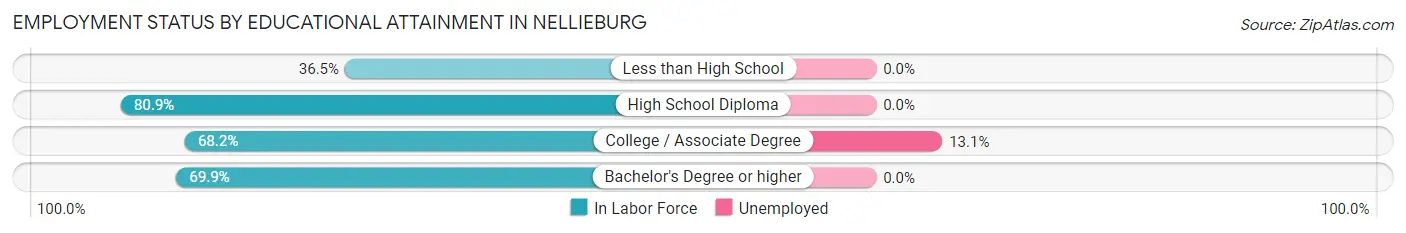
| Educational Attainment | In Labor Force | Unemployed |
| Less than High School | 31 (36.5%) | 0 (0.0%) |
| High School Diploma | 229 (80.9%) | 0 (0.0%) |
| College / Associate Degree | 137 (68.2%) | 26 (13.1%) |
| Bachelor's Degree or higher | 65 (69.9%) | 0 (0.0%) |
| Total | 462 (69.8%) | 26 (3.9%) |
Employment Occupations by Sex in Nellieburg
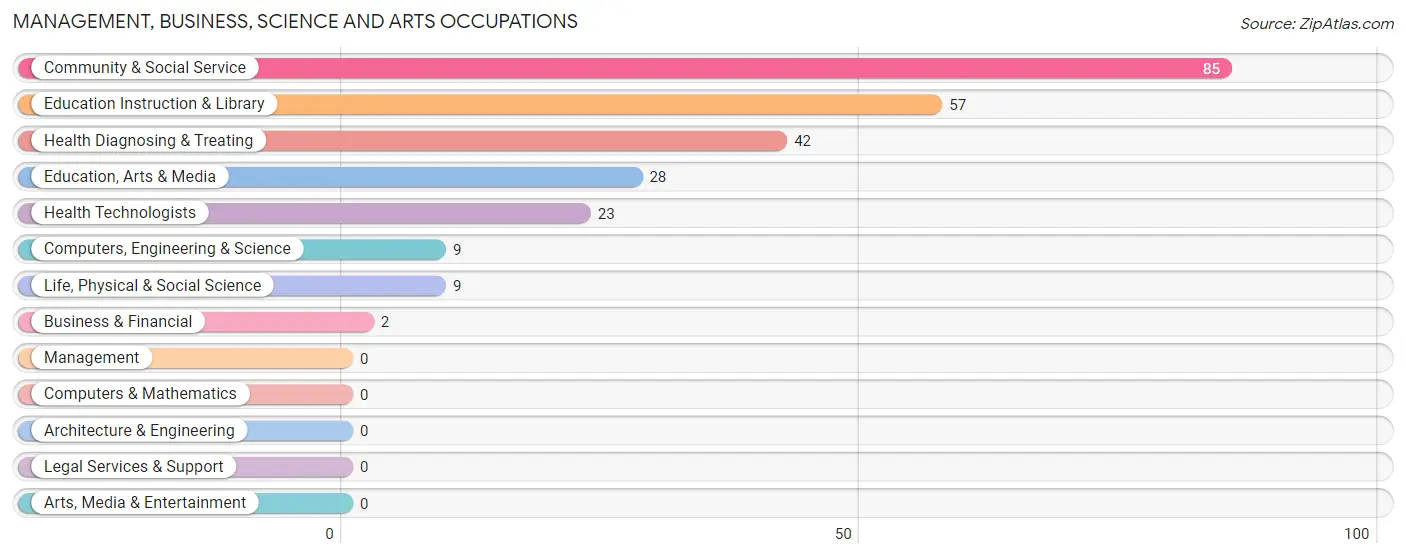
Management, Business, Science and Arts Occupations
The most common Management, Business, Science and Arts occupations in Nellieburg are Community & Social Service (85 | 17.7%), Education Instruction & Library (57 | 11.9%), Health Diagnosing & Treating (42 | 8.7%), Education, Arts & Media (28 | 5.8%), and Health Technologists (23 | 4.8%).
Management, Business, Science and Arts Occupations by Sex
Within the Management, Business, Science and Arts occupations in Nellieburg, the most male-oriented occupations are Health Technologists (82.6%), Business & Financial (50.0%), and Health Diagnosing & Treating (45.2%), while the most female-oriented occupations are Computers, Engineering & Science (100.0%), Life, Physical & Social Science (100.0%), and Education, Arts & Media (100.0%).
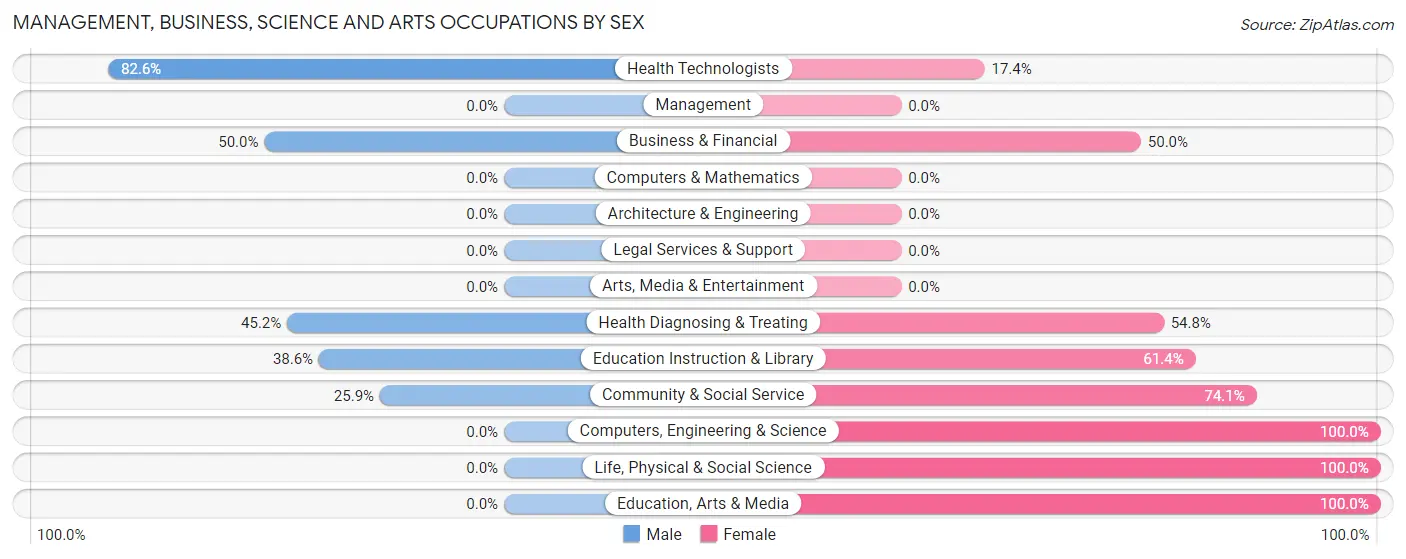
| Occupation | Male | Female |
| Management | 0 (0.0%) | 0 (0.0%) |
| Business & Financial | 1 (50.0%) | 1 (50.0%) |
| Computers, Engineering & Science | 0 (0.0%) | 9 (100.0%) |
| Computers & Mathematics | 0 (0.0%) | 0 (0.0%) |
| Architecture & Engineering | 0 (0.0%) | 0 (0.0%) |
| Life, Physical & Social Science | 0 (0.0%) | 9 (100.0%) |
| Community & Social Service | 22 (25.9%) | 63 (74.1%) |
| Education, Arts & Media | 0 (0.0%) | 28 (100.0%) |
| Legal Services & Support | 0 (0.0%) | 0 (0.0%) |
| Education Instruction & Library | 22 (38.6%) | 35 (61.4%) |
| Arts, Media & Entertainment | 0 (0.0%) | 0 (0.0%) |
| Health Diagnosing & Treating | 19 (45.2%) | 23 (54.8%) |
| Health Technologists | 19 (82.6%) | 4 (17.4%) |
| Total (Category) | 42 (30.4%) | 96 (69.6%) |
| Total (Overall) | 277 (57.7%) | 203 (42.3%) |
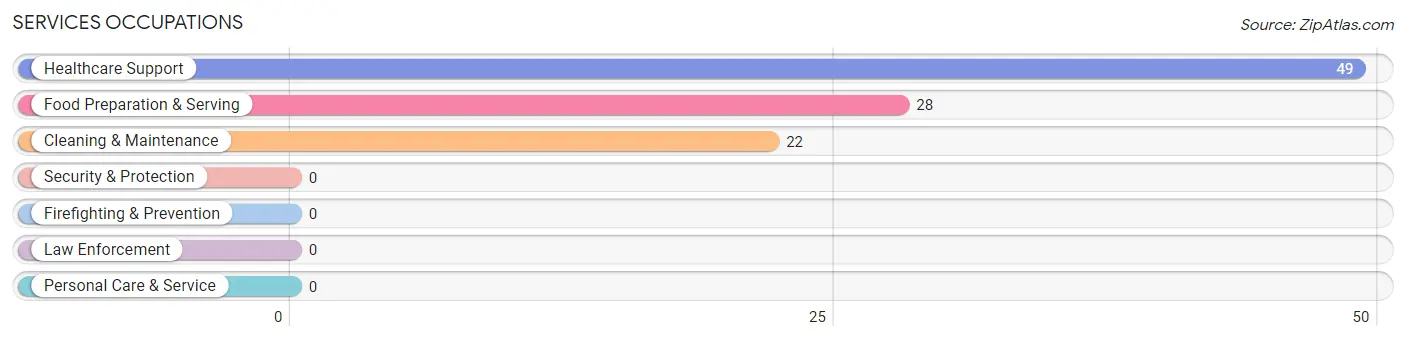
Services Occupations
The most common Services occupations in Nellieburg are Healthcare Support (49 | 10.2%), Food Preparation & Serving (28 | 5.8%), and Cleaning & Maintenance (22 | 4.6%).
Services Occupations by Sex
Within the Services occupations in Nellieburg, the most male-oriented occupations are Cleaning & Maintenance (100.0%), Healthcare Support (61.2%), and Food Preparation & Serving (53.6%), while the most female-oriented occupations are Food Preparation & Serving (46.4%), and Healthcare Support (38.8%).
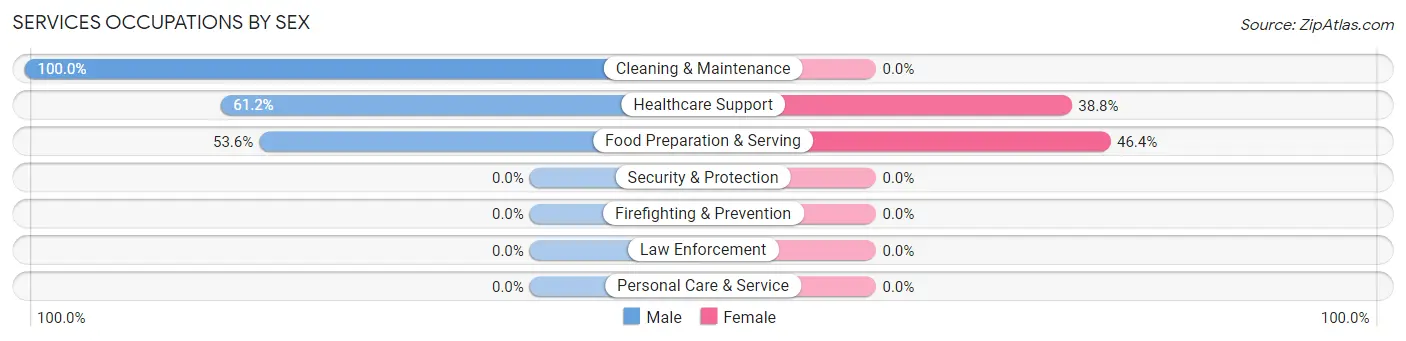
| Occupation | Male | Female |
| Healthcare Support | 30 (61.2%) | 19 (38.8%) |
| Security & Protection | 0 (0.0%) | 0 (0.0%) |
| Firefighting & Prevention | 0 (0.0%) | 0 (0.0%) |
| Law Enforcement | 0 (0.0%) | 0 (0.0%) |
| Food Preparation & Serving | 15 (53.6%) | 13 (46.4%) |
| Cleaning & Maintenance | 22 (100.0%) | 0 (0.0%) |
| Personal Care & Service | 0 (0.0%) | 0 (0.0%) |
| Total (Category) | 67 (67.7%) | 32 (32.3%) |
| Total (Overall) | 277 (57.7%) | 203 (42.3%) |
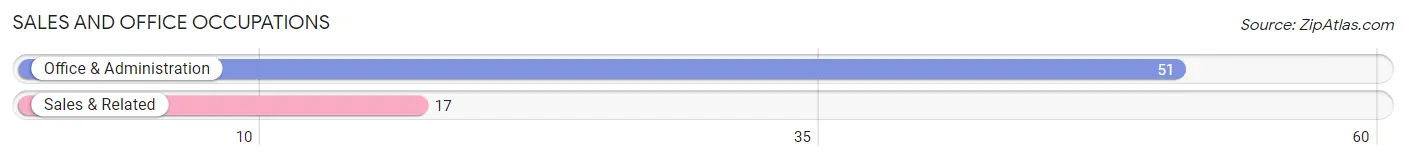
Sales and Office Occupations
The most common Sales and Office occupations in Nellieburg are Office & Administration (51 | 10.6%), and Sales & Related (17 | 3.5%).
Sales and Office Occupations by Sex
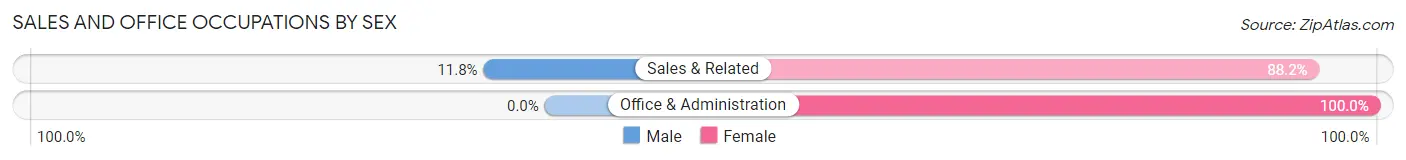
| Occupation | Male | Female |
| Sales & Related | 2 (11.8%) | 15 (88.2%) |
| Office & Administration | 0 (0.0%) | 51 (100.0%) |
| Total (Category) | 2 (2.9%) | 66 (97.1%) |
| Total (Overall) | 277 (57.7%) | 203 (42.3%) |
Natural Resources, Construction and Maintenance Occupations
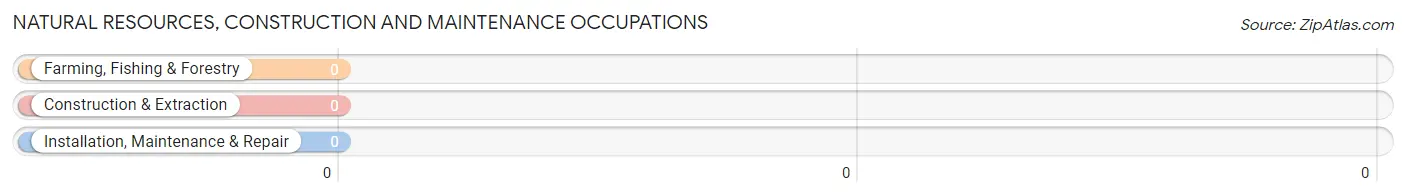
Natural Resources, Construction and Maintenance Occupations by Sex
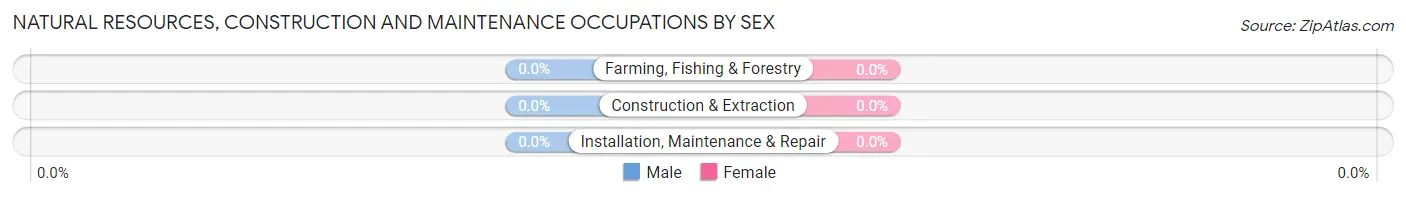
| Occupation | Male | Female |
| Farming, Fishing & Forestry | 0 (0.0%) | 0 (0.0%) |
| Construction & Extraction | 0 (0.0%) | 0 (0.0%) |
| Installation, Maintenance & Repair | 0 (0.0%) | 0 (0.0%) |
| Total (Category) | 0 (0.0%) | 0 (0.0%) |
| Total (Overall) | 277 (57.7%) | 203 (42.3%) |
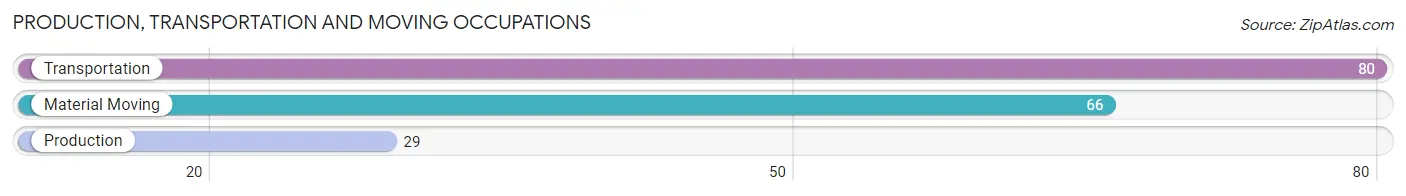
Production, Transportation and Moving Occupations
The most common Production, Transportation and Moving occupations in Nellieburg are Transportation (80 | 16.7%), Material Moving (66 | 13.8%), and Production (29 | 6.0%).
Production, Transportation and Moving Occupations by Sex
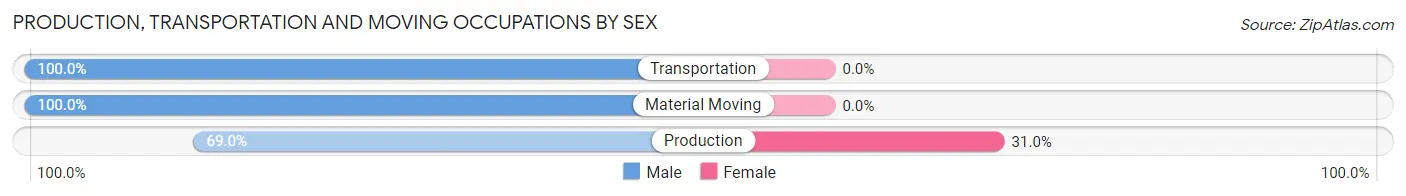
| Occupation | Male | Female |
| Production | 20 (69.0%) | 9 (31.0%) |
| Transportation | 80 (100.0%) | 0 (0.0%) |
| Material Moving | 66 (100.0%) | 0 (0.0%) |
| Total (Category) | 166 (94.9%) | 9 (5.1%) |
| Total (Overall) | 277 (57.7%) | 203 (42.3%) |
Employment Industries by Sex in Nellieburg
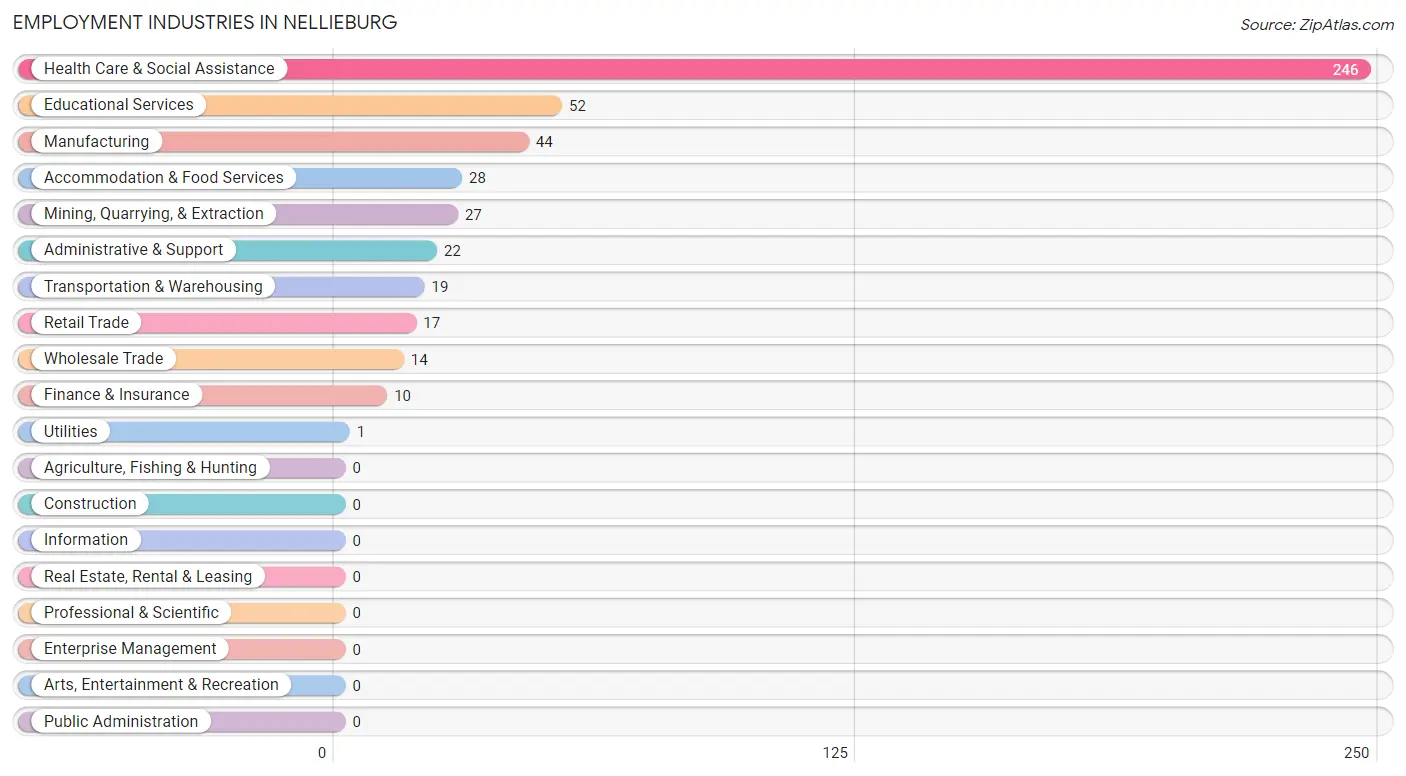
Employment Industries in Nellieburg
The major employment industries in Nellieburg include Health Care & Social Assistance (246 | 51.2%), Educational Services (52 | 10.8%), Manufacturing (44 | 9.2%), Accommodation & Food Services (28 | 5.8%), and Mining, Quarrying, & Extraction (27 | 5.6%).
Employment Industries by Sex in Nellieburg
The Nellieburg industries that see more men than women are Mining, Quarrying, & Extraction (100.0%), Wholesale Trade (100.0%), and Transportation & Warehousing (100.0%), whereas the industries that tend to have a higher number of women are Finance & Insurance (100.0%), Retail Trade (88.2%), and Educational Services (57.7%).
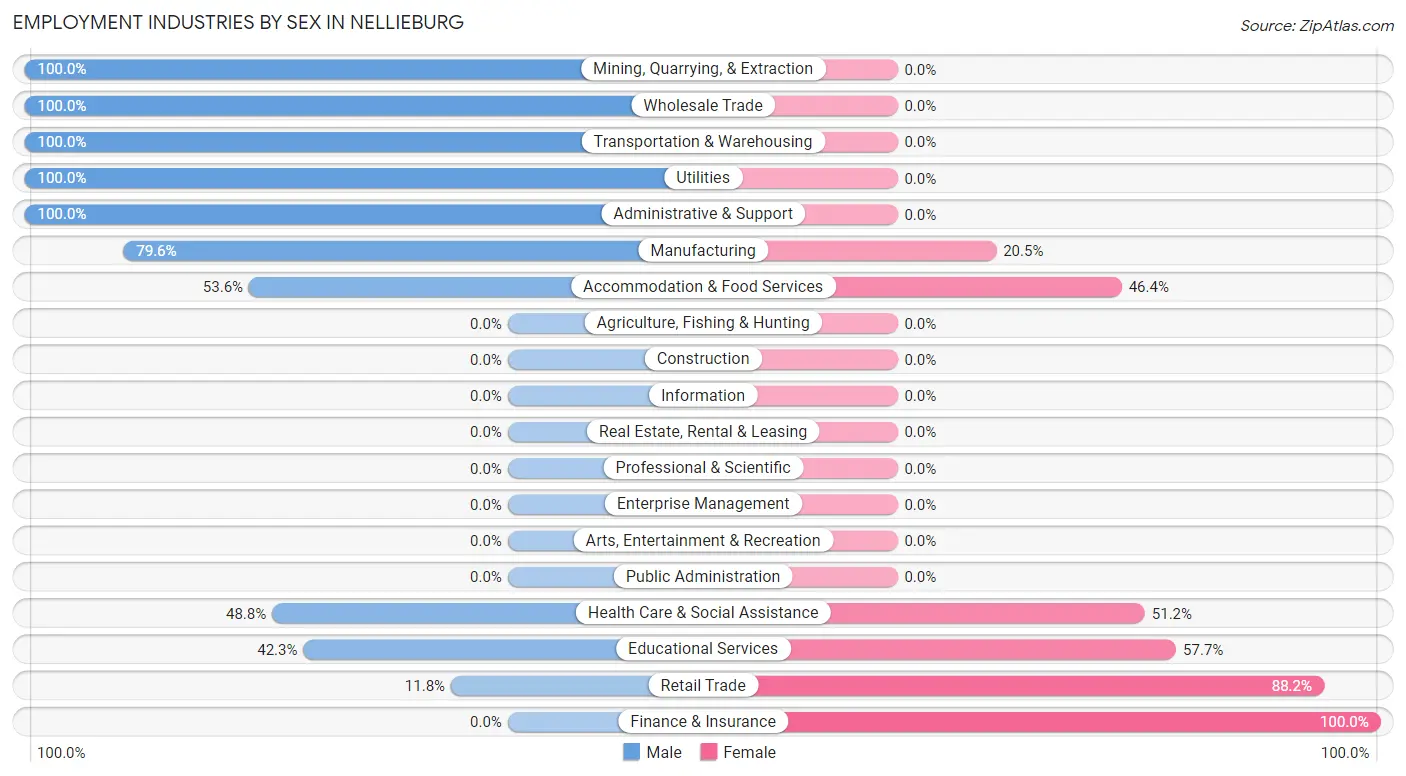
| Industry | Male | Female |
| Agriculture, Fishing & Hunting | 0 (0.0%) | 0 (0.0%) |
| Mining, Quarrying, & Extraction | 27 (100.0%) | 0 (0.0%) |
| Construction | 0 (0.0%) | 0 (0.0%) |
| Manufacturing | 35 (79.5%) | 9 (20.4%) |
| Wholesale Trade | 14 (100.0%) | 0 (0.0%) |
| Retail Trade | 2 (11.8%) | 15 (88.2%) |
| Transportation & Warehousing | 19 (100.0%) | 0 (0.0%) |
| Utilities | 1 (100.0%) | 0 (0.0%) |
| Information | 0 (0.0%) | 0 (0.0%) |
| Finance & Insurance | 0 (0.0%) | 10 (100.0%) |
| Real Estate, Rental & Leasing | 0 (0.0%) | 0 (0.0%) |
| Professional & Scientific | 0 (0.0%) | 0 (0.0%) |
| Enterprise Management | 0 (0.0%) | 0 (0.0%) |
| Administrative & Support | 22 (100.0%) | 0 (0.0%) |
| Educational Services | 22 (42.3%) | 30 (57.7%) |
| Health Care & Social Assistance | 120 (48.8%) | 126 (51.2%) |
| Arts, Entertainment & Recreation | 0 (0.0%) | 0 (0.0%) |
| Accommodation & Food Services | 15 (53.6%) | 13 (46.4%) |
| Public Administration | 0 (0.0%) | 0 (0.0%) |
| Total | 277 (57.7%) | 203 (42.3%) |
Education in Nellieburg
School Enrollment in Nellieburg
The most common levels of schooling among the 383 students in Nellieburg are high school (123 | 32.1%), middle school (104 | 27.2%), and elementary school (98 | 25.6%).
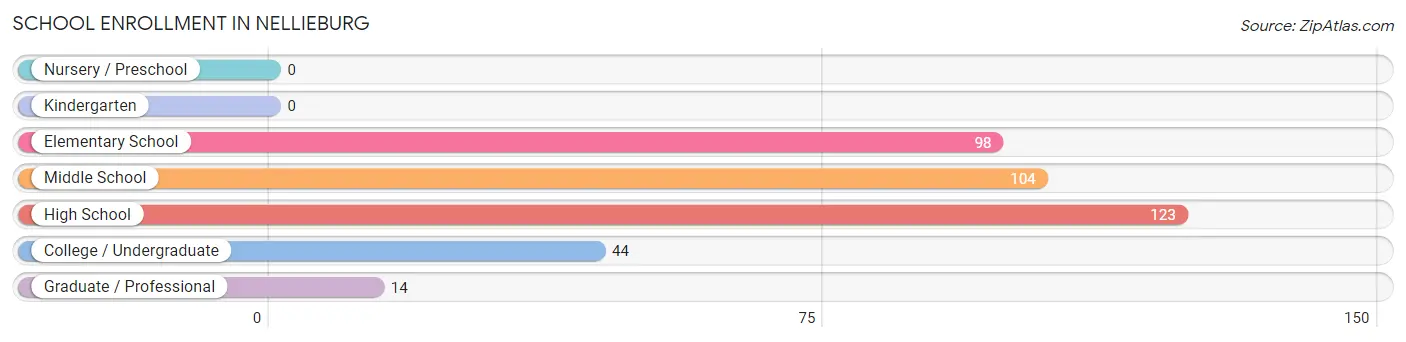
| School Level | # Students | % Students |
| Nursery / Preschool | 0 | 0.0% |
| Kindergarten | 0 | 0.0% |
| Elementary School | 98 | 25.6% |
| Middle School | 104 | 27.2% |
| High School | 123 | 32.1% |
| College / Undergraduate | 44 | 11.5% |
| Graduate / Professional | 14 | 3.7% |
| Total | 383 | 100.0% |
School Enrollment by Age by Funding Source in Nellieburg
Out of a total of 383 students who are enrolled in schools in Nellieburg, 51 (13.3%) attend a private institution, while the remaining 332 (86.7%) are enrolled in public schools. The age group of 35 years and over has the highest likelihood of being enrolled in private schools, with 14 (50.0% in the age bracket) enrolled. Conversely, the age group of 15 to 17 year olds has the lowest likelihood of being enrolled in a private school, with 108 (100.0% in the age bracket) attending a public institution.
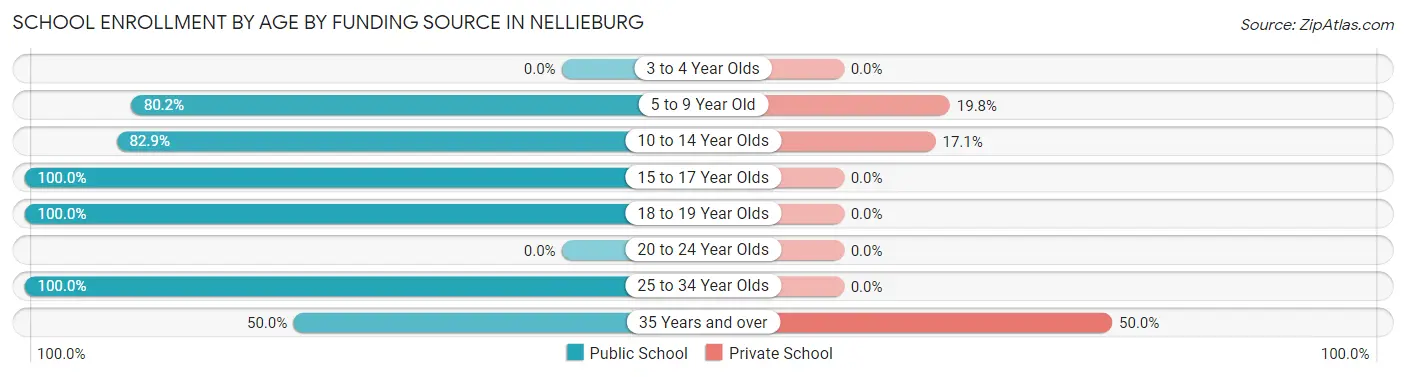
| Age Bracket | Public School | Private School |
| 3 to 4 Year Olds | 0 (0.0%) | 0 (0.0%) |
| 5 to 9 Year Old | 73 (80.2%) | 18 (19.8%) |
| 10 to 14 Year Olds | 92 (82.9%) | 19 (17.1%) |
| 15 to 17 Year Olds | 108 (100.0%) | 0 (0.0%) |
| 18 to 19 Year Olds | 15 (100.0%) | 0 (0.0%) |
| 20 to 24 Year Olds | 0 (0.0%) | 0 (0.0%) |
| 25 to 34 Year Olds | 30 (100.0%) | 0 (0.0%) |
| 35 Years and over | 14 (50.0%) | 14 (50.0%) |
| Total | 332 (86.7%) | 51 (13.3%) |
Educational Attainment by Field of Study in Nellieburg
Education (28 | 23.0%), arts & humanities (20 | 16.4%), business (16 | 13.1%), computers & mathematics (14 | 11.5%), and liberal arts & history (14 | 11.5%) are the most common fields of study among 122 individuals in Nellieburg who have obtained a bachelor's degree or higher.
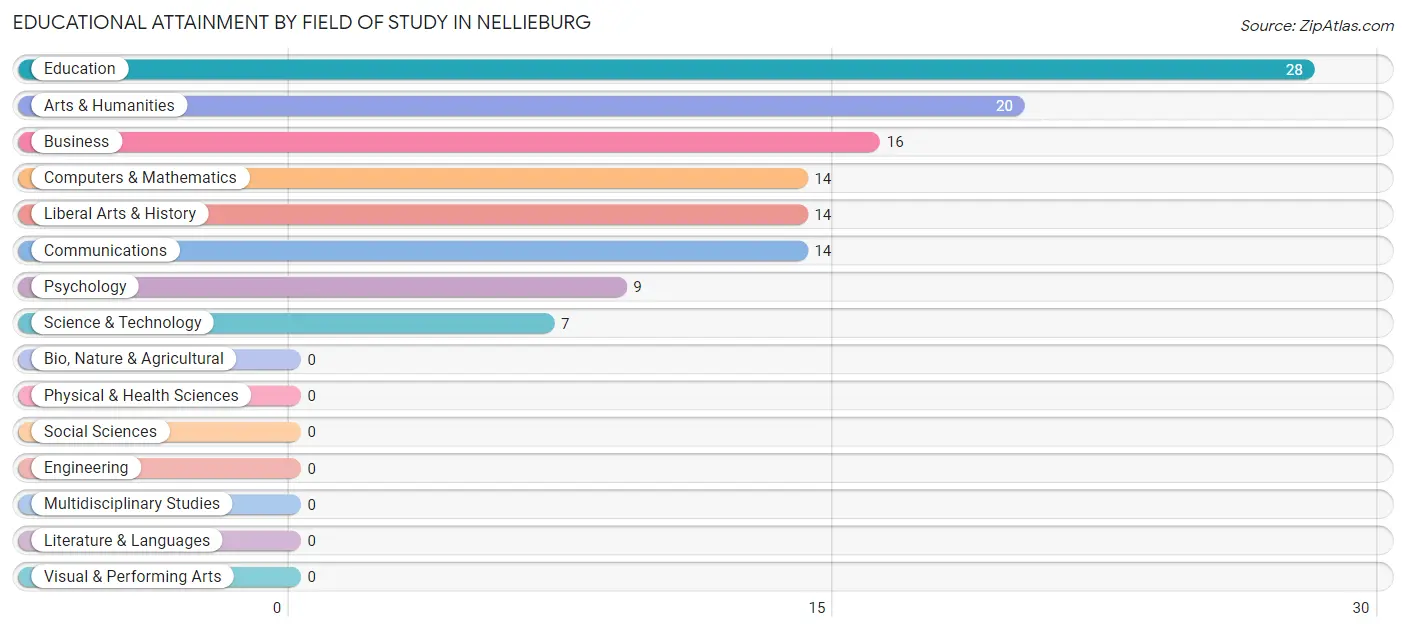
| Field of Study | # Graduates | % Graduates |
| Computers & Mathematics | 14 | 11.5% |
| Bio, Nature & Agricultural | 0 | 0.0% |
| Physical & Health Sciences | 0 | 0.0% |
| Psychology | 9 | 7.4% |
| Social Sciences | 0 | 0.0% |
| Engineering | 0 | 0.0% |
| Multidisciplinary Studies | 0 | 0.0% |
| Science & Technology | 7 | 5.7% |
| Business | 16 | 13.1% |
| Education | 28 | 23.0% |
| Literature & Languages | 0 | 0.0% |
| Liberal Arts & History | 14 | 11.5% |
| Visual & Performing Arts | 0 | 0.0% |
| Communications | 14 | 11.5% |
| Arts & Humanities | 20 | 16.4% |
| Total | 122 | 100.0% |
Transportation & Commute in Nellieburg
Vehicle Availability by Sex in Nellieburg
The most prevalent vehicle ownership categories in Nellieburg are males with 3 vehicles (178, accounting for 66.7%) and females with 3 vehicles (73, making up 93.2%).
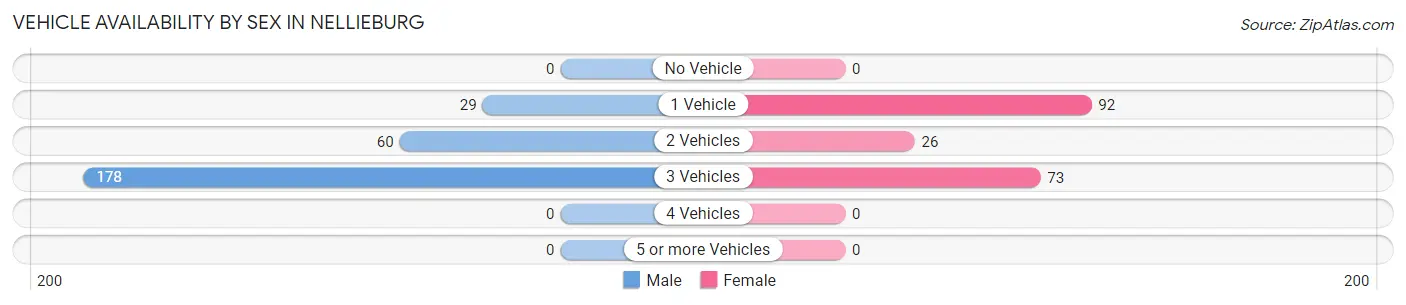
| Vehicles Available | Male | Female |
| No Vehicle | 0 (0.0%) | 0 (0.0%) |
| 1 Vehicle | 29 (10.9%) | 92 (48.2%) |
| 2 Vehicles | 60 (22.5%) | 26 (13.6%) |
| 3 Vehicles | 178 (66.7%) | 73 (38.2%) |
| 4 Vehicles | 0 (0.0%) | 0 (0.0%) |
| 5 or more Vehicles | 0 (0.0%) | 0 (0.0%) |
| Total | 267 (100.0%) | 191 (100.0%) |
Commute Time in Nellieburg
The most frequently occuring commute durations in Nellieburg are 10 to 14 minutes (99 commuters, 20.6%), 20 to 24 minutes (96 commuters, 20.0%), and 30 to 34 minutes (85 commuters, 17.7%).
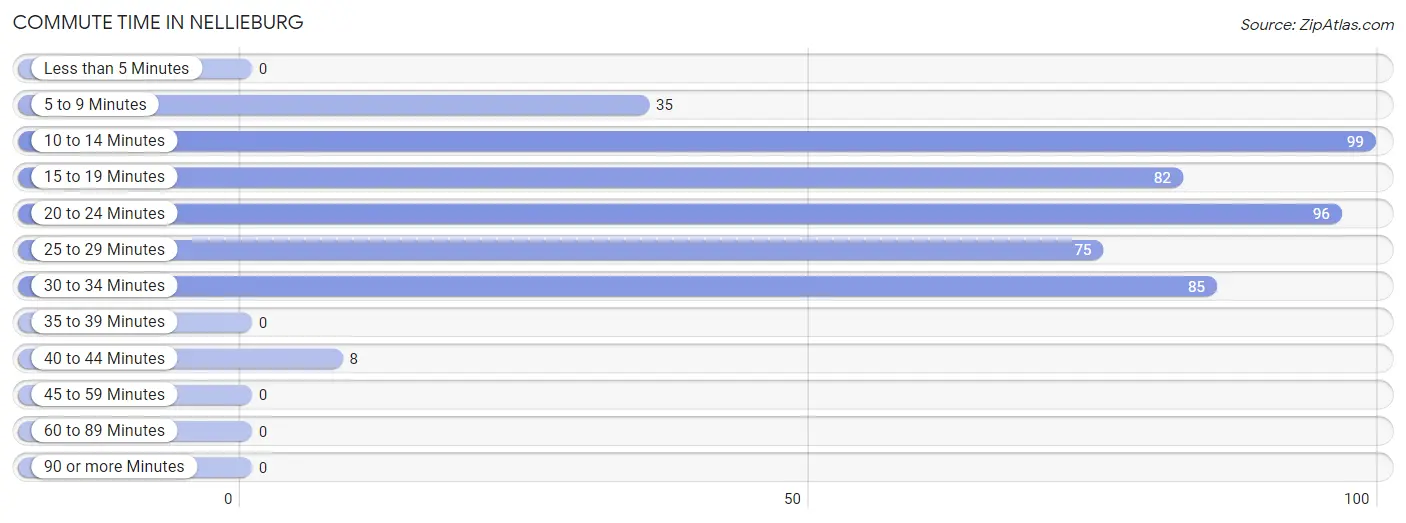
| Commute Time | # Commuters | % Commuters |
| Less than 5 Minutes | 0 | 0.0% |
| 5 to 9 Minutes | 35 | 7.3% |
| 10 to 14 Minutes | 99 | 20.6% |
| 15 to 19 Minutes | 82 | 17.1% |
| 20 to 24 Minutes | 96 | 20.0% |
| 25 to 29 Minutes | 75 | 15.6% |
| 30 to 34 Minutes | 85 | 17.7% |
| 35 to 39 Minutes | 0 | 0.0% |
| 40 to 44 Minutes | 8 | 1.7% |
| 45 to 59 Minutes | 0 | 0.0% |
| 60 to 89 Minutes | 0 | 0.0% |
| 90 or more Minutes | 0 | 0.0% |
Commute Time by Sex in Nellieburg
The most common commute times in Nellieburg are 10 to 14 minutes (90 commuters, 32.5%) for males and 15 to 19 minutes (81 commuters, 39.9%) for females.
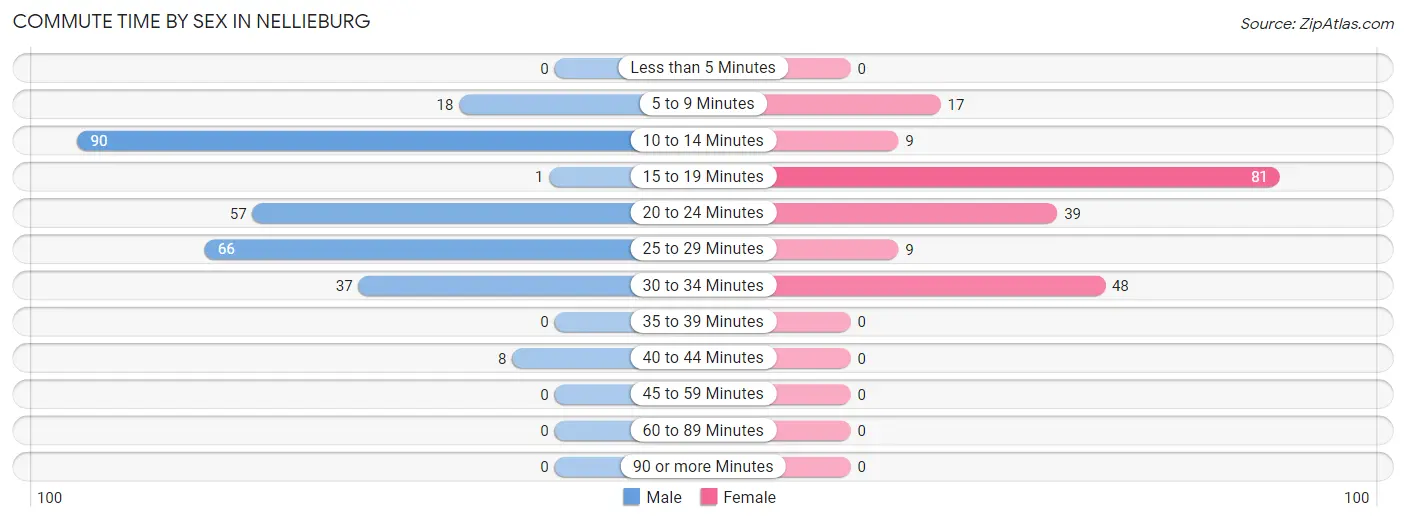
| Commute Time | Male | Female |
| Less than 5 Minutes | 0 (0.0%) | 0 (0.0%) |
| 5 to 9 Minutes | 18 (6.5%) | 17 (8.4%) |
| 10 to 14 Minutes | 90 (32.5%) | 9 (4.4%) |
| 15 to 19 Minutes | 1 (0.4%) | 81 (39.9%) |
| 20 to 24 Minutes | 57 (20.6%) | 39 (19.2%) |
| 25 to 29 Minutes | 66 (23.8%) | 9 (4.4%) |
| 30 to 34 Minutes | 37 (13.4%) | 48 (23.6%) |
| 35 to 39 Minutes | 0 (0.0%) | 0 (0.0%) |
| 40 to 44 Minutes | 8 (2.9%) | 0 (0.0%) |
| 45 to 59 Minutes | 0 (0.0%) | 0 (0.0%) |
| 60 to 89 Minutes | 0 (0.0%) | 0 (0.0%) |
| 90 or more Minutes | 0 (0.0%) | 0 (0.0%) |
Time of Departure to Work by Sex in Nellieburg
The most frequent times of departure to work in Nellieburg are 6:00 AM to 6:29 AM (79, 28.5%) for males and 7:00 AM to 7:29 AM (58, 28.6%) for females.
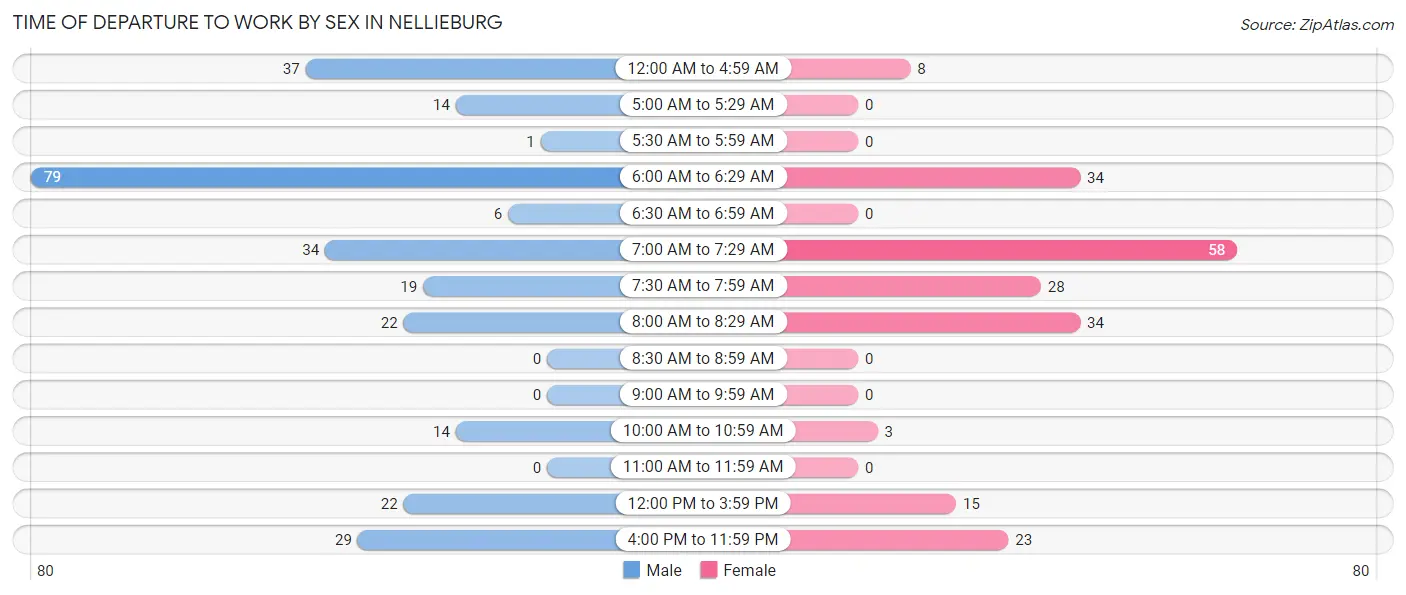
| Time of Departure | Male | Female |
| 12:00 AM to 4:59 AM | 37 (13.4%) | 8 (3.9%) |
| 5:00 AM to 5:29 AM | 14 (5.1%) | 0 (0.0%) |
| 5:30 AM to 5:59 AM | 1 (0.4%) | 0 (0.0%) |
| 6:00 AM to 6:29 AM | 79 (28.5%) | 34 (16.8%) |
| 6:30 AM to 6:59 AM | 6 (2.2%) | 0 (0.0%) |
| 7:00 AM to 7:29 AM | 34 (12.3%) | 58 (28.6%) |
| 7:30 AM to 7:59 AM | 19 (6.9%) | 28 (13.8%) |
| 8:00 AM to 8:29 AM | 22 (7.9%) | 34 (16.8%) |
| 8:30 AM to 8:59 AM | 0 (0.0%) | 0 (0.0%) |
| 9:00 AM to 9:59 AM | 0 (0.0%) | 0 (0.0%) |
| 10:00 AM to 10:59 AM | 14 (5.1%) | 3 (1.5%) |
| 11:00 AM to 11:59 AM | 0 (0.0%) | 0 (0.0%) |
| 12:00 PM to 3:59 PM | 22 (7.9%) | 15 (7.4%) |
| 4:00 PM to 11:59 PM | 29 (10.5%) | 23 (11.3%) |
| Total | 277 (100.0%) | 203 (100.0%) |
Housing Occupancy in Nellieburg
Occupancy by Ownership in Nellieburg
Of the total 459 dwellings in Nellieburg, owner-occupied units account for 350 (76.2%), while renter-occupied units make up 109 (23.7%).
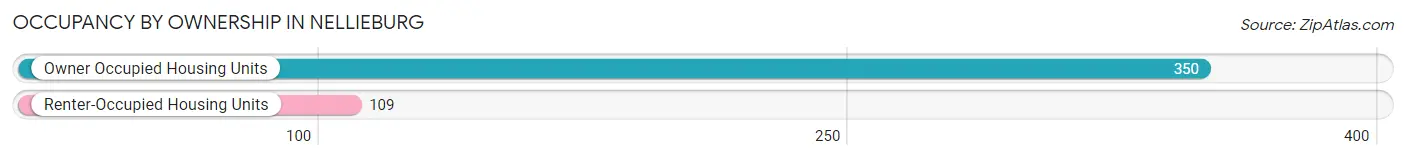
| Occupancy | # Housing Units | % Housing Units |
| Owner Occupied Housing Units | 350 | 76.2% |
| Renter-Occupied Housing Units | 109 | 23.7% |
| Total Occupied Housing Units | 459 | 100.0% |
Occupancy by Household Size in Nellieburg
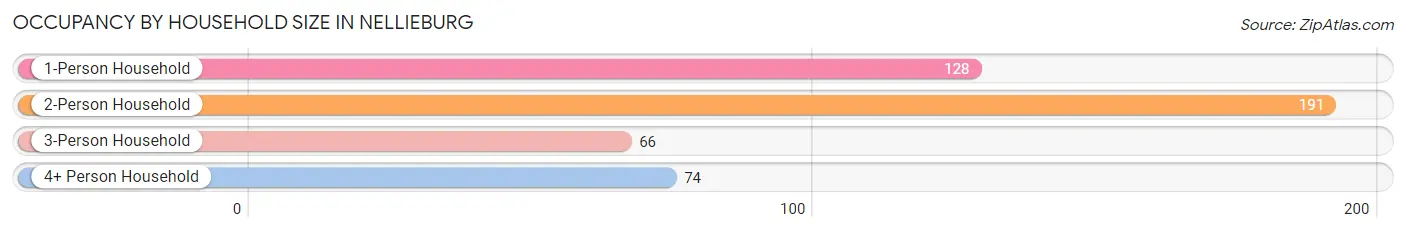
| Household Size | # Housing Units | % Housing Units |
| 1-Person Household | 128 | 27.9% |
| 2-Person Household | 191 | 41.6% |
| 3-Person Household | 66 | 14.4% |
| 4+ Person Household | 74 | 16.1% |
| Total Housing Units | 459 | 100.0% |
Occupancy by Ownership by Household Size in Nellieburg
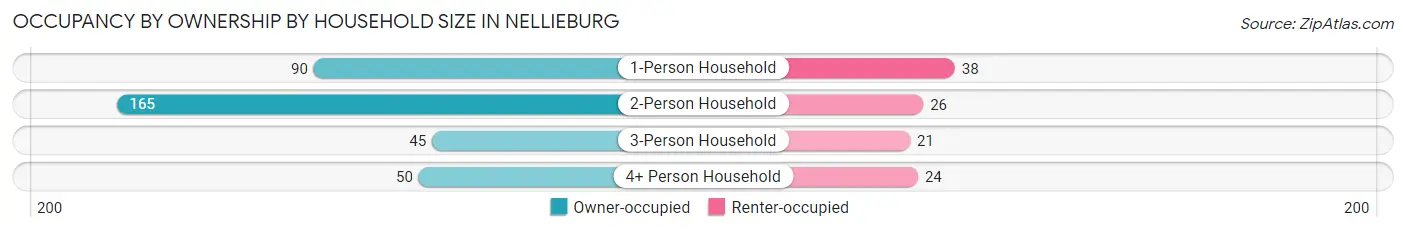
| Household Size | Owner-occupied | Renter-occupied |
| 1-Person Household | 90 (70.3%) | 38 (29.7%) |
| 2-Person Household | 165 (86.4%) | 26 (13.6%) |
| 3-Person Household | 45 (68.2%) | 21 (31.8%) |
| 4+ Person Household | 50 (67.6%) | 24 (32.4%) |
| Total Housing Units | 350 (76.2%) | 109 (23.7%) |
Occupancy by Educational Attainment in Nellieburg
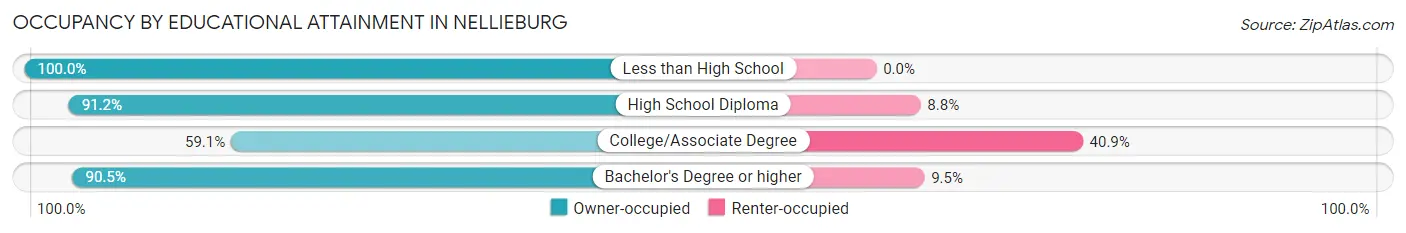
| Household Size | Owner-occupied | Renter-occupied |
| Less than High School | 10 (100.0%) | 0 (0.0%) |
| High School Diploma | 156 (91.2%) | 15 (8.8%) |
| College/Associate Degree | 127 (59.1%) | 88 (40.9%) |
| Bachelor's Degree or higher | 57 (90.5%) | 6 (9.5%) |
Occupancy by Age of Householder in Nellieburg
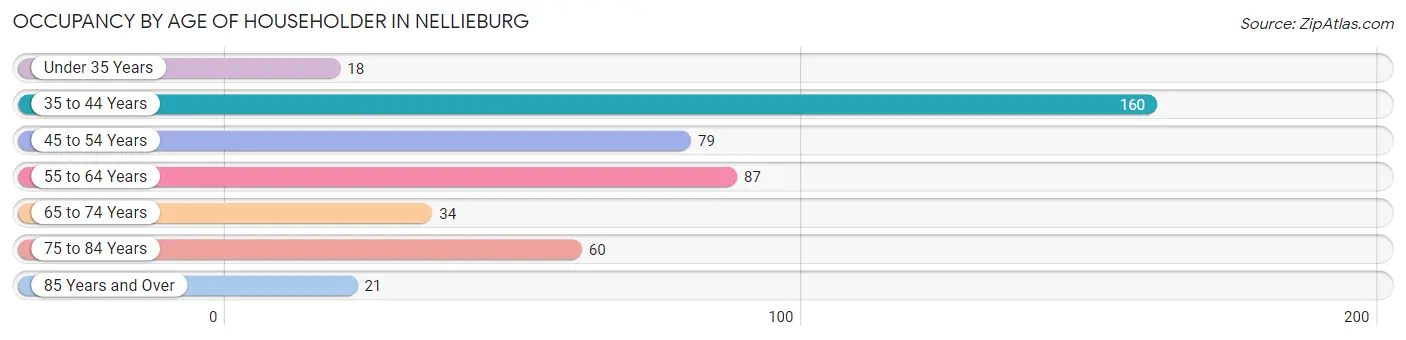
| Age Bracket | # Households | % Households |
| Under 35 Years | 18 | 3.9% |
| 35 to 44 Years | 160 | 34.9% |
| 45 to 54 Years | 79 | 17.2% |
| 55 to 64 Years | 87 | 19.0% |
| 65 to 74 Years | 34 | 7.4% |
| 75 to 84 Years | 60 | 13.1% |
| 85 Years and Over | 21 | 4.6% |
| Total | 459 | 100.0% |
Housing Finances in Nellieburg
Median Income by Occupancy in Nellieburg
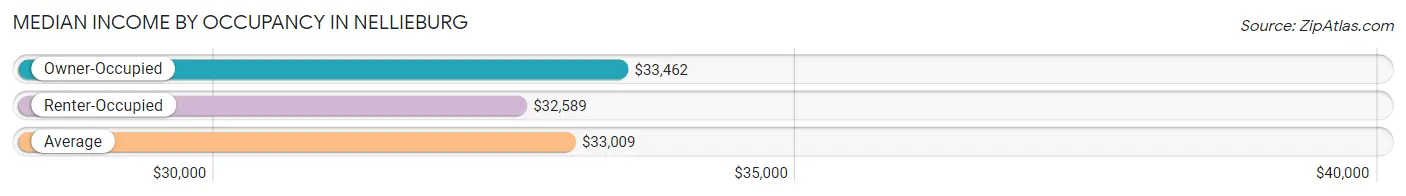
| Occupancy Type | # Households | Median Income |
| Owner-Occupied | 350 (76.2%) | $33,462 |
| Renter-Occupied | 109 (23.7%) | $32,589 |
| Average | 459 (100.0%) | $33,009 |
Occupancy by Householder Income Bracket in Nellieburg
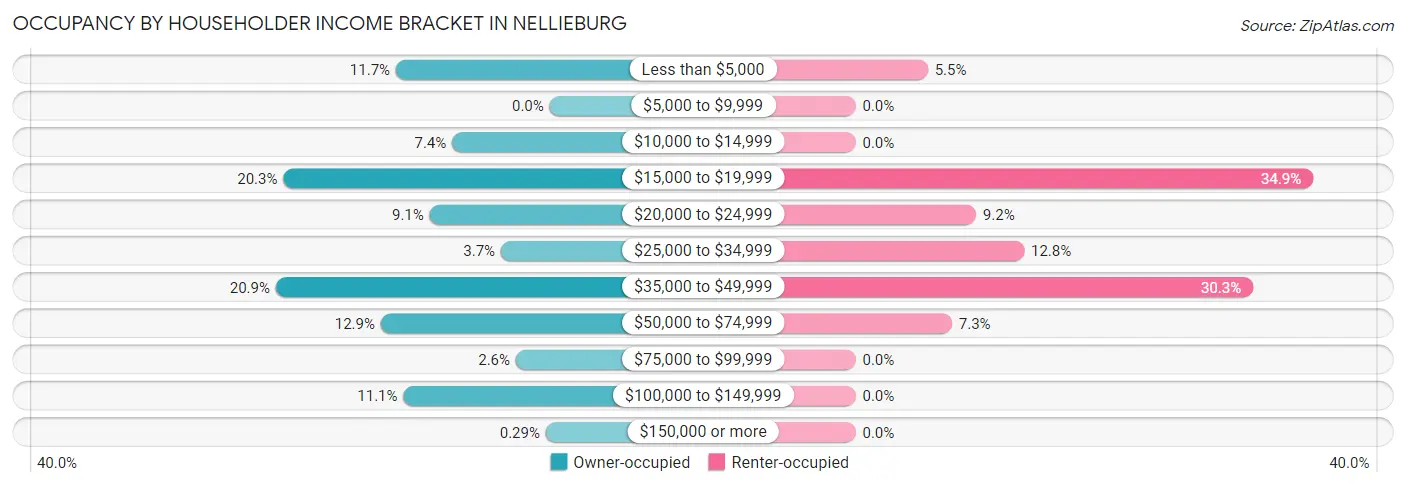
| Income Bracket | Owner-occupied | Renter-occupied |
| Less than $5,000 | 41 (11.7%) | 6 (5.5%) |
| $5,000 to $9,999 | 0 (0.0%) | 0 (0.0%) |
| $10,000 to $14,999 | 26 (7.4%) | 0 (0.0%) |
| $15,000 to $19,999 | 71 (20.3%) | 38 (34.9%) |
| $20,000 to $24,999 | 32 (9.1%) | 10 (9.2%) |
| $25,000 to $34,999 | 13 (3.7%) | 14 (12.8%) |
| $35,000 to $49,999 | 73 (20.9%) | 33 (30.3%) |
| $50,000 to $74,999 | 45 (12.9%) | 8 (7.3%) |
| $75,000 to $99,999 | 9 (2.6%) | 0 (0.0%) |
| $100,000 to $149,999 | 39 (11.1%) | 0 (0.0%) |
| $150,000 or more | 1 (0.3%) | 0 (0.0%) |
| Total | 350 (100.0%) | 109 (100.0%) |
Monthly Housing Cost Tiers in Nellieburg
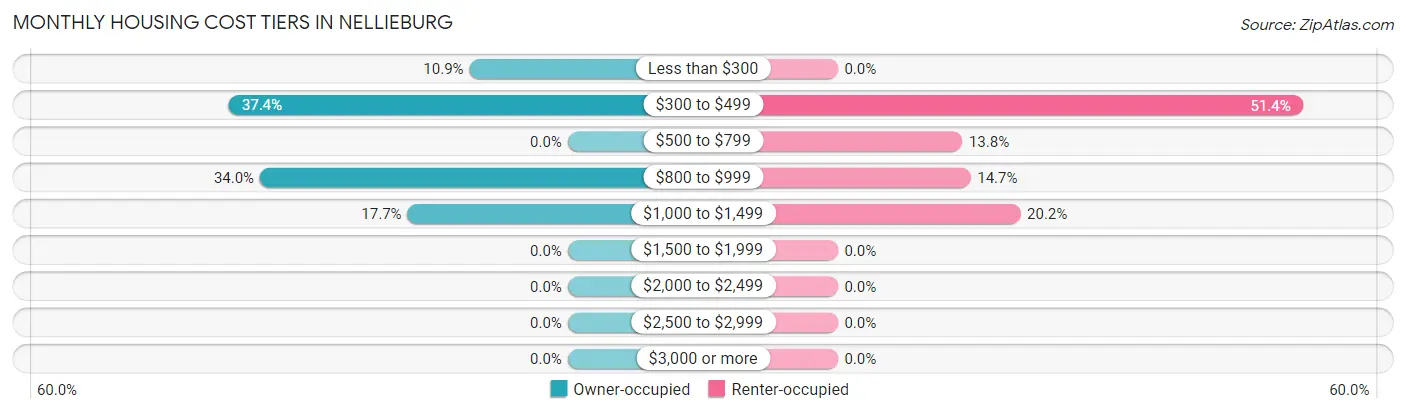
| Monthly Cost | Owner-occupied | Renter-occupied |
| Less than $300 | 38 (10.9%) | 0 (0.0%) |
| $300 to $499 | 131 (37.4%) | 56 (51.4%) |
| $500 to $799 | 0 (0.0%) | 15 (13.8%) |
| $800 to $999 | 119 (34.0%) | 16 (14.7%) |
| $1,000 to $1,499 | 62 (17.7%) | 22 (20.2%) |
| $1,500 to $1,999 | 0 (0.0%) | 0 (0.0%) |
| $2,000 to $2,499 | 0 (0.0%) | 0 (0.0%) |
| $2,500 to $2,999 | 0 (0.0%) | 0 (0.0%) |
| $3,000 or more | 0 (0.0%) | 0 (0.0%) |
| Total | 350 (100.0%) | 109 (100.0%) |
Physical Housing Characteristics in Nellieburg
Housing Structures in Nellieburg
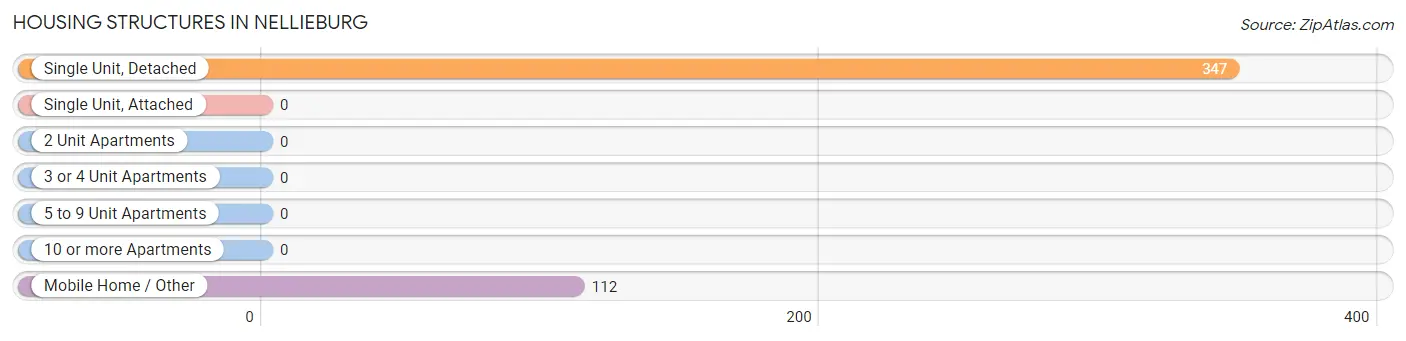
| Structure Type | # Housing Units | % Housing Units |
| Single Unit, Detached | 347 | 75.6% |
| Single Unit, Attached | 0 | 0.0% |
| 2 Unit Apartments | 0 | 0.0% |
| 3 or 4 Unit Apartments | 0 | 0.0% |
| 5 to 9 Unit Apartments | 0 | 0.0% |
| 10 or more Apartments | 0 | 0.0% |
| Mobile Home / Other | 112 | 24.4% |
| Total | 459 | 100.0% |
Housing Structures by Occupancy in Nellieburg
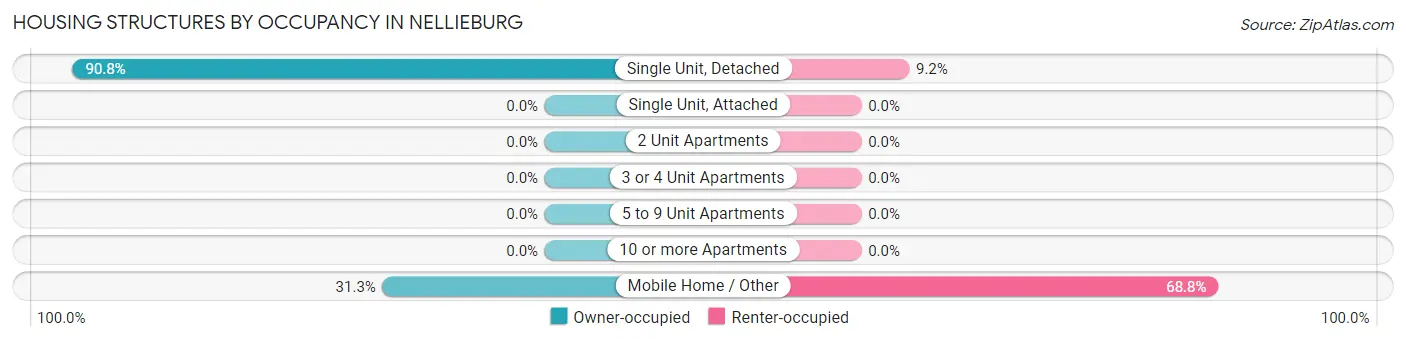
| Structure Type | Owner-occupied | Renter-occupied |
| Single Unit, Detached | 315 (90.8%) | 32 (9.2%) |
| Single Unit, Attached | 0 (0.0%) | 0 (0.0%) |
| 2 Unit Apartments | 0 (0.0%) | 0 (0.0%) |
| 3 or 4 Unit Apartments | 0 (0.0%) | 0 (0.0%) |
| 5 to 9 Unit Apartments | 0 (0.0%) | 0 (0.0%) |
| 10 or more Apartments | 0 (0.0%) | 0 (0.0%) |
| Mobile Home / Other | 35 (31.2%) | 77 (68.8%) |
| Total | 350 (76.2%) | 109 (23.7%) |
Housing Structures by Number of Rooms in Nellieburg
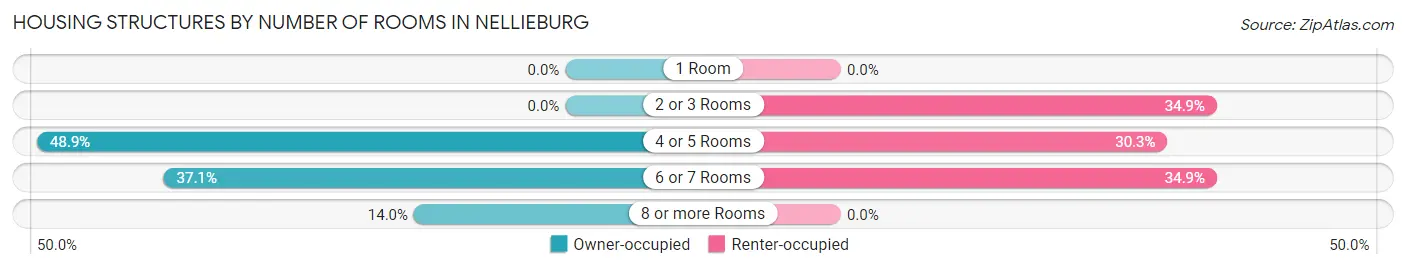
| Number of Rooms | Owner-occupied | Renter-occupied |
| 1 Room | 0 (0.0%) | 0 (0.0%) |
| 2 or 3 Rooms | 0 (0.0%) | 38 (34.9%) |
| 4 or 5 Rooms | 171 (48.9%) | 33 (30.3%) |
| 6 or 7 Rooms | 130 (37.1%) | 38 (34.9%) |
| 8 or more Rooms | 49 (14.0%) | 0 (0.0%) |
| Total | 350 (100.0%) | 109 (100.0%) |
Housing Structure by Heating Type in Nellieburg
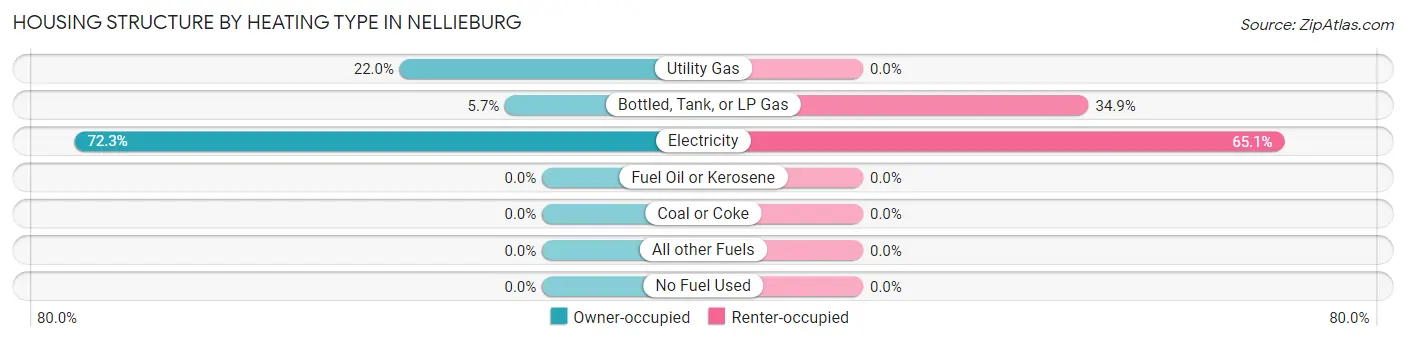
| Heating Type | Owner-occupied | Renter-occupied |
| Utility Gas | 77 (22.0%) | 0 (0.0%) |
| Bottled, Tank, or LP Gas | 20 (5.7%) | 38 (34.9%) |
| Electricity | 253 (72.3%) | 71 (65.1%) |
| Fuel Oil or Kerosene | 0 (0.0%) | 0 (0.0%) |
| Coal or Coke | 0 (0.0%) | 0 (0.0%) |
| All other Fuels | 0 (0.0%) | 0 (0.0%) |
| No Fuel Used | 0 (0.0%) | 0 (0.0%) |
| Total | 350 (100.0%) | 109 (100.0%) |
Household Vehicle Usage in Nellieburg
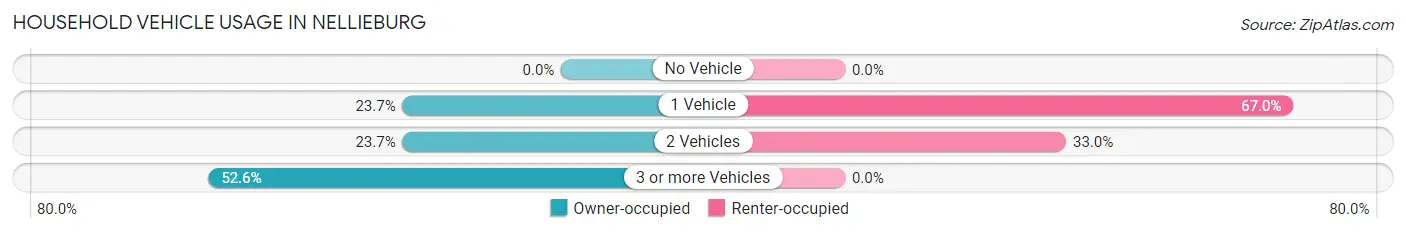
| Vehicles per Household | Owner-occupied | Renter-occupied |
| No Vehicle | 0 (0.0%) | 0 (0.0%) |
| 1 Vehicle | 83 (23.7%) | 73 (67.0%) |
| 2 Vehicles | 83 (23.7%) | 36 (33.0%) |
| 3 or more Vehicles | 184 (52.6%) | 0 (0.0%) |
| Total | 350 (100.0%) | 109 (100.0%) |
Real Estate & Mortgages in Nellieburg
Real Estate and Mortgage Overview in Nellieburg
| Characteristic | Without Mortgage | With Mortgage |
| Housing Units | 148 | 202 |
| Median Property Value | $131,100 | $87,100 |
| Median Household Income | $38,229 | $1 |
| Monthly Housing Costs | $349 | $0 |
| Real Estate Taxes | $765 | $29 |
Property Value by Mortgage Status in Nellieburg
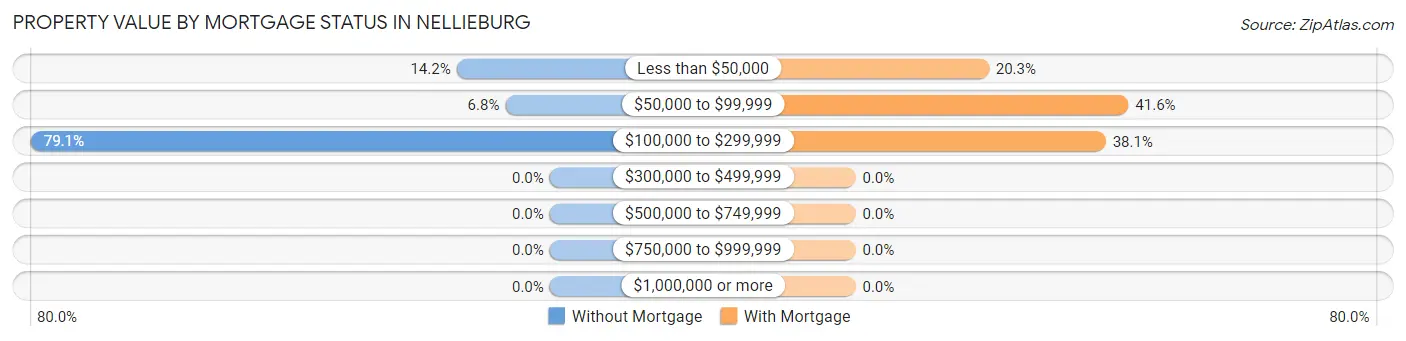
| Property Value | Without Mortgage | With Mortgage |
| Less than $50,000 | 21 (14.2%) | 41 (20.3%) |
| $50,000 to $99,999 | 10 (6.8%) | 84 (41.6%) |
| $100,000 to $299,999 | 117 (79.0%) | 77 (38.1%) |
| $300,000 to $499,999 | 0 (0.0%) | 0 (0.0%) |
| $500,000 to $749,999 | 0 (0.0%) | 0 (0.0%) |
| $750,000 to $999,999 | 0 (0.0%) | 0 (0.0%) |
| $1,000,000 or more | 0 (0.0%) | 0 (0.0%) |
| Total | 148 (100.0%) | 202 (100.0%) |
Household Income by Mortgage Status in Nellieburg
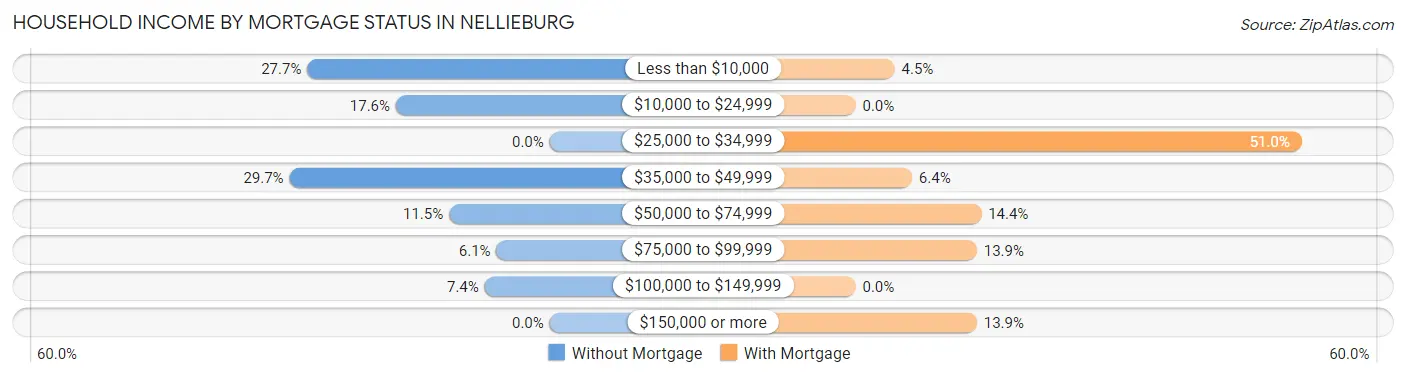
| Household Income | Without Mortgage | With Mortgage |
| Less than $10,000 | 41 (27.7%) | 9 (4.5%) |
| $10,000 to $24,999 | 26 (17.6%) | 0 (0.0%) |
| $25,000 to $34,999 | 0 (0.0%) | 103 (51.0%) |
| $35,000 to $49,999 | 44 (29.7%) | 13 (6.4%) |
| $50,000 to $74,999 | 17 (11.5%) | 29 (14.4%) |
| $75,000 to $99,999 | 9 (6.1%) | 28 (13.9%) |
| $100,000 to $149,999 | 11 (7.4%) | 0 (0.0%) |
| $150,000 or more | 0 (0.0%) | 28 (13.9%) |
| Total | 148 (100.0%) | 202 (100.0%) |
Property Value to Household Income Ratio in Nellieburg
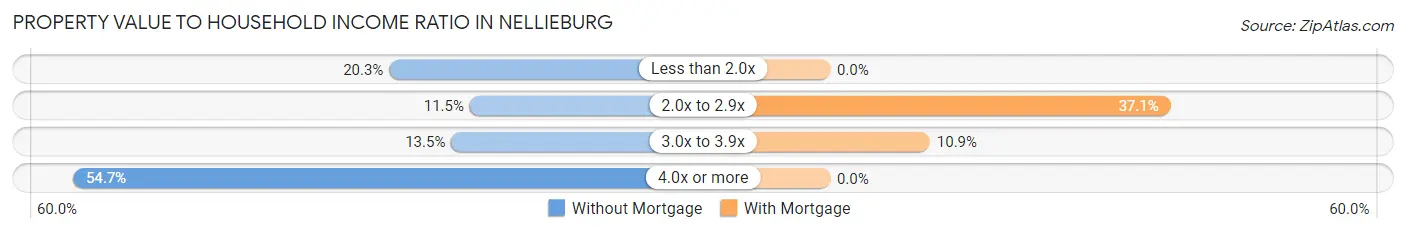
| Value-to-Income Ratio | Without Mortgage | With Mortgage |
| Less than 2.0x | 30 (20.3%) | 0 (0.0%) |
| 2.0x to 2.9x | 17 (11.5%) | 75 (37.1%) |
| 3.0x to 3.9x | 20 (13.5%) | 22 (10.9%) |
| 4.0x or more | 81 (54.7%) | 0 (0.0%) |
| Total | 148 (100.0%) | 202 (100.0%) |
Real Estate Taxes by Mortgage Status in Nellieburg
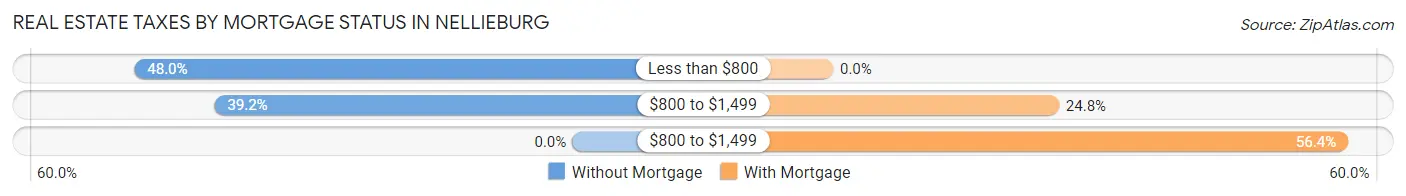
| Property Taxes | Without Mortgage | With Mortgage |
| Less than $800 | 71 (48.0%) | 0 (0.0%) |
| $800 to $1,499 | 58 (39.2%) | 50 (24.7%) |
| $800 to $1,499 | 0 (0.0%) | 114 (56.4%) |
| Total | 148 (100.0%) | 202 (100.0%) |
Health & Disability in Nellieburg
Health Insurance Coverage by Age in Nellieburg
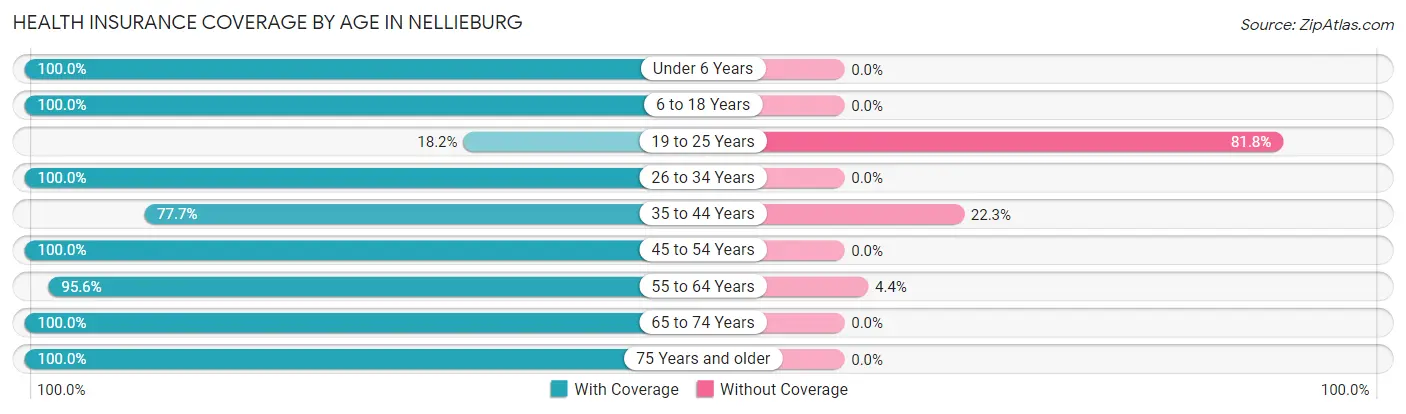
| Age Bracket | With Coverage | Without Coverage |
| Under 6 Years | 40 (100.0%) | 0 (0.0%) |
| 6 to 18 Years | 325 (100.0%) | 0 (0.0%) |
| 19 to 25 Years | 4 (18.2%) | 18 (81.8%) |
| 26 to 34 Years | 80 (100.0%) | 0 (0.0%) |
| 35 to 44 Years | 230 (77.7%) | 66 (22.3%) |
| 45 to 54 Years | 121 (100.0%) | 0 (0.0%) |
| 55 to 64 Years | 129 (95.6%) | 6 (4.4%) |
| 65 to 74 Years | 36 (100.0%) | 0 (0.0%) |
| 75 Years and older | 125 (100.0%) | 0 (0.0%) |
| Total | 1,090 (92.4%) | 90 (7.6%) |
Health Insurance Coverage by Citizenship Status in Nellieburg
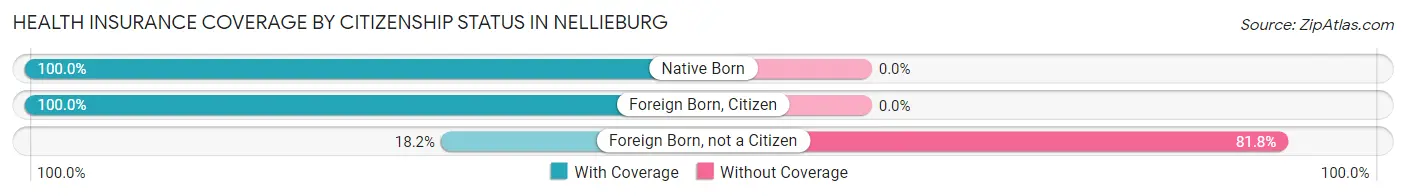
| Citizenship Status | With Coverage | Without Coverage |
| Native Born | 40 (100.0%) | 0 (0.0%) |
| Foreign Born, Citizen | 325 (100.0%) | 0 (0.0%) |
| Foreign Born, not a Citizen | 4 (18.2%) | 18 (81.8%) |
Health Insurance Coverage by Household Income in Nellieburg
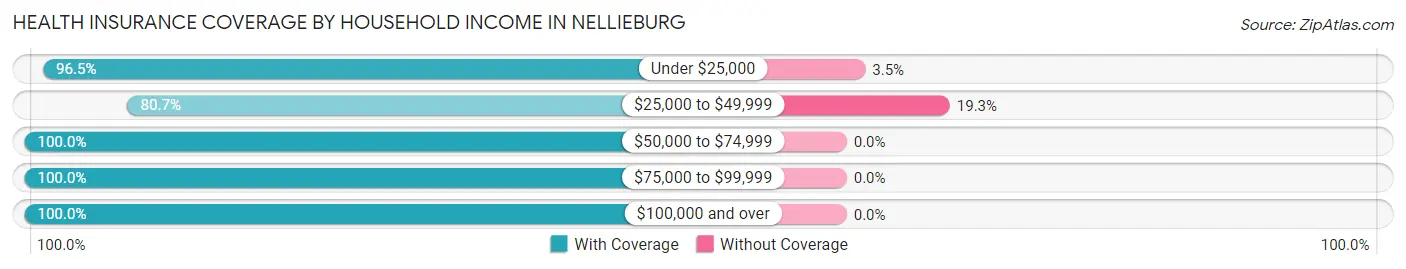
| Household Income | With Coverage | Without Coverage |
| Under $25,000 | 472 (96.5%) | 17 (3.5%) |
| $25,000 to $49,999 | 305 (80.7%) | 73 (19.3%) |
| $50,000 to $74,999 | 117 (100.0%) | 0 (0.0%) |
| $75,000 to $99,999 | 27 (100.0%) | 0 (0.0%) |
| $100,000 and over | 146 (100.0%) | 0 (0.0%) |
Public vs Private Health Insurance Coverage by Age in Nellieburg
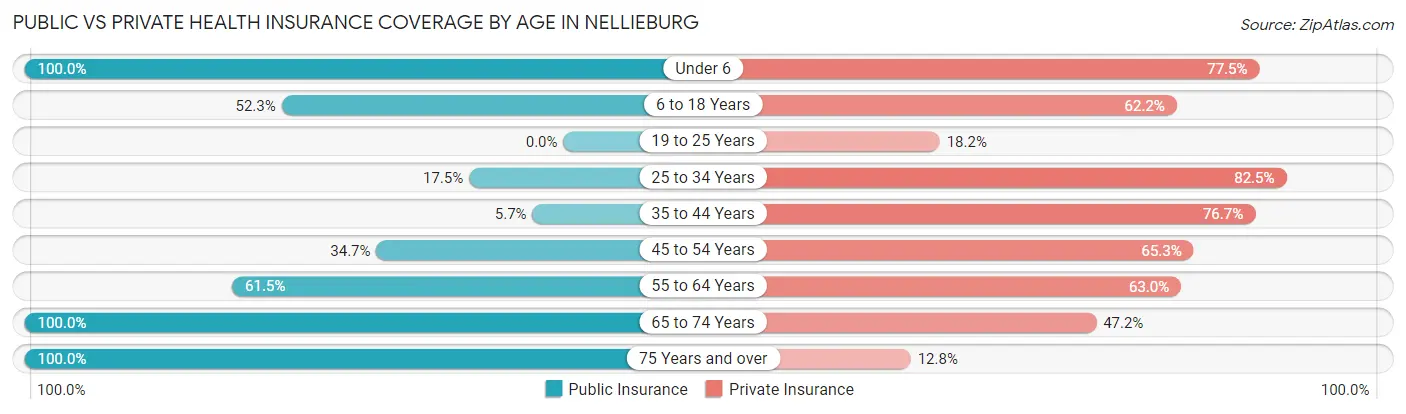
| Age Bracket | Public Insurance | Private Insurance |
| Under 6 | 40 (100.0%) | 31 (77.5%) |
| 6 to 18 Years | 170 (52.3%) | 202 (62.2%) |
| 19 to 25 Years | 0 (0.0%) | 4 (18.2%) |
| 25 to 34 Years | 14 (17.5%) | 66 (82.5%) |
| 35 to 44 Years | 17 (5.7%) | 227 (76.7%) |
| 45 to 54 Years | 42 (34.7%) | 79 (65.3%) |
| 55 to 64 Years | 83 (61.5%) | 85 (63.0%) |
| 65 to 74 Years | 36 (100.0%) | 17 (47.2%) |
| 75 Years and over | 125 (100.0%) | 16 (12.8%) |
| Total | 527 (44.7%) | 727 (61.6%) |
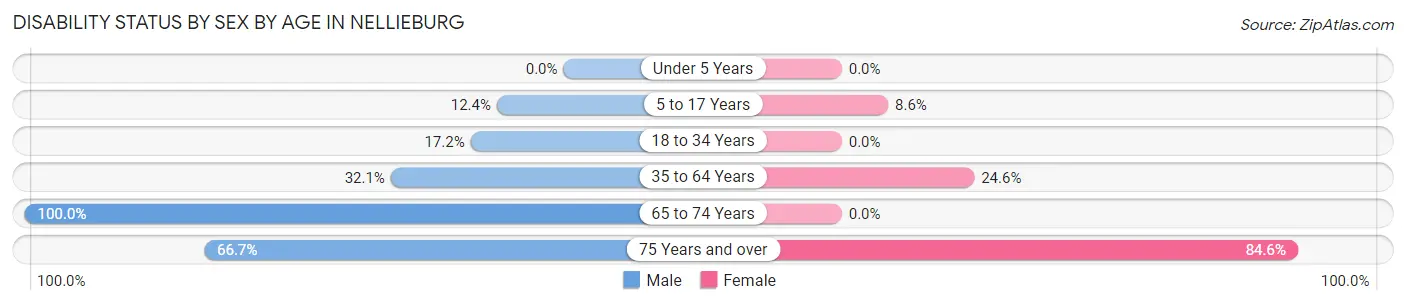
Disability Status by Sex by Age in Nellieburg
| Age Bracket | Male | Female |
| Under 5 Years | 0 (0.0%) | 0 (0.0%) |
| 5 to 17 Years | 11 (12.4%) | 19 (8.6%) |
| 18 to 34 Years | 15 (17.2%) | 0 (0.0%) |
| 35 to 64 Years | 100 (32.1%) | 59 (24.6%) |
| 65 to 74 Years | 2 (100.0%) | 0 (0.0%) |
| 75 Years and over | 14 (66.7%) | 88 (84.6%) |
Disability Class by Sex by Age in Nellieburg
Disability Class: Hearing Difficulty
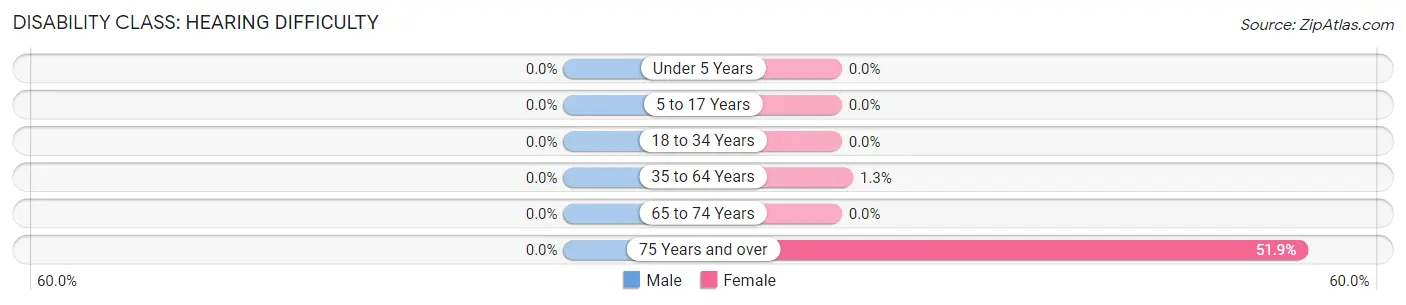
| Age Bracket | Male | Female |
| Under 5 Years | 0 (0.0%) | 0 (0.0%) |
| 5 to 17 Years | 0 (0.0%) | 0 (0.0%) |
| 18 to 34 Years | 0 (0.0%) | 0 (0.0%) |
| 35 to 64 Years | 0 (0.0%) | 3 (1.3%) |
| 65 to 74 Years | 0 (0.0%) | 0 (0.0%) |
| 75 Years and over | 0 (0.0%) | 54 (51.9%) |
Disability Class: Vision Difficulty
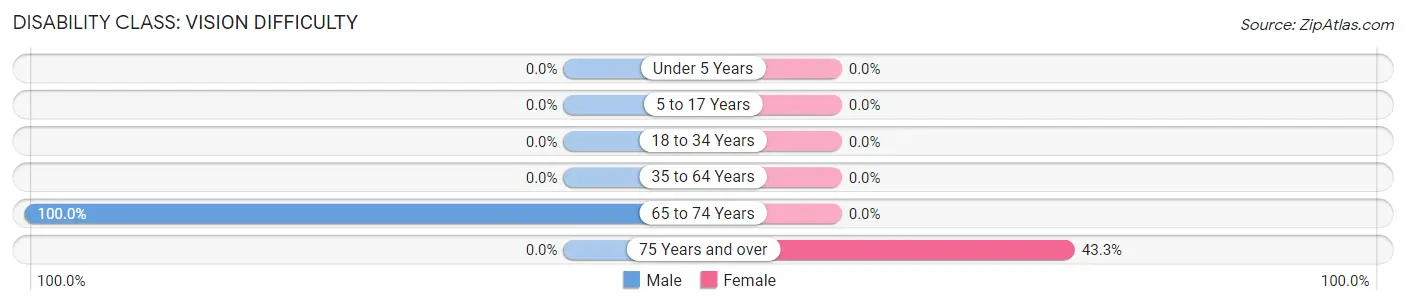
| Age Bracket | Male | Female |
| Under 5 Years | 0 (0.0%) | 0 (0.0%) |
| 5 to 17 Years | 0 (0.0%) | 0 (0.0%) |
| 18 to 34 Years | 0 (0.0%) | 0 (0.0%) |
| 35 to 64 Years | 0 (0.0%) | 0 (0.0%) |
| 65 to 74 Years | 2 (100.0%) | 0 (0.0%) |
| 75 Years and over | 0 (0.0%) | 45 (43.3%) |
Disability Class: Cognitive Difficulty
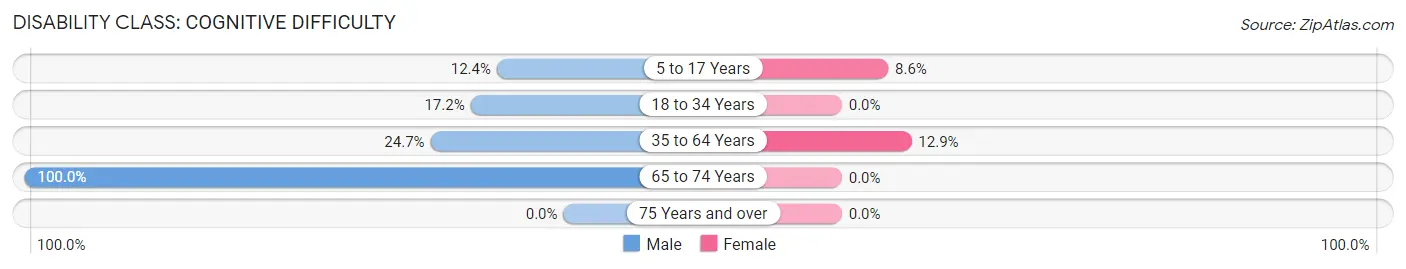
| Age Bracket | Male | Female |
| 5 to 17 Years | 11 (12.4%) | 19 (8.6%) |
| 18 to 34 Years | 15 (17.2%) | 0 (0.0%) |
| 35 to 64 Years | 77 (24.7%) | 31 (12.9%) |
| 65 to 74 Years | 2 (100.0%) | 0 (0.0%) |
| 75 Years and over | 0 (0.0%) | 0 (0.0%) |
Disability Class: Ambulatory Difficulty
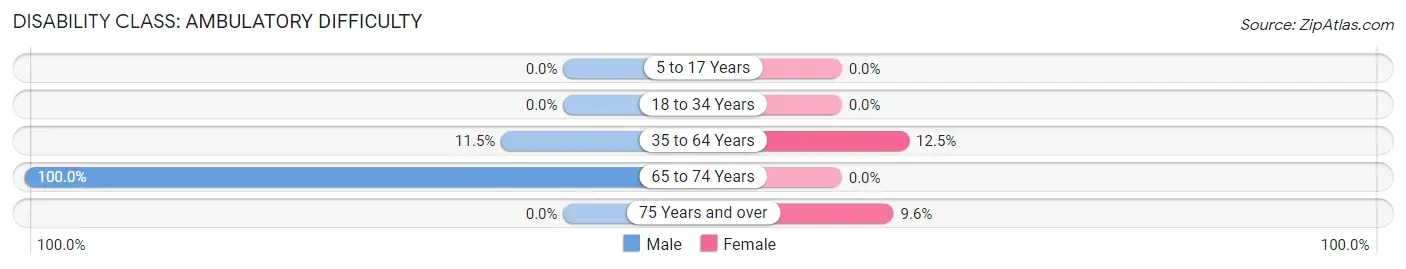
| Age Bracket | Male | Female |
| 5 to 17 Years | 0 (0.0%) | 0 (0.0%) |
| 18 to 34 Years | 0 (0.0%) | 0 (0.0%) |
| 35 to 64 Years | 36 (11.5%) | 30 (12.5%) |
| 65 to 74 Years | 2 (100.0%) | 0 (0.0%) |
| 75 Years and over | 0 (0.0%) | 10 (9.6%) |
Disability Class: Self-Care Difficulty
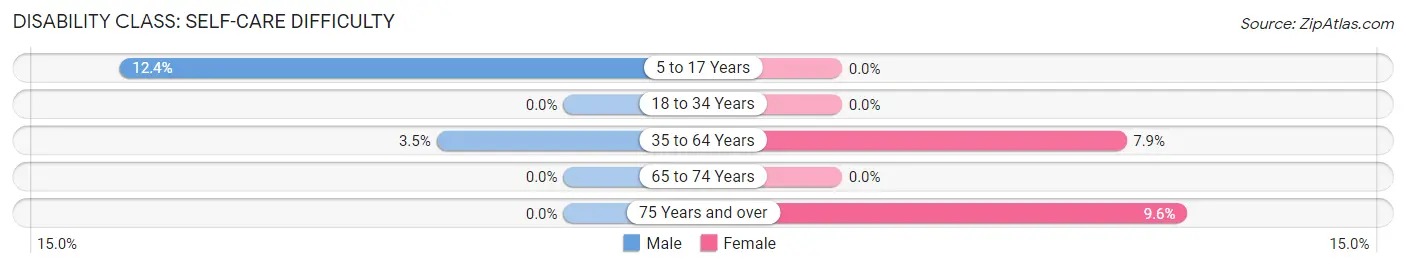
| Age Bracket | Male | Female |
| 5 to 17 Years | 11 (12.4%) | 0 (0.0%) |
| 18 to 34 Years | 0 (0.0%) | 0 (0.0%) |
| 35 to 64 Years | 11 (3.5%) | 19 (7.9%) |
| 65 to 74 Years | 0 (0.0%) | 0 (0.0%) |
| 75 Years and over | 0 (0.0%) | 10 (9.6%) |
Technology Access in Nellieburg
Computing Device Access in Nellieburg
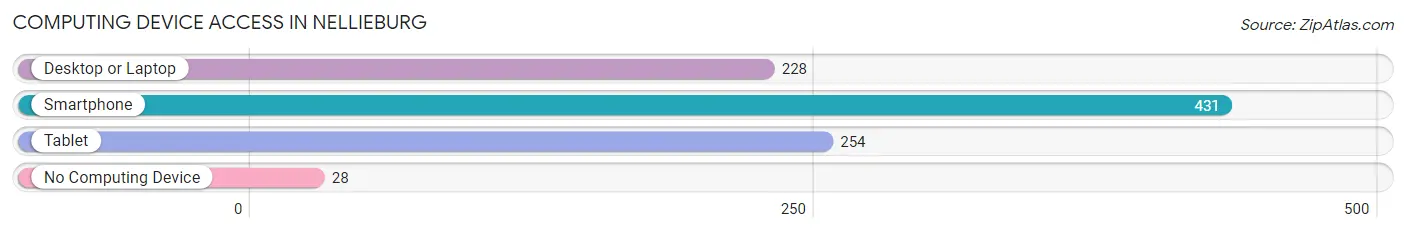
| Device Type | # Households | % Households |
| Desktop or Laptop | 228 | 49.7% |
| Smartphone | 431 | 93.9% |
| Tablet | 254 | 55.3% |
| No Computing Device | 28 | 6.1% |
| Total | 459 | 100.0% |
Internet Access in Nellieburg
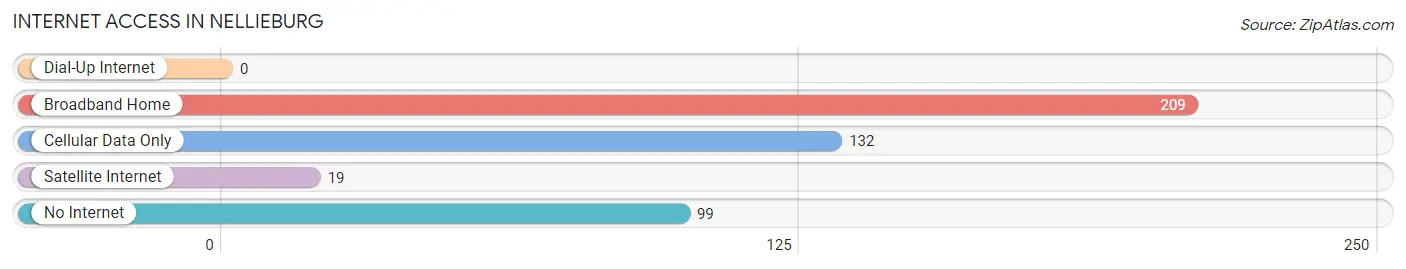
| Internet Type | # Households | % Households |
| Dial-Up Internet | 0 | 0.0% |
| Broadband Home | 209 | 45.5% |
| Cellular Data Only | 132 | 28.8% |
| Satellite Internet | 19 | 4.1% |
| No Internet | 99 | 21.6% |
| Total | 459 | 100.0% |
Nellieburg Summary
Nellieburg is a small town located in the state of Mississippi, in the United States of America. It is situated in the northern part of the state, in the county of Tishomingo. The town has a population of approximately 1,000 people, and is located in a rural area.
Geography
Nellieburg is located in the northern part of Mississippi, in the county of Tishomingo. The town is situated in a rural area, and is surrounded by rolling hills and forests. The town is located near the Tennessee River, and is approximately 30 miles from the state capital of Jackson. The town is also close to the Mississippi River, which is located to the west.
The climate in Nellieburg is humid subtropical, with hot summers and mild winters. The average temperature in the summer is around 80 degrees Fahrenheit, and the average temperature in the winter is around 50 degrees Fahrenheit. The town receives an average of 48 inches of rain per year, and the average snowfall is around 4 inches per year.
Economy
The economy of Nellieburg is largely based on agriculture. The town is home to several farms, which produce a variety of crops, including corn, soybeans, cotton, and wheat. The town also has a few small businesses, including a grocery store, a hardware store, and a few restaurants.
The town is also home to a few manufacturing companies, which produce a variety of products, including furniture, clothing, and electronics. The town is also home to a few small service businesses, such as auto repair shops and hair salons.
Demographics
As of the 2010 census, the population of Nellieburg was 1,000 people. The town is predominantly white, with a small African American population. The median age of the population is 44 years old, and the median household income is $35,000.
The town is home to a few churches, including the First Baptist Church of Nellieburg, the Church of Christ, and the Church of God. The town also has a few schools, including Nellieburg Elementary School, Nellieburg Middle School, and Nellieburg High School.
Conclusion
Nellieburg is a small town located in the northern part of Mississippi. The town has a population of approximately 1,000 people, and is located in a rural area. The economy of the town is largely based on agriculture, and the town is home to a few small businesses and manufacturing companies. The town is predominantly white, with a small African American population. The town is home to a few churches and schools, and is close to the Tennessee and Mississippi Rivers.
Common Questions
What is Per Capita Income in Nellieburg?
Per Capita income in Nellieburg is $17,131.
What is the Median Family Income in Nellieburg?
Median Family Income in Nellieburg is $37,589.
What is the Median Household income in Nellieburg?
Median Household Income in Nellieburg is $33,009.
What is Income or Wage Gap in Nellieburg?
Income or Wage Gap in Nellieburg is 0.6%.
Women in Nellieburg earn 99.4 cents for every dollar earned by a man.
What is Inequality or Gini Index in Nellieburg?
Inequality or Gini Index in Nellieburg is 0.42.
What is the Total Population of Nellieburg?
Total Population of Nellieburg is 1,321.
What is the Total Male Population of Nellieburg?
Total Male Population of Nellieburg is 601.
What is the Total Female Population of Nellieburg?
Total Female Population of Nellieburg is 720.
What is the Ratio of Males per 100 Females in Nellieburg?
There are 83.47 Males per 100 Females in Nellieburg.
What is the Ratio of Females per 100 Males in Nellieburg?
There are 119.80 Females per 100 Males in Nellieburg.
What is the Median Population Age in Nellieburg?
Median Population Age in Nellieburg is 41.2 Years.
What is the Average Family Size in Nellieburg
Average Family Size in Nellieburg is 3.1 People.
What is the Average Household Size in Nellieburg
Average Household Size in Nellieburg is 2.5 People.
How Large is the Labor Force in Nellieburg?
There are 498 People in the Labor Forcein in Nellieburg.
What is the Percentage of People in the Labor Force in Nellieburg?
46.2% of People are in the Labor Force in Nellieburg.
What is the Unemployment Rate in Nellieburg?
Unemployment Rate in Nellieburg is 3.6%.