Zip Codes with the Highest Percentage of Population Employed in Administrative & Support Services in Moss Point, MS
RELATED REPORTS & OPTIONS
Administrative & Support Services
Moss Point
Compare Zip Codes
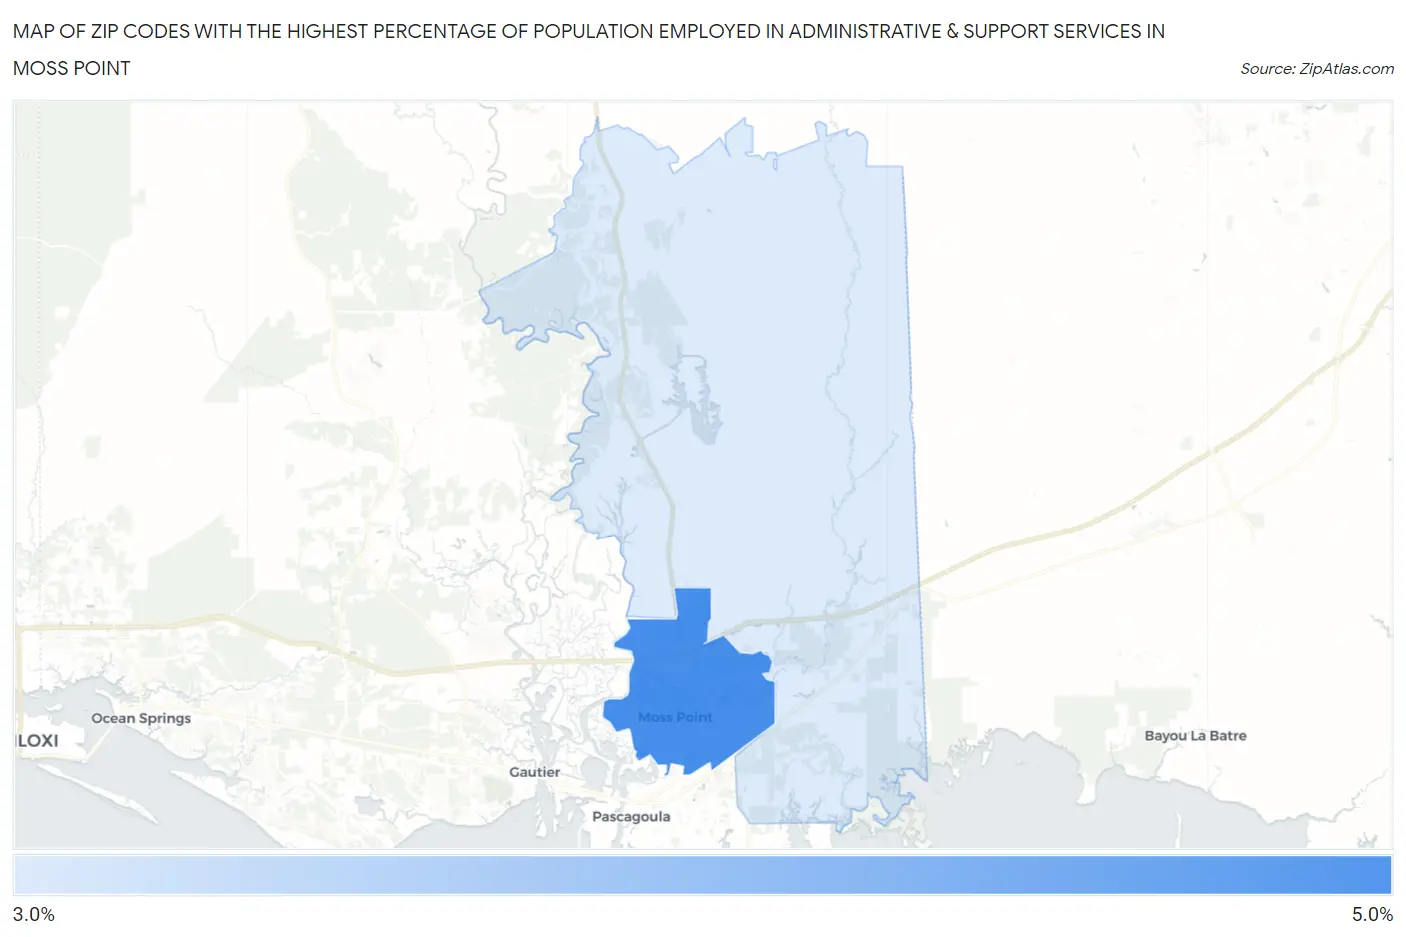
Map of Zip Codes with the Highest Percentage of Population Employed in Administrative & Support Services in Moss Point
3.8%
4.8%
Zip Codes with the Highest Percentage of Population Employed in Administrative & Support Services in Moss Point, MS
| Zip Code | % Employed | vs State | vs National | |
| 1. | 39563 | 4.8% | 3.4%(+1.39)#83 | 4.1%(+0.648)#7,732 |
| 2. | 39562 | 3.8% | 3.4%(+0.428)#139 | 4.1%(-0.317)#11,385 |
1
Common Questions
What are the Top Zip Codes with the Highest Percentage of Population Employed in Administrative & Support Services in Moss Point, MS?
Top Zip Codes with the Highest Percentage of Population Employed in Administrative & Support Services in Moss Point, MS are:
What zip code has the Highest Percentage of Population Employed in Administrative & Support Services in Moss Point, MS?
39563 has the Highest Percentage of Population Employed in Administrative & Support Services in Moss Point, MS with 4.8%.
What is the Percentage of Population Employed in Administrative & Support Services in Moss Point, MS?
Percentage of Population Employed in Administrative & Support Services in Moss Point is 4.8%.
What is the Percentage of Population Employed in Administrative & Support Services in Mississippi?
Percentage of Population Employed in Administrative & Support Services in Mississippi is 3.4%.
What is the Percentage of Population Employed in Administrative & Support Services in the United States?
Percentage of Population Employed in Administrative & Support Services in the United States is 4.1%.