Bridgetown, MS Map & Demographics
Bridgetown Map
Bridgetown Overview
$43,580
PER CAPITA INCOME
$120,125
AVG FAMILY INCOME
$121,523
AVG HOUSEHOLD INCOME
0.25
INEQUALITY / GINI INDEX
2,893
TOTAL POPULATION
1,216
MALE POPULATION
1,677
FEMALE POPULATION
72.51
MALES / 100 FEMALES
137.91
FEMALES / 100 MALES
37.1
MEDIAN AGE
3.5
AVG FAMILY SIZE
3.4
AVG HOUSEHOLD SIZE
1,688
LABOR FORCE [ PEOPLE ]
73.3%
PERCENT IN LABOR FORCE
12.3%
UNEMPLOYMENT RATE
Income in Bridgetown
Income Overview in Bridgetown
Per Capita Income in Bridgetown is $43,580, while median incomes of families and households are $120,125 and $121,523 respectively.
| Characteristic | Number | Measure |
| Per Capita Income | 2,893 | $43,580 |
| Median Family Income | 803 | $120,125 |
| Mean Family Income | 803 | $139,885 |
| Median Household Income | 852 | $121,523 |
| Mean Household Income | 852 | $143,845 |
| Income Deficit | 803 | $0 |
| Wage / Income Gap (%) | 2,893 | 0.00% |
| Wage / Income Gap ($) | 2,893 | 100.00¢ per $1 |
| Gini / Inequality Index | 2,893 | 0.25 |
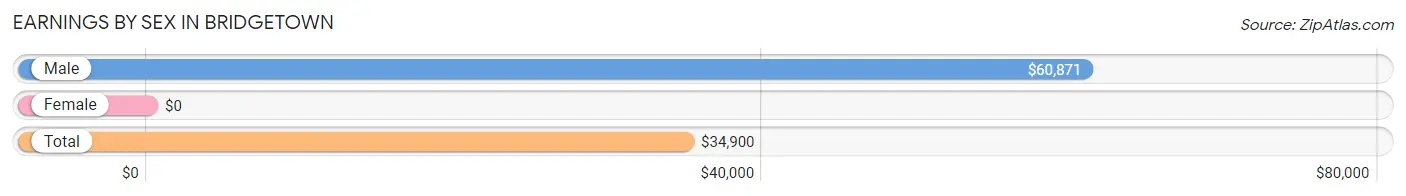
Earnings by Sex in Bridgetown
| Sex | Number | Average Earnings |
| Male | 915 (44.9%) | $60,871 |
| Female | 1,125 (55.1%) | $0 |
| Total | 2,040 (100.0%) | $34,900 |
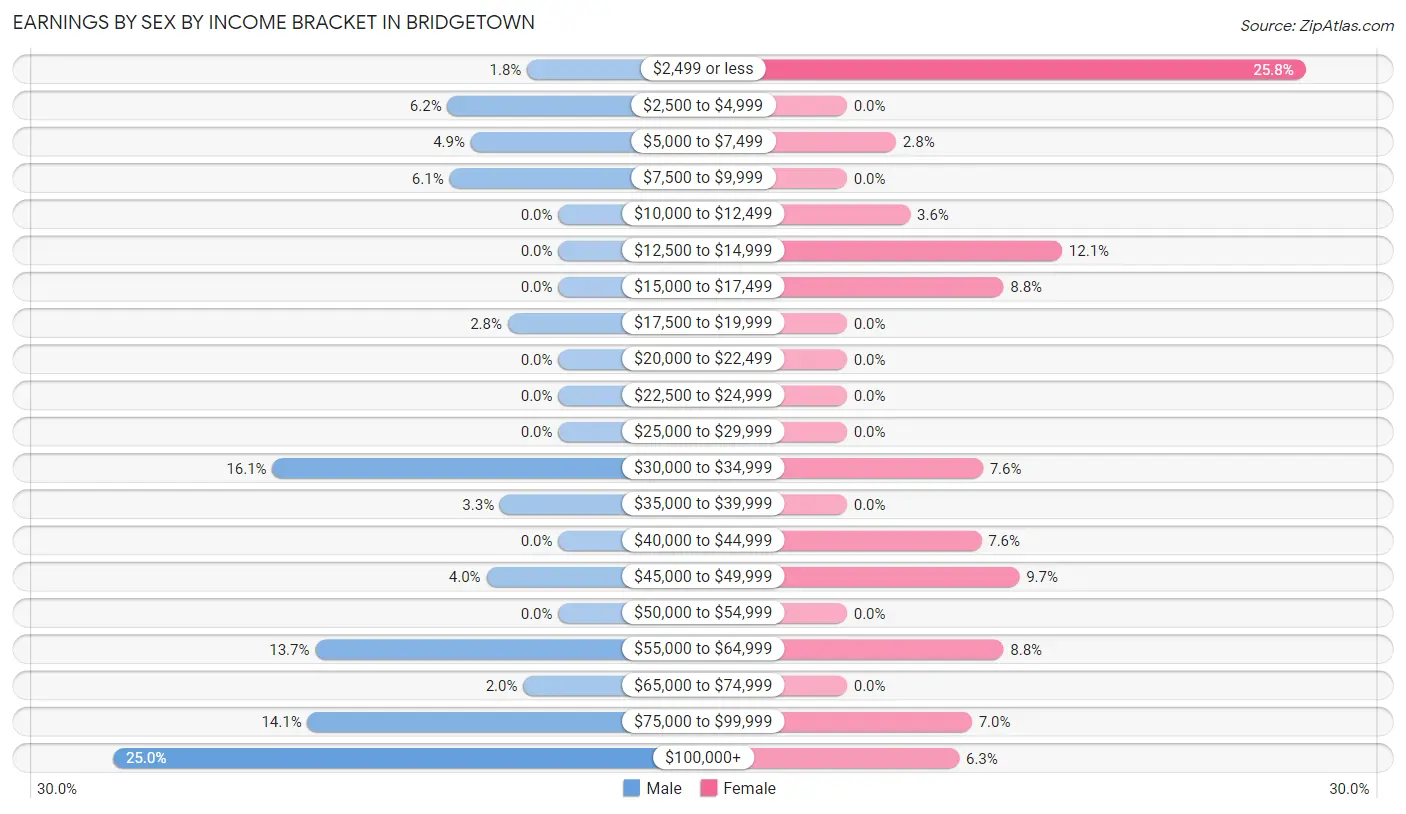
Earnings by Sex by Income Bracket in Bridgetown
The most common earnings brackets in Bridgetown are $100,000+ for men (229 | 25.0%) and $2,499 or less for women (290 | 25.8%).
| Income | Male | Female |
| $2,499 or less | 16 (1.8%) | 290 (25.8%) |
| $2,500 to $4,999 | 57 (6.2%) | 0 (0.0%) |
| $5,000 to $7,499 | 45 (4.9%) | 31 (2.8%) |
| $7,500 to $9,999 | 56 (6.1%) | 0 (0.0%) |
| $10,000 to $12,499 | 0 (0.0%) | 40 (3.6%) |
| $12,500 to $14,999 | 0 (0.0%) | 136 (12.1%) |
| $15,000 to $17,499 | 0 (0.0%) | 99 (8.8%) |
| $17,500 to $19,999 | 26 (2.8%) | 0 (0.0%) |
| $20,000 to $22,499 | 0 (0.0%) | 0 (0.0%) |
| $22,500 to $24,999 | 0 (0.0%) | 0 (0.0%) |
| $25,000 to $29,999 | 0 (0.0%) | 0 (0.0%) |
| $30,000 to $34,999 | 147 (16.1%) | 86 (7.6%) |
| $35,000 to $39,999 | 30 (3.3%) | 0 (0.0%) |
| $40,000 to $44,999 | 0 (0.0%) | 85 (7.6%) |
| $45,000 to $49,999 | 37 (4.0%) | 109 (9.7%) |
| $50,000 to $54,999 | 0 (0.0%) | 0 (0.0%) |
| $55,000 to $64,999 | 125 (13.7%) | 99 (8.8%) |
| $65,000 to $74,999 | 18 (2.0%) | 0 (0.0%) |
| $75,000 to $99,999 | 129 (14.1%) | 79 (7.0%) |
| $100,000+ | 229 (25.0%) | 71 (6.3%) |
| Total | 915 (100.0%) | 1,125 (100.0%) |
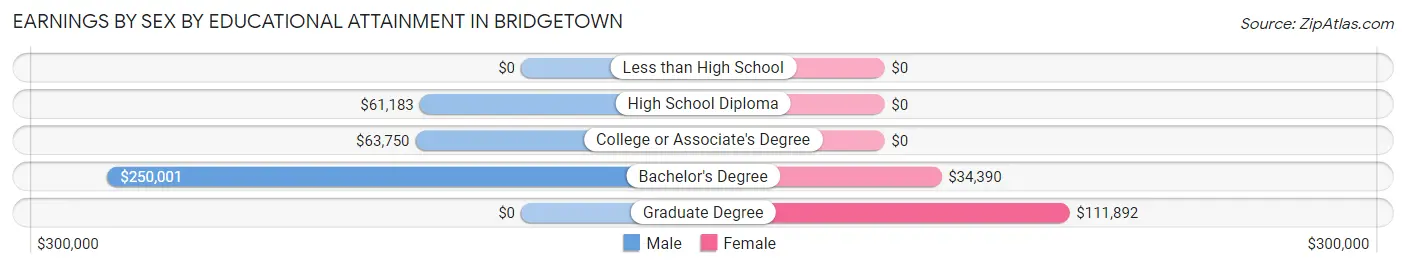
Earnings by Sex by Educational Attainment in Bridgetown
Average earnings in Bridgetown are $87,672 for men and $34,826 for women, a difference of 60.3%. Men with an educational attainment of bachelor's degree enjoy the highest average annual earnings of $250,001, while those with high school diploma education earn the least with $61,183. Women with an educational attainment of graduate degree earn the most with the average annual earnings of $111,892, while those with bachelor's degree education have the smallest earnings of $34,390.
| Educational Attainment | Male Income | Female Income |
| Less than High School | - | - |
| High School Diploma | $61,183 | $0 |
| College or Associate's Degree | $63,750 | $0 |
| Bachelor's Degree | $250,001 | $34,390 |
| Graduate Degree | - | - |
| Total | $87,672 | $34,826 |
Family Income in Bridgetown
Family Income Brackets in Bridgetown
According to the Bridgetown family income data, there are 392 families falling into the $100,000 to $149,999 income range, which is the most common income bracket and makes up 48.8% of all families.
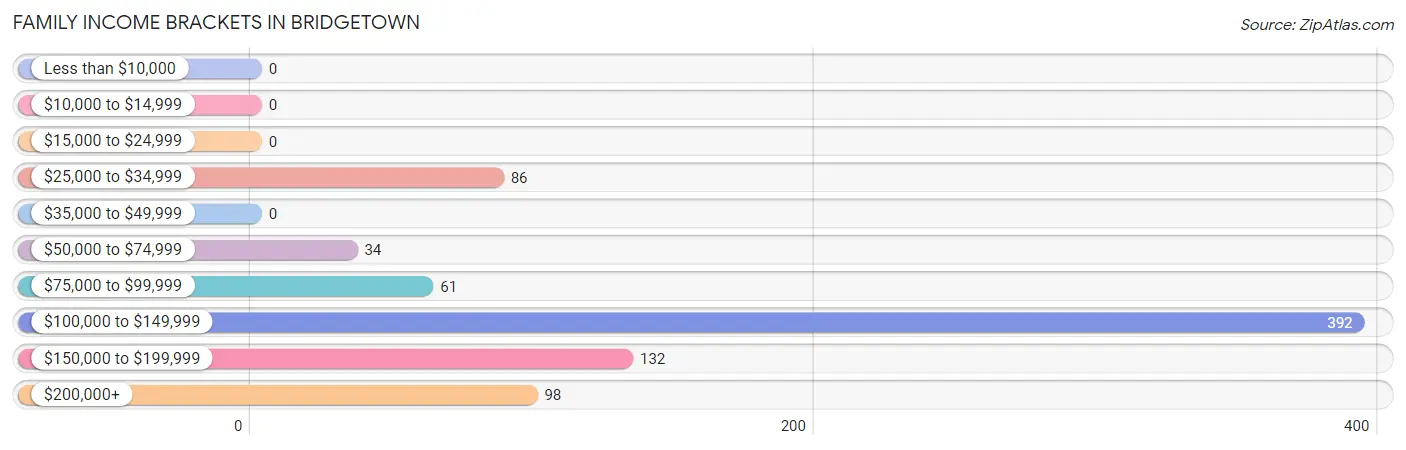
| Income Bracket | # Families | % Families |
| Less than $10,000 | 0 | 0.0% |
| $10,000 to $14,999 | 0 | 0.0% |
| $15,000 to $24,999 | 0 | 0.0% |
| $25,000 to $34,999 | 86 | 10.7% |
| $35,000 to $49,999 | 0 | 0.0% |
| $50,000 to $74,999 | 34 | 4.2% |
| $75,000 to $99,999 | 61 | 7.6% |
| $100,000 to $149,999 | 392 | 48.8% |
| $150,000 to $199,999 | 132 | 16.4% |
| $200,000+ | 98 | 12.2% |
Family Income by Famaliy Size in Bridgetown
4-person families (123 | 15.3%) account for the highest median family income in Bridgetown with $250,001 per family, while 4-person families (123 | 15.3%) have the highest median income of $62,500 per family member.
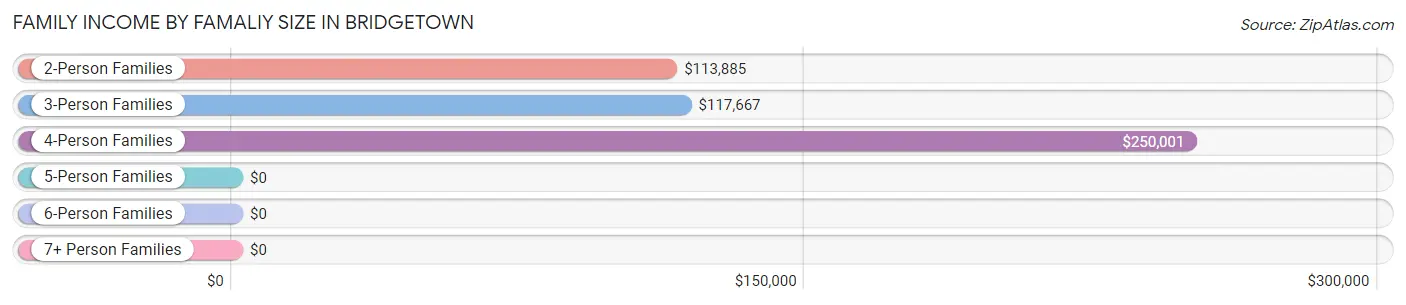
| Income Bracket | # Families | Median Income |
| 2-Person Families | 331 (41.2%) | $113,885 |
| 3-Person Families | 162 (20.2%) | $117,667 |
| 4-Person Families | 123 (15.3%) | $250,001 |
| 5-Person Families | 92 (11.5%) | $0 |
| 6-Person Families | 95 (11.8%) | $0 |
| 7+ Person Families | 0 (0.0%) | $0 |
| Total | 803 (100.0%) | $120,125 |
Family Income by Number of Earners in Bridgetown
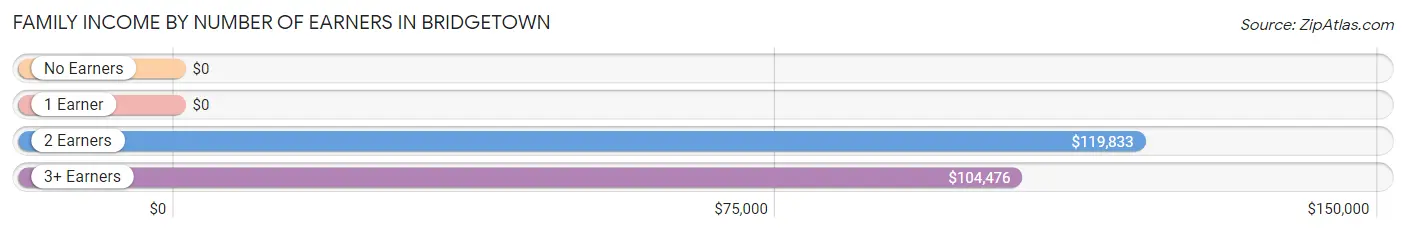
| Number of Earners | # Families | Median Income |
| No Earners | 0 (0.0%) | $0 |
| 1 Earner | 230 (28.6%) | $0 |
| 2 Earners | 336 (41.8%) | $119,833 |
| 3+ Earners | 237 (29.5%) | $104,476 |
| Total | 803 (100.0%) | $120,125 |
Household Income in Bridgetown
Household Income Brackets in Bridgetown
With 478 households falling in the category, the $100,000 to $149,999 income range is the most frequent in Bridgetown, accounting for 56.1% of all households.
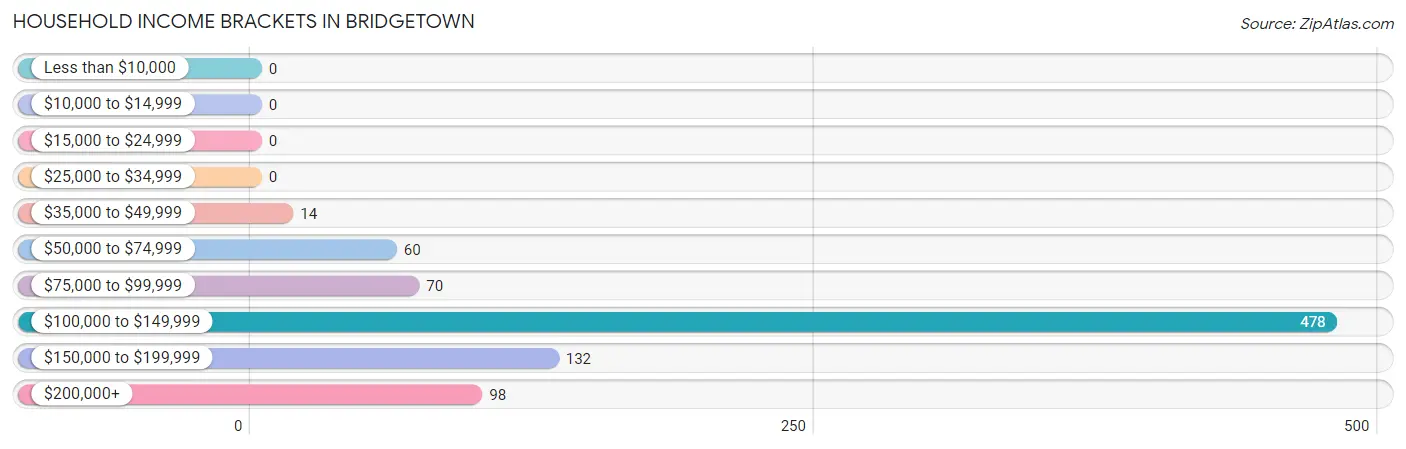
| Income Bracket | # Households | % Households |
| Less than $10,000 | 0 | 0.0% |
| $10,000 to $14,999 | 0 | 0.0% |
| $15,000 to $24,999 | 0 | 0.0% |
| $25,000 to $34,999 | 0 | 0.0% |
| $35,000 to $49,999 | 14 | 1.6% |
| $50,000 to $74,999 | 60 | 7.0% |
| $75,000 to $99,999 | 70 | 8.2% |
| $100,000 to $149,999 | 478 | 56.1% |
| $150,000 to $199,999 | 132 | 15.5% |
| $200,000+ | 98 | 11.5% |
Household Income by Householder Age in Bridgetown
The median household income in Bridgetown is $121,523, with the highest median household income of $121,736 found in the 65+ years age bracket for the primary householder. A total of 183 households (21.5%) fall into this category.
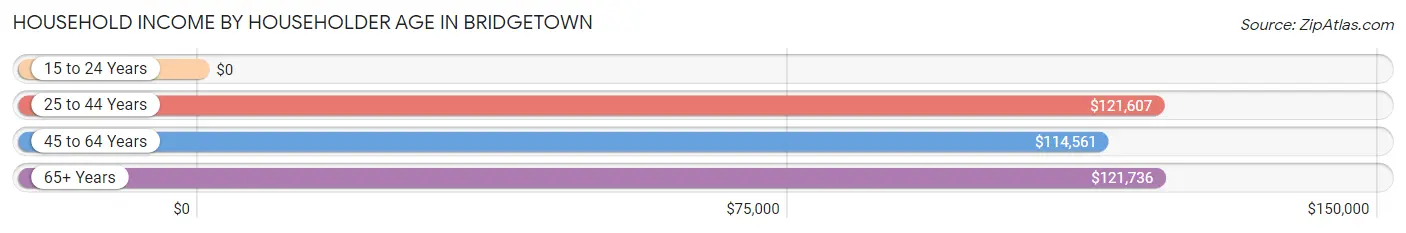
| Income Bracket | # Households | Median Income |
| 15 to 24 Years | 0 (0.0%) | $0 |
| 25 to 44 Years | 326 (38.3%) | $121,607 |
| 45 to 64 Years | 343 (40.3%) | $114,561 |
| 65+ Years | 183 (21.5%) | $121,736 |
| Total | 852 (100.0%) | $121,523 |
Poverty in Bridgetown
Income Below Poverty by Sex and Age in Bridgetown
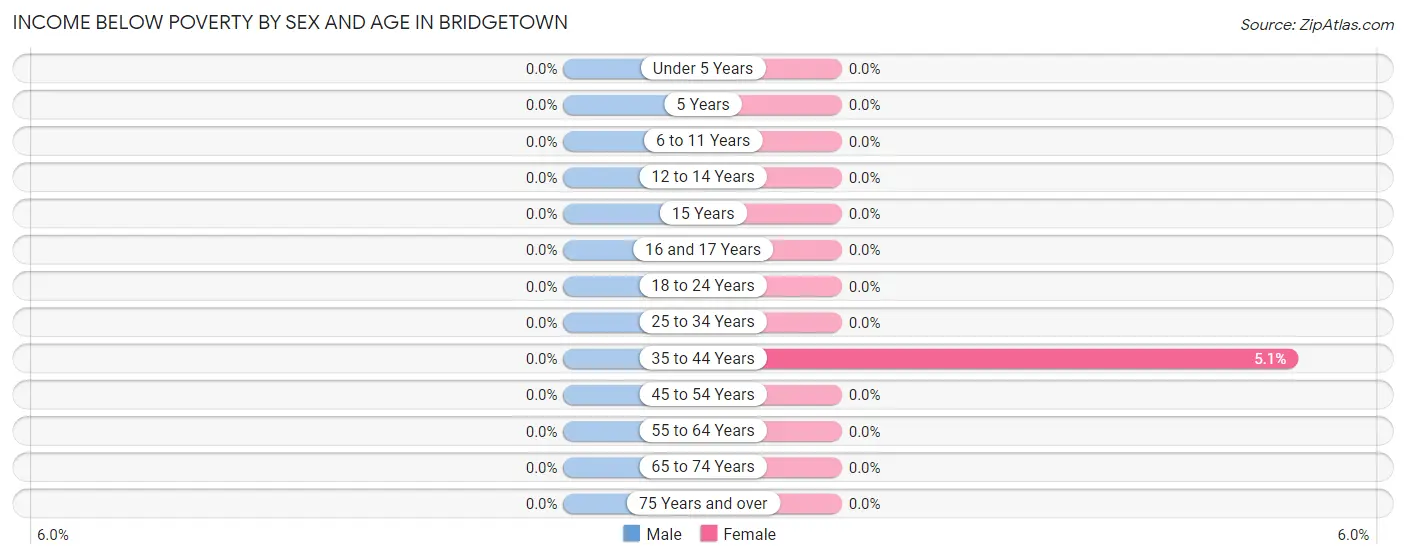
| Age Bracket | Male | Female |
| Under 5 Years | 0 (0.0%) | 0 (0.0%) |
| 5 Years | 0 (0.0%) | 0 (0.0%) |
| 6 to 11 Years | 0 (0.0%) | 0 (0.0%) |
| 12 to 14 Years | 0 (0.0%) | 0 (0.0%) |
| 15 Years | 0 (0.0%) | 0 (0.0%) |
| 16 and 17 Years | 0 (0.0%) | 0 (0.0%) |
| 18 to 24 Years | 0 (0.0%) | 0 (0.0%) |
| 25 to 34 Years | 0 (0.0%) | 0 (0.0%) |
| 35 to 44 Years | 0 (0.0%) | 16 (5.1%) |
| 45 to 54 Years | 0 (0.0%) | 0 (0.0%) |
| 55 to 64 Years | 0 (0.0%) | 0 (0.0%) |
| 65 to 74 Years | 0 (0.0%) | 0 (0.0%) |
| 75 Years and over | 0 (0.0%) | 0 (0.0%) |
| Total | 0 (0.0%) | 16 (0.9%) |
Income Above Poverty by Sex and Age in Bridgetown
According to the poverty statistics in Bridgetown, males aged under 5 years and females aged under 5 years are the age groups that are most secure financially, with 100.0% of males and 100.0% of females in these age groups living above the poverty line.
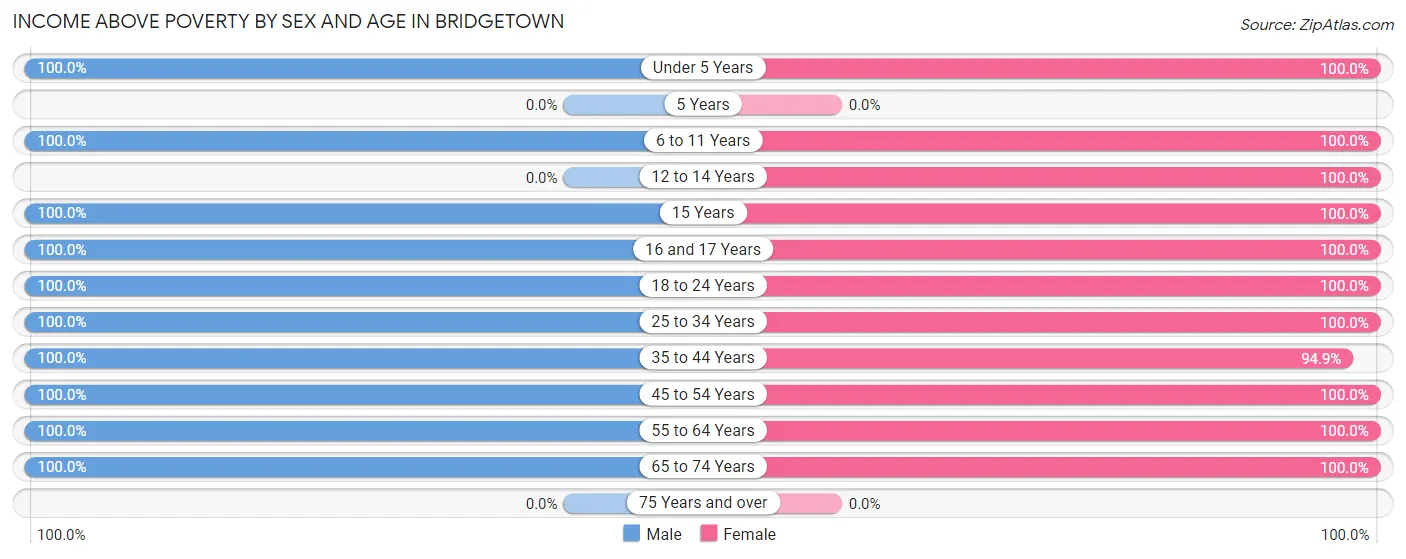
| Age Bracket | Male | Female |
| Under 5 Years | 36 (100.0%) | 64 (100.0%) |
| 5 Years | 0 (0.0%) | 0 (0.0%) |
| 6 to 11 Years | 108 (100.0%) | 143 (100.0%) |
| 12 to 14 Years | 0 (0.0%) | 137 (100.0%) |
| 15 Years | 34 (100.0%) | 68 (100.0%) |
| 16 and 17 Years | 56 (100.0%) | 10 (100.0%) |
| 18 to 24 Years | 220 (100.0%) | 377 (100.0%) |
| 25 to 34 Years | 88 (100.0%) | 101 (100.0%) |
| 35 to 44 Years | 149 (100.0%) | 299 (94.9%) |
| 45 to 54 Years | 364 (100.0%) | 249 (100.0%) |
| 55 to 64 Years | 37 (100.0%) | 145 (100.0%) |
| 65 to 74 Years | 124 (100.0%) | 68 (100.0%) |
| 75 Years and over | 0 (0.0%) | 0 (0.0%) |
| Total | 1,216 (100.0%) | 1,661 (99.1%) |
Income Below Poverty Among Married-Couple Families in Bridgetown
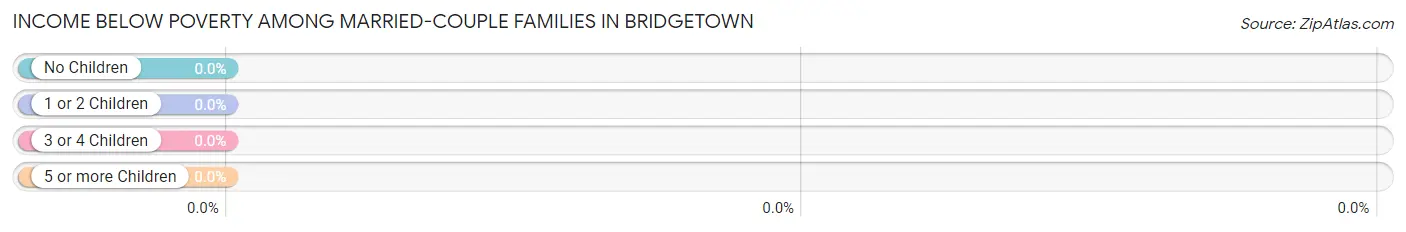
| Children | Above Poverty | Below Poverty |
| No Children | 180 (100.0%) | 0 (0.0%) |
| 1 or 2 Children | 387 (100.0%) | 0 (0.0%) |
| 3 or 4 Children | 0 (0.0%) | 0 (0.0%) |
| 5 or more Children | 0 (0.0%) | 0 (0.0%) |
| Total | 567 (100.0%) | 0 (0.0%) |
Income Below Poverty Among Single-Parent Households in Bridgetown
| Children | Single Father | Single Mother |
| No Children | 0 (0.0%) | 0 (0.0%) |
| 1 or 2 Children | 0 (0.0%) | 0 (0.0%) |
| 3 or 4 Children | 0 (0.0%) | 0 (0.0%) |
| 5 or more Children | 0 (0.0%) | 0 (0.0%) |
| Total | 0 (0.0%) | 0 (0.0%) |
Income Below Poverty Among Married-Couple vs Single-Parent Households in Bridgetown
| Children | Married-Couple Families | Single-Parent Households |
| No Children | 0 (0.0%) | 0 (0.0%) |
| 1 or 2 Children | 0 (0.0%) | 0 (0.0%) |
| 3 or 4 Children | 0 (0.0%) | 0 (0.0%) |
| 5 or more Children | 0 (0.0%) | 0 (0.0%) |
| Total | 0 (0.0%) | 0 (0.0%) |
Race in Bridgetown
The most populous races in Bridgetown are White / Caucasian (2,617 | 90.5%), Two or more Races (187 | 6.5%), and Hispanic or Latino (105 | 3.6%).
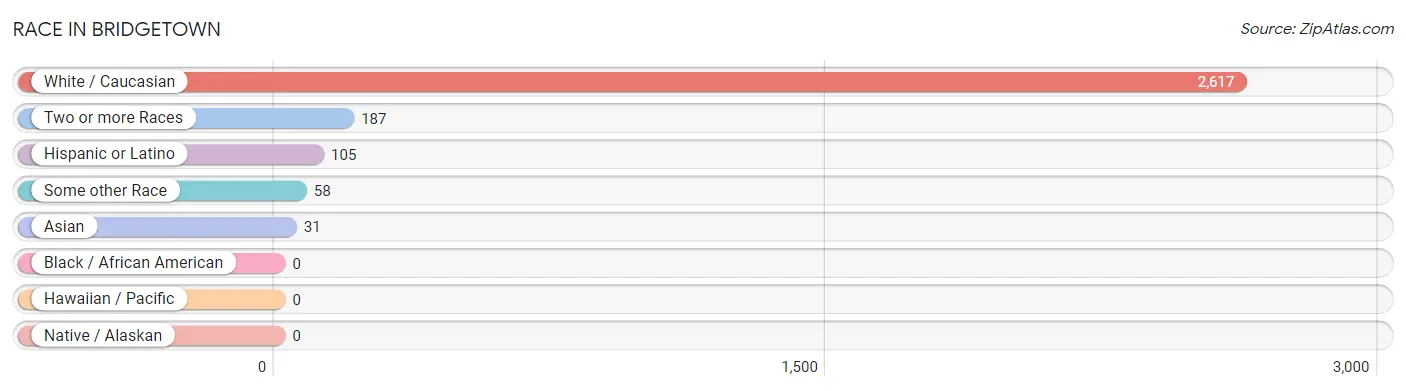
| Race | # Population | % Population |
| Asian | 31 | 1.1% |
| Black / African American | 0 | 0.0% |
| Hawaiian / Pacific | 0 | 0.0% |
| Hispanic or Latino | 105 | 3.6% |
| Native / Alaskan | 0 | 0.0% |
| White / Caucasian | 2,617 | 90.5% |
| Two or more Races | 187 | 6.5% |
| Some other Race | 58 | 2.0% |
| Total | 2,893 | 100.0% |
Ancestry in Bridgetown
The most populous ancestries reported in Bridgetown are German (597 | 20.6%), Irish (440 | 15.2%), American (419 | 14.5%), French (388 | 13.4%), and Mexican (105 | 3.6%), together accounting for 67.4% of all Bridgetown residents.
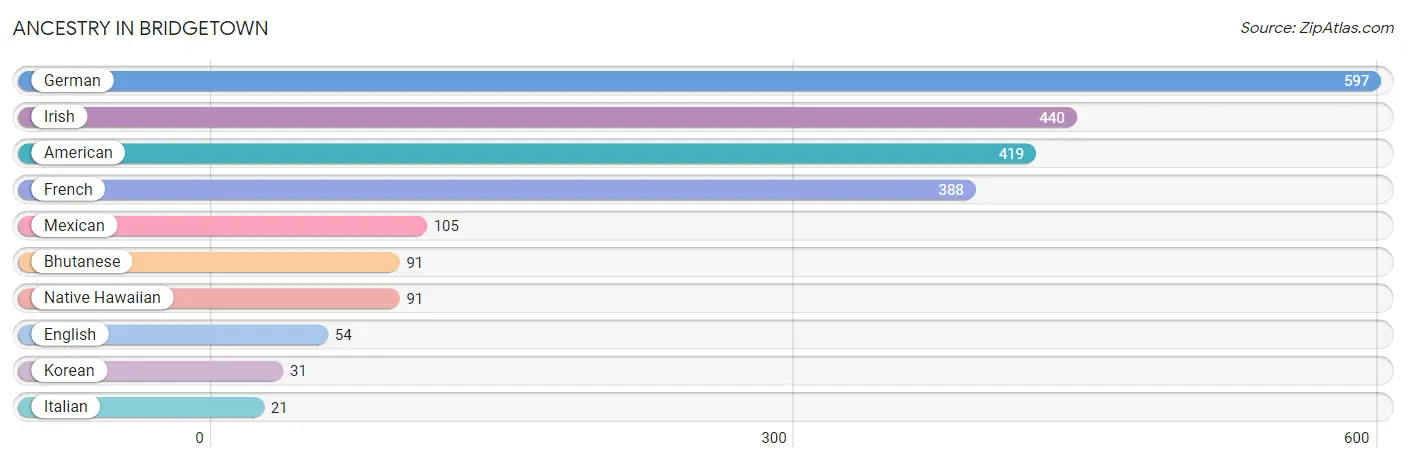
| Ancestry | # Population | % Population |
| American | 419 | 14.5% |
| Bhutanese | 91 | 3.2% |
| English | 54 | 1.9% |
| French | 388 | 13.4% |
| German | 597 | 20.6% |
| Irish | 440 | 15.2% |
| Italian | 21 | 0.7% |
| Korean | 31 | 1.1% |
| Mexican | 105 | 3.6% |
| Native Hawaiian | 91 | 3.2% | View All 10 Rows |
Immigrants in Bridgetown
The most numerous immigrant groups reported in Bridgetown came from Asia (31 | 1.1%), Philippines (31 | 1.1%), and South Eastern Asia (31 | 1.1%), together accounting for 3.2% of all Bridgetown residents.
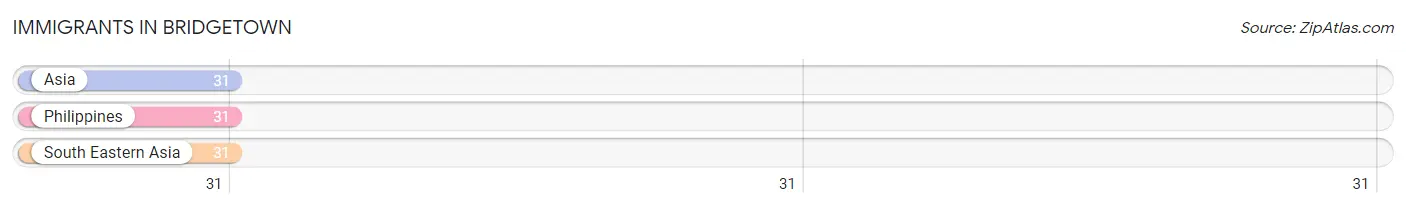
| Immigration Origin | # Population | % Population |
| Asia | 31 | 1.1% |
| Philippines | 31 | 1.1% |
| South Eastern Asia | 31 | 1.1% | View All 3 Rows |
Sex and Age in Bridgetown
Sex and Age in Bridgetown
The most populous age groups in Bridgetown are 45 to 49 Years (265 | 21.8%) for men and 15 to 19 Years (283 | 16.9%) for women.
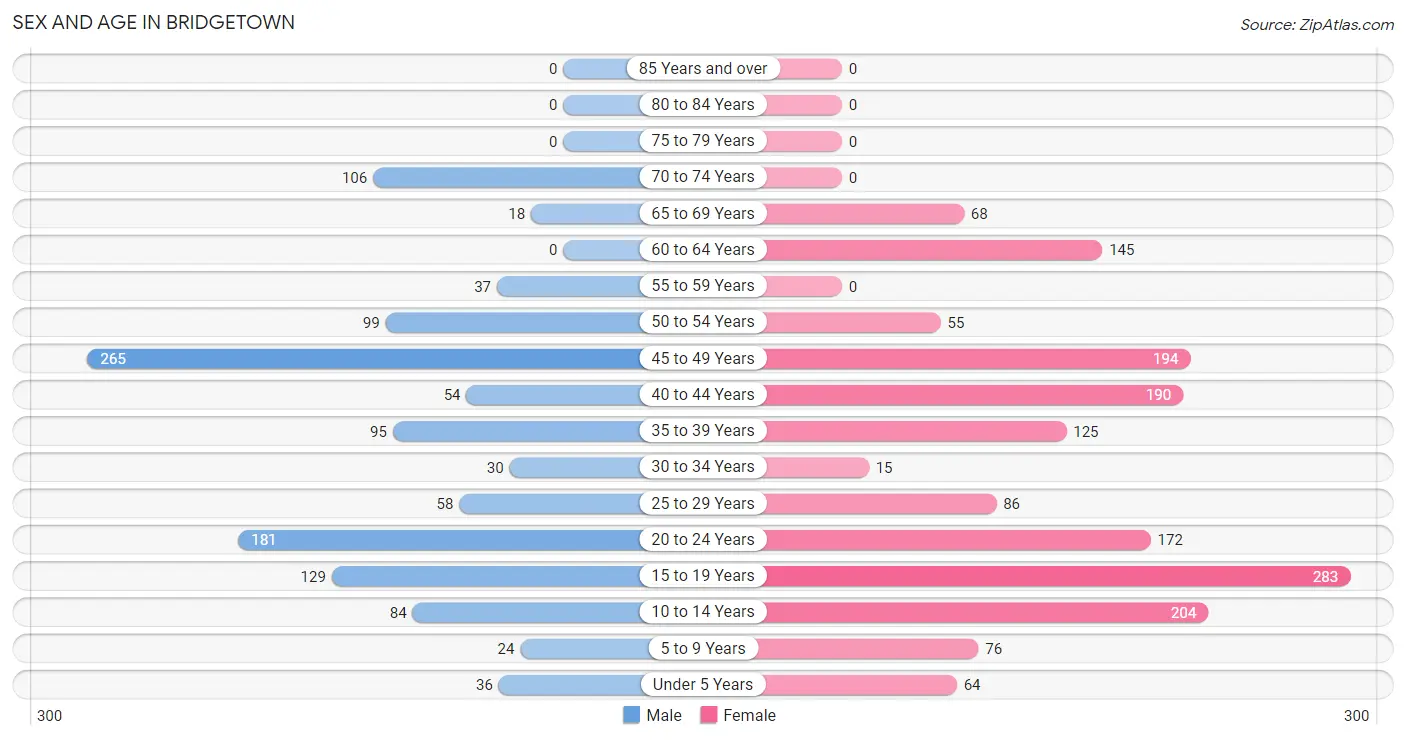
| Age Bracket | Male | Female |
| Under 5 Years | 36 (3.0%) | 64 (3.8%) |
| 5 to 9 Years | 24 (2.0%) | 76 (4.5%) |
| 10 to 14 Years | 84 (6.9%) | 204 (12.2%) |
| 15 to 19 Years | 129 (10.6%) | 283 (16.9%) |
| 20 to 24 Years | 181 (14.9%) | 172 (10.3%) |
| 25 to 29 Years | 58 (4.8%) | 86 (5.1%) |
| 30 to 34 Years | 30 (2.5%) | 15 (0.9%) |
| 35 to 39 Years | 95 (7.8%) | 125 (7.4%) |
| 40 to 44 Years | 54 (4.4%) | 190 (11.3%) |
| 45 to 49 Years | 265 (21.8%) | 194 (11.6%) |
| 50 to 54 Years | 99 (8.1%) | 55 (3.3%) |
| 55 to 59 Years | 37 (3.0%) | 0 (0.0%) |
| 60 to 64 Years | 0 (0.0%) | 145 (8.6%) |
| 65 to 69 Years | 18 (1.5%) | 68 (4.1%) |
| 70 to 74 Years | 106 (8.7%) | 0 (0.0%) |
| 75 to 79 Years | 0 (0.0%) | 0 (0.0%) |
| 80 to 84 Years | 0 (0.0%) | 0 (0.0%) |
| 85 Years and over | 0 (0.0%) | 0 (0.0%) |
| Total | 1,216 (100.0%) | 1,677 (100.0%) |
Families and Households in Bridgetown
Median Family Size in Bridgetown
The median family size in Bridgetown is 3.45 persons per family, with married-couple families (567 | 70.6%) accounting for the largest median family size of 4.02 persons per family. On the other hand, single female/mother families (218 | 27.2%) represent the smallest median family size with 2.04 persons per family.
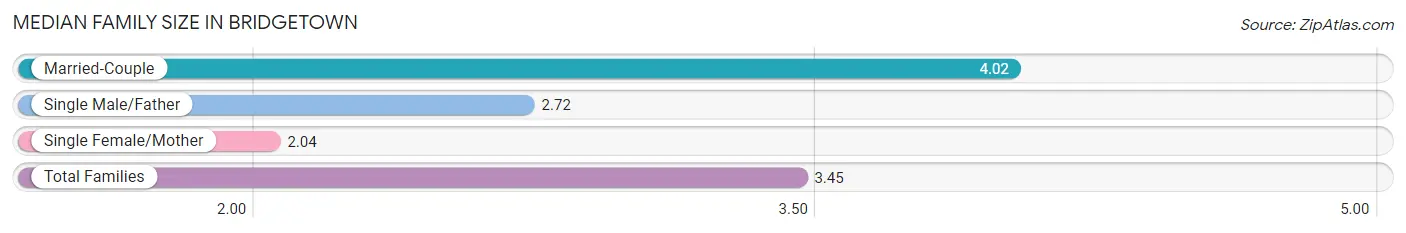
| Family Type | # Families | Family Size |
| Married-Couple | 567 (70.6%) | 4.02 |
| Single Male/Father | 18 (2.2%) | 2.72 |
| Single Female/Mother | 218 (27.2%) | 2.04 |
| Total Families | 803 (100.0%) | 3.45 |
Median Household Size in Bridgetown
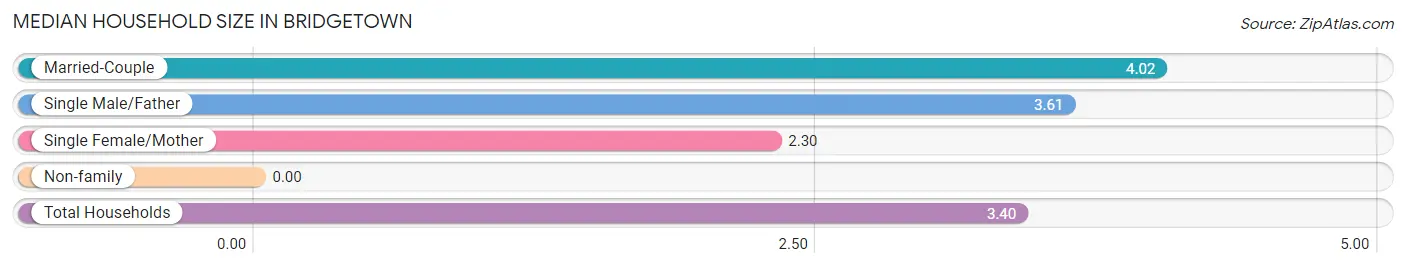
| Household Type | # Households | Household Size |
| Married-Couple | 567 (66.5%) | 4.02 |
| Single Male/Father | 18 (2.1%) | 3.61 |
| Single Female/Mother | 218 (25.6%) | 2.30 |
| Non-family | 49 (5.8%) | - |
| Total Households | 852 (100.0%) | 3.40 |
Household Size by Marriage Status in Bridgetown
Out of a total of 852 households in Bridgetown, 803 (94.3%) are family households, while 49 (5.8%) are nonfamily households. The most numerous type of family households are 2-person households, comprising 245, and the most common type of nonfamily households are 1-person households, comprising 49.
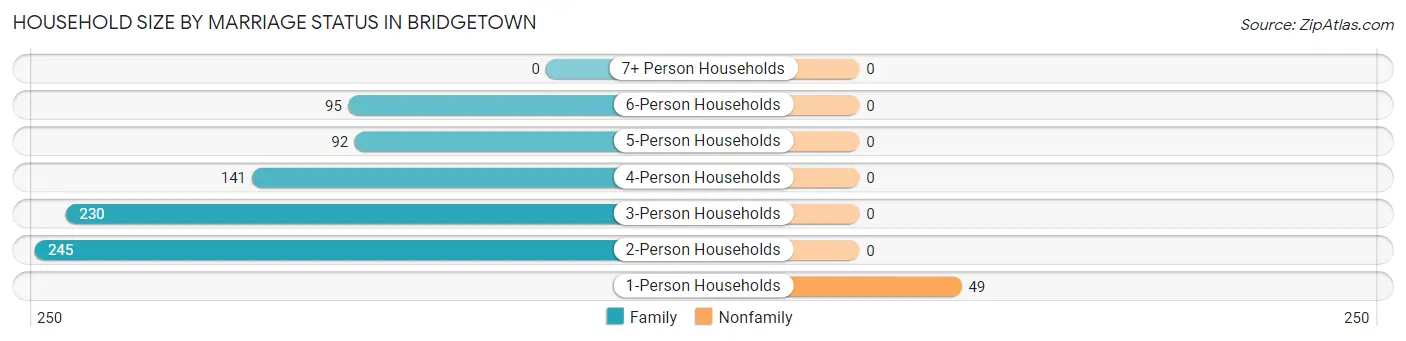
| Household Size | Family Households | Nonfamily Households |
| 1-Person Households | - | 49 (5.8%) |
| 2-Person Households | 245 (28.8%) | 0 (0.0%) |
| 3-Person Households | 230 (27.0%) | 0 (0.0%) |
| 4-Person Households | 141 (16.6%) | 0 (0.0%) |
| 5-Person Households | 92 (10.8%) | 0 (0.0%) |
| 6-Person Households | 95 (11.2%) | 0 (0.0%) |
| 7+ Person Households | 0 (0.0%) | 0 (0.0%) |
| Total | 803 (94.3%) | 49 (5.8%) |
Female Fertility in Bridgetown
Fertility by Age in Bridgetown
Average fertility rate in Bridgetown is 54.0 births per 1,000 women. Women in the age bracket of 20 to 34 years have the highest fertility rate with 223.0 births per 1,000 women. Women in the age bracket of 20 to 34 years acount for 100.0% of all women with births.
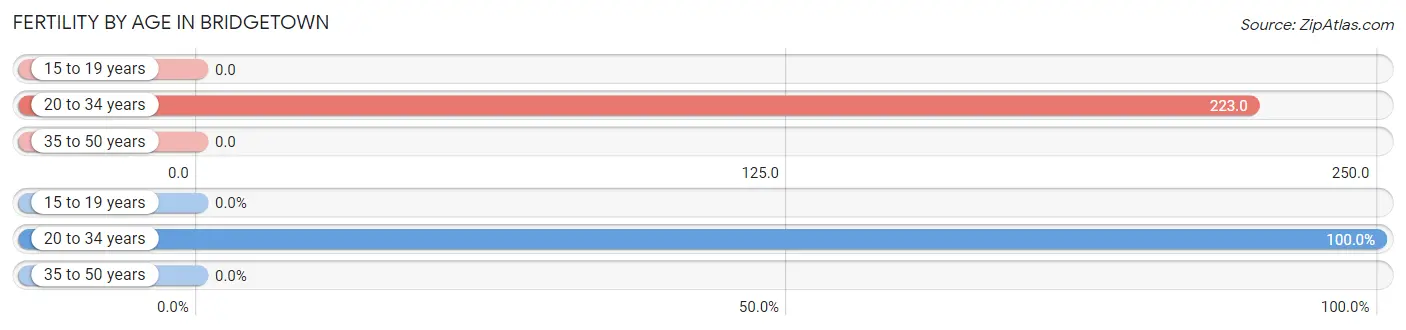
| Age Bracket | Women with Births | Births / 1,000 Women |
| 15 to 19 years | 0 (0.0%) | 0.0 |
| 20 to 34 years | 61 (100.0%) | 223.0 |
| 35 to 50 years | 0 (0.0%) | 0.0 |
| Total | 61 (100.0%) | 54.0 |
Fertility by Age by Marriage Status in Bridgetown
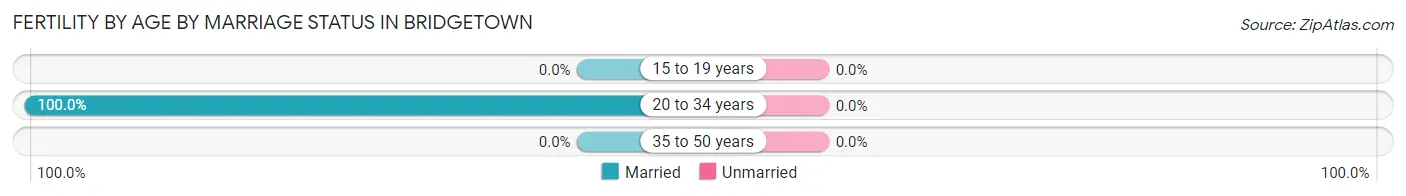
| Age Bracket | Married | Unmarried |
| 15 to 19 years | 0 (0.0%) | 0 (0.0%) |
| 20 to 34 years | 61 (100.0%) | 0 (0.0%) |
| 35 to 50 years | 0 (0.0%) | 0 (0.0%) |
| Total | 61 (100.0%) | 0 (0.0%) |
Fertility by Education in Bridgetown
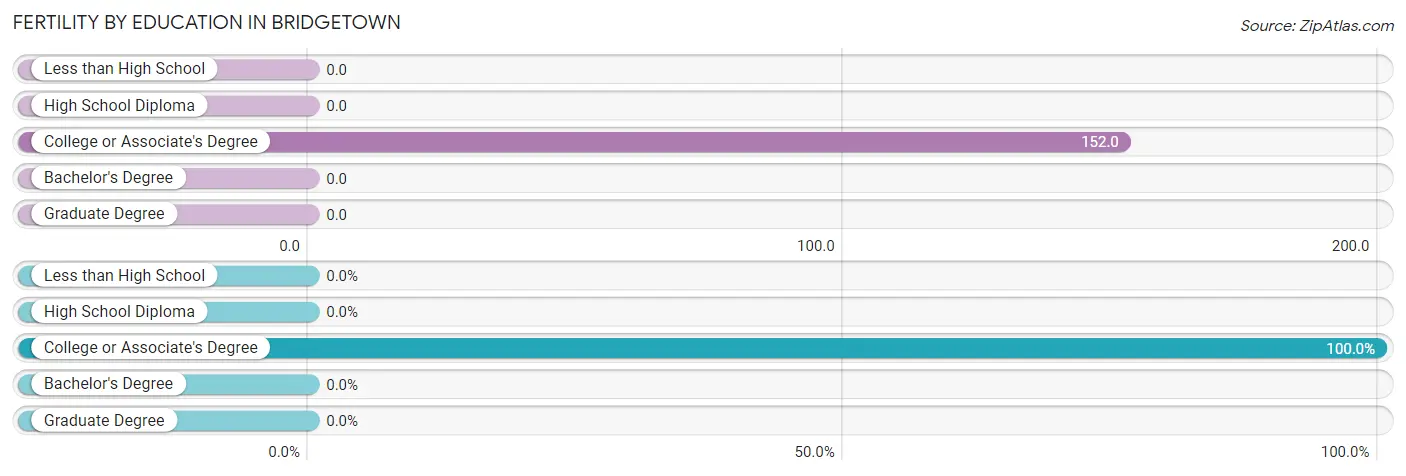
| Educational Attainment | Women with Births | Births / 1,000 Women |
| Less than High School | 0 (0.0%) | 0.0 |
| High School Diploma | 0 (0.0%) | 0.0 |
| College or Associate's Degree | 61 (100.0%) | 152.0 |
| Bachelor's Degree | 0 (0.0%) | 0.0 |
| Graduate Degree | 0 (0.0%) | 0.0 |
| Total | 61 (100.0%) | 54.0 |
Fertility by Education by Marriage Status in Bridgetown
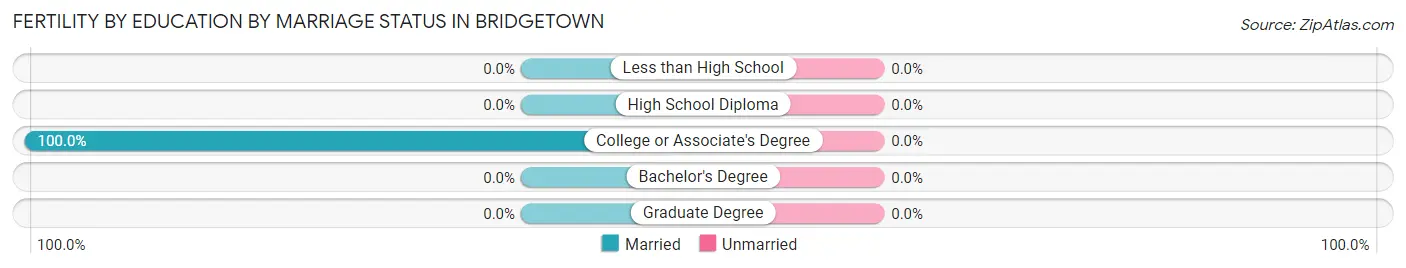
| Educational Attainment | Married | Unmarried |
| Less than High School | 0 (0.0%) | 0 (0.0%) |
| High School Diploma | 0 (0.0%) | 0 (0.0%) |
| College or Associate's Degree | 61 (100.0%) | 0 (0.0%) |
| Bachelor's Degree | 0 (0.0%) | 0 (0.0%) |
| Graduate Degree | 0 (0.0%) | 0 (0.0%) |
| Total | 61 (100.0%) | 0 (0.0%) |
Employment Characteristics in Bridgetown
Employment by Class of Employer in Bridgetown
Among the 1,480 employed individuals in Bridgetown, private company employees (1,174 | 79.3%), state government employees (101 | 6.8%), and self-employed (not incorporated) (83 | 5.6%) make up the most common classes of employment.
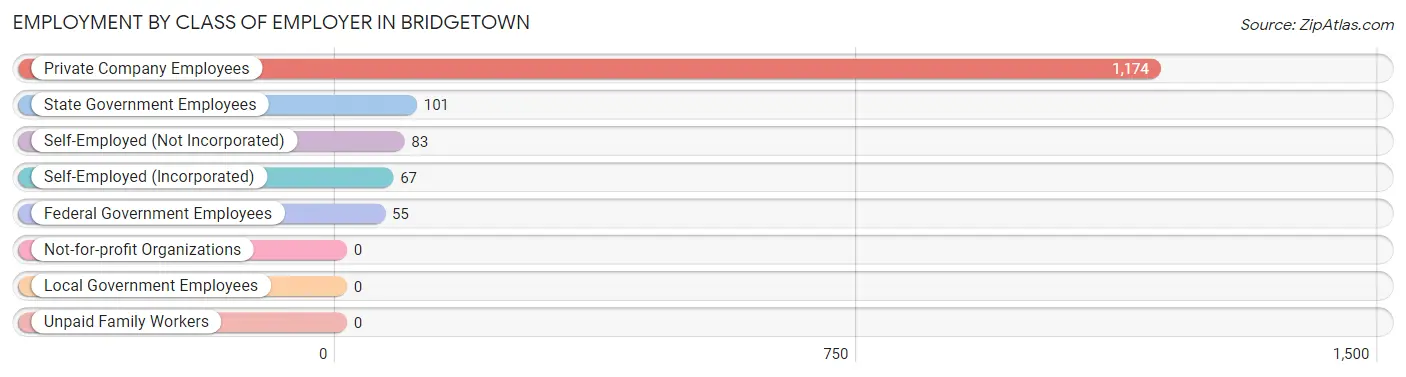
| Employer Class | # Employees | % Employees |
| Private Company Employees | 1,174 | 79.3% |
| Self-Employed (Incorporated) | 67 | 4.5% |
| Self-Employed (Not Incorporated) | 83 | 5.6% |
| Not-for-profit Organizations | 0 | 0.0% |
| Local Government Employees | 0 | 0.0% |
| State Government Employees | 101 | 6.8% |
| Federal Government Employees | 55 | 3.7% |
| Unpaid Family Workers | 0 | 0.0% |
| Total | 1,480 | 100.0% |
Employment Status by Age in Bridgetown
According to the labor force statistics for Bridgetown, out of the total population over 16 years of age (2,303), 73.3% or 1,688 individuals are in the labor force, with 12.3% or 208 of them unemployed. The age group with the highest labor force participation rate is 25 to 29 years, with 100.0% or 144 individuals in the labor force. Within the labor force, the 60 to 64 years age range has the highest percentage of unemployed individuals, with 100.0% or 35 of them being unemployed.
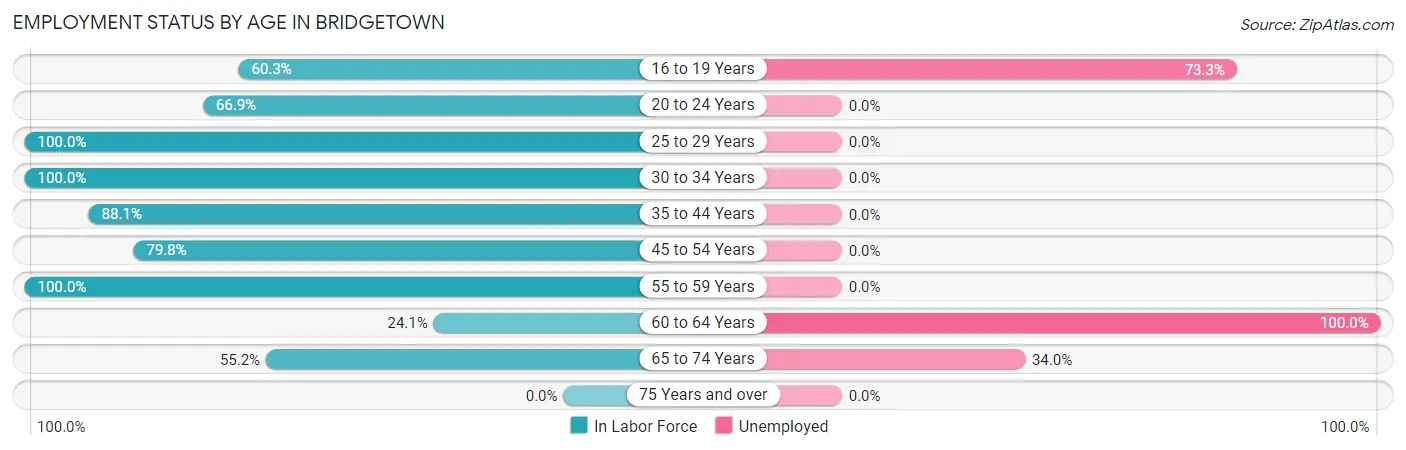
| Age Bracket | In Labor Force | Unemployed |
| 16 to 19 Years | 187 (60.3%) | 137 (73.3%) |
| 20 to 24 Years | 236 (66.9%) | 0 (0.0%) |
| 25 to 29 Years | 144 (100.0%) | 0 (0.0%) |
| 30 to 34 Years | 45 (100.0%) | 0 (0.0%) |
| 35 to 44 Years | 409 (88.1%) | 0 (0.0%) |
| 45 to 54 Years | 489 (79.8%) | 0 (0.0%) |
| 55 to 59 Years | 37 (100.0%) | 0 (0.0%) |
| 60 to 64 Years | 35 (24.1%) | 35 (100.0%) |
| 65 to 74 Years | 106 (55.2%) | 36 (34.0%) |
| 75 Years and over | 0 (0.0%) | 0 (0.0%) |
| Total | 1,688 (73.3%) | 208 (12.3%) |
Employment Status by Educational Attainment in Bridgetown
According to labor force statistics for Bridgetown, 80.0% of individuals (1,158) out of the total population between 25 and 64 years of age (1,448) are in the labor force, with 3.0% or 35 of them being unemployed. The group with the highest labor force participation rate are those with the educational attainment of less than high school, with 100.0% or 55 individuals in the labor force. Within the labor force, individuals with high school diploma education have the highest percentage of unemployment, with 11.4% or 35 of them being unemployed.
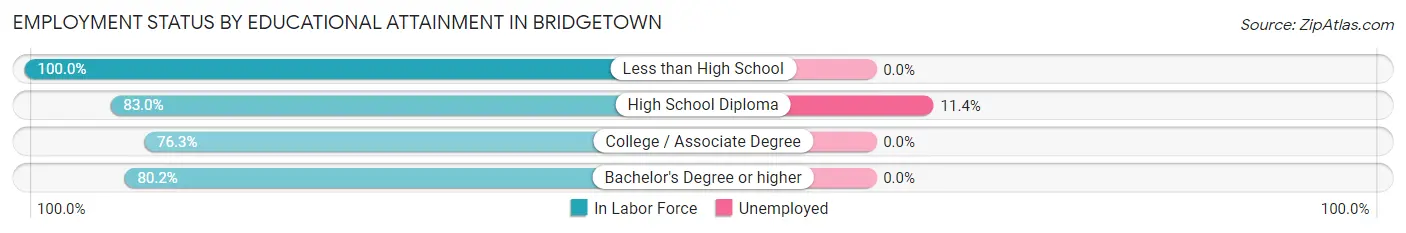
| Educational Attainment | In Labor Force | Unemployed |
| Less than High School | 55 (100.0%) | 0 (0.0%) |
| High School Diploma | 308 (83.0%) | 42 (11.4%) |
| College / Associate Degree | 460 (76.3%) | 0 (0.0%) |
| Bachelor's Degree or higher | 336 (80.2%) | 0 (0.0%) |
| Total | 1,158 (80.0%) | 43 (3.0%) |
Employment Occupations by Sex in Bridgetown
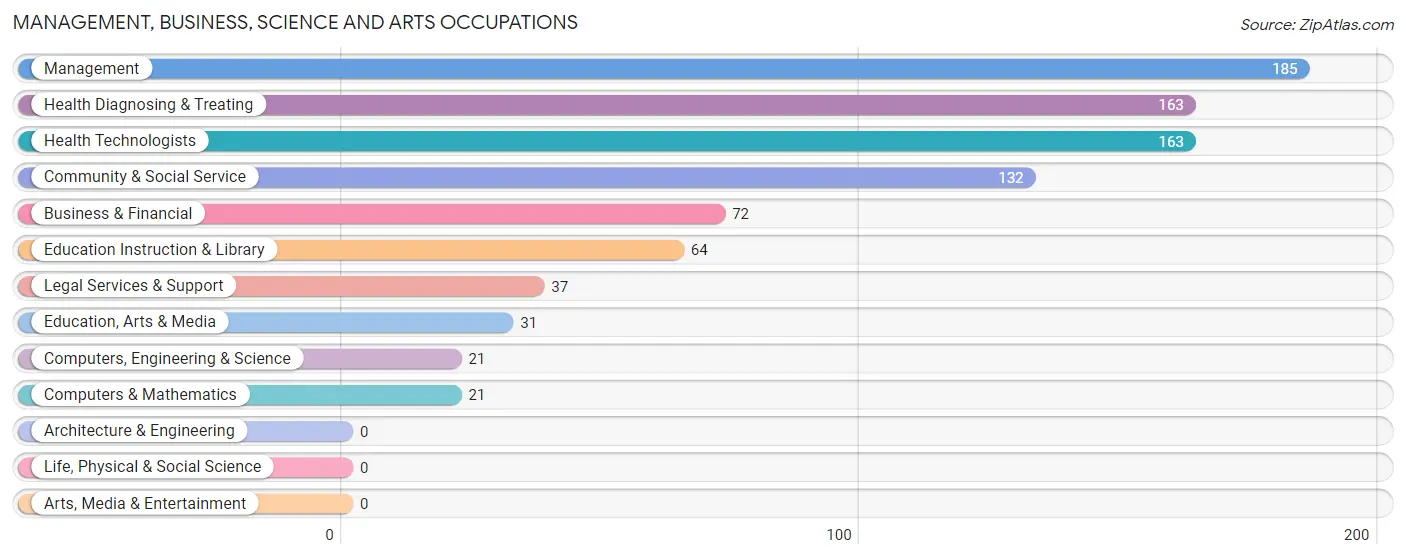
Management, Business, Science and Arts Occupations
The most common Management, Business, Science and Arts occupations in Bridgetown are Management (185 | 12.5%), Health Diagnosing & Treating (163 | 11.0%), Health Technologists (163 | 11.0%), Community & Social Service (132 | 8.9%), and Business & Financial (72 | 4.9%).
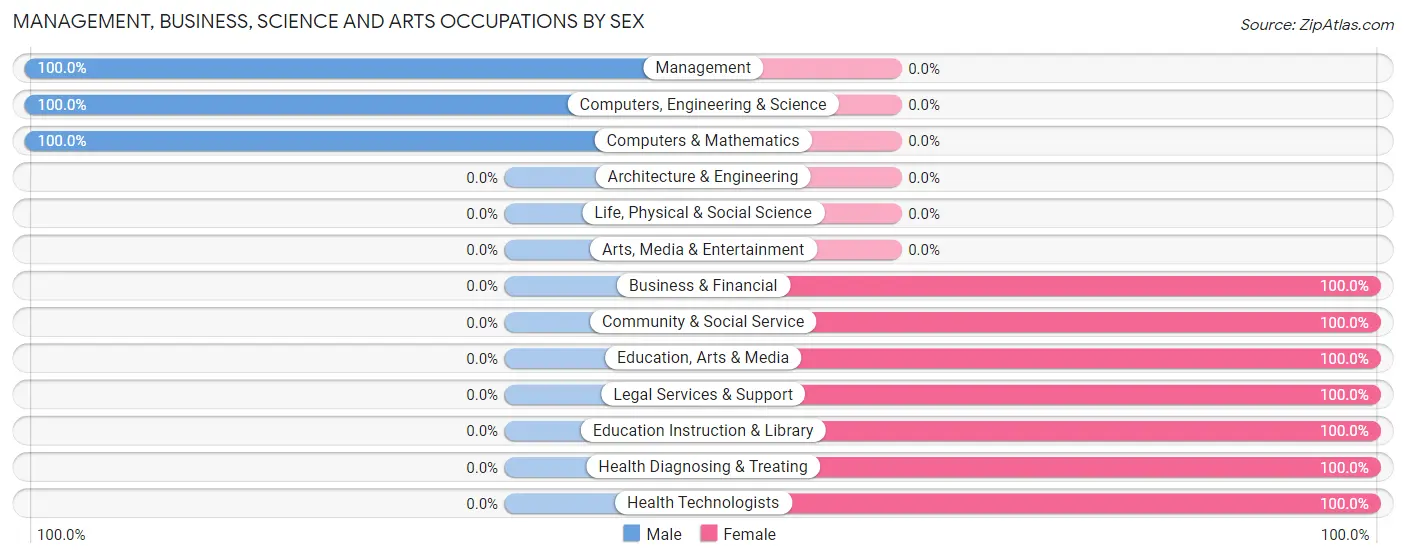
Management, Business, Science and Arts Occupations by Sex
Within the Management, Business, Science and Arts occupations in Bridgetown, the most male-oriented occupations are Management (100.0%), Computers, Engineering & Science (100.0%), and Computers & Mathematics (100.0%), while the most female-oriented occupations are Business & Financial (100.0%), Community & Social Service (100.0%), and Education, Arts & Media (100.0%).
| Occupation | Male | Female |
| Management | 185 (100.0%) | 0 (0.0%) |
| Business & Financial | 0 (0.0%) | 72 (100.0%) |
| Computers, Engineering & Science | 21 (100.0%) | 0 (0.0%) |
| Computers & Mathematics | 21 (100.0%) | 0 (0.0%) |
| Architecture & Engineering | 0 (0.0%) | 0 (0.0%) |
| Life, Physical & Social Science | 0 (0.0%) | 0 (0.0%) |
| Community & Social Service | 0 (0.0%) | 132 (100.0%) |
| Education, Arts & Media | 0 (0.0%) | 31 (100.0%) |
| Legal Services & Support | 0 (0.0%) | 37 (100.0%) |
| Education Instruction & Library | 0 (0.0%) | 64 (100.0%) |
| Arts, Media & Entertainment | 0 (0.0%) | 0 (0.0%) |
| Health Diagnosing & Treating | 0 (0.0%) | 163 (100.0%) |
| Health Technologists | 0 (0.0%) | 163 (100.0%) |
| Total (Category) | 206 (35.9%) | 367 (64.0%) |
| Total (Overall) | 786 (53.1%) | 694 (46.9%) |
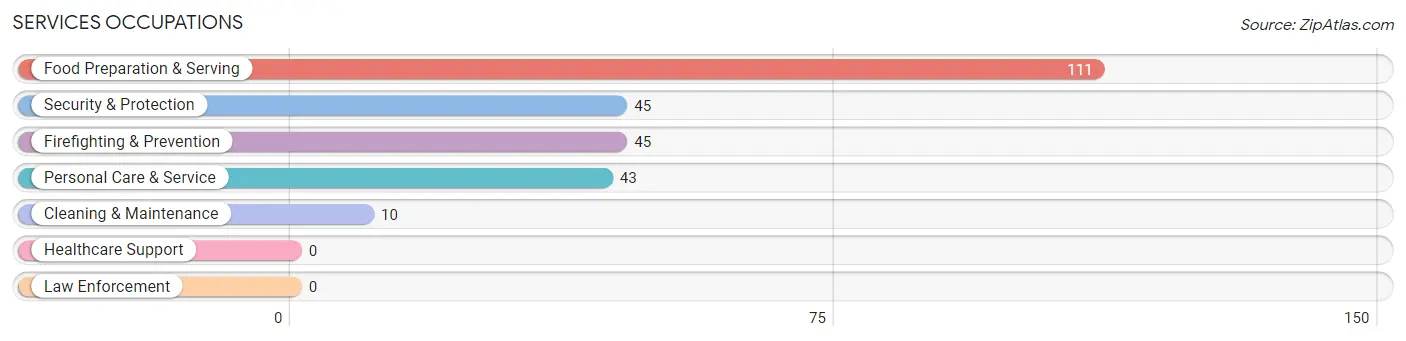
Services Occupations
The most common Services occupations in Bridgetown are Food Preparation & Serving (111 | 7.5%), Security & Protection (45 | 3.0%), Firefighting & Prevention (45 | 3.0%), Personal Care & Service (43 | 2.9%), and Cleaning & Maintenance (10 | 0.7%).
Services Occupations by Sex
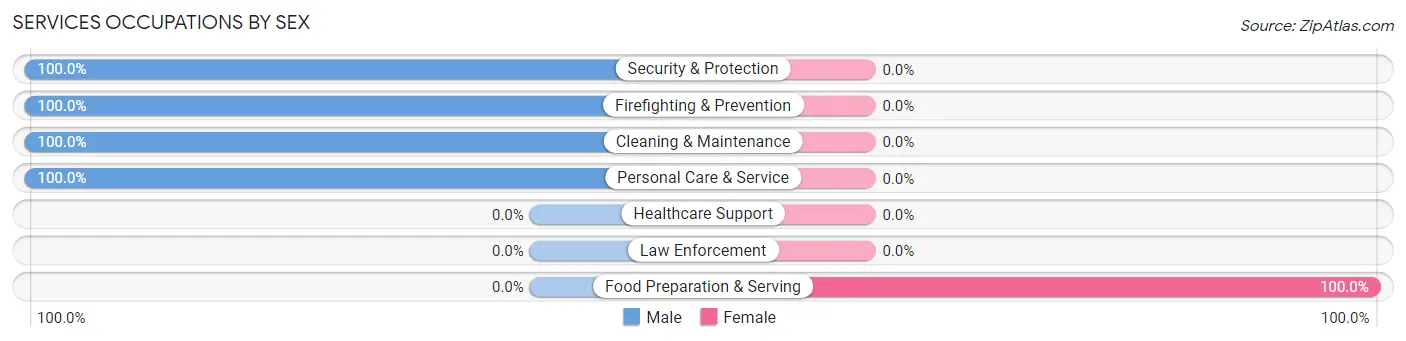
| Occupation | Male | Female |
| Healthcare Support | 0 (0.0%) | 0 (0.0%) |
| Security & Protection | 45 (100.0%) | 0 (0.0%) |
| Firefighting & Prevention | 45 (100.0%) | 0 (0.0%) |
| Law Enforcement | 0 (0.0%) | 0 (0.0%) |
| Food Preparation & Serving | 0 (0.0%) | 111 (100.0%) |
| Cleaning & Maintenance | 10 (100.0%) | 0 (0.0%) |
| Personal Care & Service | 43 (100.0%) | 0 (0.0%) |
| Total (Category) | 98 (46.9%) | 111 (53.1%) |
| Total (Overall) | 786 (53.1%) | 694 (46.9%) |
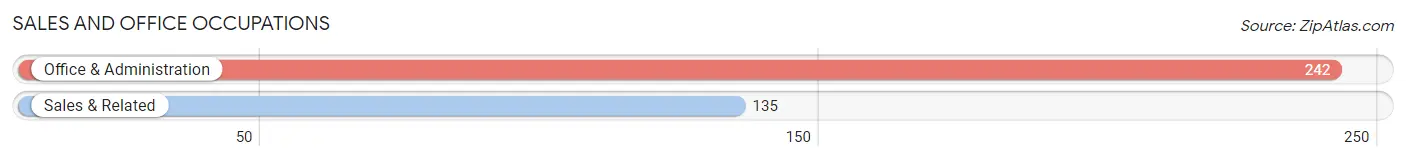
Sales and Office Occupations
The most common Sales and Office occupations in Bridgetown are Office & Administration (242 | 16.4%), and Sales & Related (135 | 9.1%).
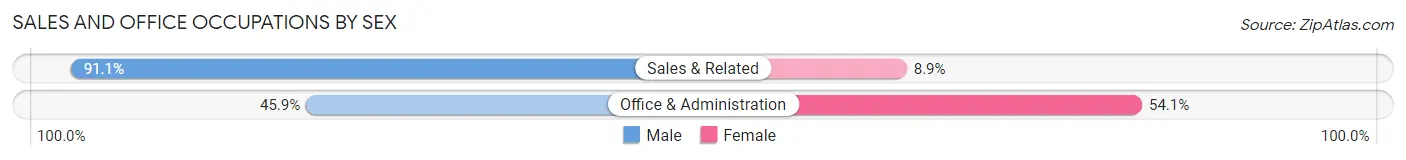
Sales and Office Occupations by Sex
| Occupation | Male | Female |
| Sales & Related | 123 (91.1%) | 12 (8.9%) |
| Office & Administration | 111 (45.9%) | 131 (54.1%) |
| Total (Category) | 234 (62.1%) | 143 (37.9%) |
| Total (Overall) | 786 (53.1%) | 694 (46.9%) |
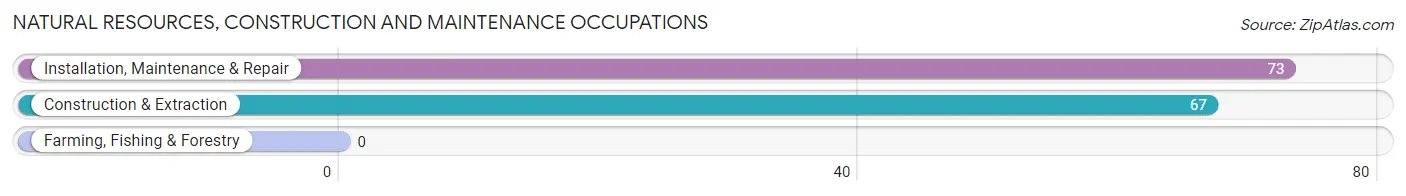
Natural Resources, Construction and Maintenance Occupations
The most common Natural Resources, Construction and Maintenance occupations in Bridgetown are Installation, Maintenance & Repair (73 | 4.9%), and Construction & Extraction (67 | 4.5%).
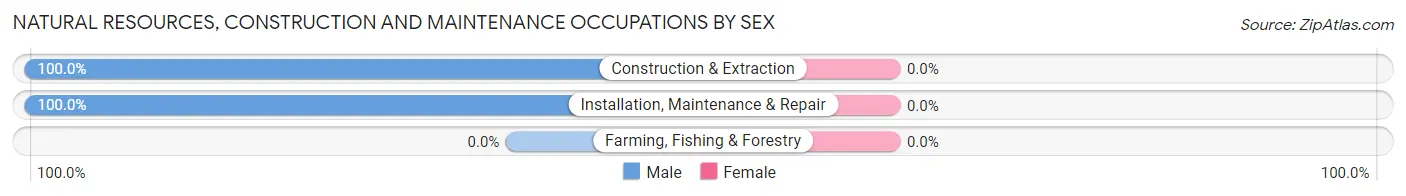
Natural Resources, Construction and Maintenance Occupations by Sex
| Occupation | Male | Female |
| Farming, Fishing & Forestry | 0 (0.0%) | 0 (0.0%) |
| Construction & Extraction | 67 (100.0%) | 0 (0.0%) |
| Installation, Maintenance & Repair | 73 (100.0%) | 0 (0.0%) |
| Total (Category) | 140 (100.0%) | 0 (0.0%) |
| Total (Overall) | 786 (53.1%) | 694 (46.9%) |
Production, Transportation and Moving Occupations
The most common Production, Transportation and Moving occupations in Bridgetown are Transportation (91 | 6.1%), Material Moving (57 | 3.8%), and Production (33 | 2.2%).
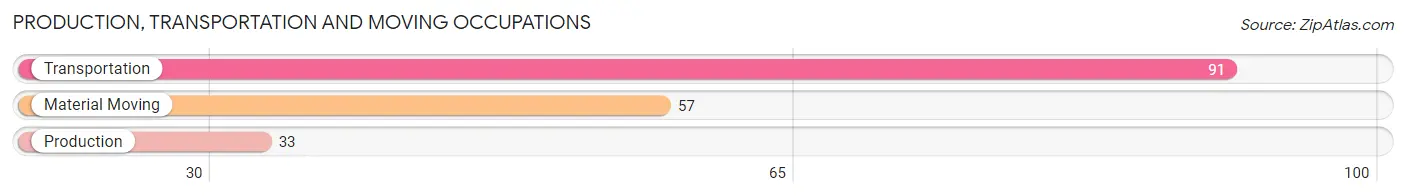
Production, Transportation and Moving Occupations by Sex
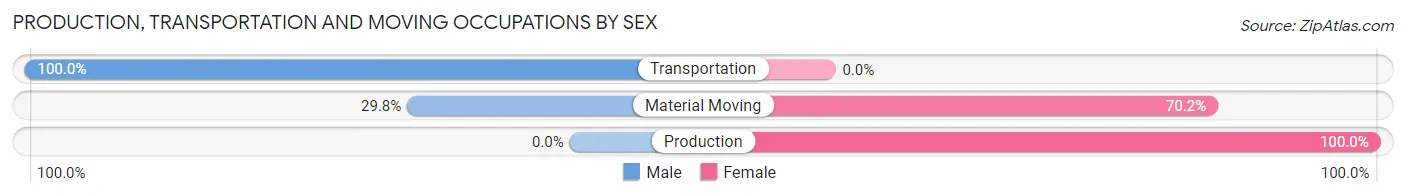
| Occupation | Male | Female |
| Production | 0 (0.0%) | 33 (100.0%) |
| Transportation | 91 (100.0%) | 0 (0.0%) |
| Material Moving | 17 (29.8%) | 40 (70.2%) |
| Total (Category) | 108 (59.7%) | 73 (40.3%) |
| Total (Overall) | 786 (53.1%) | 694 (46.9%) |
Employment Industries by Sex in Bridgetown
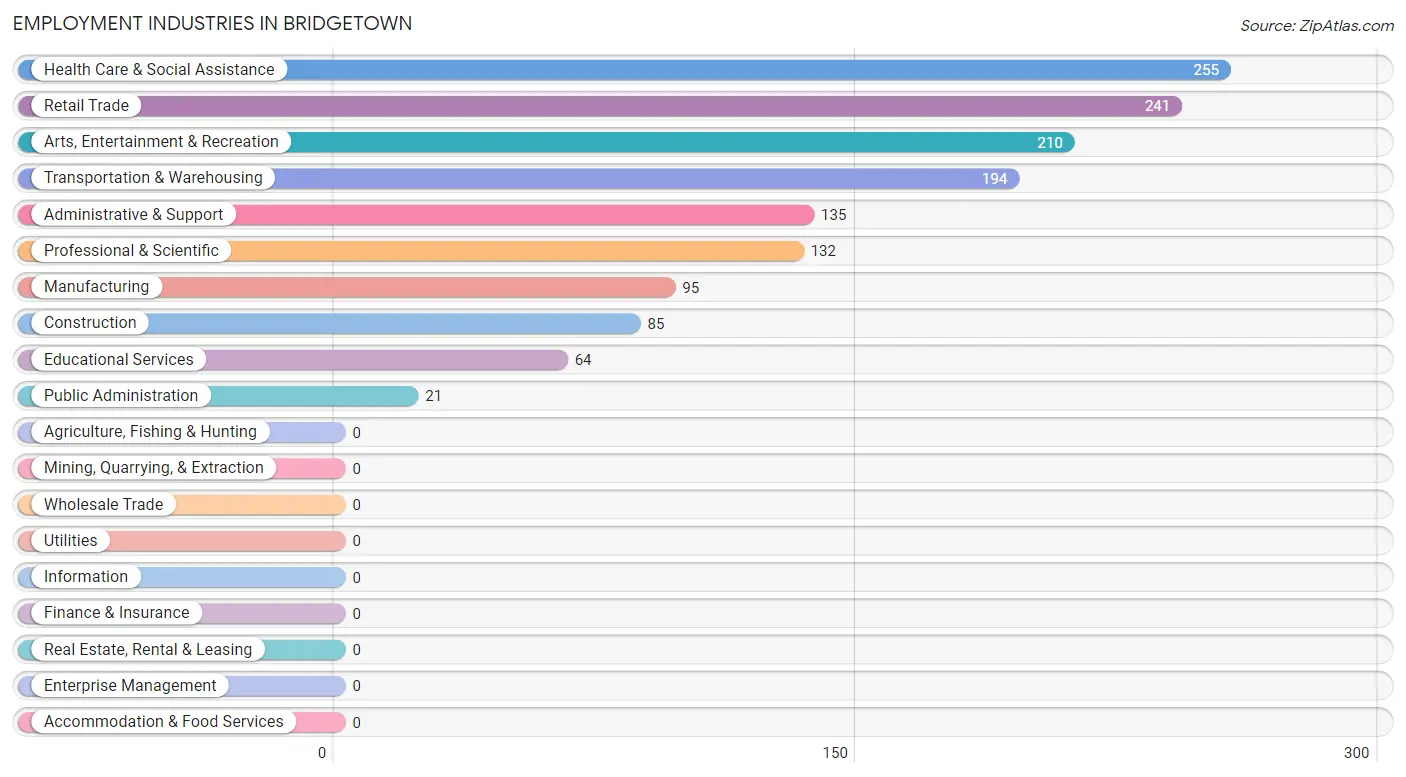
Employment Industries in Bridgetown
The major employment industries in Bridgetown include Health Care & Social Assistance (255 | 17.2%), Retail Trade (241 | 16.3%), Arts, Entertainment & Recreation (210 | 14.2%), Transportation & Warehousing (194 | 13.1%), and Administrative & Support (135 | 9.1%).
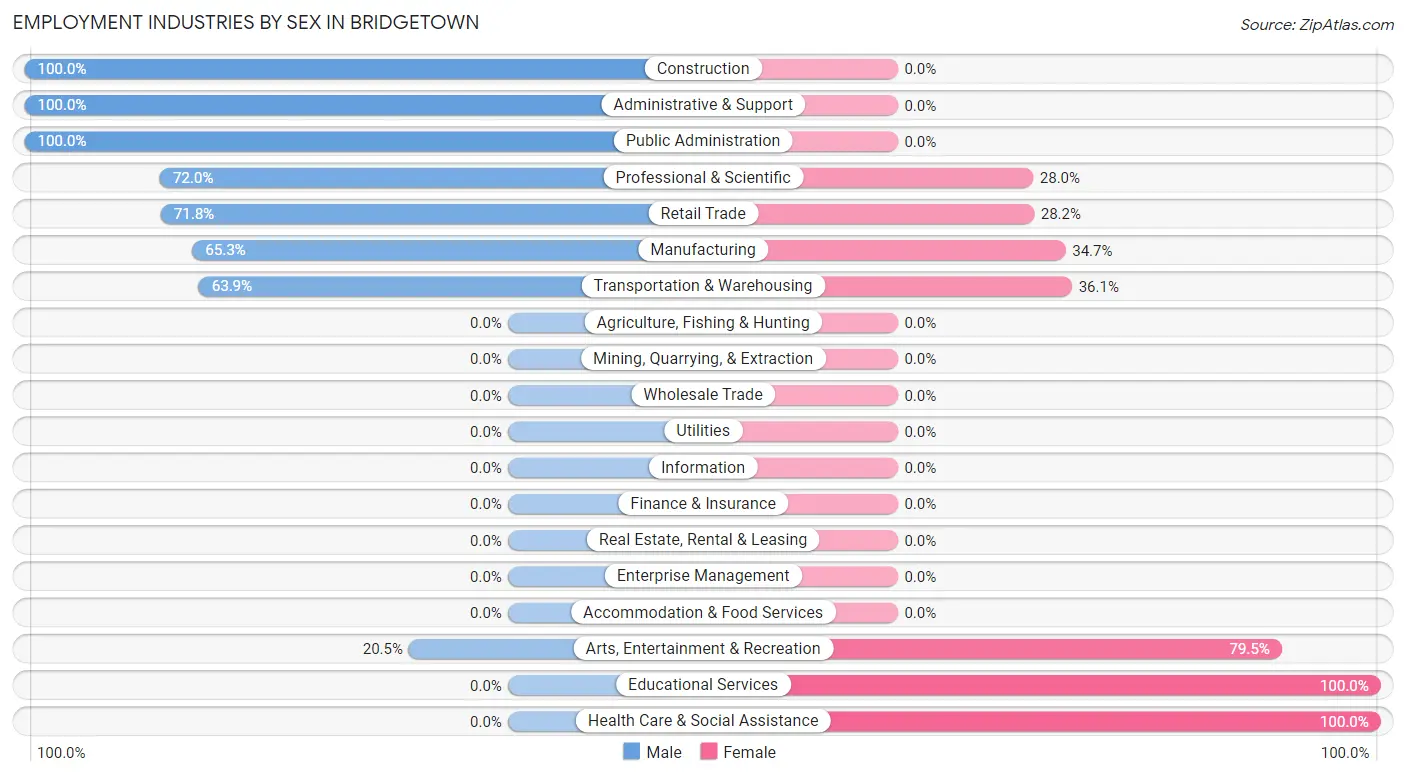
Employment Industries by Sex in Bridgetown
The Bridgetown industries that see more men than women are Construction (100.0%), Administrative & Support (100.0%), and Public Administration (100.0%), whereas the industries that tend to have a higher number of women are Educational Services (100.0%), Health Care & Social Assistance (100.0%), and Arts, Entertainment & Recreation (79.5%).
| Industry | Male | Female |
| Agriculture, Fishing & Hunting | 0 (0.0%) | 0 (0.0%) |
| Mining, Quarrying, & Extraction | 0 (0.0%) | 0 (0.0%) |
| Construction | 85 (100.0%) | 0 (0.0%) |
| Manufacturing | 62 (65.3%) | 33 (34.7%) |
| Wholesale Trade | 0 (0.0%) | 0 (0.0%) |
| Retail Trade | 173 (71.8%) | 68 (28.2%) |
| Transportation & Warehousing | 124 (63.9%) | 70 (36.1%) |
| Utilities | 0 (0.0%) | 0 (0.0%) |
| Information | 0 (0.0%) | 0 (0.0%) |
| Finance & Insurance | 0 (0.0%) | 0 (0.0%) |
| Real Estate, Rental & Leasing | 0 (0.0%) | 0 (0.0%) |
| Professional & Scientific | 95 (72.0%) | 37 (28.0%) |
| Enterprise Management | 0 (0.0%) | 0 (0.0%) |
| Administrative & Support | 135 (100.0%) | 0 (0.0%) |
| Educational Services | 0 (0.0%) | 64 (100.0%) |
| Health Care & Social Assistance | 0 (0.0%) | 255 (100.0%) |
| Arts, Entertainment & Recreation | 43 (20.5%) | 167 (79.5%) |
| Accommodation & Food Services | 0 (0.0%) | 0 (0.0%) |
| Public Administration | 21 (100.0%) | 0 (0.0%) |
| Total | 786 (53.1%) | 694 (46.9%) |
Education in Bridgetown
School Enrollment in Bridgetown
The most common levels of schooling among the 1,091 students in Bridgetown are high school (358 | 32.8%), middle school (303 | 27.8%), and college / undergraduate (229 | 21.0%).
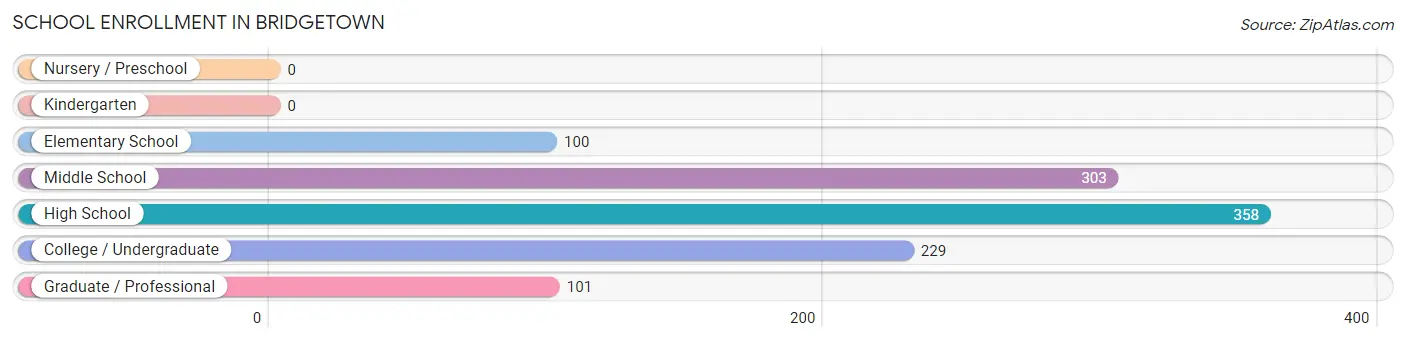
| School Level | # Students | % Students |
| Nursery / Preschool | 0 | 0.0% |
| Kindergarten | 0 | 0.0% |
| Elementary School | 100 | 9.2% |
| Middle School | 303 | 27.8% |
| High School | 358 | 32.8% |
| College / Undergraduate | 229 | 21.0% |
| Graduate / Professional | 101 | 9.3% |
| Total | 1,091 | 100.0% |
School Enrollment by Age by Funding Source in Bridgetown
Out of a total of 1,091 students who are enrolled in schools in Bridgetown, 15 (1.4%) attend a private institution, while the remaining 1,076 (98.6%) are enrolled in public schools. The age group of 25 to 34 year olds has the highest likelihood of being enrolled in private schools, with 15 (14.8% in the age bracket) enrolled. Conversely, the age group of 5 to 9 year old has the lowest likelihood of being enrolled in a private school, with 100 (100.0% in the age bracket) attending a public institution.
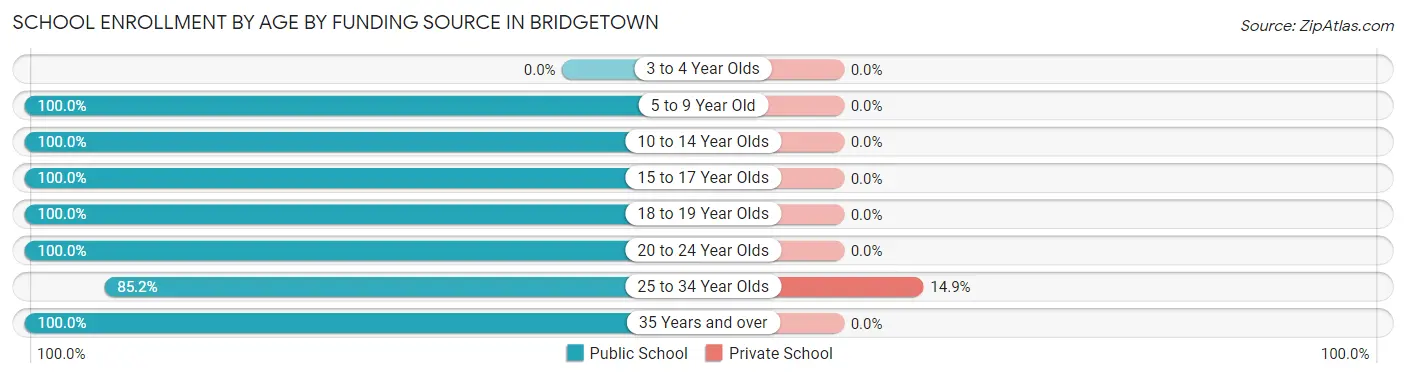
| Age Bracket | Public School | Private School |
| 3 to 4 Year Olds | 0 (0.0%) | 0 (0.0%) |
| 5 to 9 Year Old | 100 (100.0%) | 0 (0.0%) |
| 10 to 14 Year Olds | 288 (100.0%) | 0 (0.0%) |
| 15 to 17 Year Olds | 168 (100.0%) | 0 (0.0%) |
| 18 to 19 Year Olds | 234 (100.0%) | 0 (0.0%) |
| 20 to 24 Year Olds | 167 (100.0%) | 0 (0.0%) |
| 25 to 34 Year Olds | 86 (85.2%) | 15 (14.8%) |
| 35 Years and over | 33 (100.0%) | 0 (0.0%) |
| Total | 1,076 (98.6%) | 15 (1.4%) |
Educational Attainment by Field of Study in Bridgetown
Arts & humanities (117 | 19.9%), science & technology (101 | 17.2%), social sciences (91 | 15.4%), psychology (67 | 11.4%), and engineering (56 | 9.5%) are the most common fields of study among 589 individuals in Bridgetown who have obtained a bachelor's degree or higher.
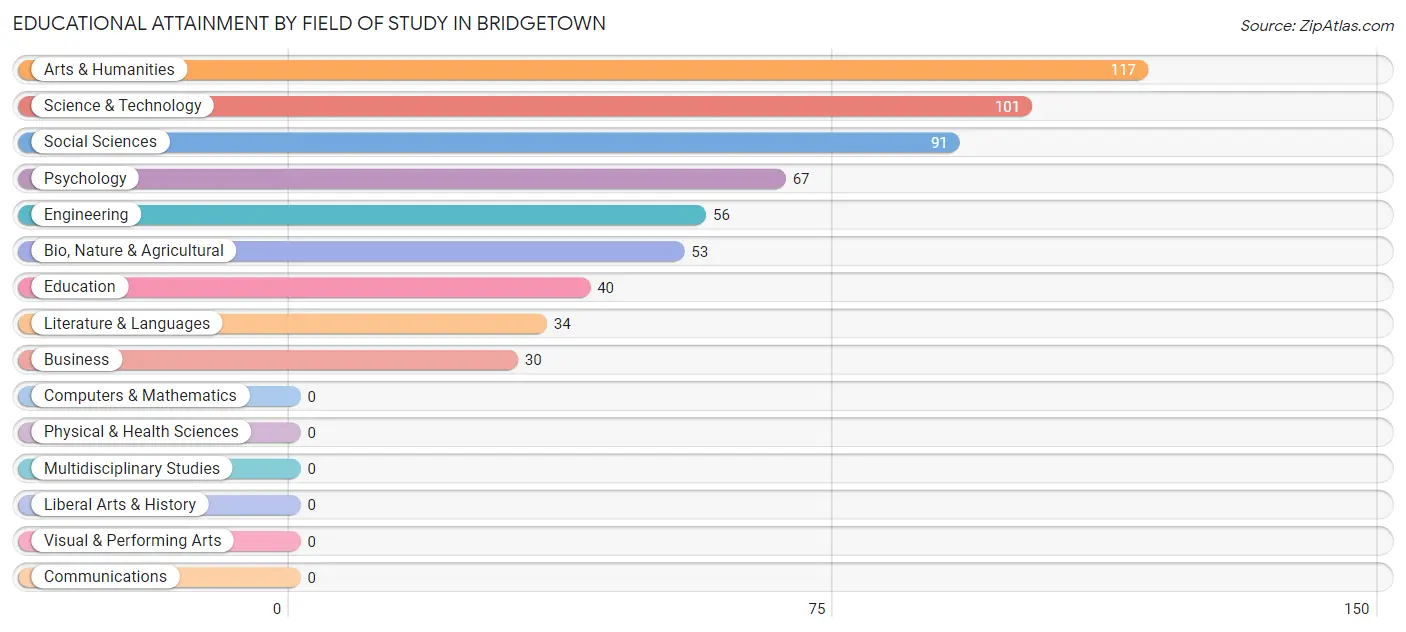
| Field of Study | # Graduates | % Graduates |
| Computers & Mathematics | 0 | 0.0% |
| Bio, Nature & Agricultural | 53 | 9.0% |
| Physical & Health Sciences | 0 | 0.0% |
| Psychology | 67 | 11.4% |
| Social Sciences | 91 | 15.4% |
| Engineering | 56 | 9.5% |
| Multidisciplinary Studies | 0 | 0.0% |
| Science & Technology | 101 | 17.2% |
| Business | 30 | 5.1% |
| Education | 40 | 6.8% |
| Literature & Languages | 34 | 5.8% |
| Liberal Arts & History | 0 | 0.0% |
| Visual & Performing Arts | 0 | 0.0% |
| Communications | 0 | 0.0% |
| Arts & Humanities | 117 | 19.9% |
| Total | 589 | 100.0% |
Transportation & Commute in Bridgetown
Vehicle Availability by Sex in Bridgetown
The most prevalent vehicle ownership categories in Bridgetown are males with 2 vehicles (371, accounting for 47.2%) and females with 2 vehicles (348, making up 53.5%).
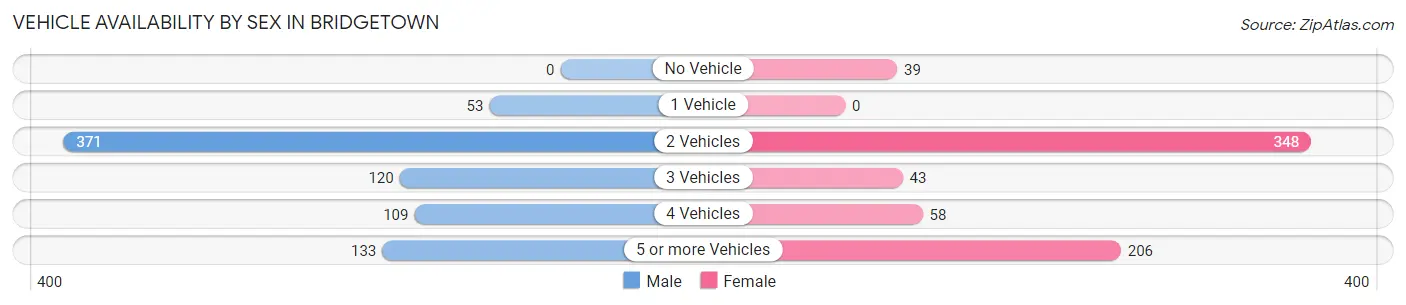
| Vehicles Available | Male | Female |
| No Vehicle | 0 (0.0%) | 39 (5.6%) |
| 1 Vehicle | 53 (6.7%) | 0 (0.0%) |
| 2 Vehicles | 371 (47.2%) | 348 (50.1%) |
| 3 Vehicles | 120 (15.3%) | 43 (6.2%) |
| 4 Vehicles | 109 (13.9%) | 58 (8.4%) |
| 5 or more Vehicles | 133 (16.9%) | 206 (29.7%) |
| Total | 786 (100.0%) | 694 (100.0%) |
Commute Time in Bridgetown
The most frequently occuring commute durations in Bridgetown are 20 to 24 minutes (427 commuters, 30.8%), 30 to 34 minutes (226 commuters, 16.3%), and 15 to 19 minutes (185 commuters, 13.3%).
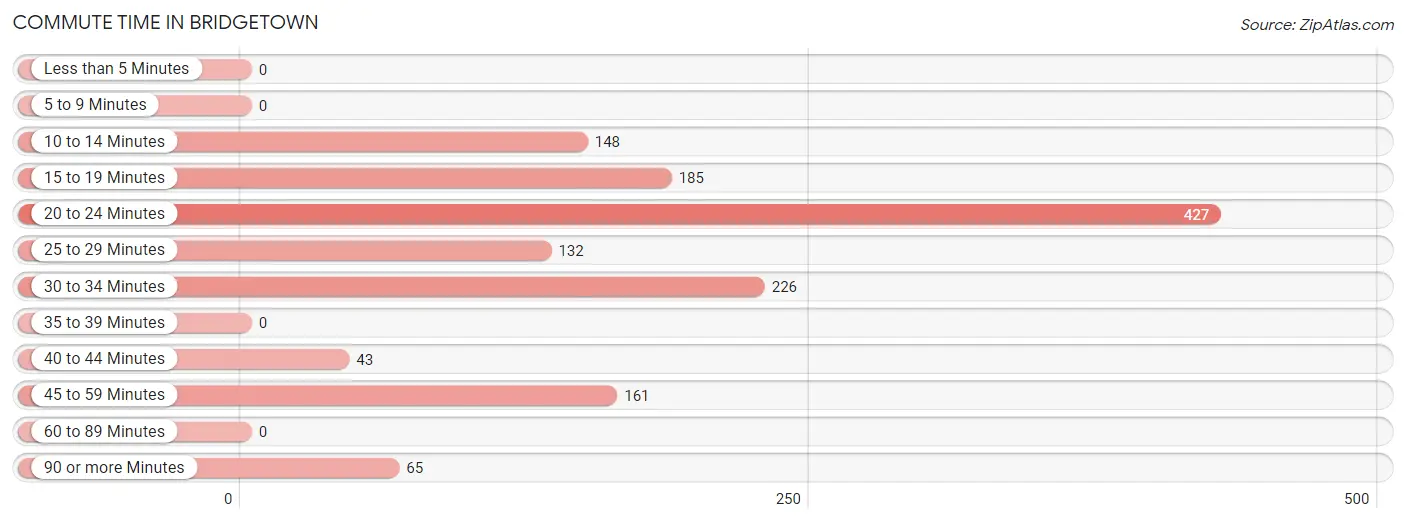
| Commute Time | # Commuters | % Commuters |
| Less than 5 Minutes | 0 | 0.0% |
| 5 to 9 Minutes | 0 | 0.0% |
| 10 to 14 Minutes | 148 | 10.7% |
| 15 to 19 Minutes | 185 | 13.3% |
| 20 to 24 Minutes | 427 | 30.8% |
| 25 to 29 Minutes | 132 | 9.5% |
| 30 to 34 Minutes | 226 | 16.3% |
| 35 to 39 Minutes | 0 | 0.0% |
| 40 to 44 Minutes | 43 | 3.1% |
| 45 to 59 Minutes | 161 | 11.6% |
| 60 to 89 Minutes | 0 | 0.0% |
| 90 or more Minutes | 65 | 4.7% |
Commute Time by Sex in Bridgetown
The most common commute times in Bridgetown are 20 to 24 minutes (366 commuters, 50.5%) for males and 10 to 14 minutes (148 commuters, 22.3%) for females.
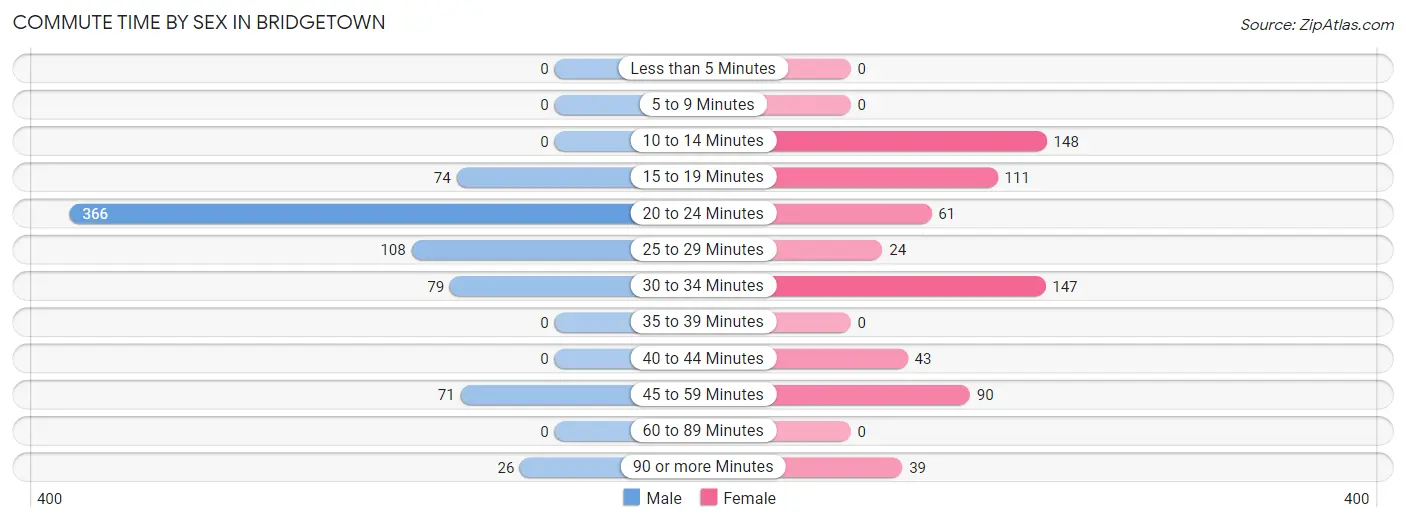
| Commute Time | Male | Female |
| Less than 5 Minutes | 0 (0.0%) | 0 (0.0%) |
| 5 to 9 Minutes | 0 (0.0%) | 0 (0.0%) |
| 10 to 14 Minutes | 0 (0.0%) | 148 (22.3%) |
| 15 to 19 Minutes | 74 (10.2%) | 111 (16.7%) |
| 20 to 24 Minutes | 366 (50.5%) | 61 (9.2%) |
| 25 to 29 Minutes | 108 (14.9%) | 24 (3.6%) |
| 30 to 34 Minutes | 79 (10.9%) | 147 (22.2%) |
| 35 to 39 Minutes | 0 (0.0%) | 0 (0.0%) |
| 40 to 44 Minutes | 0 (0.0%) | 43 (6.5%) |
| 45 to 59 Minutes | 71 (9.8%) | 90 (13.6%) |
| 60 to 89 Minutes | 0 (0.0%) | 0 (0.0%) |
| 90 or more Minutes | 26 (3.6%) | 39 (5.9%) |
Time of Departure to Work by Sex in Bridgetown
The most frequent times of departure to work in Bridgetown are 7:30 AM to 7:59 AM (143, 19.8%) for males and 7:30 AM to 7:59 AM (172, 25.9%) for females.
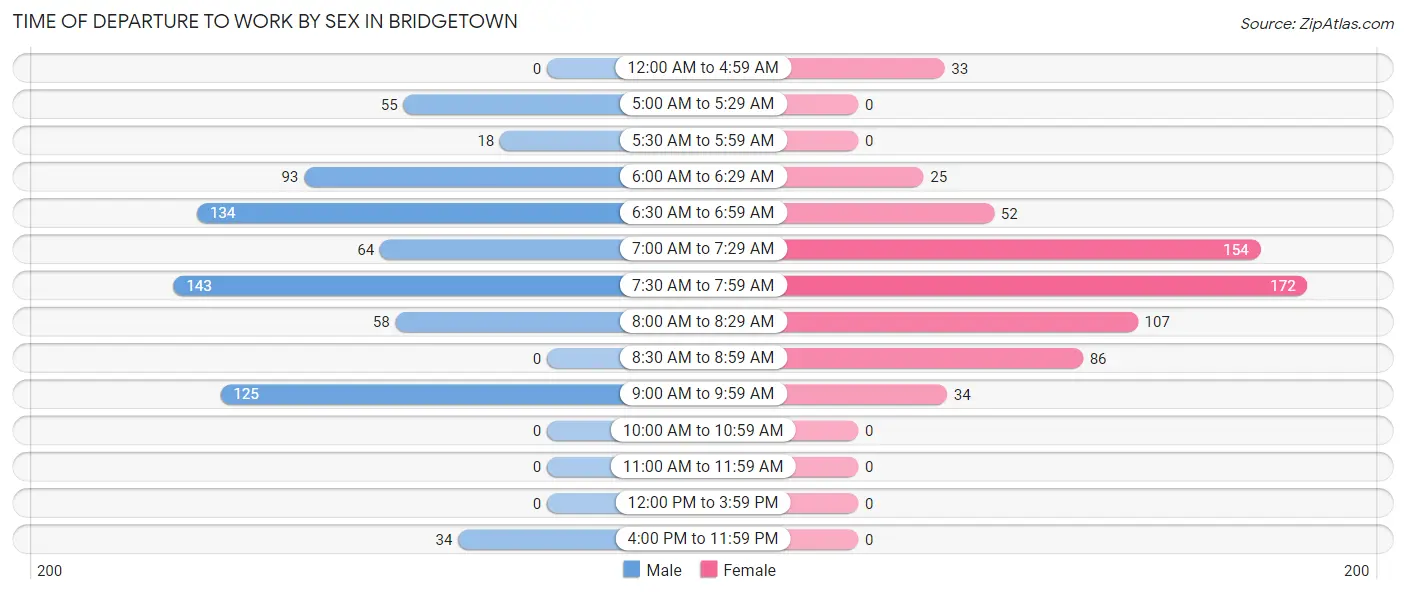
| Time of Departure | Male | Female |
| 12:00 AM to 4:59 AM | 0 (0.0%) | 33 (5.0%) |
| 5:00 AM to 5:29 AM | 55 (7.6%) | 0 (0.0%) |
| 5:30 AM to 5:59 AM | 18 (2.5%) | 0 (0.0%) |
| 6:00 AM to 6:29 AM | 93 (12.9%) | 25 (3.8%) |
| 6:30 AM to 6:59 AM | 134 (18.5%) | 52 (7.8%) |
| 7:00 AM to 7:29 AM | 64 (8.8%) | 154 (23.2%) |
| 7:30 AM to 7:59 AM | 143 (19.8%) | 172 (25.9%) |
| 8:00 AM to 8:29 AM | 58 (8.0%) | 107 (16.1%) |
| 8:30 AM to 8:59 AM | 0 (0.0%) | 86 (13.0%) |
| 9:00 AM to 9:59 AM | 125 (17.3%) | 34 (5.1%) |
| 10:00 AM to 10:59 AM | 0 (0.0%) | 0 (0.0%) |
| 11:00 AM to 11:59 AM | 0 (0.0%) | 0 (0.0%) |
| 12:00 PM to 3:59 PM | 0 (0.0%) | 0 (0.0%) |
| 4:00 PM to 11:59 PM | 34 (4.7%) | 0 (0.0%) |
| Total | 724 (100.0%) | 663 (100.0%) |
Housing Occupancy in Bridgetown
Occupancy by Ownership in Bridgetown
Of the total 852 dwellings in Bridgetown, owner-occupied units account for 834 (97.9%), while renter-occupied units make up 18 (2.1%).
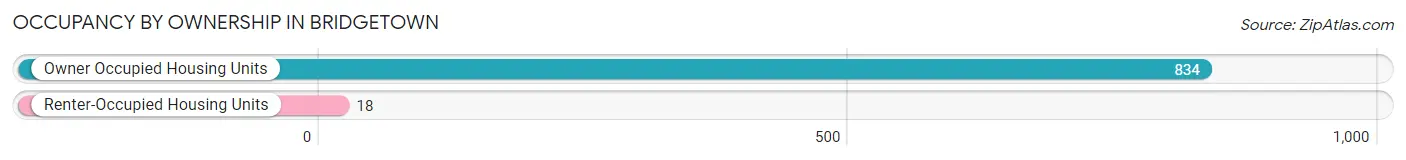
| Occupancy | # Housing Units | % Housing Units |
| Owner Occupied Housing Units | 834 | 97.9% |
| Renter-Occupied Housing Units | 18 | 2.1% |
| Total Occupied Housing Units | 852 | 100.0% |
Occupancy by Household Size in Bridgetown
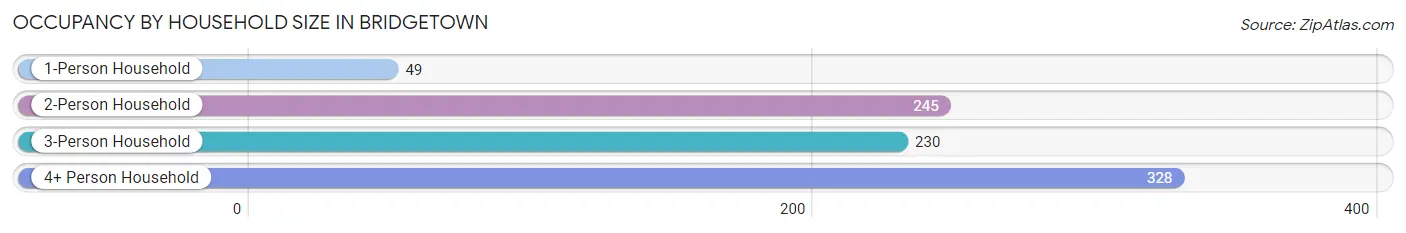
| Household Size | # Housing Units | % Housing Units |
| 1-Person Household | 49 | 5.8% |
| 2-Person Household | 245 | 28.8% |
| 3-Person Household | 230 | 27.0% |
| 4+ Person Household | 328 | 38.5% |
| Total Housing Units | 852 | 100.0% |
Occupancy by Ownership by Household Size in Bridgetown
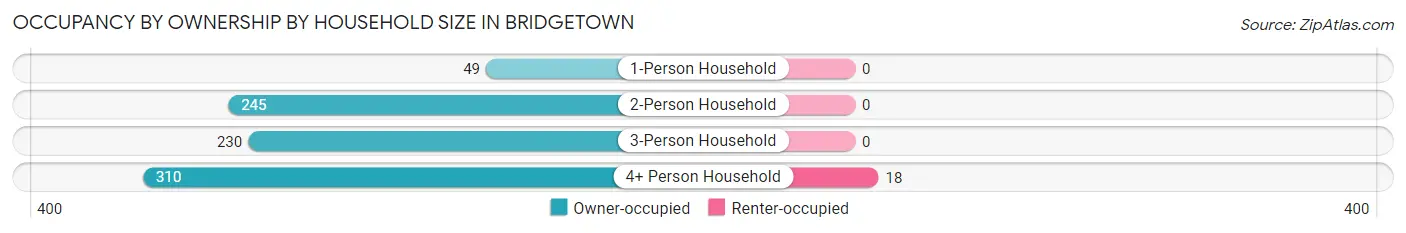
| Household Size | Owner-occupied | Renter-occupied |
| 1-Person Household | 49 (100.0%) | 0 (0.0%) |
| 2-Person Household | 245 (100.0%) | 0 (0.0%) |
| 3-Person Household | 230 (100.0%) | 0 (0.0%) |
| 4+ Person Household | 310 (94.5%) | 18 (5.5%) |
| Total Housing Units | 834 (97.9%) | 18 (2.1%) |
Occupancy by Educational Attainment in Bridgetown
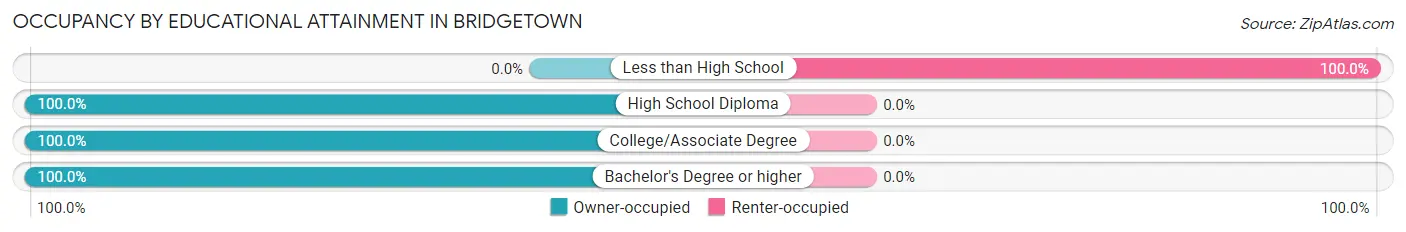
| Household Size | Owner-occupied | Renter-occupied |
| Less than High School | 0 (0.0%) | 18 (100.0%) |
| High School Diploma | 126 (100.0%) | 0 (0.0%) |
| College/Associate Degree | 229 (100.0%) | 0 (0.0%) |
| Bachelor's Degree or higher | 479 (100.0%) | 0 (0.0%) |
Occupancy by Age of Householder in Bridgetown
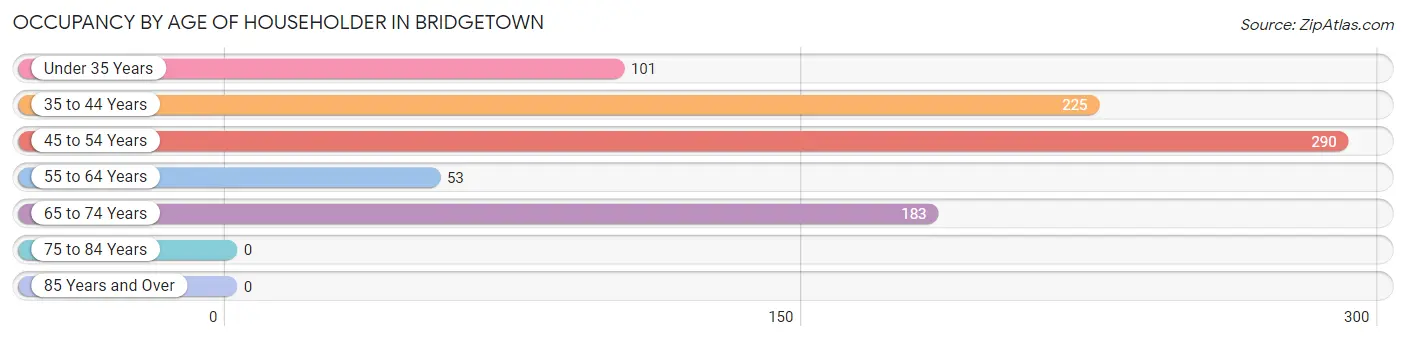
| Age Bracket | # Households | % Households |
| Under 35 Years | 101 | 11.8% |
| 35 to 44 Years | 225 | 26.4% |
| 45 to 54 Years | 290 | 34.0% |
| 55 to 64 Years | 53 | 6.2% |
| 65 to 74 Years | 183 | 21.5% |
| 75 to 84 Years | 0 | 0.0% |
| 85 Years and Over | 0 | 0.0% |
| Total | 852 | 100.0% |
Housing Finances in Bridgetown
Median Income by Occupancy in Bridgetown
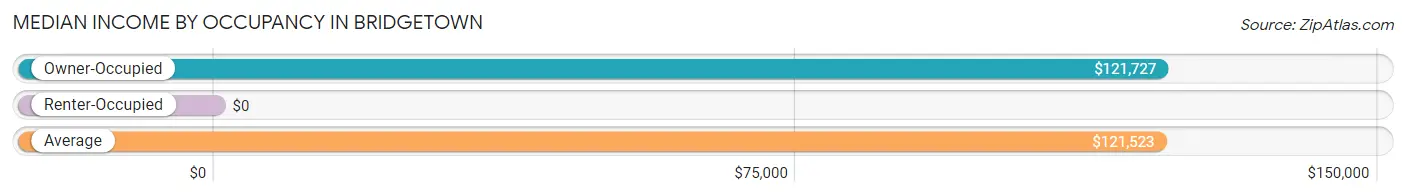
| Occupancy Type | # Households | Median Income |
| Owner-Occupied | 834 (97.9%) | $121,727 |
| Renter-Occupied | 18 (2.1%) | $0 |
| Average | 852 (100.0%) | $121,523 |
Occupancy by Householder Income Bracket in Bridgetown
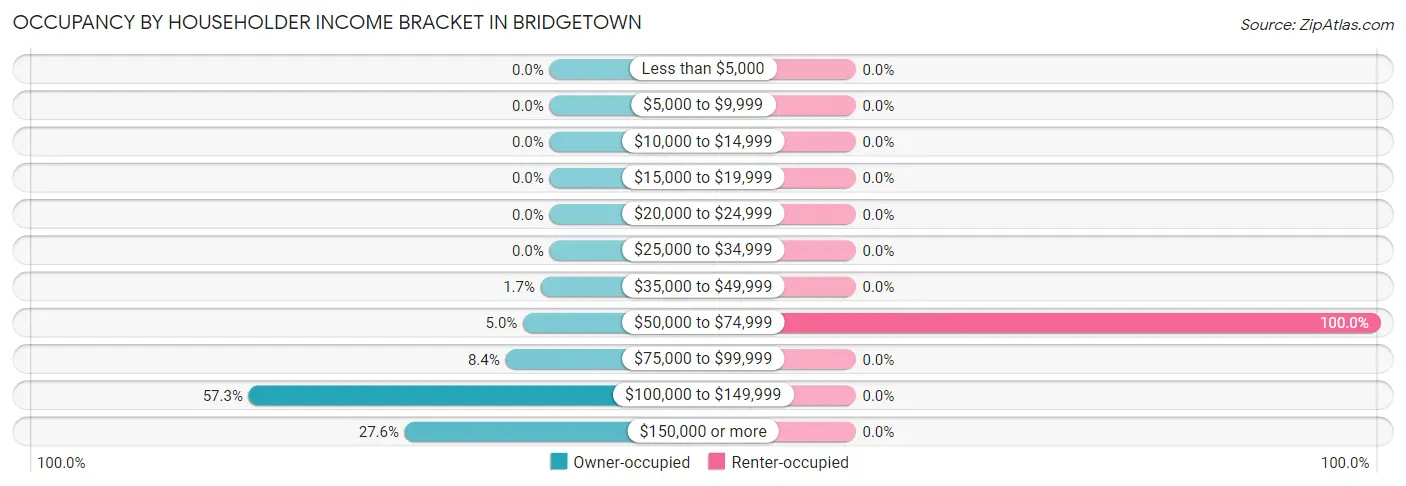
| Income Bracket | Owner-occupied | Renter-occupied |
| Less than $5,000 | 0 (0.0%) | 0 (0.0%) |
| $5,000 to $9,999 | 0 (0.0%) | 0 (0.0%) |
| $10,000 to $14,999 | 0 (0.0%) | 0 (0.0%) |
| $15,000 to $19,999 | 0 (0.0%) | 0 (0.0%) |
| $20,000 to $24,999 | 0 (0.0%) | 0 (0.0%) |
| $25,000 to $34,999 | 0 (0.0%) | 0 (0.0%) |
| $35,000 to $49,999 | 14 (1.7%) | 0 (0.0%) |
| $50,000 to $74,999 | 42 (5.0%) | 18 (100.0%) |
| $75,000 to $99,999 | 70 (8.4%) | 0 (0.0%) |
| $100,000 to $149,999 | 478 (57.3%) | 0 (0.0%) |
| $150,000 or more | 230 (27.6%) | 0 (0.0%) |
| Total | 834 (100.0%) | 18 (100.0%) |
Monthly Housing Cost Tiers in Bridgetown
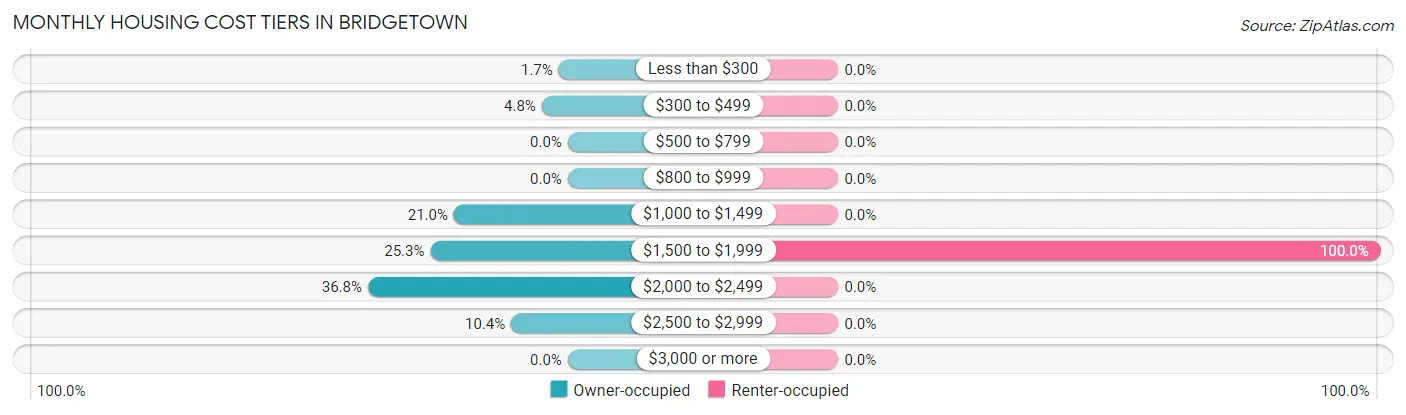
| Monthly Cost | Owner-occupied | Renter-occupied |
| Less than $300 | 14 (1.7%) | 0 (0.0%) |
| $300 to $499 | 40 (4.8%) | 0 (0.0%) |
| $500 to $799 | 0 (0.0%) | 0 (0.0%) |
| $800 to $999 | 0 (0.0%) | 0 (0.0%) |
| $1,000 to $1,499 | 175 (21.0%) | 0 (0.0%) |
| $1,500 to $1,999 | 211 (25.3%) | 18 (100.0%) |
| $2,000 to $2,499 | 307 (36.8%) | 0 (0.0%) |
| $2,500 to $2,999 | 87 (10.4%) | 0 (0.0%) |
| $3,000 or more | 0 (0.0%) | 0 (0.0%) |
| Total | 834 (100.0%) | 18 (100.0%) |
Physical Housing Characteristics in Bridgetown
Housing Structures in Bridgetown
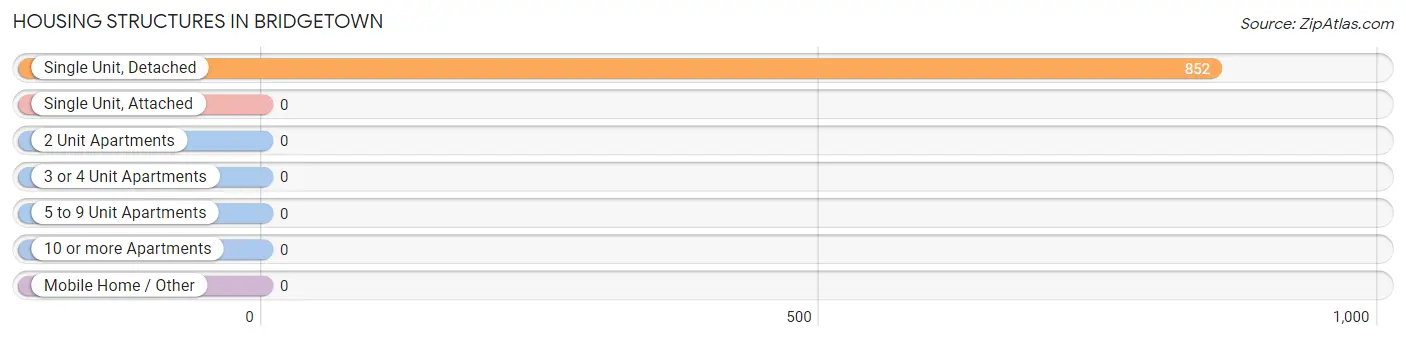
| Structure Type | # Housing Units | % Housing Units |
| Single Unit, Detached | 852 | 100.0% |
| Single Unit, Attached | 0 | 0.0% |
| 2 Unit Apartments | 0 | 0.0% |
| 3 or 4 Unit Apartments | 0 | 0.0% |
| 5 to 9 Unit Apartments | 0 | 0.0% |
| 10 or more Apartments | 0 | 0.0% |
| Mobile Home / Other | 0 | 0.0% |
| Total | 852 | 100.0% |
Housing Structures by Occupancy in Bridgetown
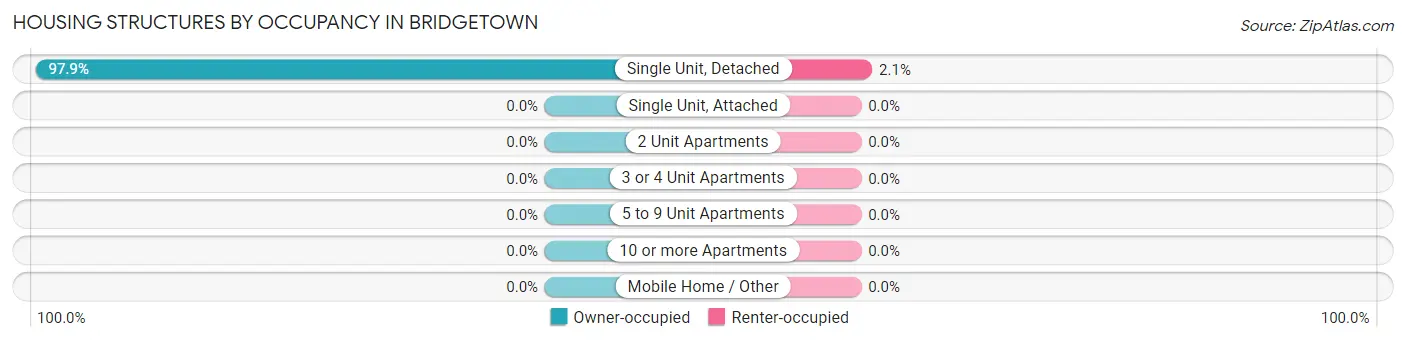
| Structure Type | Owner-occupied | Renter-occupied |
| Single Unit, Detached | 834 (97.9%) | 18 (2.1%) |
| Single Unit, Attached | 0 (0.0%) | 0 (0.0%) |
| 2 Unit Apartments | 0 (0.0%) | 0 (0.0%) |
| 3 or 4 Unit Apartments | 0 (0.0%) | 0 (0.0%) |
| 5 to 9 Unit Apartments | 0 (0.0%) | 0 (0.0%) |
| 10 or more Apartments | 0 (0.0%) | 0 (0.0%) |
| Mobile Home / Other | 0 (0.0%) | 0 (0.0%) |
| Total | 834 (97.9%) | 18 (2.1%) |
Housing Structures by Number of Rooms in Bridgetown
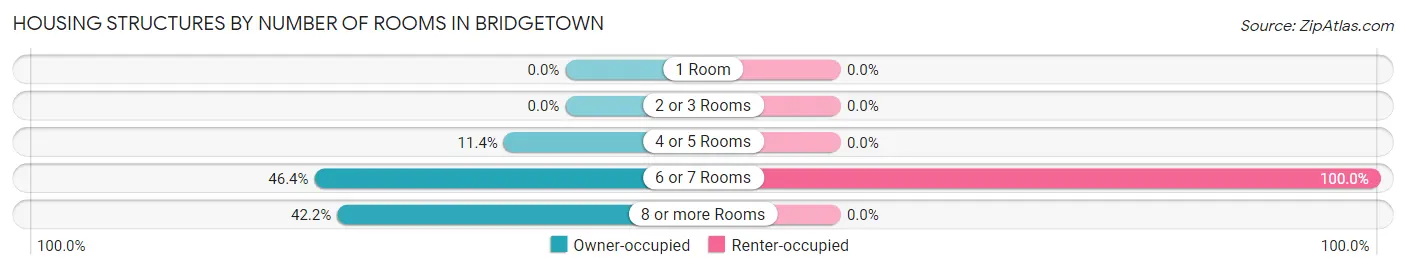
| Number of Rooms | Owner-occupied | Renter-occupied |
| 1 Room | 0 (0.0%) | 0 (0.0%) |
| 2 or 3 Rooms | 0 (0.0%) | 0 (0.0%) |
| 4 or 5 Rooms | 95 (11.4%) | 0 (0.0%) |
| 6 or 7 Rooms | 387 (46.4%) | 18 (100.0%) |
| 8 or more Rooms | 352 (42.2%) | 0 (0.0%) |
| Total | 834 (100.0%) | 18 (100.0%) |
Housing Structure by Heating Type in Bridgetown
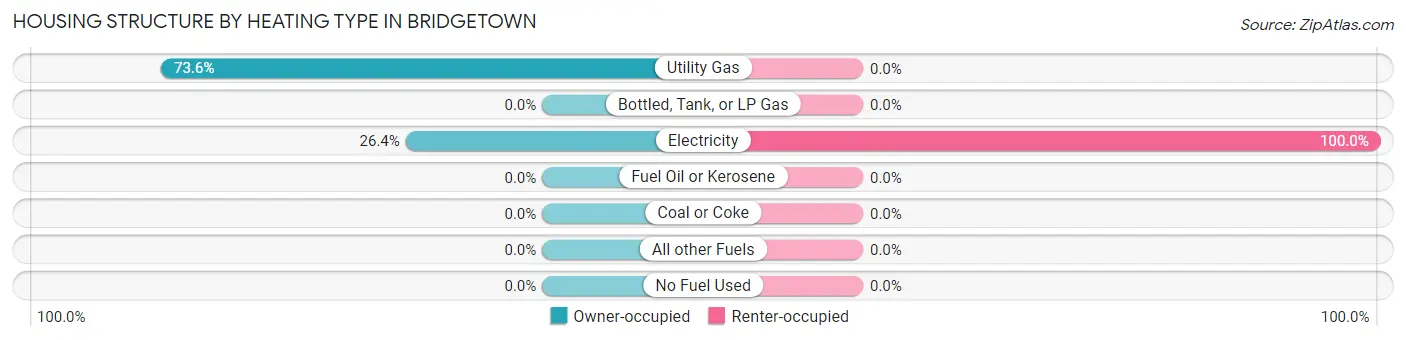
| Heating Type | Owner-occupied | Renter-occupied |
| Utility Gas | 614 (73.6%) | 0 (0.0%) |
| Bottled, Tank, or LP Gas | 0 (0.0%) | 0 (0.0%) |
| Electricity | 220 (26.4%) | 18 (100.0%) |
| Fuel Oil or Kerosene | 0 (0.0%) | 0 (0.0%) |
| Coal or Coke | 0 (0.0%) | 0 (0.0%) |
| All other Fuels | 0 (0.0%) | 0 (0.0%) |
| No Fuel Used | 0 (0.0%) | 0 (0.0%) |
| Total | 834 (100.0%) | 18 (100.0%) |
Household Vehicle Usage in Bridgetown
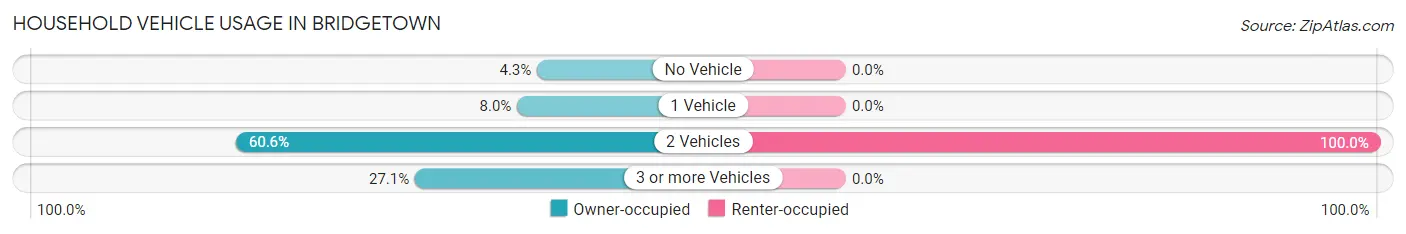
| Vehicles per Household | Owner-occupied | Renter-occupied |
| No Vehicle | 36 (4.3%) | 0 (0.0%) |
| 1 Vehicle | 67 (8.0%) | 0 (0.0%) |
| 2 Vehicles | 505 (60.6%) | 18 (100.0%) |
| 3 or more Vehicles | 226 (27.1%) | 0 (0.0%) |
| Total | 834 (100.0%) | 18 (100.0%) |
Real Estate & Mortgages in Bridgetown
Real Estate and Mortgage Overview in Bridgetown
| Characteristic | Without Mortgage | With Mortgage |
| Housing Units | 54 | 780 |
| Median Property Value | $221,000 | $284,400 |
| Median Household Income | $110,323 | $230 |
| Monthly Housing Costs | $433 | $0 |
| Real Estate Taxes | $1,210 | $15 |
Property Value by Mortgage Status in Bridgetown
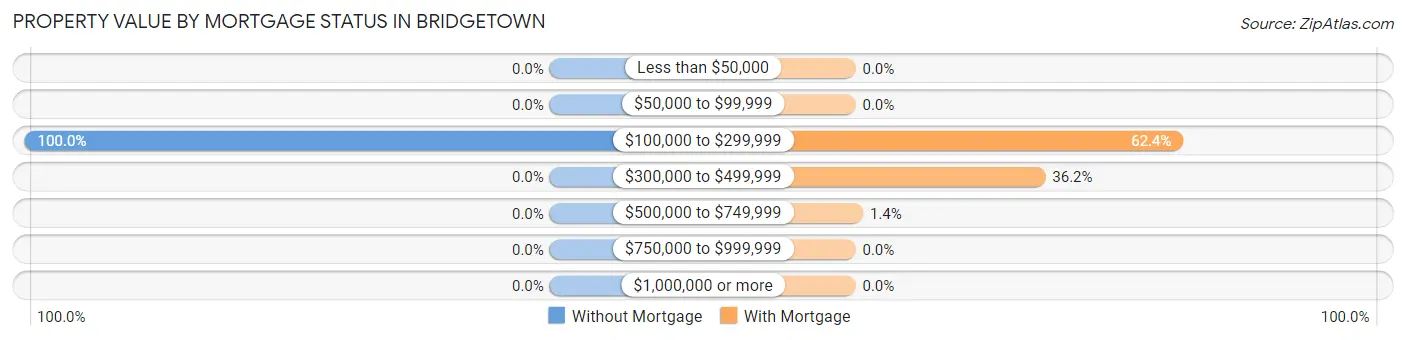
| Property Value | Without Mortgage | With Mortgage |
| Less than $50,000 | 0 (0.0%) | 0 (0.0%) |
| $50,000 to $99,999 | 0 (0.0%) | 0 (0.0%) |
| $100,000 to $299,999 | 54 (100.0%) | 487 (62.4%) |
| $300,000 to $499,999 | 0 (0.0%) | 282 (36.1%) |
| $500,000 to $749,999 | 0 (0.0%) | 11 (1.4%) |
| $750,000 to $999,999 | 0 (0.0%) | 0 (0.0%) |
| $1,000,000 or more | 0 (0.0%) | 0 (0.0%) |
| Total | 54 (100.0%) | 780 (100.0%) |
Household Income by Mortgage Status in Bridgetown
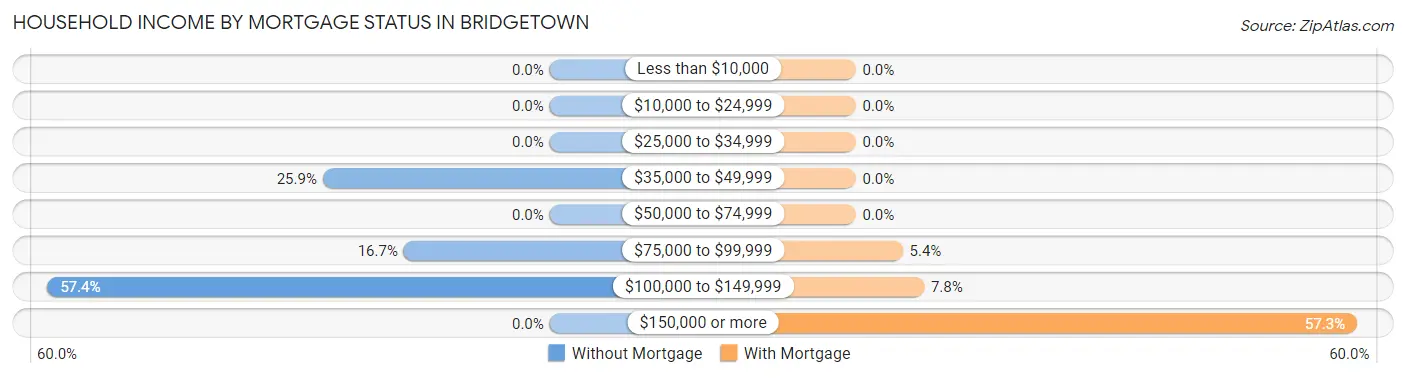
| Household Income | Without Mortgage | With Mortgage |
| Less than $10,000 | 0 (0.0%) | 0 (0.0%) |
| $10,000 to $24,999 | 0 (0.0%) | 0 (0.0%) |
| $25,000 to $34,999 | 0 (0.0%) | 0 (0.0%) |
| $35,000 to $49,999 | 14 (25.9%) | 0 (0.0%) |
| $50,000 to $74,999 | 0 (0.0%) | 0 (0.0%) |
| $75,000 to $99,999 | 9 (16.7%) | 42 (5.4%) |
| $100,000 to $149,999 | 31 (57.4%) | 61 (7.8%) |
| $150,000 or more | 0 (0.0%) | 447 (57.3%) |
| Total | 54 (100.0%) | 780 (100.0%) |
Property Value to Household Income Ratio in Bridgetown
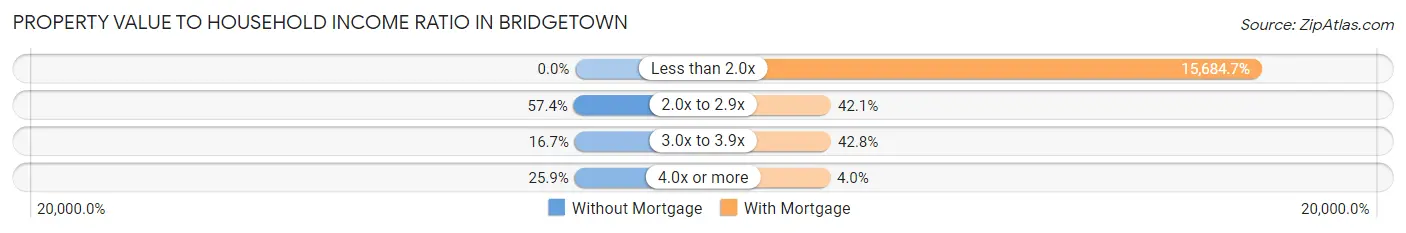
| Value-to-Income Ratio | Without Mortgage | With Mortgage |
| Less than 2.0x | 0 (0.0%) | 122,341 (15,684.7%) |
| 2.0x to 2.9x | 31 (57.4%) | 328 (42.0%) |
| 3.0x to 3.9x | 9 (16.7%) | 334 (42.8%) |
| 4.0x or more | 14 (25.9%) | 31 (4.0%) |
| Total | 54 (100.0%) | 780 (100.0%) |
Real Estate Taxes by Mortgage Status in Bridgetown
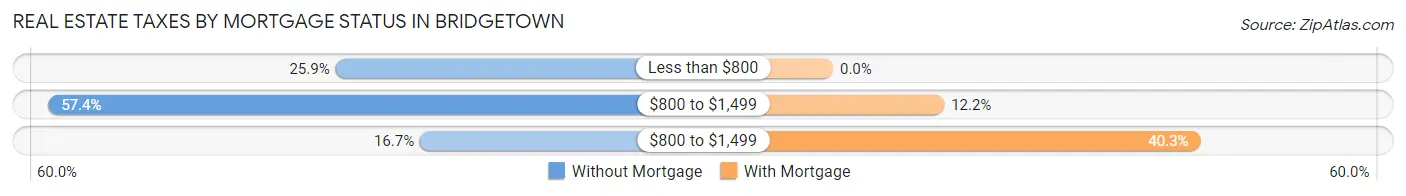
| Property Taxes | Without Mortgage | With Mortgage |
| Less than $800 | 14 (25.9%) | 0 (0.0%) |
| $800 to $1,499 | 31 (57.4%) | 95 (12.2%) |
| $800 to $1,499 | 9 (16.7%) | 314 (40.3%) |
| Total | 54 (100.0%) | 780 (100.0%) |
Health & Disability in Bridgetown
Health Insurance Coverage by Age in Bridgetown
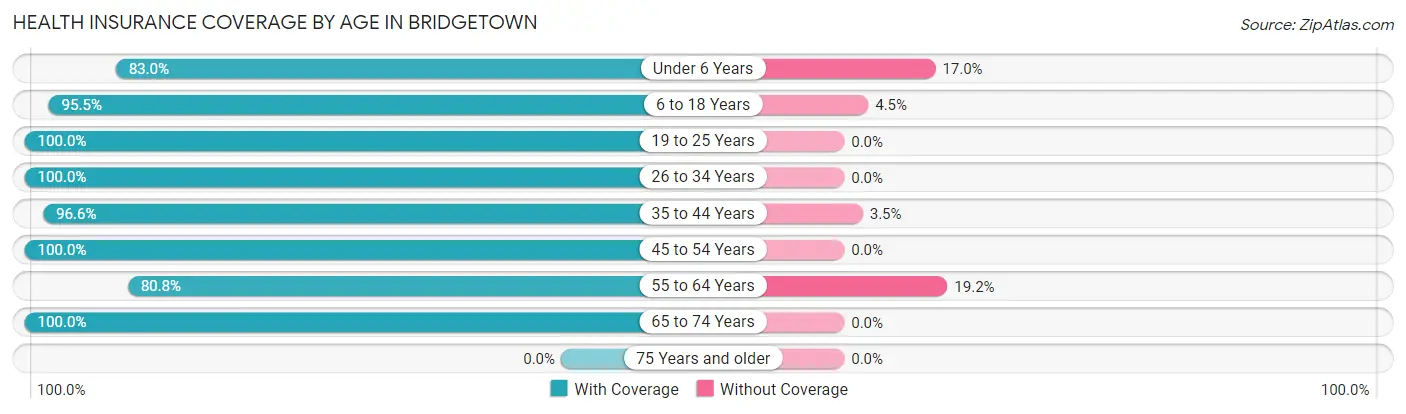
| Age Bracket | With Coverage | Without Coverage |
| Under 6 Years | 83 (83.0%) | 17 (17.0%) |
| 6 to 18 Years | 727 (95.5%) | 34 (4.5%) |
| 19 to 25 Years | 392 (100.0%) | 0 (0.0%) |
| 26 to 34 Years | 189 (100.0%) | 0 (0.0%) |
| 35 to 44 Years | 448 (96.6%) | 16 (3.5%) |
| 45 to 54 Years | 613 (100.0%) | 0 (0.0%) |
| 55 to 64 Years | 147 (80.8%) | 35 (19.2%) |
| 65 to 74 Years | 192 (100.0%) | 0 (0.0%) |
| 75 Years and older | 0 (0.0%) | 0 (0.0%) |
| Total | 2,791 (96.5%) | 102 (3.5%) |
Health Insurance Coverage by Citizenship Status in Bridgetown
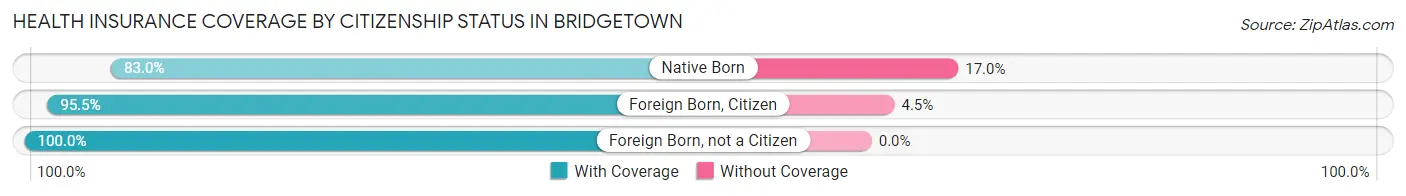
| Citizenship Status | With Coverage | Without Coverage |
| Native Born | 83 (83.0%) | 17 (17.0%) |
| Foreign Born, Citizen | 727 (95.5%) | 34 (4.5%) |
| Foreign Born, not a Citizen | 392 (100.0%) | 0 (0.0%) |
Health Insurance Coverage by Household Income in Bridgetown
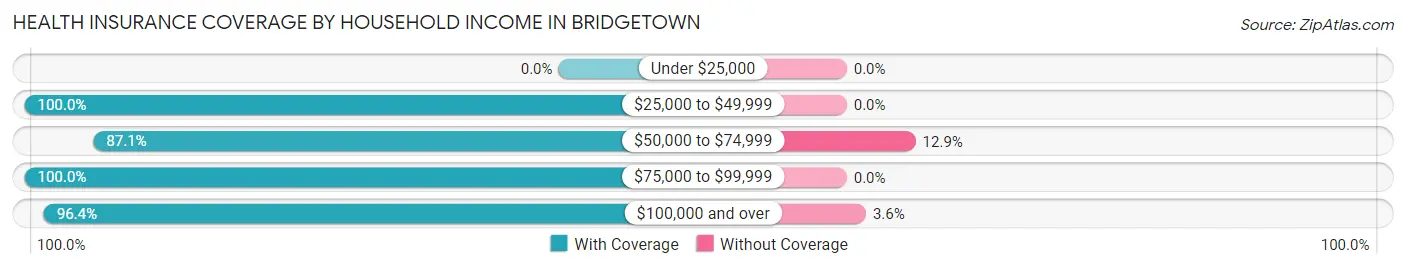
| Household Income | With Coverage | Without Coverage |
| Under $25,000 | 0 (0.0%) | 0 (0.0%) |
| $25,000 to $49,999 | 14 (100.0%) | 0 (0.0%) |
| $50,000 to $74,999 | 108 (87.1%) | 16 (12.9%) |
| $75,000 to $99,999 | 368 (100.0%) | 0 (0.0%) |
| $100,000 and over | 2,301 (96.4%) | 86 (3.6%) |
Public vs Private Health Insurance Coverage by Age in Bridgetown
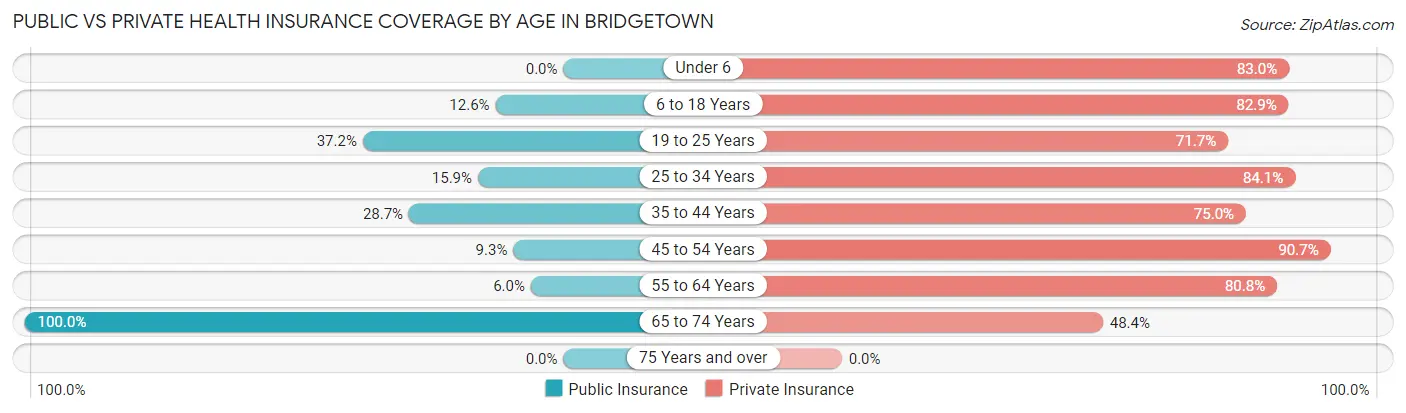
| Age Bracket | Public Insurance | Private Insurance |
| Under 6 | 0 (0.0%) | 83 (83.0%) |
| 6 to 18 Years | 96 (12.6%) | 631 (82.9%) |
| 19 to 25 Years | 146 (37.2%) | 281 (71.7%) |
| 25 to 34 Years | 30 (15.9%) | 159 (84.1%) |
| 35 to 44 Years | 133 (28.7%) | 348 (75.0%) |
| 45 to 54 Years | 57 (9.3%) | 556 (90.7%) |
| 55 to 64 Years | 11 (6.0%) | 147 (80.8%) |
| 65 to 74 Years | 192 (100.0%) | 93 (48.4%) |
| 75 Years and over | 0 (0.0%) | 0 (0.0%) |
| Total | 665 (23.0%) | 2,298 (79.4%) |
Disability Status by Sex by Age in Bridgetown
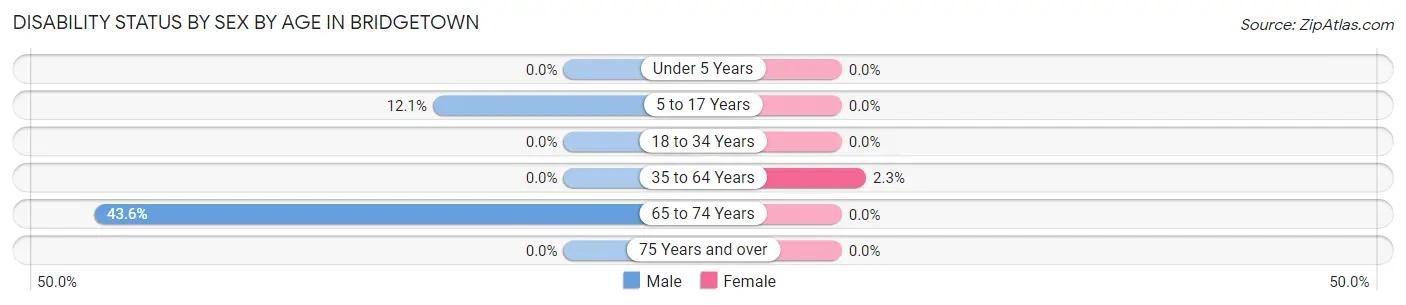
| Age Bracket | Male | Female |
| Under 5 Years | 0 (0.0%) | 0 (0.0%) |
| 5 to 17 Years | 24 (12.1%) | 0 (0.0%) |
| 18 to 34 Years | 0 (0.0%) | 0 (0.0%) |
| 35 to 64 Years | 0 (0.0%) | 16 (2.3%) |
| 65 to 74 Years | 54 (43.5%) | 0 (0.0%) |
| 75 Years and over | 0 (0.0%) | 0 (0.0%) |
Disability Class by Sex by Age in Bridgetown
Disability Class: Hearing Difficulty
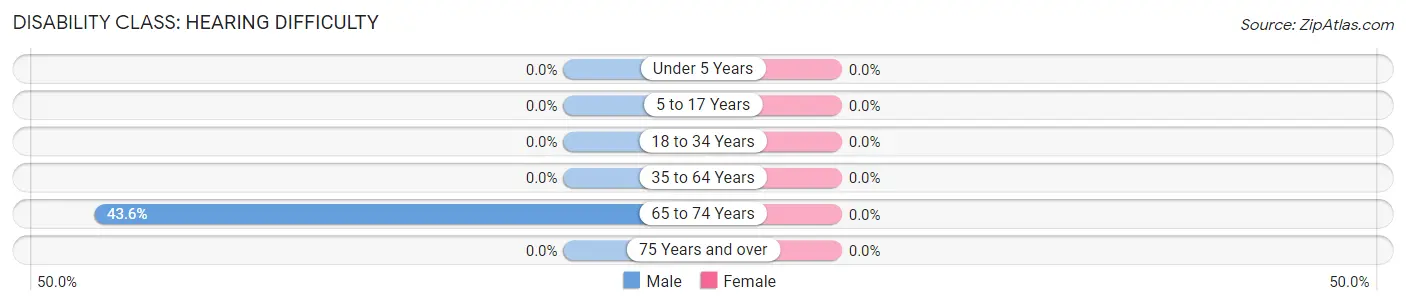
| Age Bracket | Male | Female |
| Under 5 Years | 0 (0.0%) | 0 (0.0%) |
| 5 to 17 Years | 0 (0.0%) | 0 (0.0%) |
| 18 to 34 Years | 0 (0.0%) | 0 (0.0%) |
| 35 to 64 Years | 0 (0.0%) | 0 (0.0%) |
| 65 to 74 Years | 54 (43.5%) | 0 (0.0%) |
| 75 Years and over | 0 (0.0%) | 0 (0.0%) |
Disability Class: Vision Difficulty
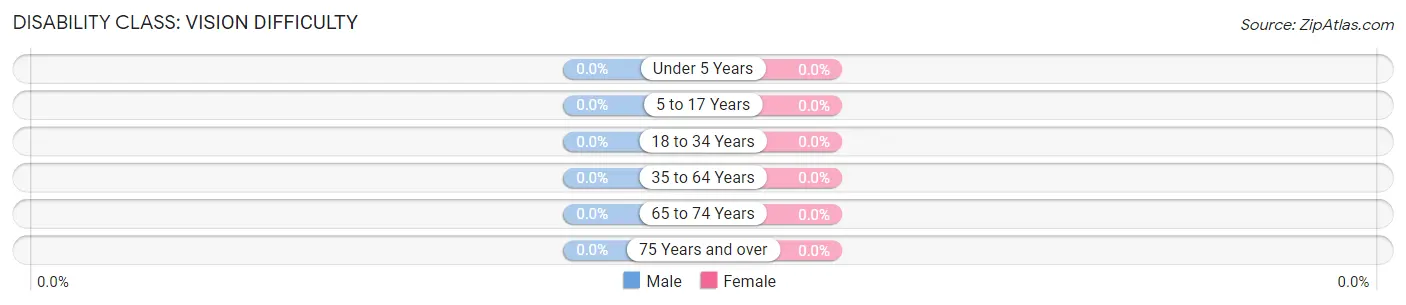
| Age Bracket | Male | Female |
| Under 5 Years | 0 (0.0%) | 0 (0.0%) |
| 5 to 17 Years | 0 (0.0%) | 0 (0.0%) |
| 18 to 34 Years | 0 (0.0%) | 0 (0.0%) |
| 35 to 64 Years | 0 (0.0%) | 0 (0.0%) |
| 65 to 74 Years | 0 (0.0%) | 0 (0.0%) |
| 75 Years and over | 0 (0.0%) | 0 (0.0%) |
Disability Class: Cognitive Difficulty
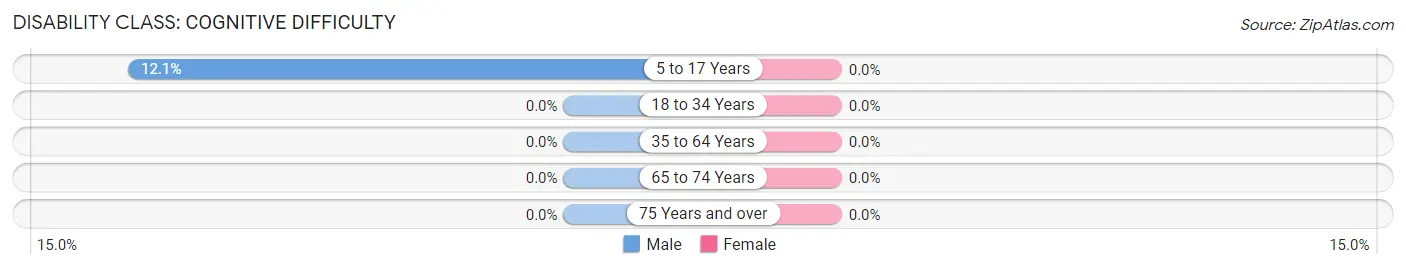
| Age Bracket | Male | Female |
| 5 to 17 Years | 24 (12.1%) | 0 (0.0%) |
| 18 to 34 Years | 0 (0.0%) | 0 (0.0%) |
| 35 to 64 Years | 0 (0.0%) | 0 (0.0%) |
| 65 to 74 Years | 0 (0.0%) | 0 (0.0%) |
| 75 Years and over | 0 (0.0%) | 0 (0.0%) |
Disability Class: Ambulatory Difficulty
| Age Bracket | Male | Female |
| 5 to 17 Years | 0 (0.0%) | 0 (0.0%) |
| 18 to 34 Years | 0 (0.0%) | 0 (0.0%) |
| 35 to 64 Years | 0 (0.0%) | 0 (0.0%) |
| 65 to 74 Years | 0 (0.0%) | 0 (0.0%) |
| 75 Years and over | 0 (0.0%) | 0 (0.0%) |
Disability Class: Self-Care Difficulty
| Age Bracket | Male | Female |
| 5 to 17 Years | 0 (0.0%) | 0 (0.0%) |
| 18 to 34 Years | 0 (0.0%) | 0 (0.0%) |
| 35 to 64 Years | 0 (0.0%) | 0 (0.0%) |
| 65 to 74 Years | 0 (0.0%) | 0 (0.0%) |
| 75 Years and over | 0 (0.0%) | 0 (0.0%) |
Technology Access in Bridgetown
Computing Device Access in Bridgetown
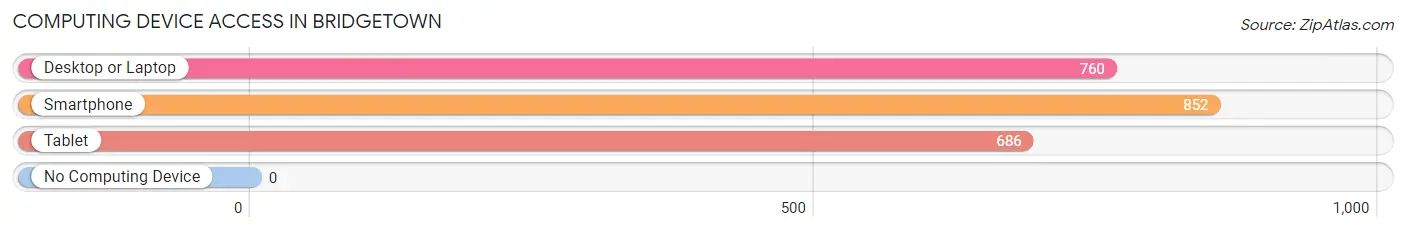
| Device Type | # Households | % Households |
| Desktop or Laptop | 760 | 89.2% |
| Smartphone | 852 | 100.0% |
| Tablet | 686 | 80.5% |
| No Computing Device | 0 | 0.0% |
| Total | 852 | 100.0% |
Internet Access in Bridgetown
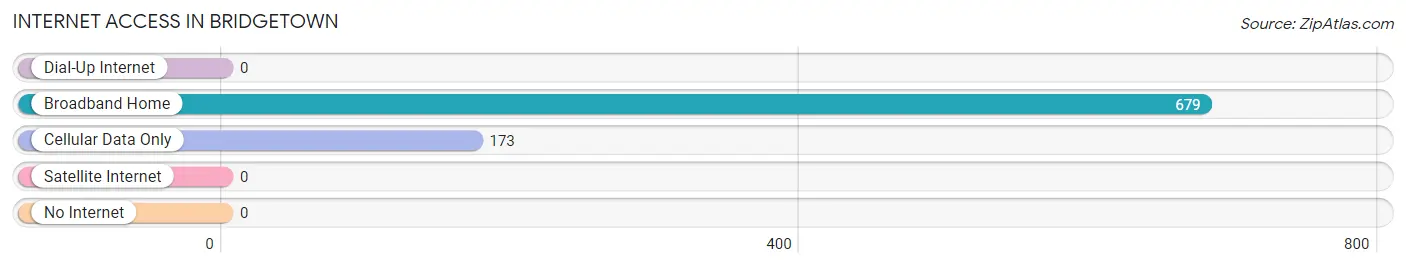
| Internet Type | # Households | % Households |
| Dial-Up Internet | 0 | 0.0% |
| Broadband Home | 679 | 79.7% |
| Cellular Data Only | 173 | 20.3% |
| Satellite Internet | 0 | 0.0% |
| No Internet | 0 | 0.0% |
| Total | 852 | 100.0% |
Bridgetown Summary
Bridgetown is a small town located in the state of Mississippi, United States. It is situated in the northern part of the state, in the county of Harrison. The town has a population of approximately 1,500 people, and is part of the Gulfport-Biloxi metropolitan area.
Geography
Bridgetown is located in the northern part of Mississippi, in the county of Harrison. It is situated on the Gulf Coast, approximately 25 miles east of Gulfport and Biloxi. The town is bordered by the cities of Long Beach, Pass Christian, and Gulfport. The town is situated on the banks of the Jourdan River, which flows into the Gulf of Mexico. The town is surrounded by a number of small lakes, including Lake Catherine, Lake Lillian, and Lake Mary.
The town has a total area of 1.2 square miles, all of which is land. The town has a humid subtropical climate, with hot, humid summers and mild winters. The average temperature in the summer is around 80 degrees Fahrenheit, while the average temperature in the winter is around 50 degrees Fahrenheit.
Economy
Bridgetown’s economy is largely based on tourism and fishing. The town is home to a number of tourist attractions, including the Gulf Islands National Seashore, the Jourdan River State Park, and the Gulfport-Biloxi International Airport. The town is also home to a number of seafood restaurants, which serve fresh seafood caught in the nearby waters.
The town is also home to a number of small businesses, including a number of retail stores, restaurants, and other services. The town is also home to a number of manufacturing companies, which produce a variety of products, including furniture, clothing, and electronics.
Demographics
As of the 2010 census, the population of Bridgetown was 1,500 people. The racial makeup of the town was 95.3% White, 1.7% African American, 0.7% Native American, 0.3% Asian, 0.1% Pacific Islander, and 1.7% from other races. The median household income in the town was $37,500, and the median family income was $45,000.
The town is home to a number of churches, including the First Baptist Church of Bridgetown, the Church of the Nazarene, and the Church of Jesus Christ of Latter-day Saints. The town is also home to a number of schools, including Bridgetown Elementary School, Bridgetown Middle School, and Bridgetown High School.
Conclusion
Bridgetown is a small town located in the northern part of Mississippi, in the county of Harrison. The town has a population of approximately 1,500 people, and is part of the Gulfport-Biloxi metropolitan area. The town’s economy is largely based on tourism and fishing, and the town is home to a number of tourist attractions, restaurants, and small businesses. The town is also home to a number of churches and schools. The racial makeup of the town is 95.3% White, 1.7% African American, 0.7% Native American, 0.3% Asian, 0.1% Pacific Islander, and 1.7% from other races. The median household income in the town was $37,500, and the median family income was $45,000.
Common Questions
What is Per Capita Income in Bridgetown?
Per Capita income in Bridgetown is $43,580.
What is the Median Family Income in Bridgetown?
Median Family Income in Bridgetown is $120,125.
What is the Median Household income in Bridgetown?
Median Household Income in Bridgetown is $121,523.
What is Inequality or Gini Index in Bridgetown?
Inequality or Gini Index in Bridgetown is 0.25.
What is the Total Population of Bridgetown?
Total Population of Bridgetown is 2,893.
What is the Total Male Population of Bridgetown?
Total Male Population of Bridgetown is 1,216.
What is the Total Female Population of Bridgetown?
Total Female Population of Bridgetown is 1,677.
What is the Ratio of Males per 100 Females in Bridgetown?
There are 72.51 Males per 100 Females in Bridgetown.
What is the Ratio of Females per 100 Males in Bridgetown?
There are 137.91 Females per 100 Males in Bridgetown.
What is the Median Population Age in Bridgetown?
Median Population Age in Bridgetown is 37.1 Years.
What is the Average Family Size in Bridgetown
Average Family Size in Bridgetown is 3.5 People.
What is the Average Household Size in Bridgetown
Average Household Size in Bridgetown is 3.4 People.
How Large is the Labor Force in Bridgetown?
There are 1,688 People in the Labor Forcein in Bridgetown.
What is the Percentage of People in the Labor Force in Bridgetown?
73.3% of People are in the Labor Force in Bridgetown.
What is the Unemployment Rate in Bridgetown?
Unemployment Rate in Bridgetown is 12.3%.