West, MS Map & Demographics
West Map
West Overview
$29,207
PER CAPITA INCOME
$68,750
AVG FAMILY INCOME
$75,938
AVG HOUSEHOLD INCOME
0.26
INEQUALITY / GINI INDEX
200
TOTAL POPULATION
70
MALE POPULATION
130
FEMALE POPULATION
53.85
MALES / 100 FEMALES
185.71
FEMALES / 100 MALES
27.5
MEDIAN AGE
4.3
AVG FAMILY SIZE
4.3
AVG HOUSEHOLD SIZE
156
LABOR FORCE [ PEOPLE ]
82.1%
PERCENT IN LABOR FORCE
West Zip Codes
West Area Codes
Income in West
Income Overview in West
Per Capita Income in West is $29,207, while median incomes of families and households are $68,750 and $75,938 respectively.
| Characteristic | Number | Measure |
| Per Capita Income | 200 | $29,207 |
| Median Family Income | 37 | $68,750 |
| Mean Family Income | 37 | $67,446 |
| Median Household Income | 47 | $75,938 |
| Mean Household Income | 47 | $73,664 |
| Income Deficit | 37 | $0 |
| Wage / Income Gap (%) | 200 | 0.00% |
| Wage / Income Gap ($) | 200 | 100.00¢ per $1 |
| Gini / Inequality Index | 200 | 0.26 |
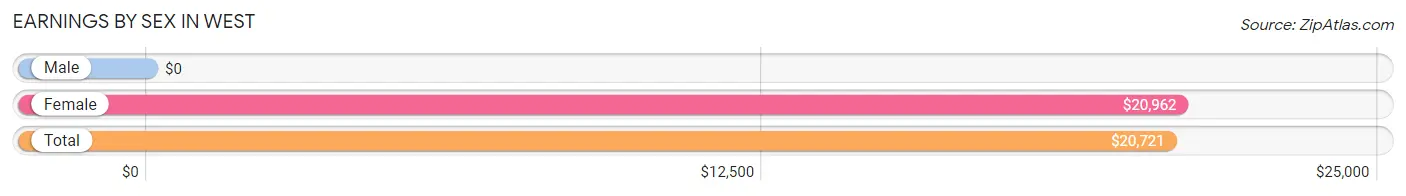
Earnings by Sex in West
| Sex | Number | Average Earnings |
| Male | 61 (36.5%) | $0 |
| Female | 106 (63.5%) | $20,962 |
| Total | 167 (100.0%) | $20,721 |
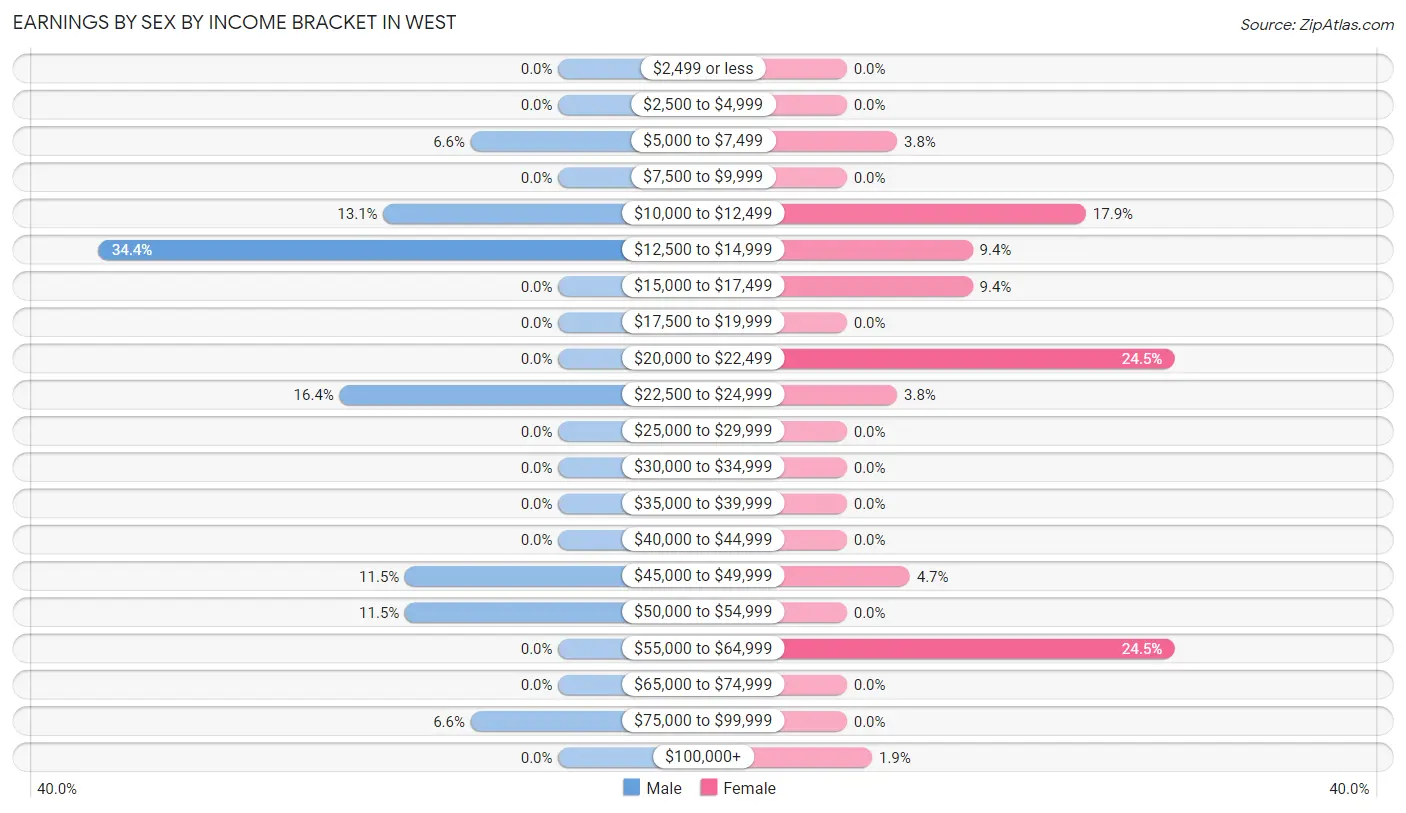
Earnings by Sex by Income Bracket in West
The most common earnings brackets in West are $12,500 to $14,999 for men (21 | 34.4%) and $20,000 to $22,499 for women (26 | 24.5%).
| Income | Male | Female |
| $2,499 or less | 0 (0.0%) | 0 (0.0%) |
| $2,500 to $4,999 | 0 (0.0%) | 0 (0.0%) |
| $5,000 to $7,499 | 4 (6.6%) | 4 (3.8%) |
| $7,500 to $9,999 | 0 (0.0%) | 0 (0.0%) |
| $10,000 to $12,499 | 8 (13.1%) | 19 (17.9%) |
| $12,500 to $14,999 | 21 (34.4%) | 10 (9.4%) |
| $15,000 to $17,499 | 0 (0.0%) | 10 (9.4%) |
| $17,500 to $19,999 | 0 (0.0%) | 0 (0.0%) |
| $20,000 to $22,499 | 0 (0.0%) | 26 (24.5%) |
| $22,500 to $24,999 | 10 (16.4%) | 4 (3.8%) |
| $25,000 to $29,999 | 0 (0.0%) | 0 (0.0%) |
| $30,000 to $34,999 | 0 (0.0%) | 0 (0.0%) |
| $35,000 to $39,999 | 0 (0.0%) | 0 (0.0%) |
| $40,000 to $44,999 | 0 (0.0%) | 0 (0.0%) |
| $45,000 to $49,999 | 7 (11.5%) | 5 (4.7%) |
| $50,000 to $54,999 | 7 (11.5%) | 0 (0.0%) |
| $55,000 to $64,999 | 0 (0.0%) | 26 (24.5%) |
| $65,000 to $74,999 | 0 (0.0%) | 0 (0.0%) |
| $75,000 to $99,999 | 4 (6.6%) | 0 (0.0%) |
| $100,000+ | 0 (0.0%) | 2 (1.9%) |
| Total | 61 (100.0%) | 106 (100.0%) |
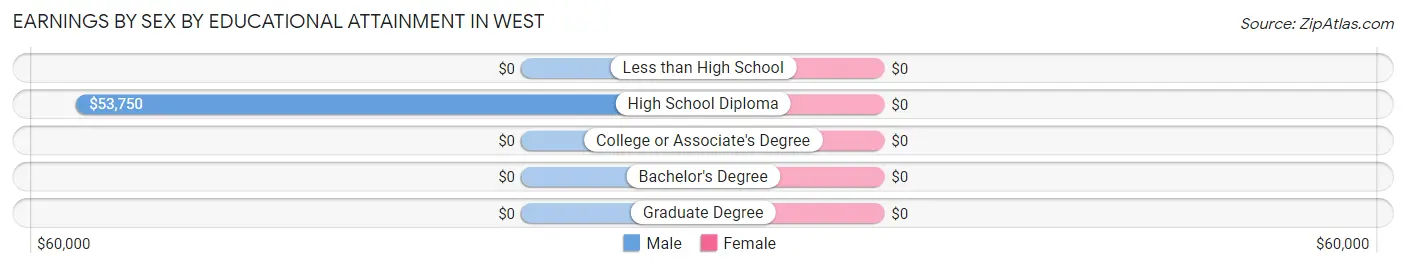
Earnings by Sex by Educational Attainment in West
| Educational Attainment | Male Income | Female Income |
| Less than High School | - | - |
| High School Diploma | $53,750 | $0 |
| College or Associate's Degree | - | - |
| Bachelor's Degree | - | - |
| Graduate Degree | - | - |
| Total | - | - |
Family Income in West
Family Income Brackets in West
According to the West family income data, there are 11 families falling into the $35,000 to $49,999 income range, which is the most common income bracket and makes up 29.7% of all families.
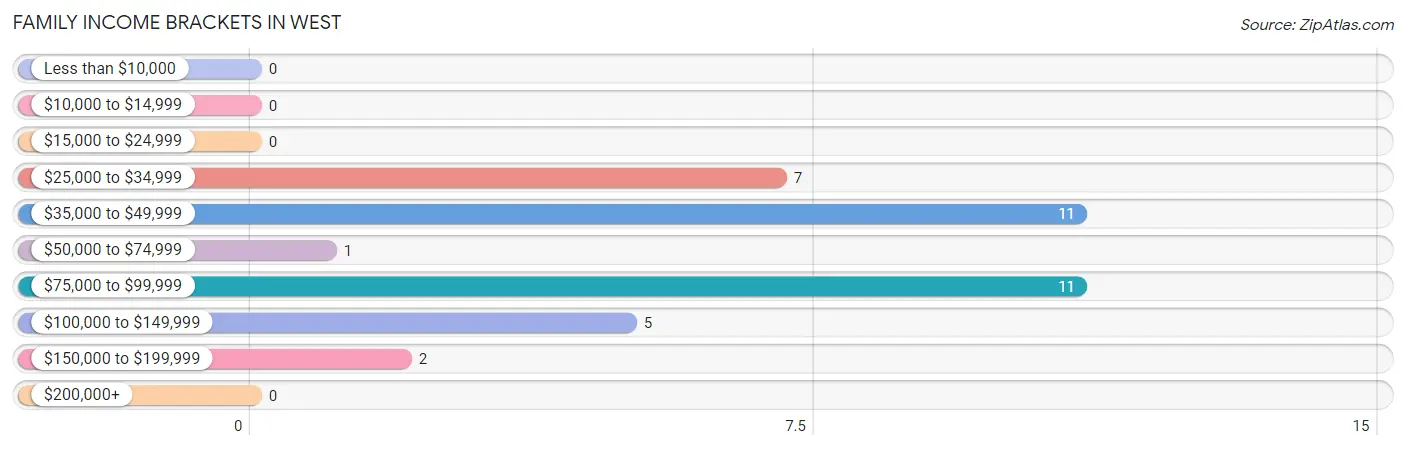
| Income Bracket | # Families | % Families |
| Less than $10,000 | 0 | 0.0% |
| $10,000 to $14,999 | 0 | 0.0% |
| $15,000 to $24,999 | 0 | 0.0% |
| $25,000 to $34,999 | 7 | 18.9% |
| $35,000 to $49,999 | 11 | 29.7% |
| $50,000 to $74,999 | 1 | 2.7% |
| $75,000 to $99,999 | 11 | 29.7% |
| $100,000 to $149,999 | 5 | 13.5% |
| $150,000 to $199,999 | 2 | 5.4% |
| $200,000+ | 0 | 0.0% |
Family Income by Famaliy Size in West
2-person families (28 | 75.7%) account for the highest median family income in West with $76,250 per family, while 2-person families (28 | 75.7%) have the highest median income of $38,125 per family member.
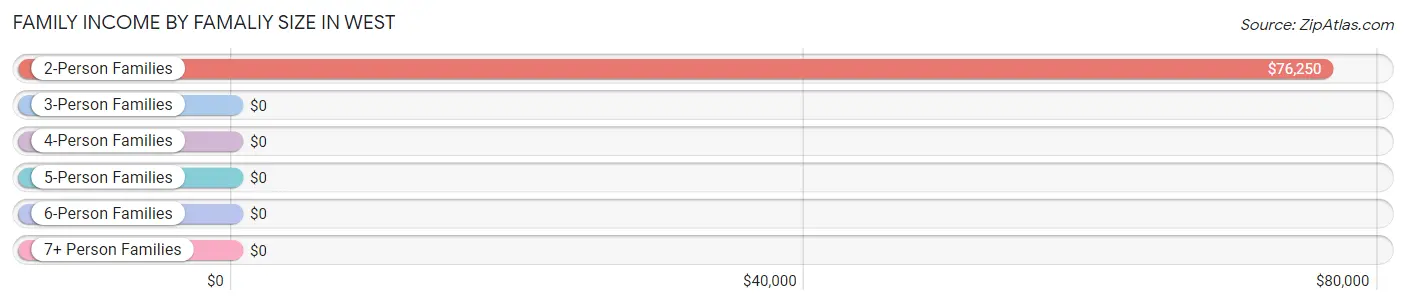
| Income Bracket | # Families | Median Income |
| 2-Person Families | 28 (75.7%) | $76,250 |
| 3-Person Families | 9 (24.3%) | $0 |
| 4-Person Families | 0 (0.0%) | $0 |
| 5-Person Families | 0 (0.0%) | $0 |
| 6-Person Families | 0 (0.0%) | $0 |
| 7+ Person Families | 0 (0.0%) | $0 |
| Total | 37 (100.0%) | $68,750 |
Family Income by Number of Earners in West
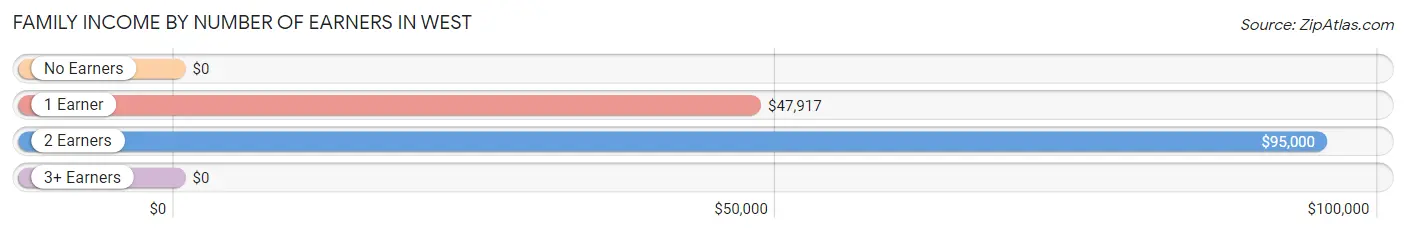
| Number of Earners | # Families | Median Income |
| No Earners | 1 (2.7%) | $0 |
| 1 Earner | 15 (40.5%) | $47,917 |
| 2 Earners | 14 (37.8%) | $95,000 |
| 3+ Earners | 7 (18.9%) | $0 |
| Total | 37 (100.0%) | $68,750 |
Household Income in West
Household Income Brackets in West
With 12 households falling in the category, the $100,000 to $149,999 income range is the most frequent in West, accounting for 25.5% of all households.
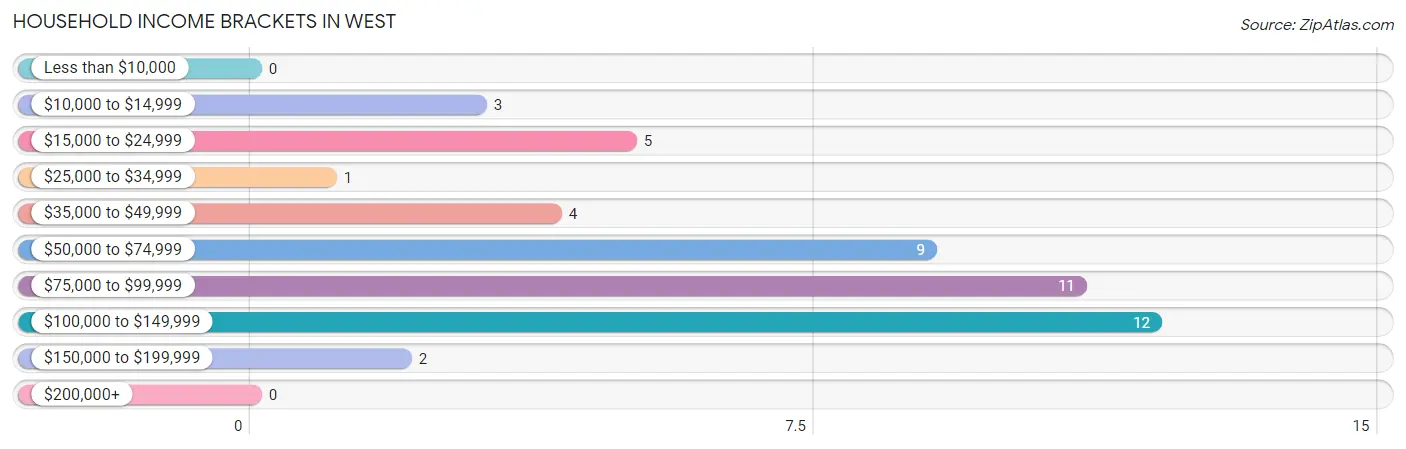
| Income Bracket | # Households | % Households |
| Less than $10,000 | 0 | 0.0% |
| $10,000 to $14,999 | 3 | 6.4% |
| $15,000 to $24,999 | 5 | 10.6% |
| $25,000 to $34,999 | 1 | 2.1% |
| $35,000 to $49,999 | 4 | 8.5% |
| $50,000 to $74,999 | 9 | 19.1% |
| $75,000 to $99,999 | 11 | 23.4% |
| $100,000 to $149,999 | 12 | 25.5% |
| $150,000 to $199,999 | 2 | 4.3% |
| $200,000+ | 0 | 0.0% |
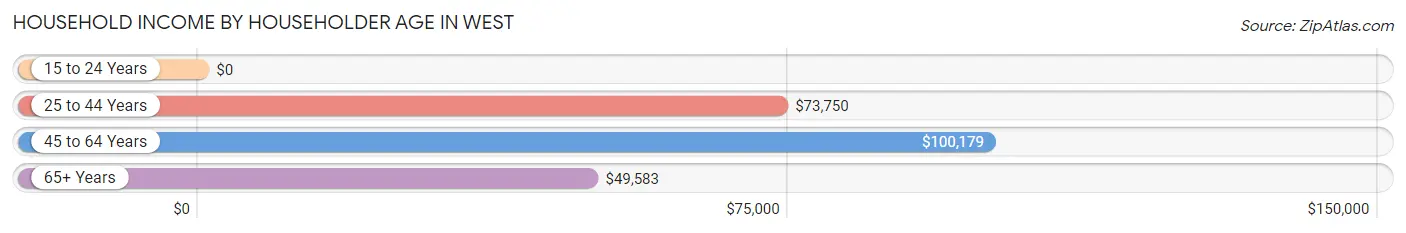
Household Income by Householder Age in West
The median household income in West is $75,938, with the highest median household income of $100,179 found in the 45 to 64 years age bracket for the primary householder. A total of 17 households (36.2%) fall into this category.
| Income Bracket | # Households | Median Income |
| 15 to 24 Years | 0 (0.0%) | $0 |
| 25 to 44 Years | 15 (31.9%) | $73,750 |
| 45 to 64 Years | 17 (36.2%) | $100,179 |
| 65+ Years | 15 (31.9%) | $49,583 |
| Total | 47 (100.0%) | $75,938 |
Poverty in West
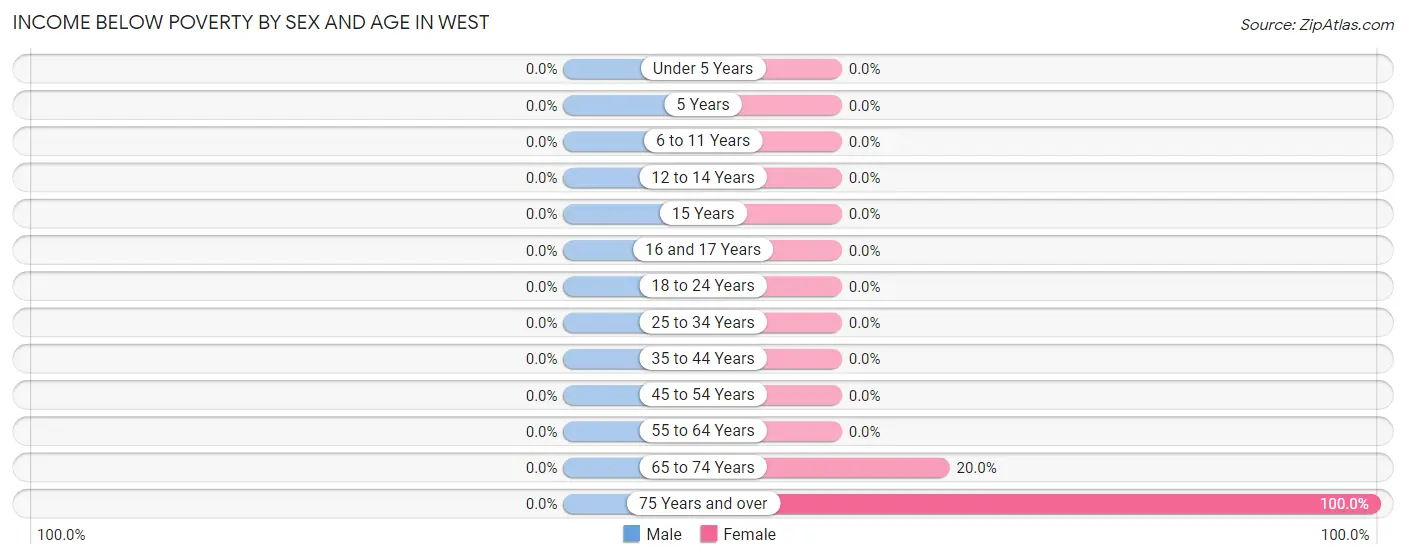
Income Below Poverty by Sex and Age in West
| Age Bracket | Male | Female |
| Under 5 Years | 0 (0.0%) | 0 (0.0%) |
| 5 Years | 0 (0.0%) | 0 (0.0%) |
| 6 to 11 Years | 0 (0.0%) | 0 (0.0%) |
| 12 to 14 Years | 0 (0.0%) | 0 (0.0%) |
| 15 Years | 0 (0.0%) | 0 (0.0%) |
| 16 and 17 Years | 0 (0.0%) | 0 (0.0%) |
| 18 to 24 Years | 0 (0.0%) | 0 (0.0%) |
| 25 to 34 Years | 0 (0.0%) | 0 (0.0%) |
| 35 to 44 Years | 0 (0.0%) | 0 (0.0%) |
| 45 to 54 Years | 0 (0.0%) | 0 (0.0%) |
| 55 to 64 Years | 0 (0.0%) | 0 (0.0%) |
| 65 to 74 Years | 0 (0.0%) | 1 (20.0%) |
| 75 Years and over | 0 (0.0%) | 2 (100.0%) |
| Total | 0 (0.0%) | 3 (2.3%) |
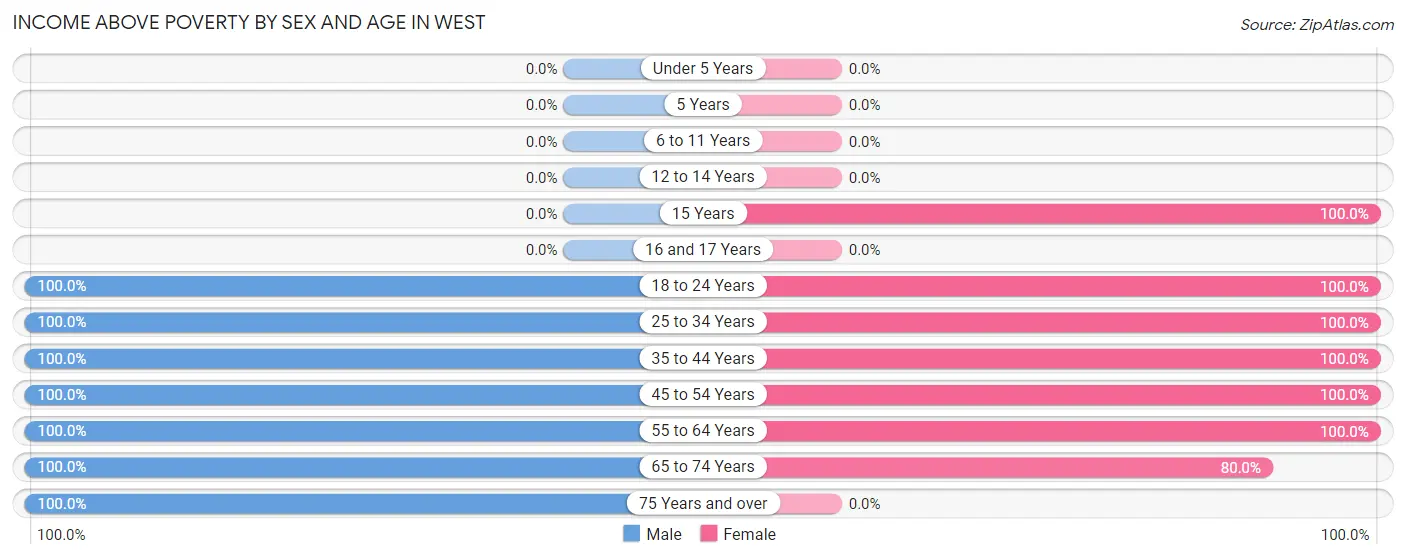
Income Above Poverty by Sex and Age in West
According to the poverty statistics in West, males aged 18 to 24 years and females aged 15 years are the age groups that are most secure financially, with 100.0% of males and 100.0% of females in these age groups living above the poverty line.
| Age Bracket | Male | Female |
| Under 5 Years | 0 (0.0%) | 0 (0.0%) |
| 5 Years | 0 (0.0%) | 0 (0.0%) |
| 6 to 11 Years | 0 (0.0%) | 0 (0.0%) |
| 12 to 14 Years | 0 (0.0%) | 0 (0.0%) |
| 15 Years | 0 (0.0%) | 10 (100.0%) |
| 16 and 17 Years | 0 (0.0%) | 0 (0.0%) |
| 18 to 24 Years | 21 (100.0%) | 19 (100.0%) |
| 25 to 34 Years | 10 (100.0%) | 57 (100.0%) |
| 35 to 44 Years | 8 (100.0%) | 11 (100.0%) |
| 45 to 54 Years | 14 (100.0%) | 2 (100.0%) |
| 55 to 64 Years | 7 (100.0%) | 24 (100.0%) |
| 65 to 74 Years | 9 (100.0%) | 4 (80.0%) |
| 75 Years and over | 1 (100.0%) | 0 (0.0%) |
| Total | 70 (100.0%) | 127 (97.7%) |
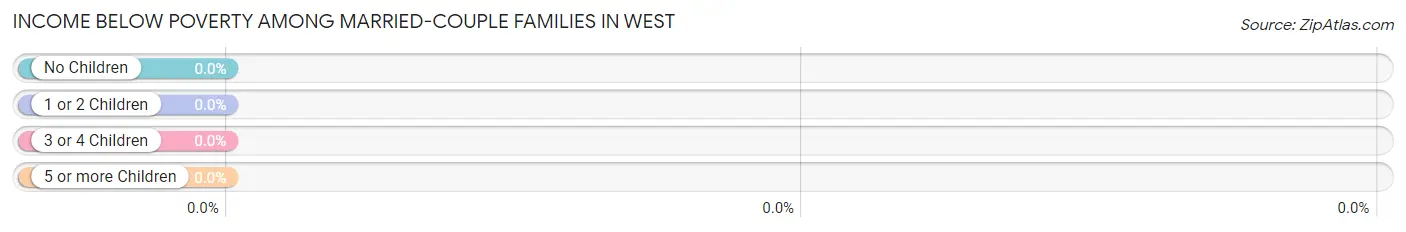
Income Below Poverty Among Married-Couple Families in West
| Children | Above Poverty | Below Poverty |
| No Children | 16 (100.0%) | 0 (0.0%) |
| 1 or 2 Children | 2 (100.0%) | 0 (0.0%) |
| 3 or 4 Children | 0 (0.0%) | 0 (0.0%) |
| 5 or more Children | 0 (0.0%) | 0 (0.0%) |
| Total | 18 (100.0%) | 0 (0.0%) |
Income Below Poverty Among Single-Parent Households in West
| Children | Single Father | Single Mother |
| No Children | 0 (0.0%) | 0 (0.0%) |
| 1 or 2 Children | 0 (0.0%) | 0 (0.0%) |
| 3 or 4 Children | 0 (0.0%) | 0 (0.0%) |
| 5 or more Children | 0 (0.0%) | 0 (0.0%) |
| Total | 0 (0.0%) | 0 (0.0%) |
Income Below Poverty Among Married-Couple vs Single-Parent Households in West
| Children | Married-Couple Families | Single-Parent Households |
| No Children | 0 (0.0%) | 0 (0.0%) |
| 1 or 2 Children | 0 (0.0%) | 0 (0.0%) |
| 3 or 4 Children | 0 (0.0%) | 0 (0.0%) |
| 5 or more Children | 0 (0.0%) | 0 (0.0%) |
| Total | 0 (0.0%) | 0 (0.0%) |
Race in West
The most populous races in West are Black / African American (100 | 50.0%), and White / Caucasian (100 | 50.0%).
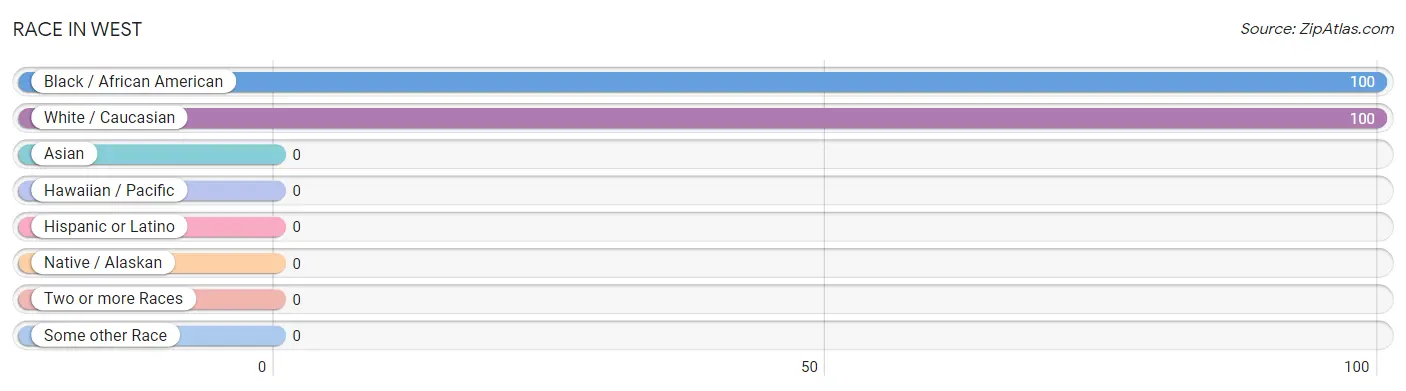
| Race | # Population | % Population |
| Asian | 0 | 0.0% |
| Black / African American | 100 | 50.0% |
| Hawaiian / Pacific | 0 | 0.0% |
| Hispanic or Latino | 0 | 0.0% |
| Native / Alaskan | 0 | 0.0% |
| White / Caucasian | 100 | 50.0% |
| Two or more Races | 0 | 0.0% |
| Some other Race | 0 | 0.0% |
| Total | 200 | 100.0% |
Ancestry in West
The most populous ancestries reported in West are American (28 | 14.0%), English (21 | 10.5%), German (14 | 7.0%), African (1 | 0.5%), and Subsaharan African (1 | 0.5%), together accounting for 32.5% of all West residents.
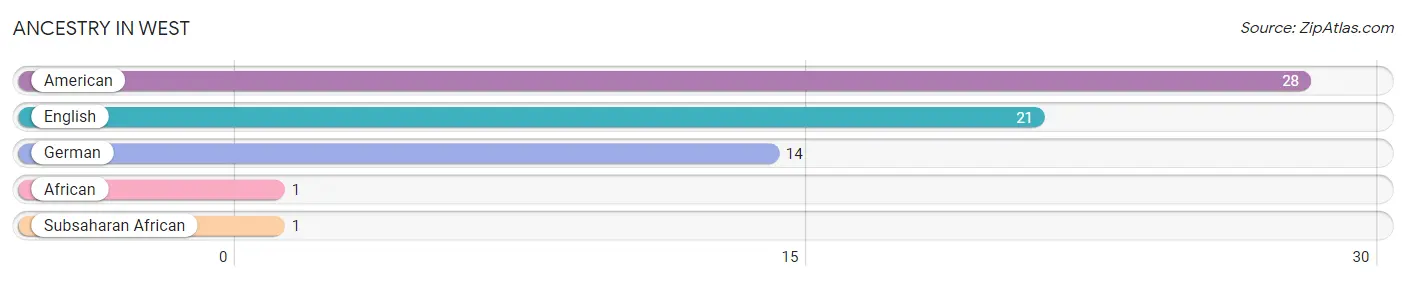
| Ancestry | # Population | % Population |
| African | 1 | 0.5% |
| American | 28 | 14.0% |
| English | 21 | 10.5% |
| German | 14 | 7.0% |
| Subsaharan African | 1 | 0.5% | View All 5 Rows |
Immigrants in West

| Immigration Origin | # Population | % Population | View All 0 Rows |
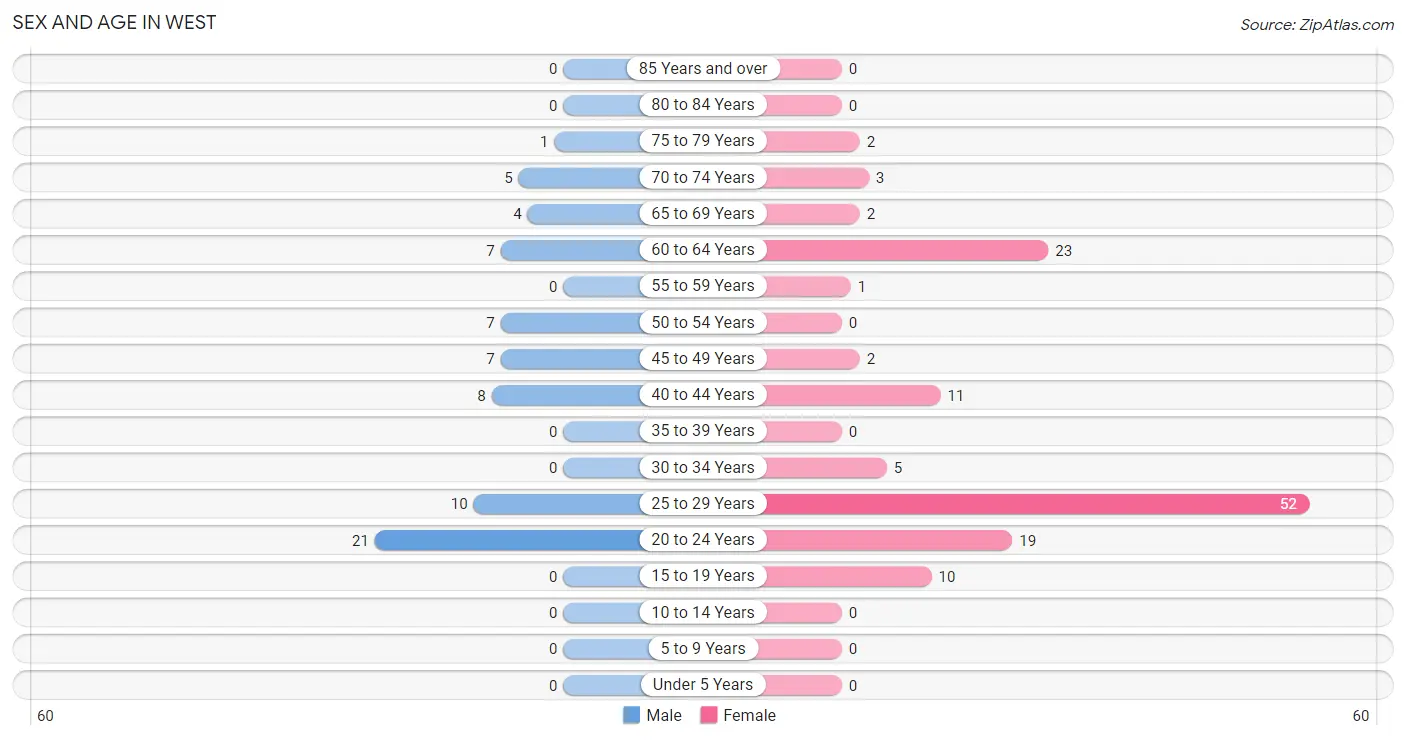
Sex and Age in West
Sex and Age in West
The most populous age groups in West are 20 to 24 Years (21 | 30.0%) for men and 25 to 29 Years (52 | 40.0%) for women.
| Age Bracket | Male | Female |
| Under 5 Years | 0 (0.0%) | 0 (0.0%) |
| 5 to 9 Years | 0 (0.0%) | 0 (0.0%) |
| 10 to 14 Years | 0 (0.0%) | 0 (0.0%) |
| 15 to 19 Years | 0 (0.0%) | 10 (7.7%) |
| 20 to 24 Years | 21 (30.0%) | 19 (14.6%) |
| 25 to 29 Years | 10 (14.3%) | 52 (40.0%) |
| 30 to 34 Years | 0 (0.0%) | 5 (3.8%) |
| 35 to 39 Years | 0 (0.0%) | 0 (0.0%) |
| 40 to 44 Years | 8 (11.4%) | 11 (8.5%) |
| 45 to 49 Years | 7 (10.0%) | 2 (1.5%) |
| 50 to 54 Years | 7 (10.0%) | 0 (0.0%) |
| 55 to 59 Years | 0 (0.0%) | 1 (0.8%) |
| 60 to 64 Years | 7 (10.0%) | 23 (17.7%) |
| 65 to 69 Years | 4 (5.7%) | 2 (1.5%) |
| 70 to 74 Years | 5 (7.1%) | 3 (2.3%) |
| 75 to 79 Years | 1 (1.4%) | 2 (1.5%) |
| 80 to 84 Years | 0 (0.0%) | 0 (0.0%) |
| 85 Years and over | 0 (0.0%) | 0 (0.0%) |
| Total | 70 (100.0%) | 130 (100.0%) |
Families and Households in West
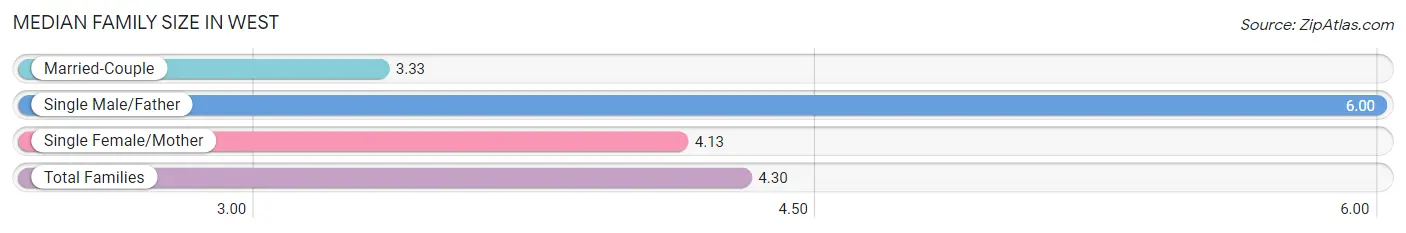
Median Family Size in West
The median family size in West is 4.30 persons per family, with single male/father families (11 | 29.7%) accounting for the largest median family size of 6 persons per family. On the other hand, married-couple families (18 | 48.6%) represent the smallest median family size with 3.33 persons per family.
| Family Type | # Families | Family Size |
| Married-Couple | 18 (48.6%) | 3.33 |
| Single Male/Father | 11 (29.7%) | 6.00 |
| Single Female/Mother | 8 (21.6%) | 4.13 |
| Total Families | 37 (100.0%) | 4.30 |
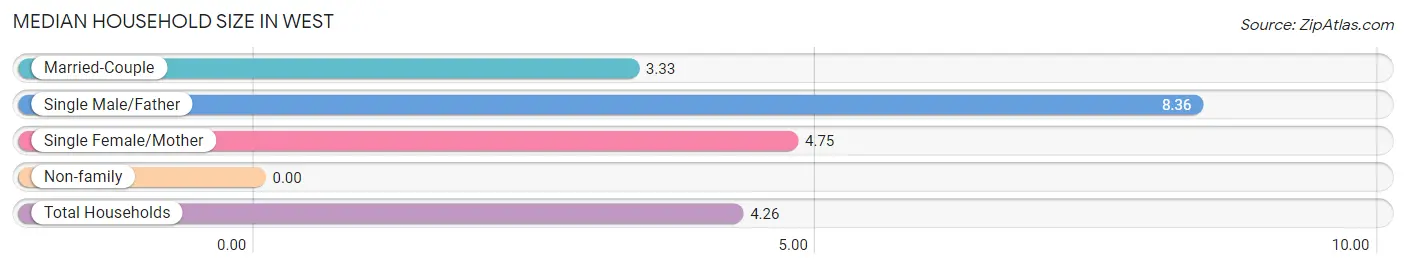
Median Household Size in West
| Household Type | # Households | Household Size |
| Married-Couple | 18 (38.3%) | 3.33 |
| Single Male/Father | 11 (23.4%) | 8.36 |
| Single Female/Mother | 8 (17.0%) | 4.75 |
| Non-family | 10 (21.3%) | - |
| Total Households | 47 (100.0%) | 4.26 |
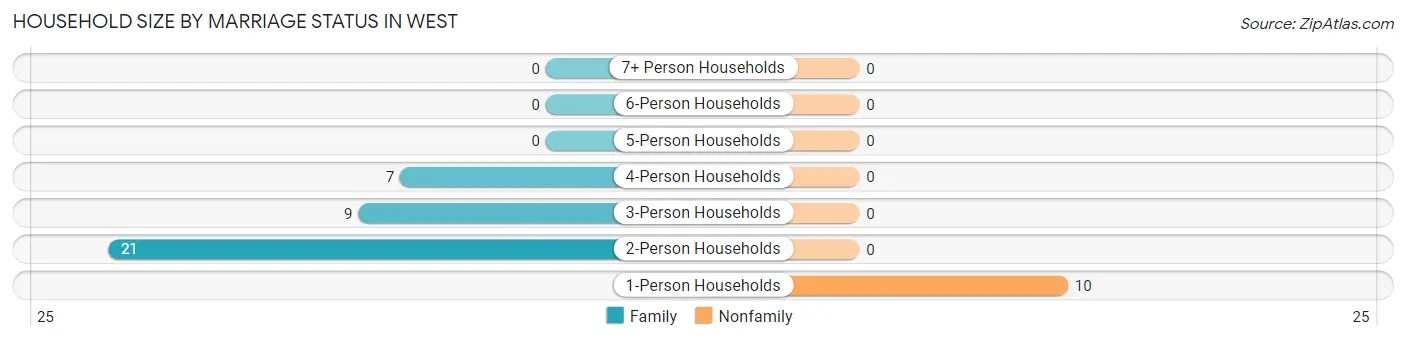
Household Size by Marriage Status in West
Out of a total of 47 households in West, 37 (78.7%) are family households, while 10 (21.3%) are nonfamily households. The most numerous type of family households are 2-person households, comprising 21, and the most common type of nonfamily households are 1-person households, comprising 10.
| Household Size | Family Households | Nonfamily Households |
| 1-Person Households | - | 10 (21.3%) |
| 2-Person Households | 21 (44.7%) | 0 (0.0%) |
| 3-Person Households | 9 (19.2%) | 0 (0.0%) |
| 4-Person Households | 7 (14.9%) | 0 (0.0%) |
| 5-Person Households | 0 (0.0%) | 0 (0.0%) |
| 6-Person Households | 0 (0.0%) | 0 (0.0%) |
| 7+ Person Households | 0 (0.0%) | 0 (0.0%) |
| Total | 37 (78.7%) | 10 (21.3%) |
Female Fertility in West
Fertility by Age in West
| Age Bracket | Women with Births | Births / 1,000 Women |
| 15 to 19 years | 0 (0.0%) | 0.0 |
| 20 to 34 years | 0 (0.0%) | 0.0 |
| 35 to 50 years | 0 (0.0%) | 0.0 |
| Total | 0 (0.0%) | 0.0 |
Fertility by Age by Marriage Status in West
| Age Bracket | Married | Unmarried |
| 15 to 19 years | 0 (0.0%) | 0 (0.0%) |
| 20 to 34 years | 0 (0.0%) | 0 (0.0%) |
| 35 to 50 years | 0 (0.0%) | 0 (0.0%) |
| Total | 0 (0.0%) | 0 (0.0%) |
Fertility by Education in West
| Educational Attainment | Women with Births | Births / 1,000 Women |
| Less than High School | 0 (0.0%) | 0.0 |
| High School Diploma | 0 (0.0%) | 0.0 |
| College or Associate's Degree | 0 (0.0%) | 0.0 |
| Bachelor's Degree | 0 (0.0%) | 0.0 |
| Graduate Degree | 0 (0.0%) | 0.0 |
| Total | 0 (0.0%) | 0.0 |
Fertility by Education by Marriage Status in West
| Educational Attainment | Married | Unmarried |
| Less than High School | 0 (0.0%) | 0 (0.0%) |
| High School Diploma | 0 (0.0%) | 0 (0.0%) |
| College or Associate's Degree | 0 (0.0%) | 0 (0.0%) |
| Bachelor's Degree | 0 (0.0%) | 0 (0.0%) |
| Graduate Degree | 0 (0.0%) | 0 (0.0%) |
| Total | 0 (0.0%) | 0 (0.0%) |
Employment Characteristics in West
Employment by Class of Employer in West
Among the 147 employed individuals in West, private company employees (134 | 91.2%), state government employees (9 | 6.1%), and local government employees (4 | 2.7%) make up the most common classes of employment.
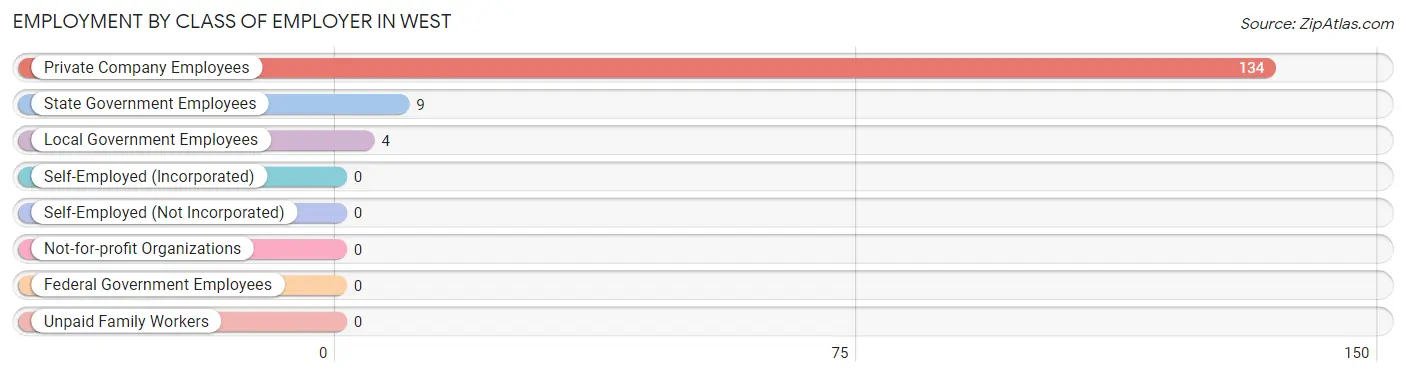
| Employer Class | # Employees | % Employees |
| Private Company Employees | 134 | 91.2% |
| Self-Employed (Incorporated) | 0 | 0.0% |
| Self-Employed (Not Incorporated) | 0 | 0.0% |
| Not-for-profit Organizations | 0 | 0.0% |
| Local Government Employees | 4 | 2.7% |
| State Government Employees | 9 | 6.1% |
| Federal Government Employees | 0 | 0.0% |
| Unpaid Family Workers | 0 | 0.0% |
| Total | 147 | 100.0% |
Employment Status by Age in West
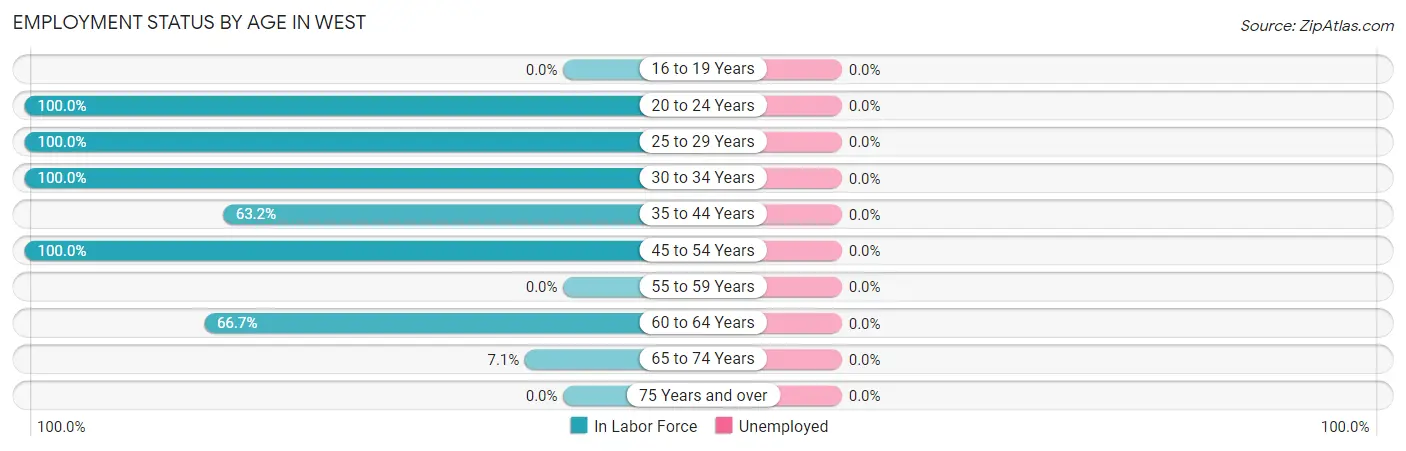
| Age Bracket | In Labor Force | Unemployed |
| 16 to 19 Years | 0 (0.0%) | 0 (0.0%) |
| 20 to 24 Years | 40 (100.0%) | 0 (0.0%) |
| 25 to 29 Years | 62 (100.0%) | 0 (0.0%) |
| 30 to 34 Years | 5 (100.0%) | 0 (0.0%) |
| 35 to 44 Years | 12 (63.2%) | 0 (0.0%) |
| 45 to 54 Years | 16 (100.0%) | 0 (0.0%) |
| 55 to 59 Years | 0 (0.0%) | 0 (0.0%) |
| 60 to 64 Years | 20 (66.7%) | 0 (0.0%) |
| 65 to 74 Years | 1 (7.1%) | 0 (0.0%) |
| 75 Years and over | 0 (0.0%) | 0 (0.0%) |
| Total | 156 (82.1%) | 0 (0.0%) |
Employment Status by Educational Attainment in West
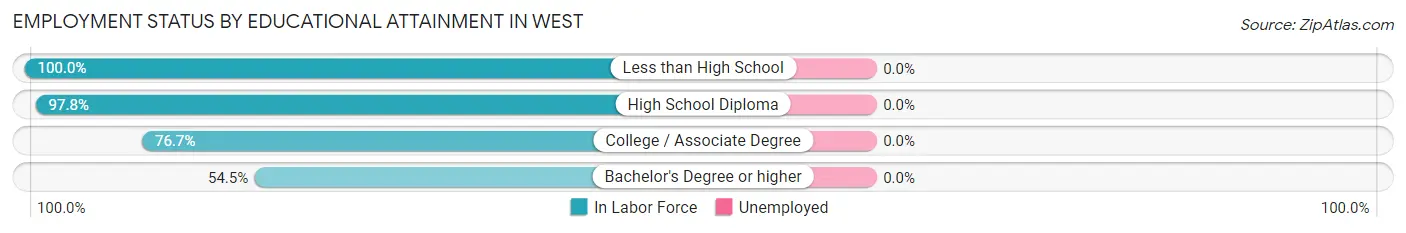
| Educational Attainment | In Labor Force | Unemployed |
| Less than High School | 35 (100.0%) | 0 (0.0%) |
| High School Diploma | 45 (97.8%) | 0 (0.0%) |
| College / Associate Degree | 23 (76.7%) | 0 (0.0%) |
| Bachelor's Degree or higher | 12 (54.5%) | 0 (0.0%) |
| Total | 115 (86.5%) | 0 (0.0%) |
Employment Occupations by Sex in West
Management, Business, Science and Arts Occupations
The most common Management, Business, Science and Arts occupations in West are , and Management (18 | 11.5%).
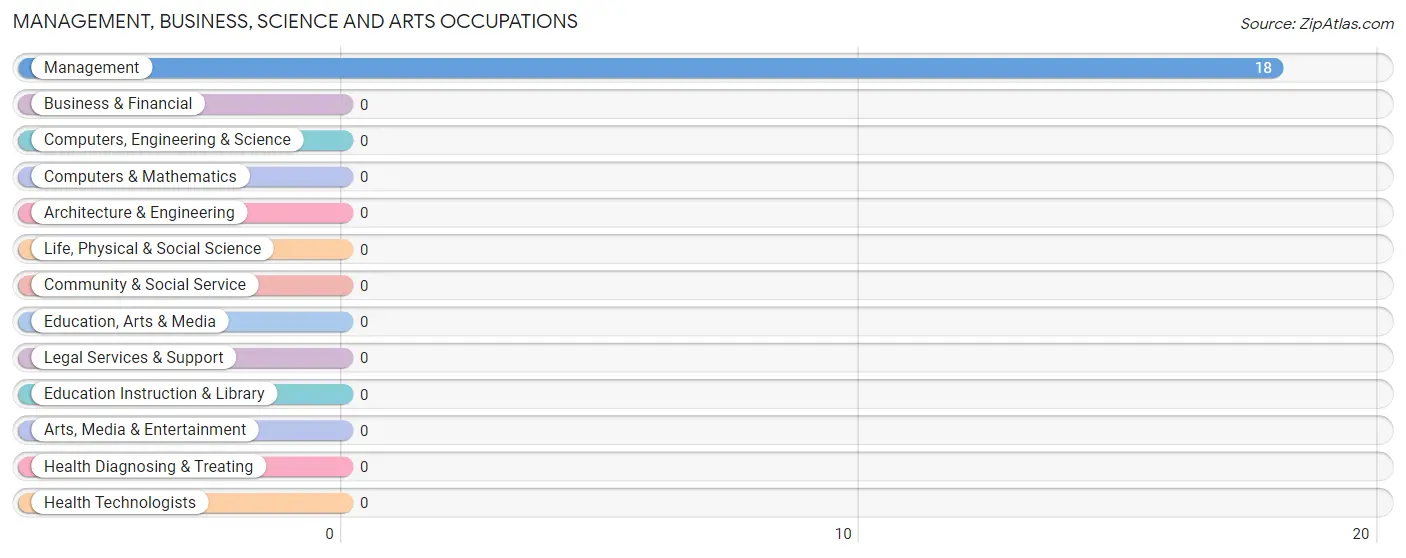
Management, Business, Science and Arts Occupations by Sex
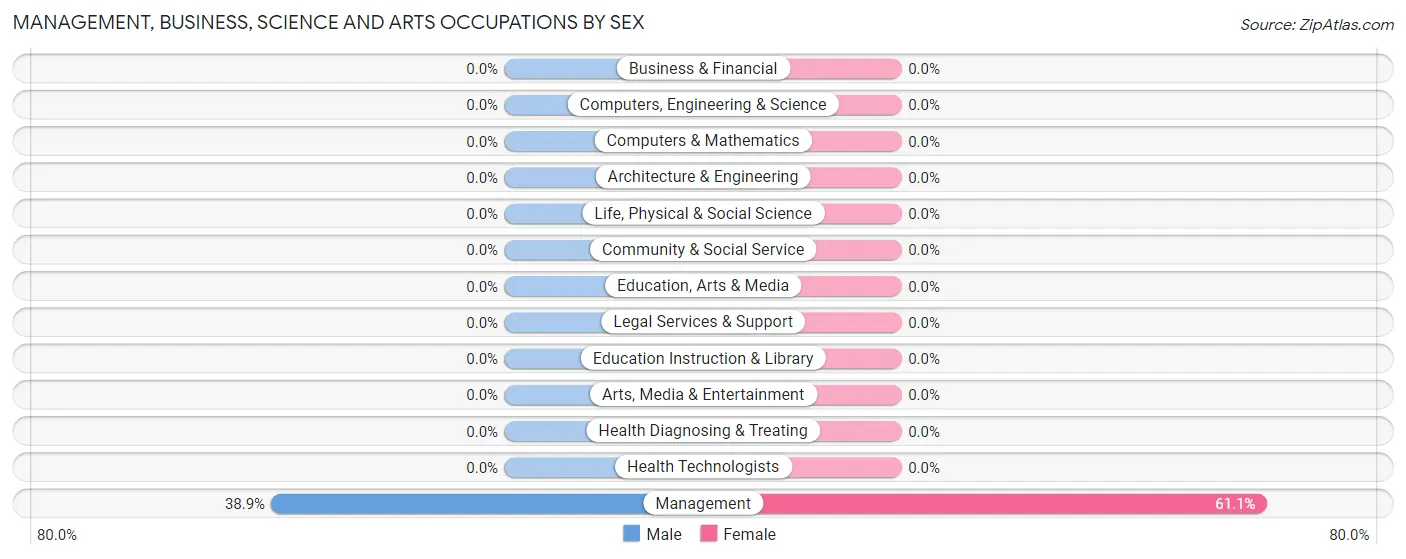
| Occupation | Male | Female |
| Management | 7 (38.9%) | 11 (61.1%) |
| Business & Financial | 0 (0.0%) | 0 (0.0%) |
| Computers, Engineering & Science | 0 (0.0%) | 0 (0.0%) |
| Computers & Mathematics | 0 (0.0%) | 0 (0.0%) |
| Architecture & Engineering | 0 (0.0%) | 0 (0.0%) |
| Life, Physical & Social Science | 0 (0.0%) | 0 (0.0%) |
| Community & Social Service | 0 (0.0%) | 0 (0.0%) |
| Education, Arts & Media | 0 (0.0%) | 0 (0.0%) |
| Legal Services & Support | 0 (0.0%) | 0 (0.0%) |
| Education Instruction & Library | 0 (0.0%) | 0 (0.0%) |
| Arts, Media & Entertainment | 0 (0.0%) | 0 (0.0%) |
| Health Diagnosing & Treating | 0 (0.0%) | 0 (0.0%) |
| Health Technologists | 0 (0.0%) | 0 (0.0%) |
| Total (Category) | 7 (38.9%) | 11 (61.1%) |
| Total (Overall) | 61 (39.1%) | 95 (60.9%) |
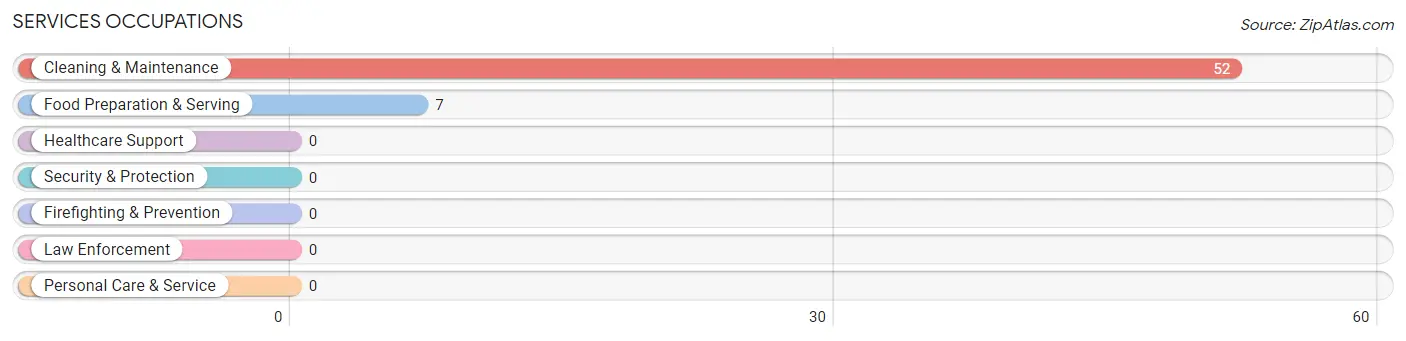
Services Occupations
The most common Services occupations in West are Cleaning & Maintenance (52 | 33.3%), and Food Preparation & Serving (7 | 4.5%).
Services Occupations by Sex
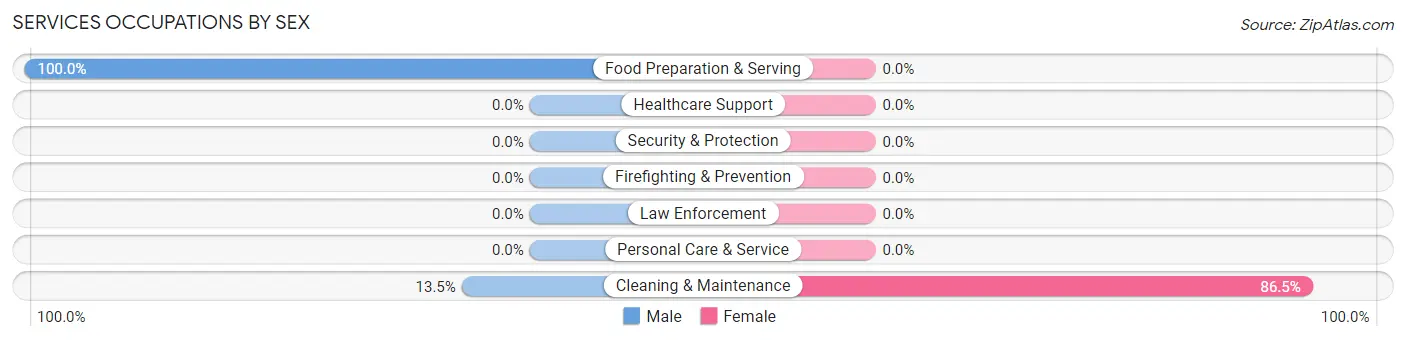
| Occupation | Male | Female |
| Healthcare Support | 0 (0.0%) | 0 (0.0%) |
| Security & Protection | 0 (0.0%) | 0 (0.0%) |
| Firefighting & Prevention | 0 (0.0%) | 0 (0.0%) |
| Law Enforcement | 0 (0.0%) | 0 (0.0%) |
| Food Preparation & Serving | 7 (100.0%) | 0 (0.0%) |
| Cleaning & Maintenance | 7 (13.5%) | 45 (86.5%) |
| Personal Care & Service | 0 (0.0%) | 0 (0.0%) |
| Total (Category) | 14 (23.7%) | 45 (76.3%) |
| Total (Overall) | 61 (39.1%) | 95 (60.9%) |
Sales and Office Occupations
The most common Sales and Office occupations in West are Sales & Related (21 | 13.5%), and Office & Administration (10 | 6.4%).
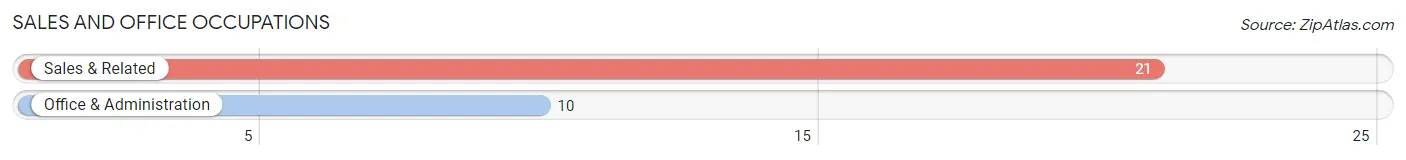
Sales and Office Occupations by Sex
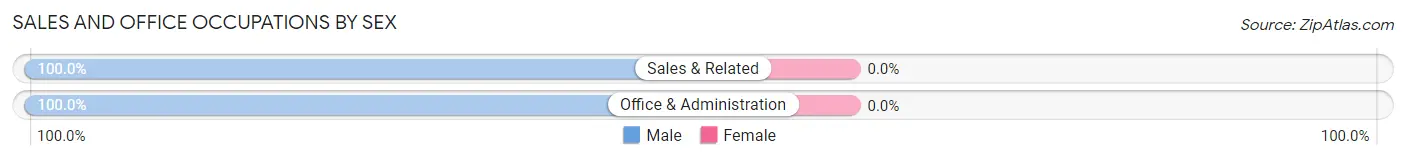
| Occupation | Male | Female |
| Sales & Related | 21 (100.0%) | 0 (0.0%) |
| Office & Administration | 10 (100.0%) | 0 (0.0%) |
| Total (Category) | 31 (100.0%) | 0 (0.0%) |
| Total (Overall) | 61 (39.1%) | 95 (60.9%) |
Natural Resources, Construction and Maintenance Occupations
The most common Natural Resources, Construction and Maintenance occupations in West are , and Installation, Maintenance & Repair (4 | 2.6%).
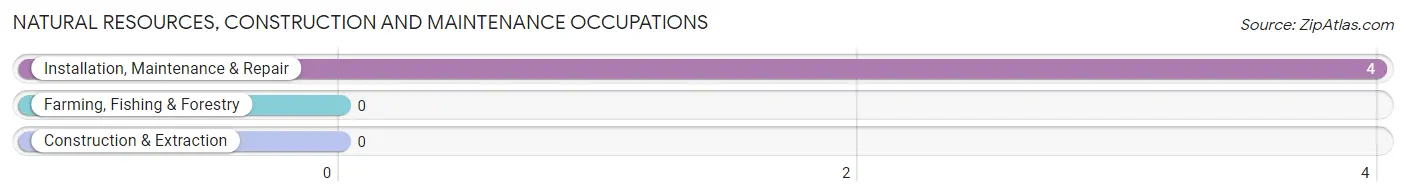
Natural Resources, Construction and Maintenance Occupations by Sex
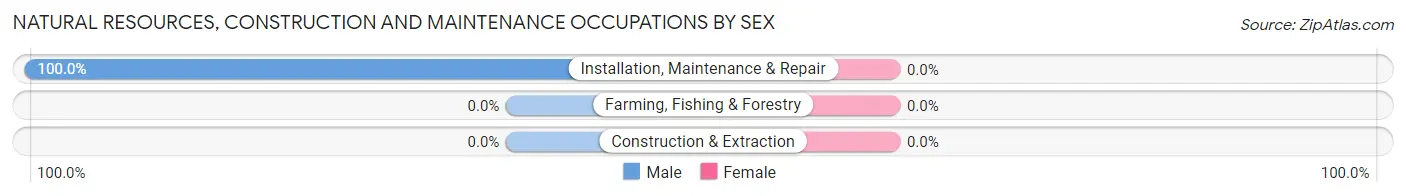
| Occupation | Male | Female |
| Farming, Fishing & Forestry | 0 (0.0%) | 0 (0.0%) |
| Construction & Extraction | 0 (0.0%) | 0 (0.0%) |
| Installation, Maintenance & Repair | 4 (100.0%) | 0 (0.0%) |
| Total (Category) | 4 (100.0%) | 0 (0.0%) |
| Total (Overall) | 61 (39.1%) | 95 (60.9%) |
Production, Transportation and Moving Occupations
The most common Production, Transportation and Moving occupations in West are Transportation (34 | 21.8%), Production (5 | 3.2%), and Material Moving (5 | 3.2%).
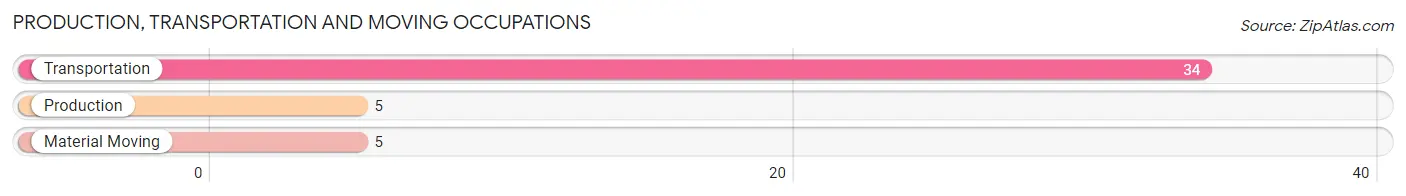
Production, Transportation and Moving Occupations by Sex
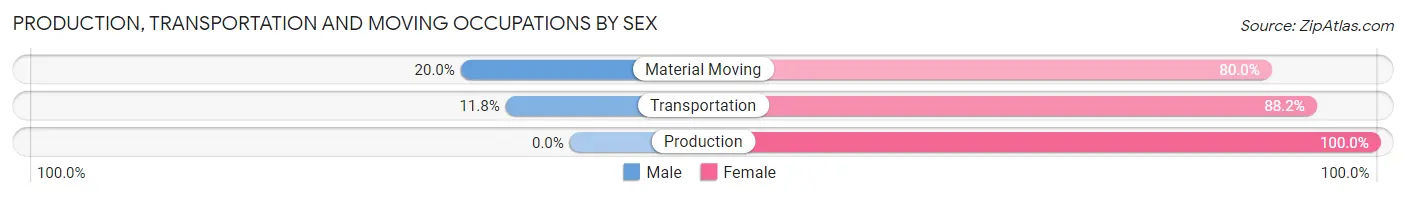
| Occupation | Male | Female |
| Production | 0 (0.0%) | 5 (100.0%) |
| Transportation | 4 (11.8%) | 30 (88.2%) |
| Material Moving | 1 (20.0%) | 4 (80.0%) |
| Total (Category) | 5 (11.4%) | 39 (88.6%) |
| Total (Overall) | 61 (39.1%) | 95 (60.9%) |
Employment Industries by Sex in West
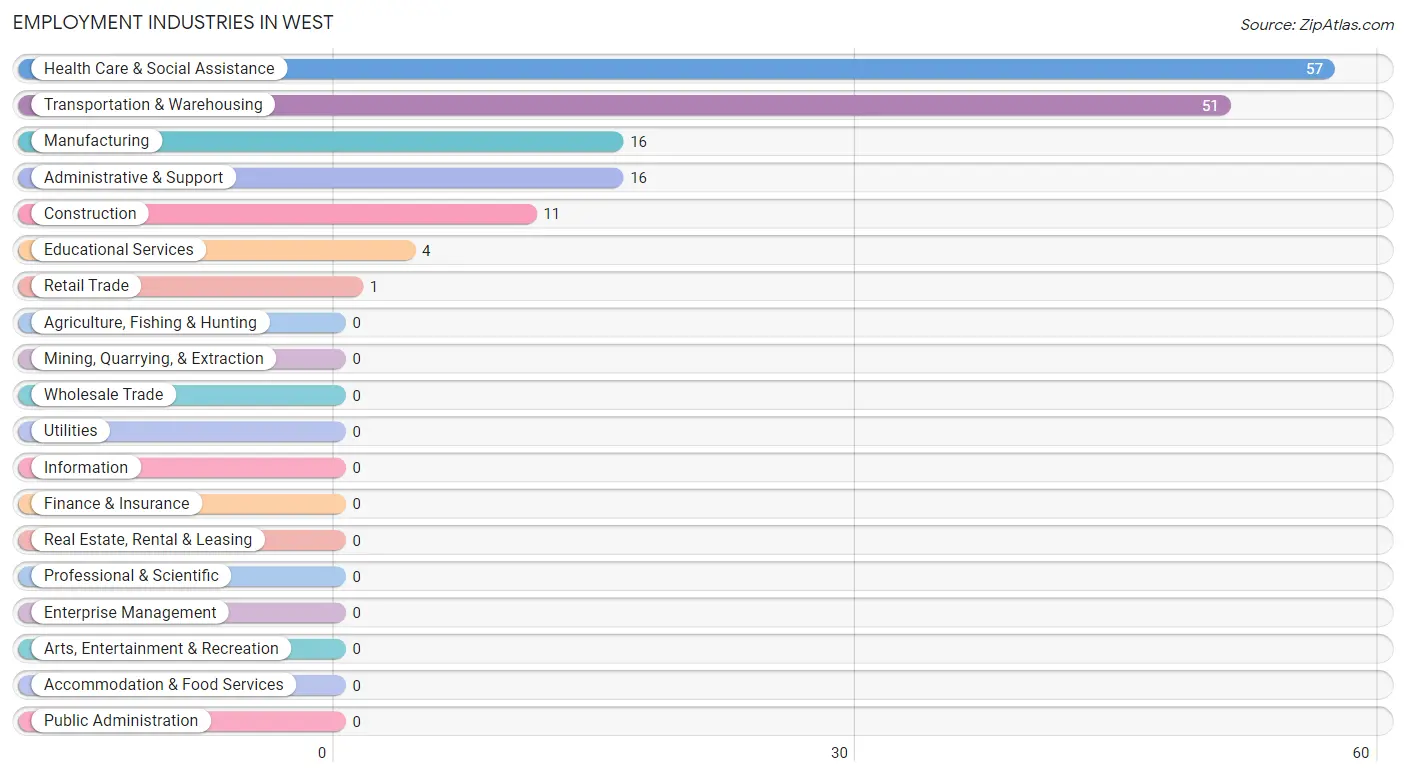
Employment Industries in West
The major employment industries in West include Health Care & Social Assistance (57 | 36.5%), Transportation & Warehousing (51 | 32.7%), Manufacturing (16 | 10.3%), Administrative & Support (16 | 10.3%), and Construction (11 | 7.0%).
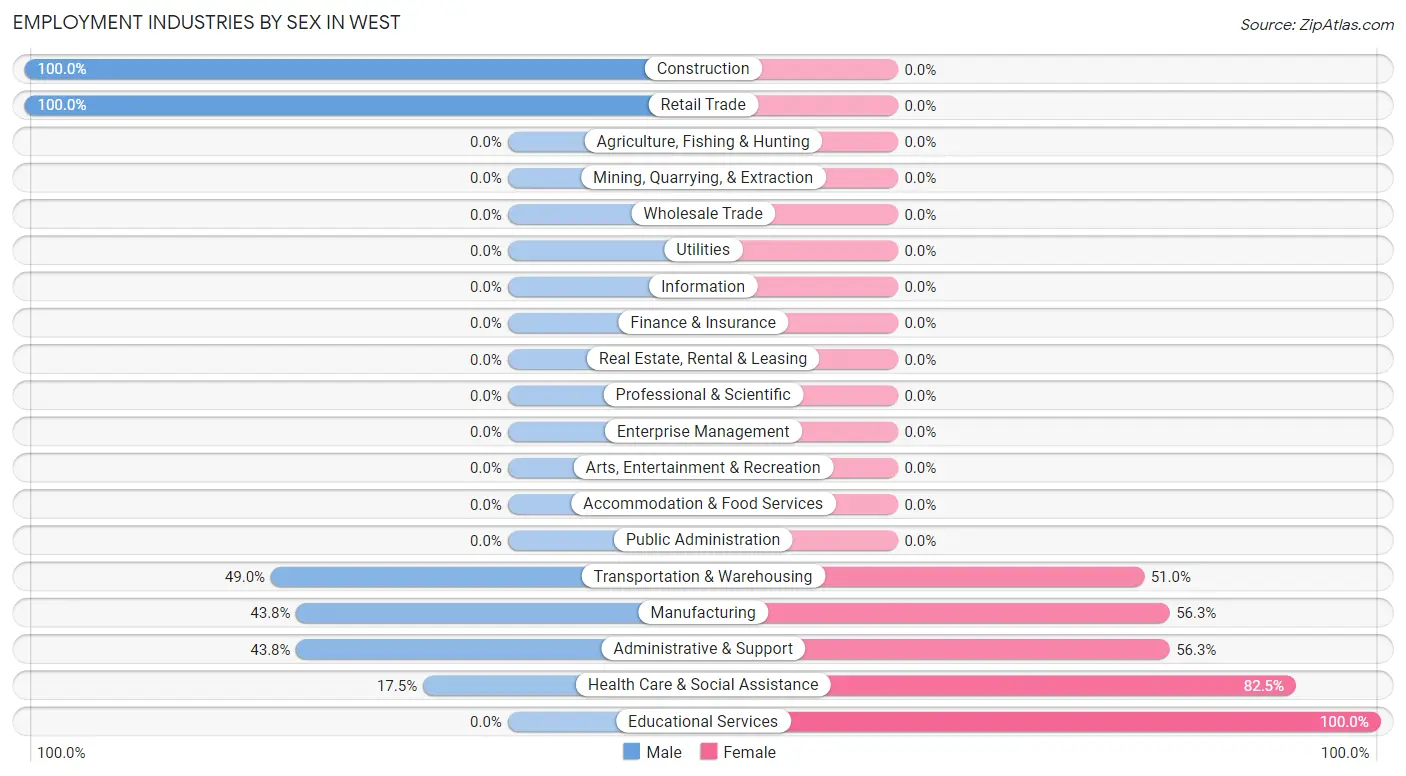
Employment Industries by Sex in West
The West industries that see more men than women are Construction (100.0%), Retail Trade (100.0%), and Transportation & Warehousing (49.0%), whereas the industries that tend to have a higher number of women are Educational Services (100.0%), Health Care & Social Assistance (82.5%), and Manufacturing (56.2%).
| Industry | Male | Female |
| Agriculture, Fishing & Hunting | 0 (0.0%) | 0 (0.0%) |
| Mining, Quarrying, & Extraction | 0 (0.0%) | 0 (0.0%) |
| Construction | 11 (100.0%) | 0 (0.0%) |
| Manufacturing | 7 (43.8%) | 9 (56.2%) |
| Wholesale Trade | 0 (0.0%) | 0 (0.0%) |
| Retail Trade | 1 (100.0%) | 0 (0.0%) |
| Transportation & Warehousing | 25 (49.0%) | 26 (51.0%) |
| Utilities | 0 (0.0%) | 0 (0.0%) |
| Information | 0 (0.0%) | 0 (0.0%) |
| Finance & Insurance | 0 (0.0%) | 0 (0.0%) |
| Real Estate, Rental & Leasing | 0 (0.0%) | 0 (0.0%) |
| Professional & Scientific | 0 (0.0%) | 0 (0.0%) |
| Enterprise Management | 0 (0.0%) | 0 (0.0%) |
| Administrative & Support | 7 (43.8%) | 9 (56.2%) |
| Educational Services | 0 (0.0%) | 4 (100.0%) |
| Health Care & Social Assistance | 10 (17.5%) | 47 (82.5%) |
| Arts, Entertainment & Recreation | 0 (0.0%) | 0 (0.0%) |
| Accommodation & Food Services | 0 (0.0%) | 0 (0.0%) |
| Public Administration | 0 (0.0%) | 0 (0.0%) |
| Total | 61 (39.1%) | 95 (60.9%) |
Education in West
School Enrollment in West
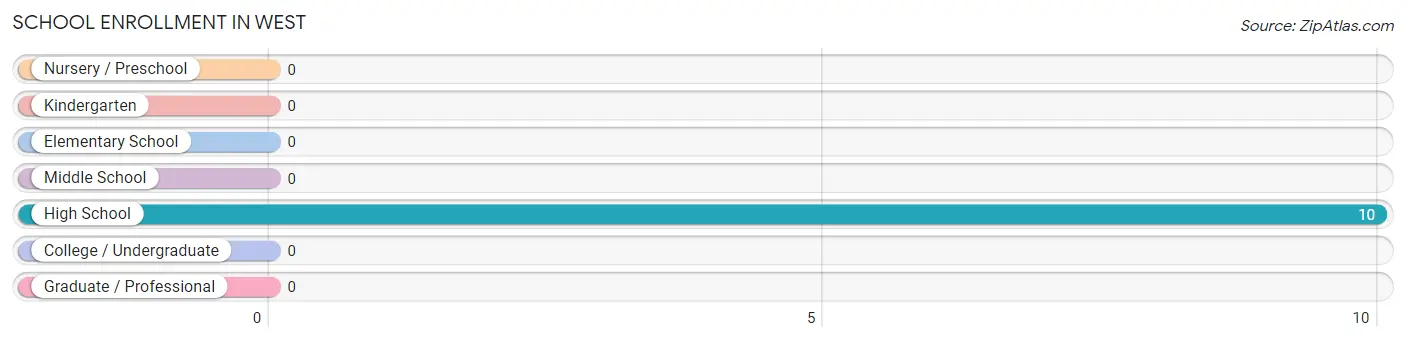
| School Level | # Students | % Students |
| Nursery / Preschool | 0 | 0.0% |
| Kindergarten | 0 | 0.0% |
| Elementary School | 0 | 0.0% |
| Middle School | 0 | 0.0% |
| High School | 10 | 100.0% |
| College / Undergraduate | 0 | 0.0% |
| Graduate / Professional | 0 | 0.0% |
| Total | 10 | 100.0% |
School Enrollment by Age by Funding Source in West
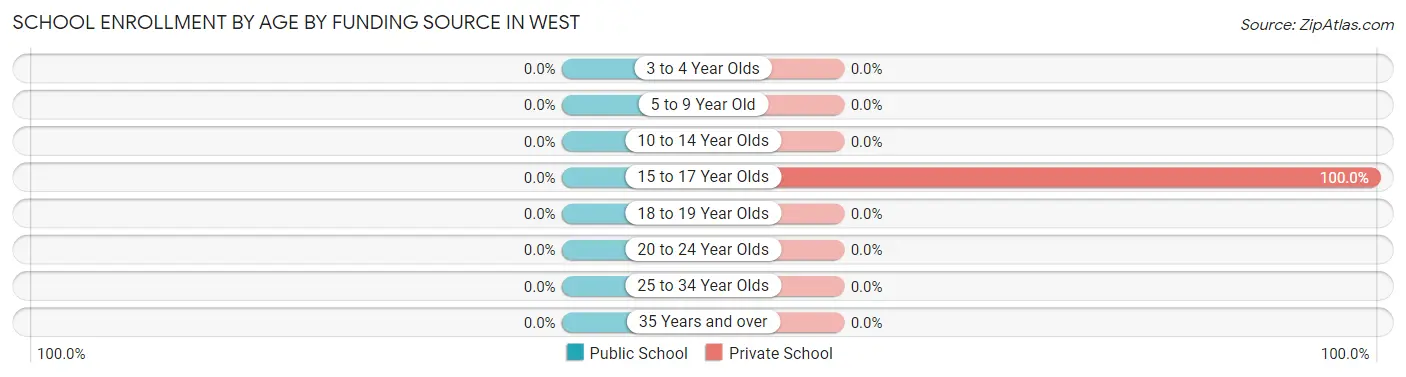
| Age Bracket | Public School | Private School |
| 3 to 4 Year Olds | 0 (0.0%) | 0 (0.0%) |
| 5 to 9 Year Old | 0 (0.0%) | 0 (0.0%) |
| 10 to 14 Year Olds | 0 (0.0%) | 0 (0.0%) |
| 15 to 17 Year Olds | 0 (0.0%) | 10 (100.0%) |
| 18 to 19 Year Olds | 0 (0.0%) | 0 (0.0%) |
| 20 to 24 Year Olds | 0 (0.0%) | 0 (0.0%) |
| 25 to 34 Year Olds | 0 (0.0%) | 0 (0.0%) |
| 35 Years and over | 0 (0.0%) | 0 (0.0%) |
| Total | 0 (0.0%) | 10 (100.0%) |
Educational Attainment by Field of Study in West
Science & technology (16 | 48.5%), social sciences (10 | 30.3%), bio, nature & agricultural (4 | 12.1%), business (2 | 6.1%), and education (1 | 3.0%) are the most common fields of study among 33 individuals in West who have obtained a bachelor's degree or higher.
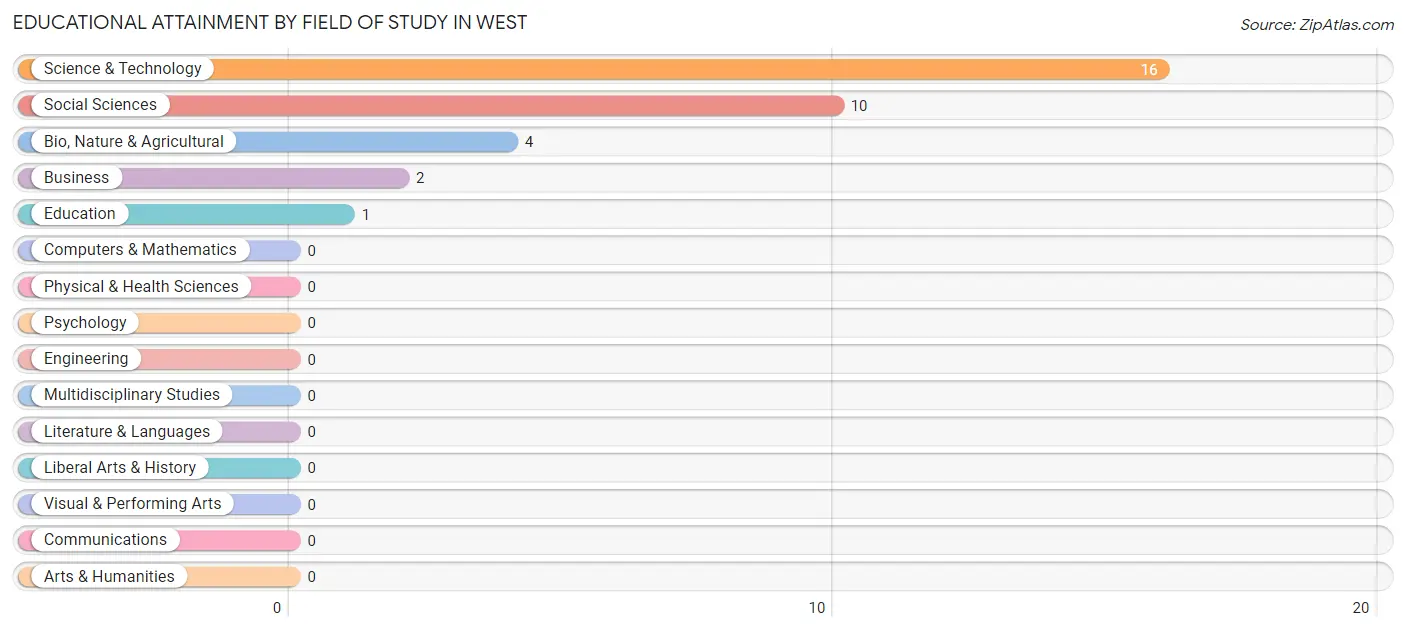
| Field of Study | # Graduates | % Graduates |
| Computers & Mathematics | 0 | 0.0% |
| Bio, Nature & Agricultural | 4 | 12.1% |
| Physical & Health Sciences | 0 | 0.0% |
| Psychology | 0 | 0.0% |
| Social Sciences | 10 | 30.3% |
| Engineering | 0 | 0.0% |
| Multidisciplinary Studies | 0 | 0.0% |
| Science & Technology | 16 | 48.5% |
| Business | 2 | 6.1% |
| Education | 1 | 3.0% |
| Literature & Languages | 0 | 0.0% |
| Liberal Arts & History | 0 | 0.0% |
| Visual & Performing Arts | 0 | 0.0% |
| Communications | 0 | 0.0% |
| Arts & Humanities | 0 | 0.0% |
| Total | 33 | 100.0% |
Transportation & Commute in West
Vehicle Availability by Sex in West
The most prevalent vehicle ownership categories in West are males with 3 vehicles (43, accounting for 70.5%) and females with 3 vehicles (7, making up 50.0%).
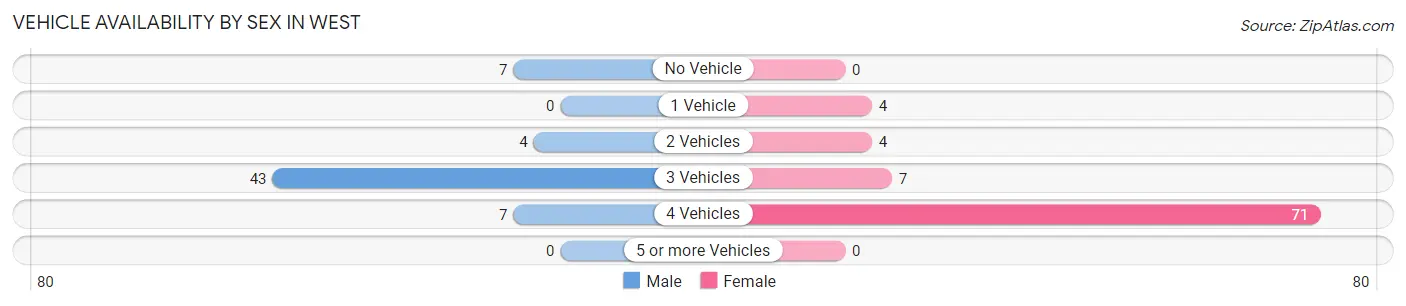
| Vehicles Available | Male | Female |
| No Vehicle | 7 (11.5%) | 0 (0.0%) |
| 1 Vehicle | 0 (0.0%) | 4 (4.6%) |
| 2 Vehicles | 4 (6.6%) | 4 (4.6%) |
| 3 Vehicles | 43 (70.5%) | 7 (8.1%) |
| 4 Vehicles | 7 (11.5%) | 71 (82.6%) |
| 5 or more Vehicles | 0 (0.0%) | 0 (0.0%) |
| Total | 61 (100.0%) | 86 (100.0%) |
Commute Time in West
The most frequently occuring commute durations in West are 30 to 34 minutes (104 commuters, 70.8%), 90 or more minutes (14 commuters, 9.5%), and 45 to 59 minutes (9 commuters, 6.1%).
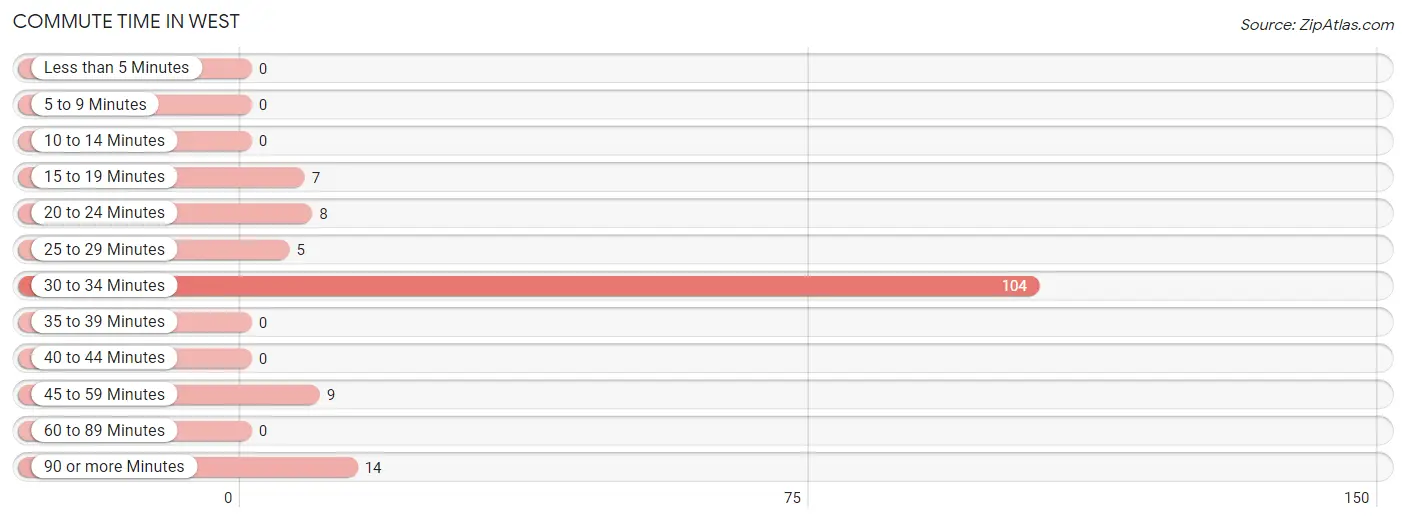
| Commute Time | # Commuters | % Commuters |
| Less than 5 Minutes | 0 | 0.0% |
| 5 to 9 Minutes | 0 | 0.0% |
| 10 to 14 Minutes | 0 | 0.0% |
| 15 to 19 Minutes | 7 | 4.8% |
| 20 to 24 Minutes | 8 | 5.4% |
| 25 to 29 Minutes | 5 | 3.4% |
| 30 to 34 Minutes | 104 | 70.8% |
| 35 to 39 Minutes | 0 | 0.0% |
| 40 to 44 Minutes | 0 | 0.0% |
| 45 to 59 Minutes | 9 | 6.1% |
| 60 to 89 Minutes | 0 | 0.0% |
| 90 or more Minutes | 14 | 9.5% |
Commute Time by Sex in West
The most common commute times in West are 30 to 34 minutes (33 commuters, 54.1%) for males and 30 to 34 minutes (71 commuters, 82.6%) for females.
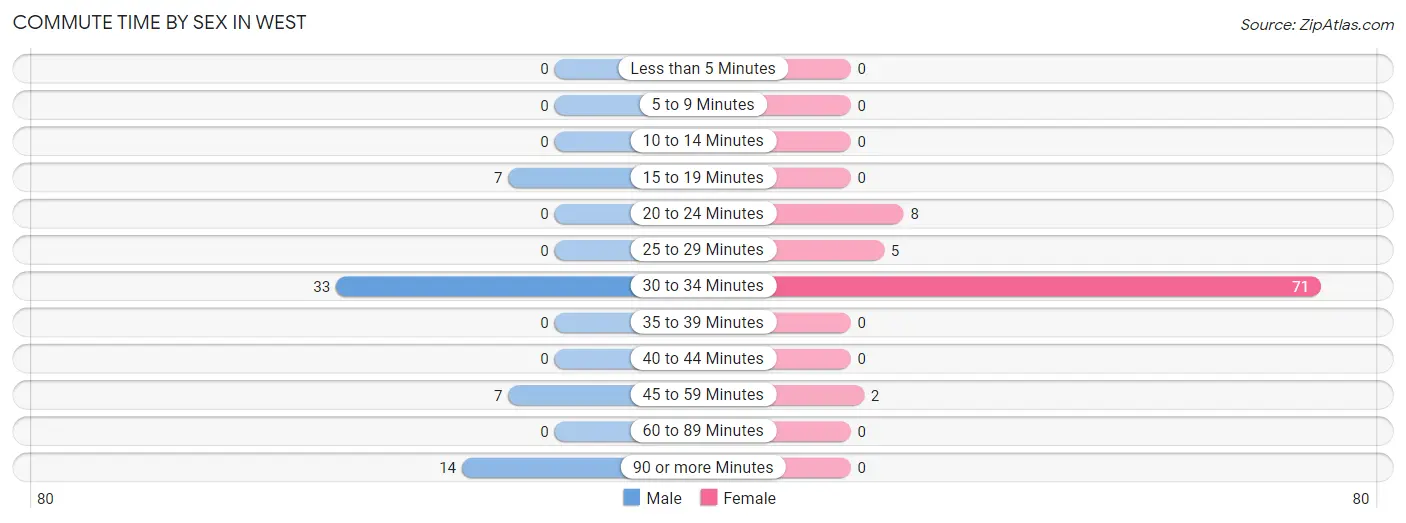
| Commute Time | Male | Female |
| Less than 5 Minutes | 0 (0.0%) | 0 (0.0%) |
| 5 to 9 Minutes | 0 (0.0%) | 0 (0.0%) |
| 10 to 14 Minutes | 0 (0.0%) | 0 (0.0%) |
| 15 to 19 Minutes | 7 (11.5%) | 0 (0.0%) |
| 20 to 24 Minutes | 0 (0.0%) | 8 (9.3%) |
| 25 to 29 Minutes | 0 (0.0%) | 5 (5.8%) |
| 30 to 34 Minutes | 33 (54.1%) | 71 (82.6%) |
| 35 to 39 Minutes | 0 (0.0%) | 0 (0.0%) |
| 40 to 44 Minutes | 0 (0.0%) | 0 (0.0%) |
| 45 to 59 Minutes | 7 (11.5%) | 2 (2.3%) |
| 60 to 89 Minutes | 0 (0.0%) | 0 (0.0%) |
| 90 or more Minutes | 14 (23.0%) | 0 (0.0%) |
Time of Departure to Work by Sex in West
The most frequent times of departure to work in West are 6:30 AM to 6:59 AM (28, 45.9%) for males and 12:00 PM to 3:59 PM (45, 52.3%) for females.
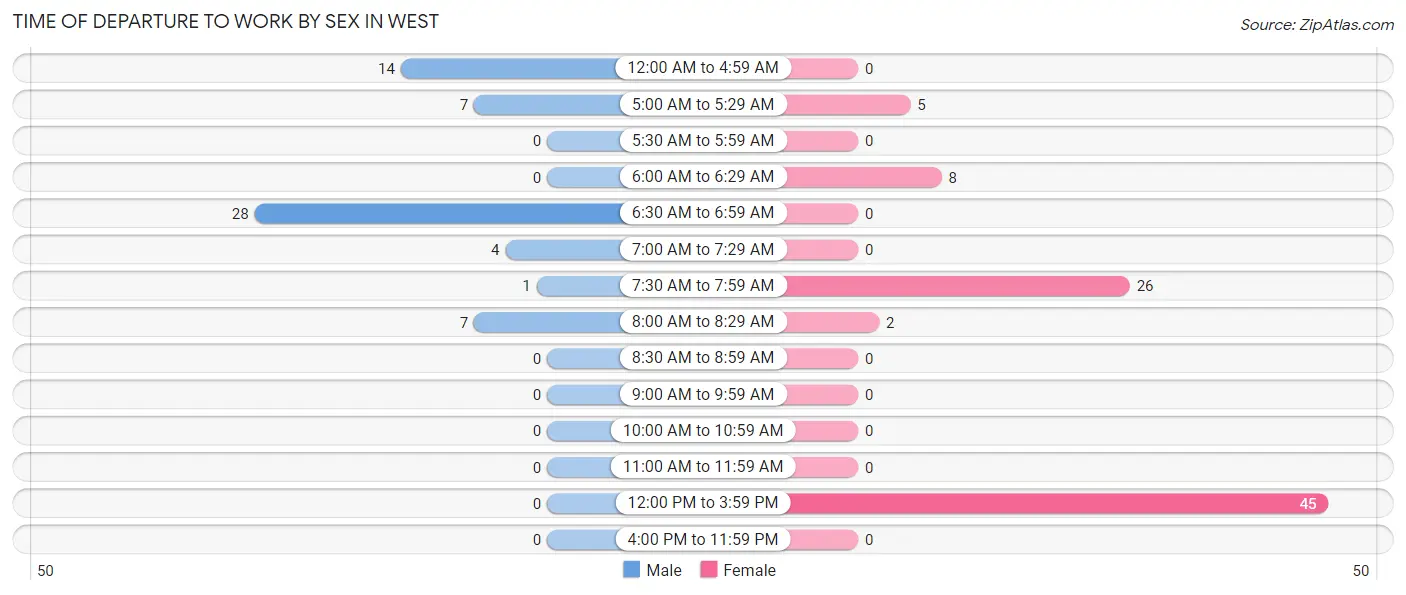
| Time of Departure | Male | Female |
| 12:00 AM to 4:59 AM | 14 (23.0%) | 0 (0.0%) |
| 5:00 AM to 5:29 AM | 7 (11.5%) | 5 (5.8%) |
| 5:30 AM to 5:59 AM | 0 (0.0%) | 0 (0.0%) |
| 6:00 AM to 6:29 AM | 0 (0.0%) | 8 (9.3%) |
| 6:30 AM to 6:59 AM | 28 (45.9%) | 0 (0.0%) |
| 7:00 AM to 7:29 AM | 4 (6.6%) | 0 (0.0%) |
| 7:30 AM to 7:59 AM | 1 (1.6%) | 26 (30.2%) |
| 8:00 AM to 8:29 AM | 7 (11.5%) | 2 (2.3%) |
| 8:30 AM to 8:59 AM | 0 (0.0%) | 0 (0.0%) |
| 9:00 AM to 9:59 AM | 0 (0.0%) | 0 (0.0%) |
| 10:00 AM to 10:59 AM | 0 (0.0%) | 0 (0.0%) |
| 11:00 AM to 11:59 AM | 0 (0.0%) | 0 (0.0%) |
| 12:00 PM to 3:59 PM | 0 (0.0%) | 45 (52.3%) |
| 4:00 PM to 11:59 PM | 0 (0.0%) | 0 (0.0%) |
| Total | 61 (100.0%) | 86 (100.0%) |
Housing Occupancy in West
Occupancy by Ownership in West
Of the total 47 dwellings in West, owner-occupied units account for 35 (74.5%), while renter-occupied units make up 12 (25.5%).
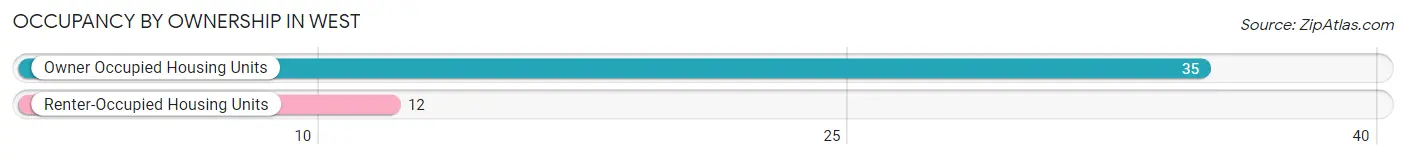
| Occupancy | # Housing Units | % Housing Units |
| Owner Occupied Housing Units | 35 | 74.5% |
| Renter-Occupied Housing Units | 12 | 25.5% |
| Total Occupied Housing Units | 47 | 100.0% |
Occupancy by Household Size in West
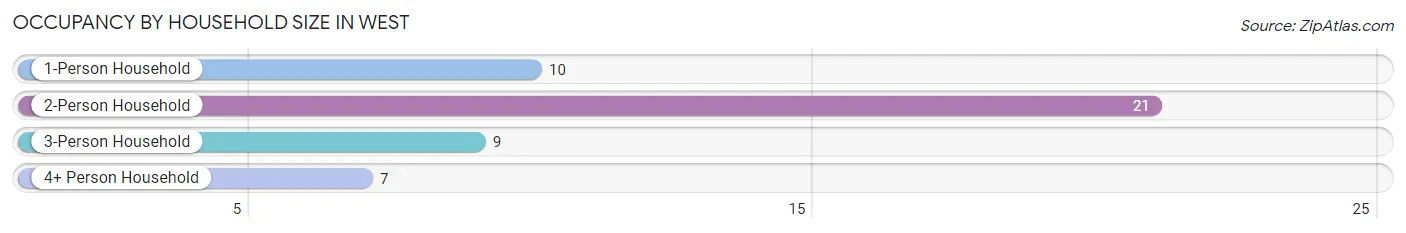
| Household Size | # Housing Units | % Housing Units |
| 1-Person Household | 10 | 21.3% |
| 2-Person Household | 21 | 44.7% |
| 3-Person Household | 9 | 19.2% |
| 4+ Person Household | 7 | 14.9% |
| Total Housing Units | 47 | 100.0% |
Occupancy by Ownership by Household Size in West
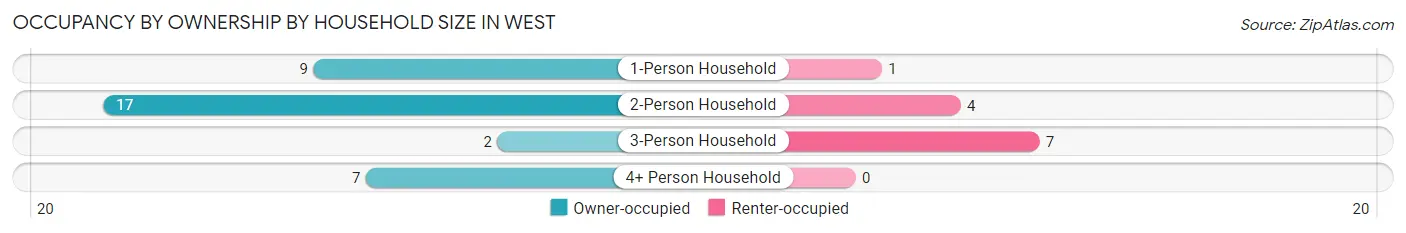
| Household Size | Owner-occupied | Renter-occupied |
| 1-Person Household | 9 (90.0%) | 1 (10.0%) |
| 2-Person Household | 17 (80.9%) | 4 (19.1%) |
| 3-Person Household | 2 (22.2%) | 7 (77.8%) |
| 4+ Person Household | 7 (100.0%) | 0 (0.0%) |
| Total Housing Units | 35 (74.5%) | 12 (25.5%) |
Occupancy by Educational Attainment in West
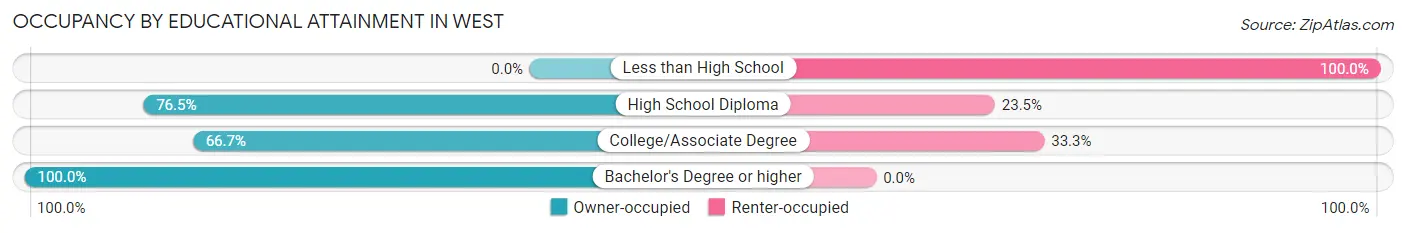
| Household Size | Owner-occupied | Renter-occupied |
| Less than High School | 0 (0.0%) | 1 (100.0%) |
| High School Diploma | 13 (76.5%) | 4 (23.5%) |
| College/Associate Degree | 14 (66.7%) | 7 (33.3%) |
| Bachelor's Degree or higher | 8 (100.0%) | 0 (0.0%) |
Occupancy by Age of Householder in West
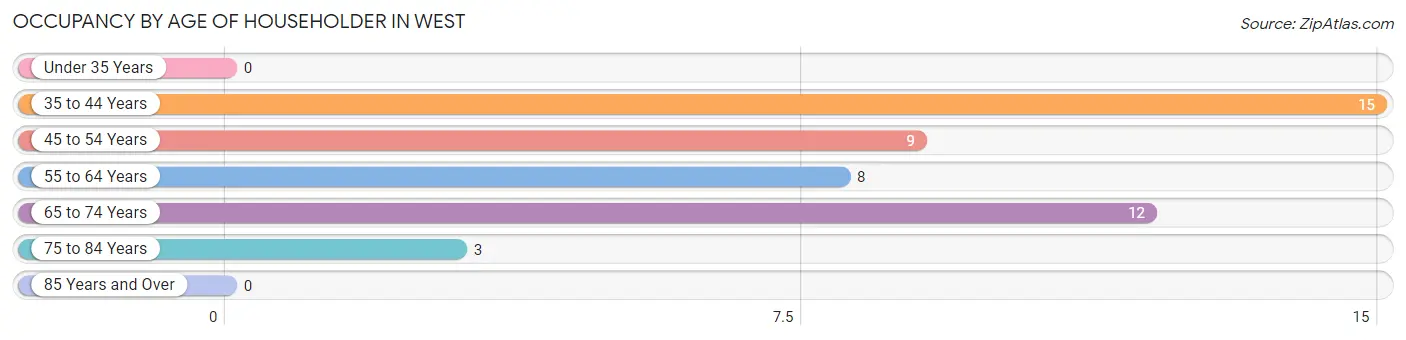
| Age Bracket | # Households | % Households |
| Under 35 Years | 0 | 0.0% |
| 35 to 44 Years | 15 | 31.9% |
| 45 to 54 Years | 9 | 19.2% |
| 55 to 64 Years | 8 | 17.0% |
| 65 to 74 Years | 12 | 25.5% |
| 75 to 84 Years | 3 | 6.4% |
| 85 Years and Over | 0 | 0.0% |
| Total | 47 | 100.0% |
Housing Finances in West
Median Income by Occupancy in West
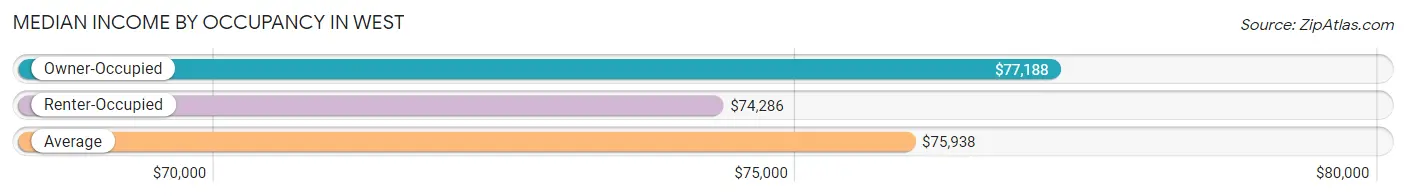
| Occupancy Type | # Households | Median Income |
| Owner-Occupied | 35 (74.5%) | $77,188 |
| Renter-Occupied | 12 (25.5%) | $74,286 |
| Average | 47 (100.0%) | $75,938 |
Occupancy by Householder Income Bracket in West
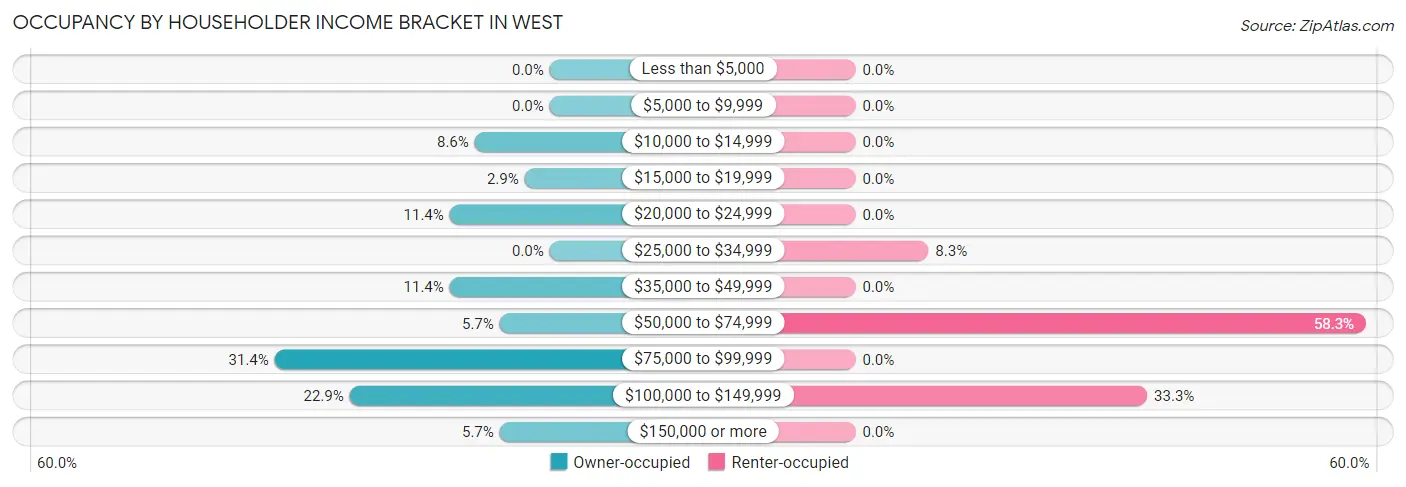
| Income Bracket | Owner-occupied | Renter-occupied |
| Less than $5,000 | 0 (0.0%) | 0 (0.0%) |
| $5,000 to $9,999 | 0 (0.0%) | 0 (0.0%) |
| $10,000 to $14,999 | 3 (8.6%) | 0 (0.0%) |
| $15,000 to $19,999 | 1 (2.9%) | 0 (0.0%) |
| $20,000 to $24,999 | 4 (11.4%) | 0 (0.0%) |
| $25,000 to $34,999 | 0 (0.0%) | 1 (8.3%) |
| $35,000 to $49,999 | 4 (11.4%) | 0 (0.0%) |
| $50,000 to $74,999 | 2 (5.7%) | 7 (58.3%) |
| $75,000 to $99,999 | 11 (31.4%) | 0 (0.0%) |
| $100,000 to $149,999 | 8 (22.9%) | 4 (33.3%) |
| $150,000 or more | 2 (5.7%) | 0 (0.0%) |
| Total | 35 (100.0%) | 12 (100.0%) |
Monthly Housing Cost Tiers in West
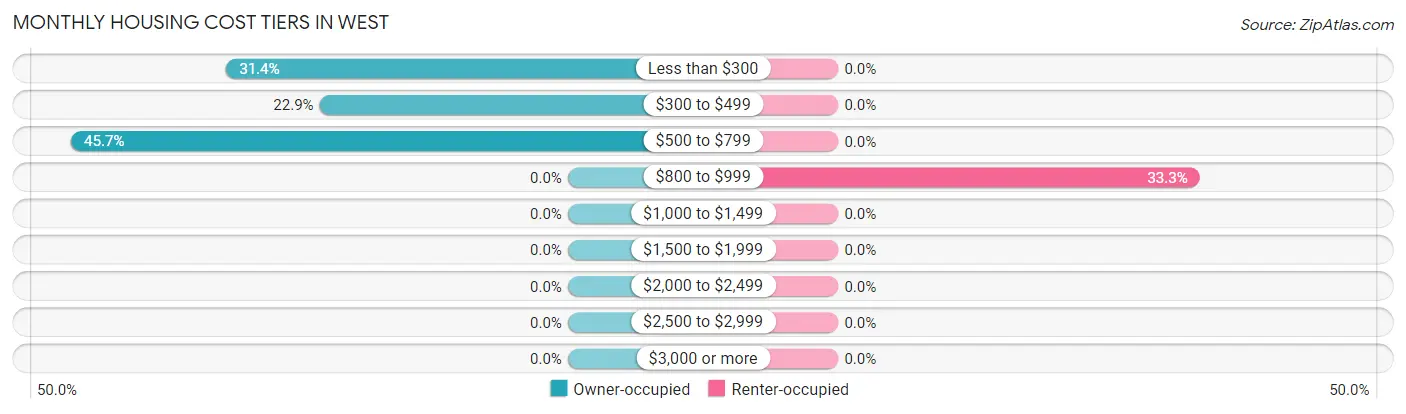
| Monthly Cost | Owner-occupied | Renter-occupied |
| Less than $300 | 11 (31.4%) | 0 (0.0%) |
| $300 to $499 | 8 (22.9%) | 0 (0.0%) |
| $500 to $799 | 16 (45.7%) | 0 (0.0%) |
| $800 to $999 | 0 (0.0%) | 4 (33.3%) |
| $1,000 to $1,499 | 0 (0.0%) | 0 (0.0%) |
| $1,500 to $1,999 | 0 (0.0%) | 0 (0.0%) |
| $2,000 to $2,499 | 0 (0.0%) | 0 (0.0%) |
| $2,500 to $2,999 | 0 (0.0%) | 0 (0.0%) |
| $3,000 or more | 0 (0.0%) | 0 (0.0%) |
| Total | 35 (100.0%) | 12 (100.0%) |
Physical Housing Characteristics in West
Housing Structures in West
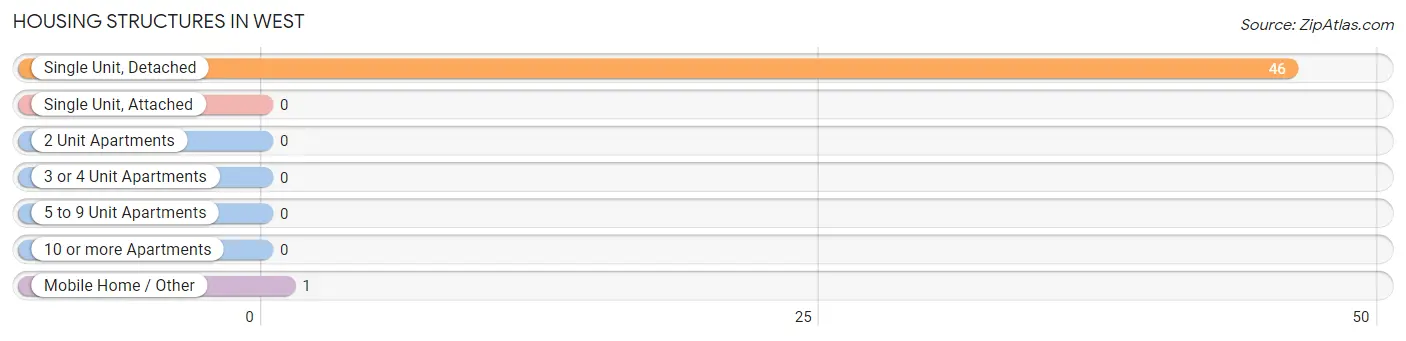
| Structure Type | # Housing Units | % Housing Units |
| Single Unit, Detached | 46 | 97.9% |
| Single Unit, Attached | 0 | 0.0% |
| 2 Unit Apartments | 0 | 0.0% |
| 3 or 4 Unit Apartments | 0 | 0.0% |
| 5 to 9 Unit Apartments | 0 | 0.0% |
| 10 or more Apartments | 0 | 0.0% |
| Mobile Home / Other | 1 | 2.1% |
| Total | 47 | 100.0% |
Housing Structures by Occupancy in West
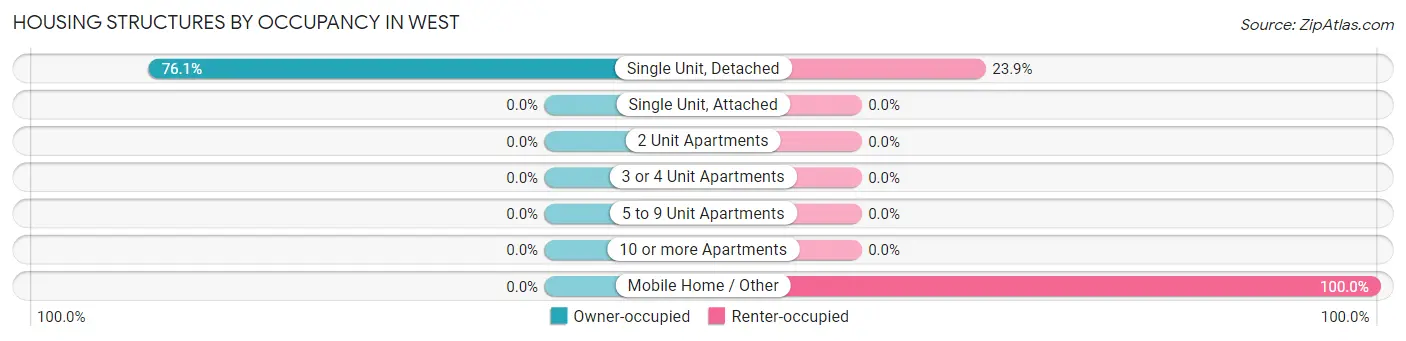
| Structure Type | Owner-occupied | Renter-occupied |
| Single Unit, Detached | 35 (76.1%) | 11 (23.9%) |
| Single Unit, Attached | 0 (0.0%) | 0 (0.0%) |
| 2 Unit Apartments | 0 (0.0%) | 0 (0.0%) |
| 3 or 4 Unit Apartments | 0 (0.0%) | 0 (0.0%) |
| 5 to 9 Unit Apartments | 0 (0.0%) | 0 (0.0%) |
| 10 or more Apartments | 0 (0.0%) | 0 (0.0%) |
| Mobile Home / Other | 0 (0.0%) | 1 (100.0%) |
| Total | 35 (74.5%) | 12 (25.5%) |
Housing Structures by Number of Rooms in West
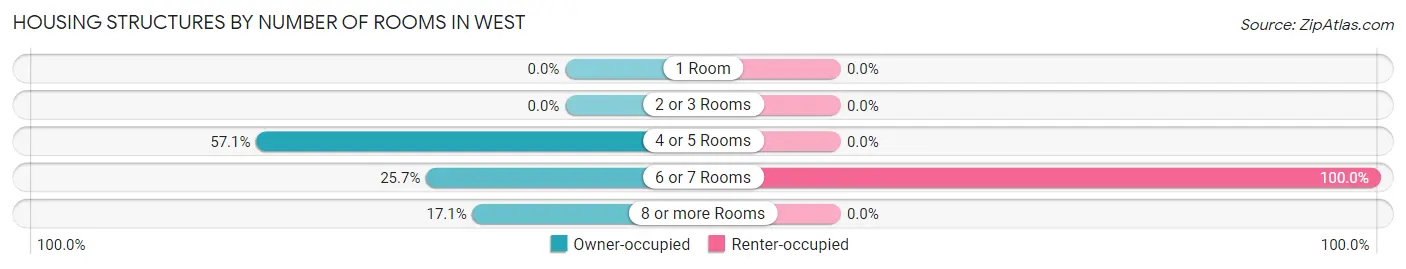
| Number of Rooms | Owner-occupied | Renter-occupied |
| 1 Room | 0 (0.0%) | 0 (0.0%) |
| 2 or 3 Rooms | 0 (0.0%) | 0 (0.0%) |
| 4 or 5 Rooms | 20 (57.1%) | 0 (0.0%) |
| 6 or 7 Rooms | 9 (25.7%) | 12 (100.0%) |
| 8 or more Rooms | 6 (17.1%) | 0 (0.0%) |
| Total | 35 (100.0%) | 12 (100.0%) |
Housing Structure by Heating Type in West
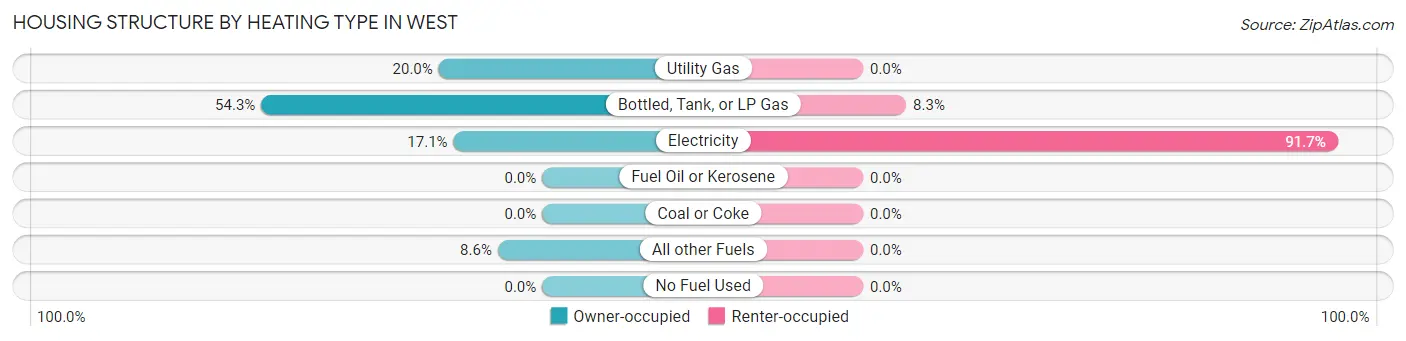
| Heating Type | Owner-occupied | Renter-occupied |
| Utility Gas | 7 (20.0%) | 0 (0.0%) |
| Bottled, Tank, or LP Gas | 19 (54.3%) | 1 (8.3%) |
| Electricity | 6 (17.1%) | 11 (91.7%) |
| Fuel Oil or Kerosene | 0 (0.0%) | 0 (0.0%) |
| Coal or Coke | 0 (0.0%) | 0 (0.0%) |
| All other Fuels | 3 (8.6%) | 0 (0.0%) |
| No Fuel Used | 0 (0.0%) | 0 (0.0%) |
| Total | 35 (100.0%) | 12 (100.0%) |
Household Vehicle Usage in West
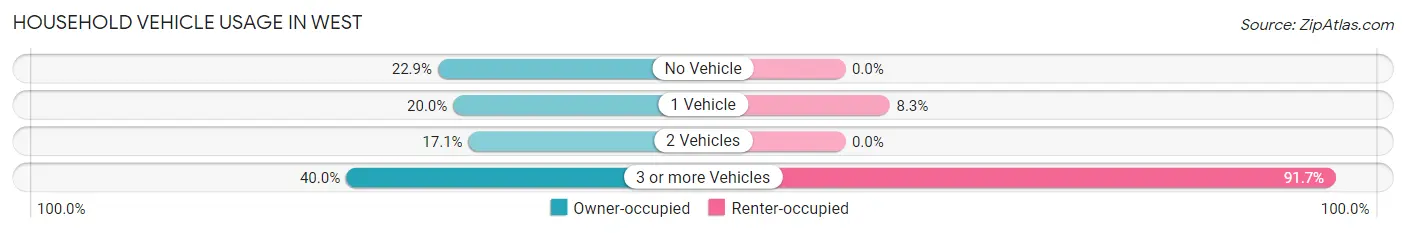
| Vehicles per Household | Owner-occupied | Renter-occupied |
| No Vehicle | 8 (22.9%) | 0 (0.0%) |
| 1 Vehicle | 7 (20.0%) | 1 (8.3%) |
| 2 Vehicles | 6 (17.1%) | 0 (0.0%) |
| 3 or more Vehicles | 14 (40.0%) | 11 (91.7%) |
| Total | 35 (100.0%) | 12 (100.0%) |
Real Estate & Mortgages in West
Real Estate and Mortgage Overview in West
| Characteristic | Without Mortgage | With Mortgage |
| Housing Units | 35 | 0 |
| Median Property Value | $81,400 | $0 |
| Median Household Income | $77,188 | $0 |
| Monthly Housing Costs | $425 | $0 |
| Real Estate Taxes | $429 | $0 |
Property Value by Mortgage Status in West
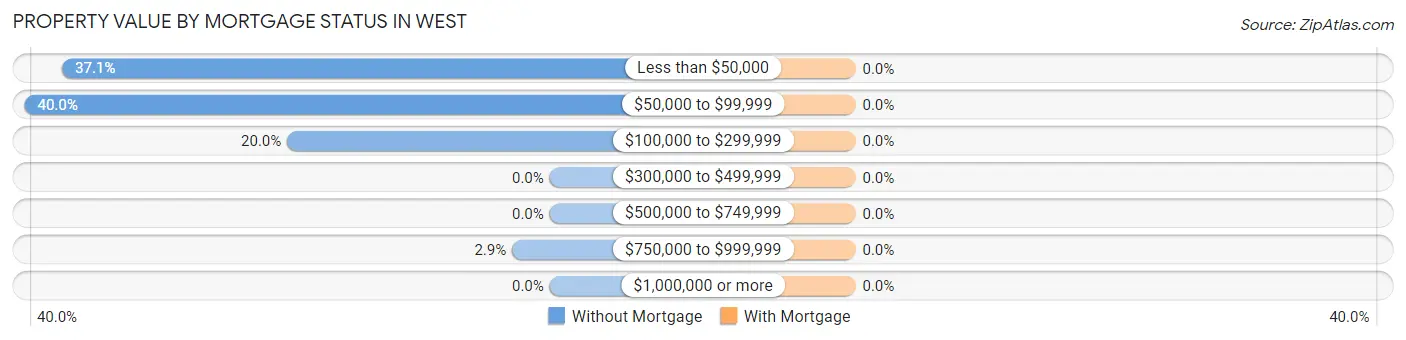
| Property Value | Without Mortgage | With Mortgage |
| Less than $50,000 | 13 (37.1%) | 0 (0.0%) |
| $50,000 to $99,999 | 14 (40.0%) | 0 (0.0%) |
| $100,000 to $299,999 | 7 (20.0%) | 0 (0.0%) |
| $300,000 to $499,999 | 0 (0.0%) | 0 (0.0%) |
| $500,000 to $749,999 | 0 (0.0%) | 0 (0.0%) |
| $750,000 to $999,999 | 1 (2.9%) | 0 (0.0%) |
| $1,000,000 or more | 0 (0.0%) | 0 (0.0%) |
| Total | 35 (100.0%) | 0 (0.0%) |
Household Income by Mortgage Status in West
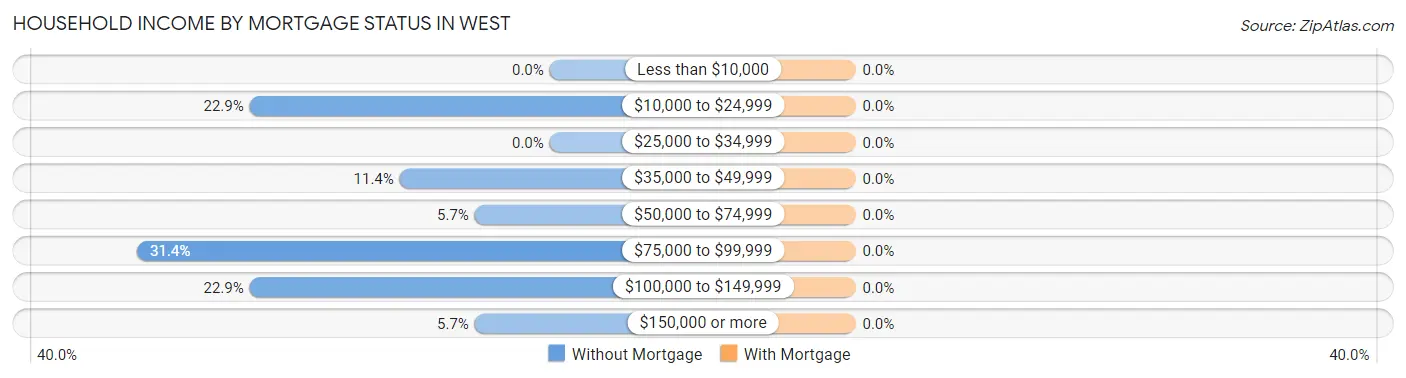
| Household Income | Without Mortgage | With Mortgage |
| Less than $10,000 | 0 (0.0%) | 0 (0.0%) |
| $10,000 to $24,999 | 8 (22.9%) | 0 (0.0%) |
| $25,000 to $34,999 | 0 (0.0%) | 0 (0.0%) |
| $35,000 to $49,999 | 4 (11.4%) | 0 (0.0%) |
| $50,000 to $74,999 | 2 (5.7%) | 0 (0.0%) |
| $75,000 to $99,999 | 11 (31.4%) | 0 (0.0%) |
| $100,000 to $149,999 | 8 (22.9%) | 0 (0.0%) |
| $150,000 or more | 2 (5.7%) | 0 (0.0%) |
| Total | 35 (100.0%) | 0 (0.0%) |
Property Value to Household Income Ratio in West
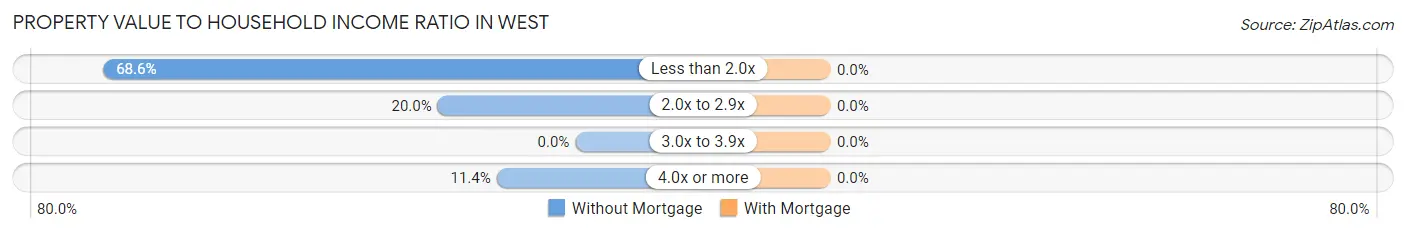
| Value-to-Income Ratio | Without Mortgage | With Mortgage |
| Less than 2.0x | 24 (68.6%) | 0 (0.0%) |
| 2.0x to 2.9x | 7 (20.0%) | 0 (0.0%) |
| 3.0x to 3.9x | 0 (0.0%) | 0 (0.0%) |
| 4.0x or more | 4 (11.4%) | 0 (0.0%) |
| Total | 35 (100.0%) | 0 (0.0%) |
Real Estate Taxes by Mortgage Status in West
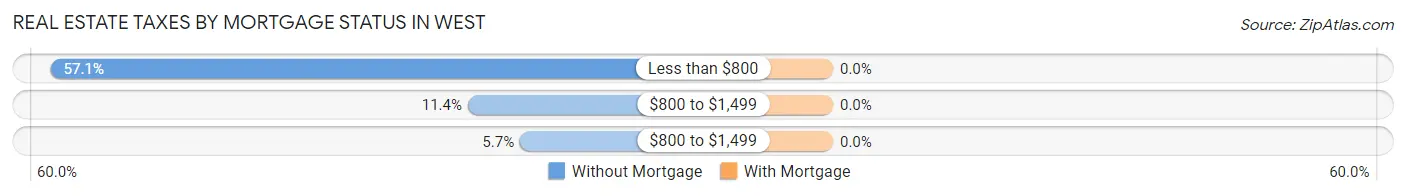
| Property Taxes | Without Mortgage | With Mortgage |
| Less than $800 | 20 (57.1%) | 0 (0.0%) |
| $800 to $1,499 | 4 (11.4%) | 0 (0.0%) |
| $800 to $1,499 | 2 (5.7%) | 0 (0.0%) |
| Total | 35 (100.0%) | 0 (0.0%) |
Health & Disability in West
Health Insurance Coverage by Age in West
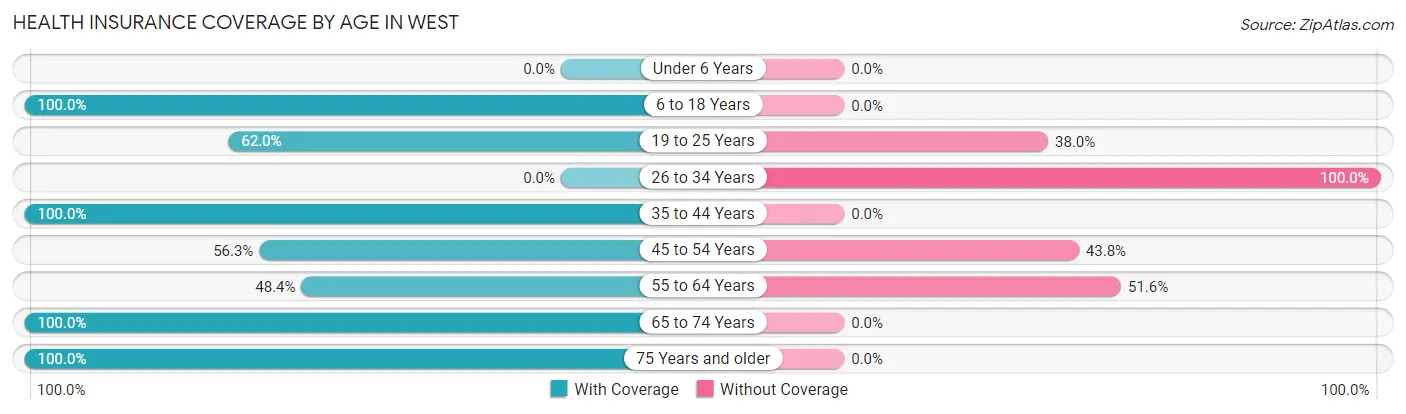
| Age Bracket | With Coverage | Without Coverage |
| Under 6 Years | 0 (0.0%) | 0 (0.0%) |
| 6 to 18 Years | 10 (100.0%) | 0 (0.0%) |
| 19 to 25 Years | 31 (62.0%) | 19 (38.0%) |
| 26 to 34 Years | 0 (0.0%) | 57 (100.0%) |
| 35 to 44 Years | 19 (100.0%) | 0 (0.0%) |
| 45 to 54 Years | 9 (56.2%) | 7 (43.8%) |
| 55 to 64 Years | 15 (48.4%) | 16 (51.6%) |
| 65 to 74 Years | 14 (100.0%) | 0 (0.0%) |
| 75 Years and older | 3 (100.0%) | 0 (0.0%) |
| Total | 101 (50.5%) | 99 (49.5%) |
Health Insurance Coverage by Citizenship Status in West
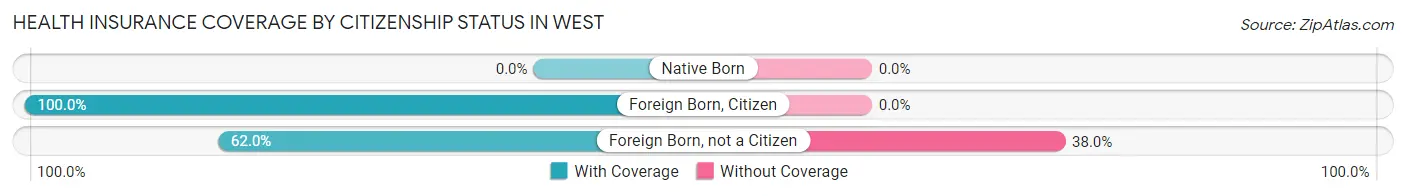
| Citizenship Status | With Coverage | Without Coverage |
| Native Born | 0 (0.0%) | 0 (0.0%) |
| Foreign Born, Citizen | 10 (100.0%) | 0 (0.0%) |
| Foreign Born, not a Citizen | 31 (62.0%) | 19 (38.0%) |
Health Insurance Coverage by Household Income in West
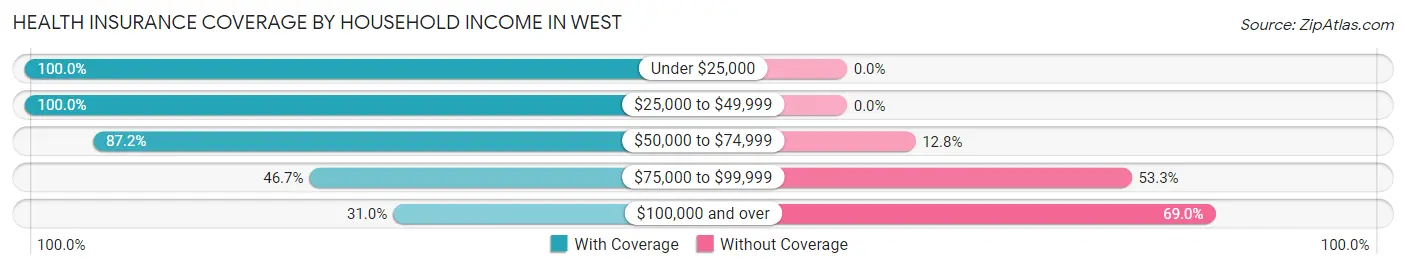
| Household Income | With Coverage | Without Coverage |
| Under $25,000 | 8 (100.0%) | 0 (0.0%) |
| $25,000 to $49,999 | 10 (100.0%) | 0 (0.0%) |
| $50,000 to $74,999 | 34 (87.2%) | 5 (12.8%) |
| $75,000 to $99,999 | 14 (46.7%) | 16 (53.3%) |
| $100,000 and over | 35 (31.0%) | 78 (69.0%) |
Public vs Private Health Insurance Coverage by Age in West
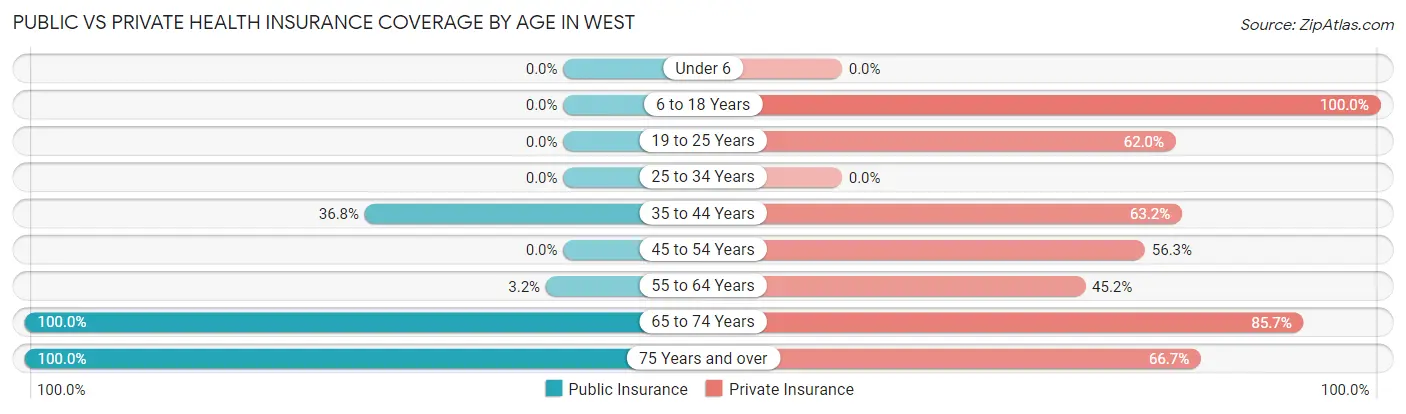
| Age Bracket | Public Insurance | Private Insurance |
| Under 6 | 0 (0.0%) | 0 (0.0%) |
| 6 to 18 Years | 0 (0.0%) | 10 (100.0%) |
| 19 to 25 Years | 0 (0.0%) | 31 (62.0%) |
| 25 to 34 Years | 0 (0.0%) | 0 (0.0%) |
| 35 to 44 Years | 7 (36.8%) | 12 (63.2%) |
| 45 to 54 Years | 0 (0.0%) | 9 (56.2%) |
| 55 to 64 Years | 1 (3.2%) | 14 (45.2%) |
| 65 to 74 Years | 14 (100.0%) | 12 (85.7%) |
| 75 Years and over | 3 (100.0%) | 2 (66.7%) |
| Total | 25 (12.5%) | 90 (45.0%) |
Disability Status by Sex by Age in West
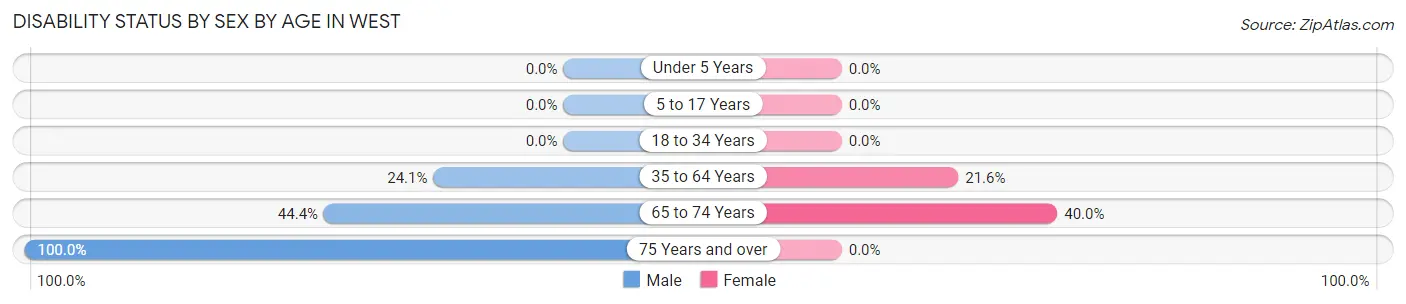
| Age Bracket | Male | Female |
| Under 5 Years | 0 (0.0%) | 0 (0.0%) |
| 5 to 17 Years | 0 (0.0%) | 0 (0.0%) |
| 18 to 34 Years | 0 (0.0%) | 0 (0.0%) |
| 35 to 64 Years | 7 (24.1%) | 8 (21.6%) |
| 65 to 74 Years | 4 (44.4%) | 2 (40.0%) |
| 75 Years and over | 1 (100.0%) | 0 (0.0%) |
Disability Class by Sex by Age in West
Disability Class: Hearing Difficulty
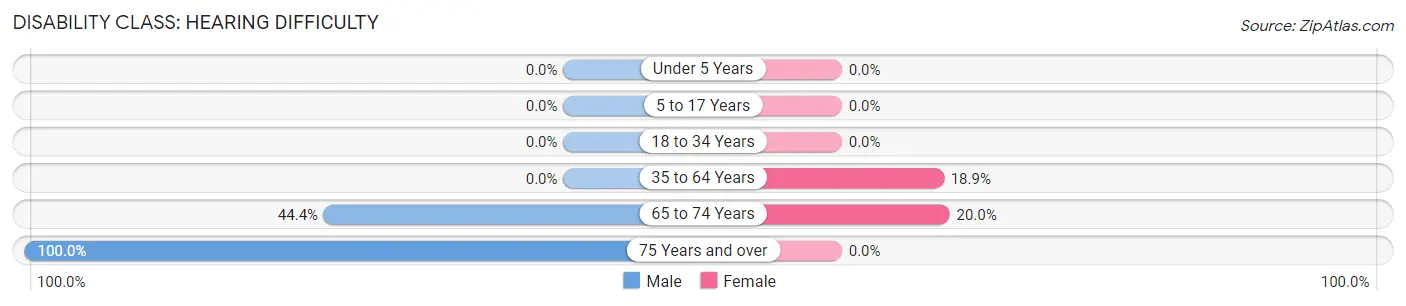
| Age Bracket | Male | Female |
| Under 5 Years | 0 (0.0%) | 0 (0.0%) |
| 5 to 17 Years | 0 (0.0%) | 0 (0.0%) |
| 18 to 34 Years | 0 (0.0%) | 0 (0.0%) |
| 35 to 64 Years | 0 (0.0%) | 7 (18.9%) |
| 65 to 74 Years | 4 (44.4%) | 1 (20.0%) |
| 75 Years and over | 1 (100.0%) | 0 (0.0%) |
Disability Class: Vision Difficulty
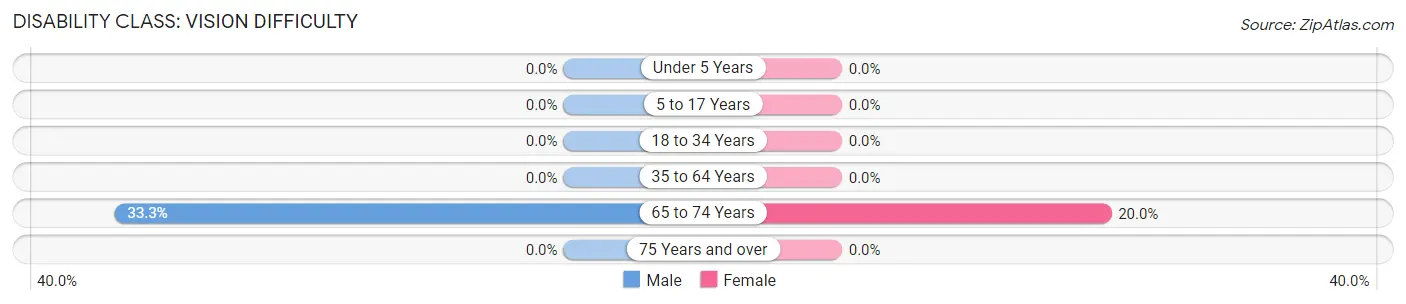
| Age Bracket | Male | Female |
| Under 5 Years | 0 (0.0%) | 0 (0.0%) |
| 5 to 17 Years | 0 (0.0%) | 0 (0.0%) |
| 18 to 34 Years | 0 (0.0%) | 0 (0.0%) |
| 35 to 64 Years | 0 (0.0%) | 0 (0.0%) |
| 65 to 74 Years | 3 (33.3%) | 1 (20.0%) |
| 75 Years and over | 0 (0.0%) | 0 (0.0%) |
Disability Class: Cognitive Difficulty
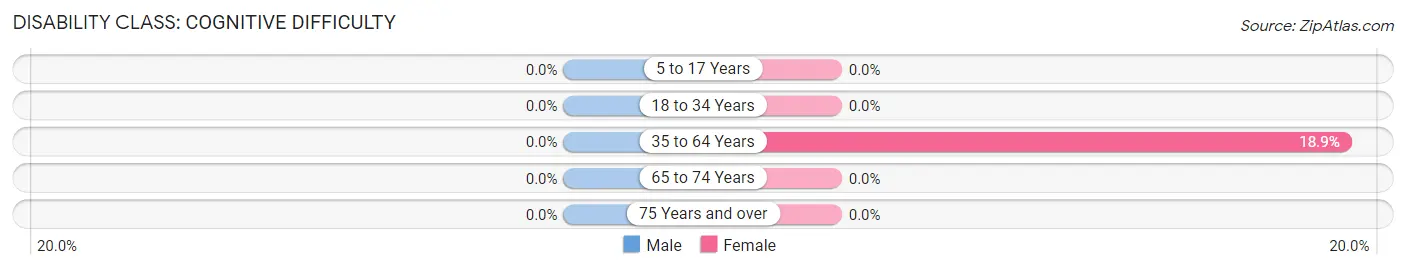
| Age Bracket | Male | Female |
| 5 to 17 Years | 0 (0.0%) | 0 (0.0%) |
| 18 to 34 Years | 0 (0.0%) | 0 (0.0%) |
| 35 to 64 Years | 0 (0.0%) | 7 (18.9%) |
| 65 to 74 Years | 0 (0.0%) | 0 (0.0%) |
| 75 Years and over | 0 (0.0%) | 0 (0.0%) |
Disability Class: Ambulatory Difficulty
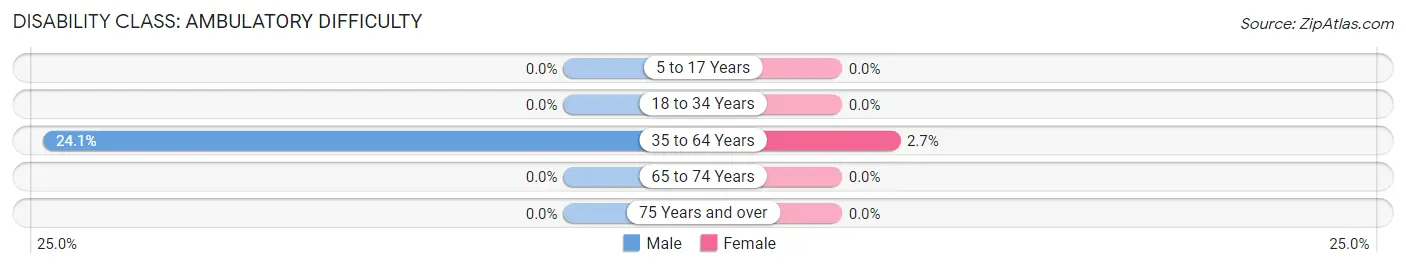
| Age Bracket | Male | Female |
| 5 to 17 Years | 0 (0.0%) | 0 (0.0%) |
| 18 to 34 Years | 0 (0.0%) | 0 (0.0%) |
| 35 to 64 Years | 7 (24.1%) | 1 (2.7%) |
| 65 to 74 Years | 0 (0.0%) | 0 (0.0%) |
| 75 Years and over | 0 (0.0%) | 0 (0.0%) |
Disability Class: Self-Care Difficulty
| Age Bracket | Male | Female |
| 5 to 17 Years | 0 (0.0%) | 0 (0.0%) |
| 18 to 34 Years | 0 (0.0%) | 0 (0.0%) |
| 35 to 64 Years | 0 (0.0%) | 0 (0.0%) |
| 65 to 74 Years | 0 (0.0%) | 0 (0.0%) |
| 75 Years and over | 0 (0.0%) | 0 (0.0%) |
Technology Access in West
Computing Device Access in West
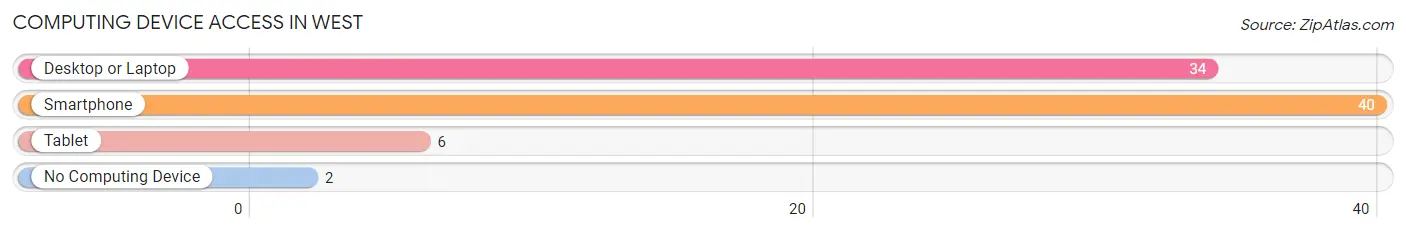
| Device Type | # Households | % Households |
| Desktop or Laptop | 34 | 72.3% |
| Smartphone | 40 | 85.1% |
| Tablet | 6 | 12.8% |
| No Computing Device | 2 | 4.3% |
| Total | 47 | 100.0% |
Internet Access in West
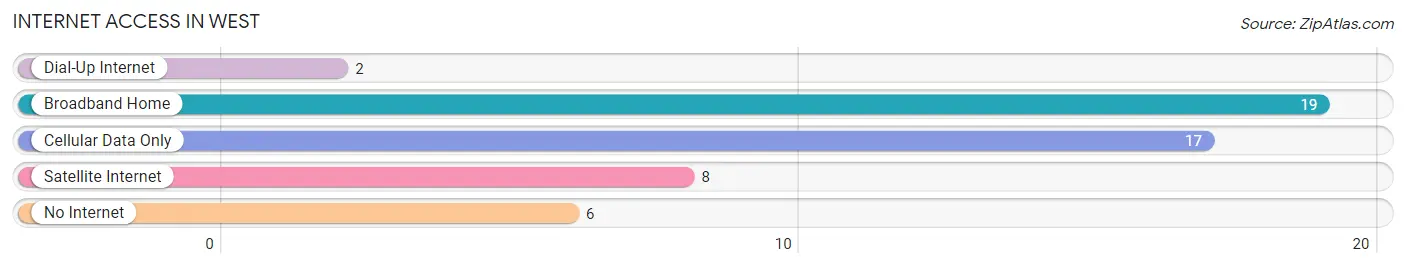
| Internet Type | # Households | % Households |
| Dial-Up Internet | 2 | 4.3% |
| Broadband Home | 19 | 40.4% |
| Cellular Data Only | 17 | 36.2% |
| Satellite Internet | 8 | 17.0% |
| No Internet | 6 | 12.8% |
| Total | 47 | 100.0% |
West Summary
West, Mississippi is a small town located in the western part of the state, near the Mississippi River. It is part of the Delta region, and is known for its rich history, diverse geography, and unique economy.
History
West, Mississippi was founded in 1837 by a group of settlers from the nearby town of Vicksburg. The town was named after the nearby West Point Plantation, which was owned by the prominent West family. The town quickly grew, and by the time of the Civil War, it had become a major trading center for the region. During the war, West was the site of several battles, including the Battle of West Point, which was fought in 1863. After the war, the town continued to grow, and by the early 1900s, it had become a major agricultural center.
Geography
West, Mississippi is located in the western part of the state, near the Mississippi River. The town is situated on a flat plain, with the nearby Yazoo River providing a natural border to the east. The town is surrounded by a number of small towns and villages, including Vicksburg, which is located just to the north. The town is also located near the Natchez Trace Parkway, which is a scenic route that runs through the region.
Economy
West, Mississippi has a diverse economy, with a number of different industries providing employment opportunities for the town's residents. The town is home to a number of manufacturing companies, including a furniture factory and a paper mill. The town is also home to a number of agricultural businesses, including cotton and soybean farms. In addition, the town is home to a number of retail stores, restaurants, and other businesses.
Demographics
As of the 2010 census, West, Mississippi had a population of 1,845. The town is predominantly white, with African Americans making up the majority of the population. The median household income in the town is $31,250, and the median age is 37. The town has a high rate of poverty, with nearly one-third of the population living below the poverty line.
West, Mississippi is a small town with a rich history and a diverse economy. The town is home to a number of different industries, and its population is diverse, with a mix of white and African American residents. The town has a high rate of poverty, but it is also home to a number of businesses and retail stores, providing employment opportunities for its residents.
Common Questions
What is Per Capita Income in West?
Per Capita income in West is $29,207.
What is the Median Family Income in West?
Median Family Income in West is $68,750.
What is the Median Household income in West?
Median Household Income in West is $75,938.
What is Inequality or Gini Index in West?
Inequality or Gini Index in West is 0.26.
What is the Total Population of West?
Total Population of West is 200.
What is the Total Male Population of West?
Total Male Population of West is 70.
What is the Total Female Population of West?
Total Female Population of West is 130.
What is the Ratio of Males per 100 Females in West?
There are 53.85 Males per 100 Females in West.
What is the Ratio of Females per 100 Males in West?
There are 185.71 Females per 100 Males in West.
What is the Median Population Age in West?
Median Population Age in West is 27.5 Years.
What is the Average Family Size in West
Average Family Size in West is 4.3 People.
What is the Average Household Size in West
Average Household Size in West is 4.3 People.
How Large is the Labor Force in West?
There are 156 People in the Labor Forcein in West.
What is the Percentage of People in the Labor Force in West?
82.1% of People are in the Labor Force in West.