Snow Lake Shores, MS Map & Demographics
Snow Lake Shores Map
Snow Lake Shores Overview
$41,964
PER CAPITA INCOME
$68,906
AVG FAMILY INCOME
$54,583
AVG HOUSEHOLD INCOME
1.5%
WAGE / INCOME GAP [ % ]
98.5¢/ $1
WAGE / INCOME GAP [ $ ]
0.44
INEQUALITY / GINI INDEX
364
TOTAL POPULATION
205
MALE POPULATION
159
FEMALE POPULATION
128.93
MALES / 100 FEMALES
77.56
FEMALES / 100 MALES
61.0
MEDIAN AGE
2.5
AVG FAMILY SIZE
1.7
AVG HOUSEHOLD SIZE
159
LABOR FORCE [ PEOPLE ]
46.9%
PERCENT IN LABOR FORCE
11.9%
UNEMPLOYMENT RATE
Snow Lake Shores Area Codes
Income in Snow Lake Shores
Income Overview in Snow Lake Shores
Per Capita Income in Snow Lake Shores is $41,964, while median incomes of families and households are $68,906 and $54,583 respectively.
| Characteristic | Number | Measure |
| Per Capita Income | 364 | $41,964 |
| Median Family Income | 91 | $68,906 |
| Mean Family Income | 91 | $95,327 |
| Median Household Income | 209 | $54,583 |
| Mean Household Income | 209 | $70,721 |
| Income Deficit | 91 | $0 |
| Wage / Income Gap (%) | 364 | 1.47% |
| Wage / Income Gap ($) | 364 | 98.53¢ per $1 |
| Gini / Inequality Index | 364 | 0.44 |
Earnings by Sex in Snow Lake Shores
Average Earnings in Snow Lake Shores are $42,000, $41,875 for men and $42,500 for women, a difference of 1.5%.
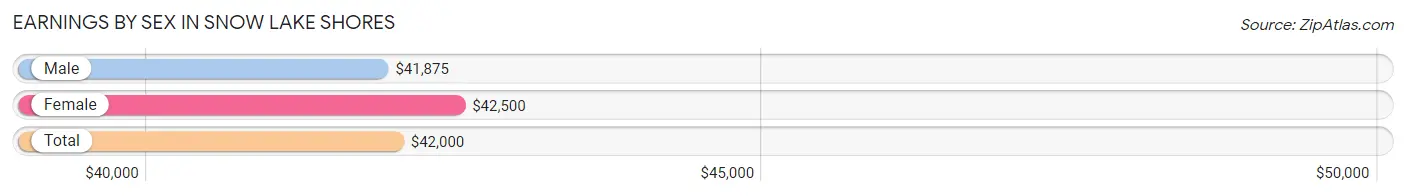
| Sex | Number | Average Earnings |
| Male | 100 (61.7%) | $41,875 |
| Female | 62 (38.3%) | $42,500 |
| Total | 162 (100.0%) | $42,000 |
Earnings by Sex by Income Bracket in Snow Lake Shores
The most common earnings brackets in Snow Lake Shores are $75,000 to $99,999 for men (16 | 16.0%) and $25,000 to $29,999 for women (13 | 21.0%).
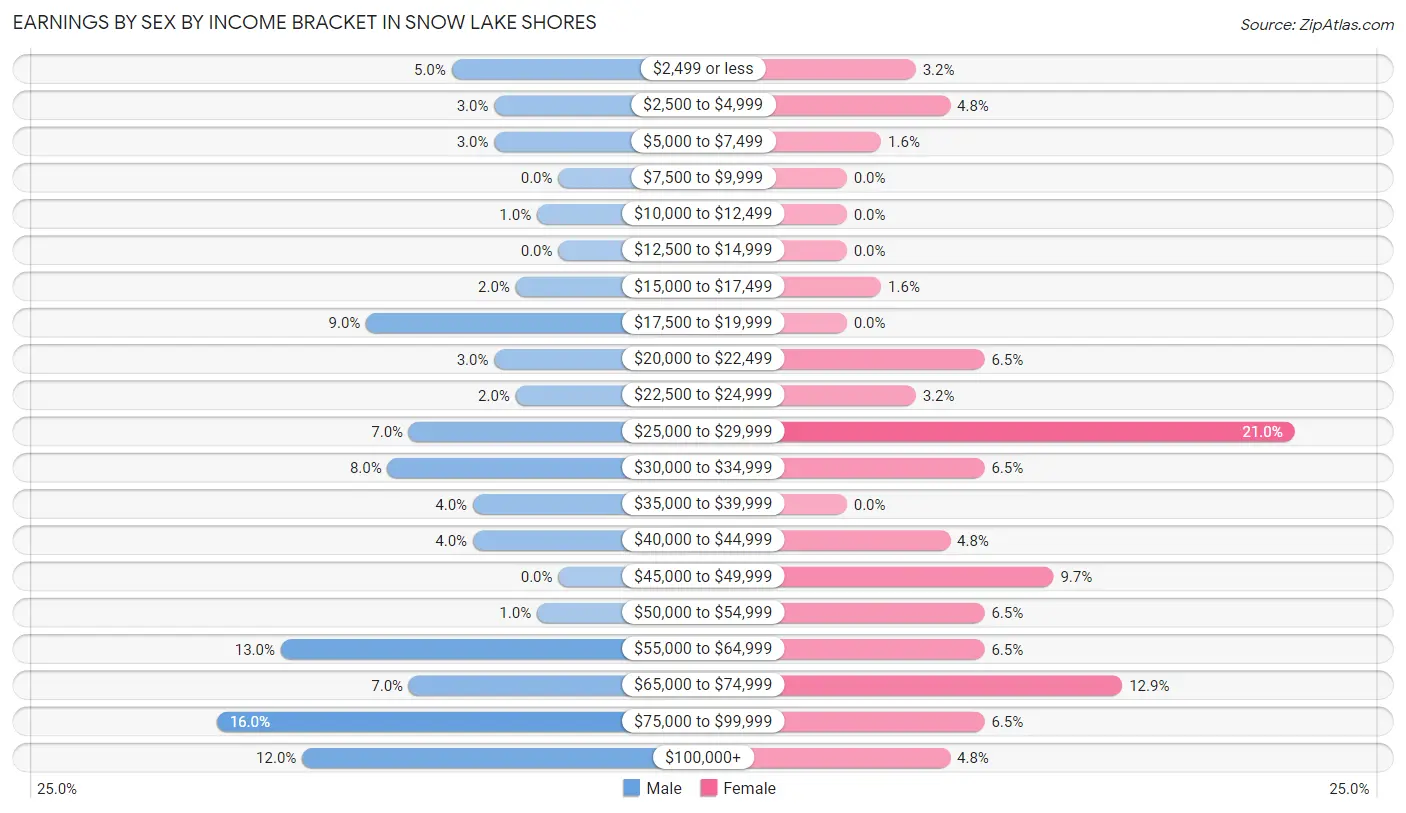
| Income | Male | Female |
| $2,499 or less | 5 (5.0%) | 2 (3.2%) |
| $2,500 to $4,999 | 3 (3.0%) | 3 (4.8%) |
| $5,000 to $7,499 | 3 (3.0%) | 1 (1.6%) |
| $7,500 to $9,999 | 0 (0.0%) | 0 (0.0%) |
| $10,000 to $12,499 | 1 (1.0%) | 0 (0.0%) |
| $12,500 to $14,999 | 0 (0.0%) | 0 (0.0%) |
| $15,000 to $17,499 | 2 (2.0%) | 1 (1.6%) |
| $17,500 to $19,999 | 9 (9.0%) | 0 (0.0%) |
| $20,000 to $22,499 | 3 (3.0%) | 4 (6.5%) |
| $22,500 to $24,999 | 2 (2.0%) | 2 (3.2%) |
| $25,000 to $29,999 | 7 (7.0%) | 13 (21.0%) |
| $30,000 to $34,999 | 8 (8.0%) | 4 (6.5%) |
| $35,000 to $39,999 | 4 (4.0%) | 0 (0.0%) |
| $40,000 to $44,999 | 4 (4.0%) | 3 (4.8%) |
| $45,000 to $49,999 | 0 (0.0%) | 6 (9.7%) |
| $50,000 to $54,999 | 1 (1.0%) | 4 (6.5%) |
| $55,000 to $64,999 | 13 (13.0%) | 4 (6.5%) |
| $65,000 to $74,999 | 7 (7.0%) | 8 (12.9%) |
| $75,000 to $99,999 | 16 (16.0%) | 4 (6.5%) |
| $100,000+ | 12 (12.0%) | 3 (4.8%) |
| Total | 100 (100.0%) | 62 (100.0%) |
Earnings by Sex by Educational Attainment in Snow Lake Shores
Average earnings in Snow Lake Shores are $41,875 for men and $42,500 for women, a difference of 1.5%. Men with an educational attainment of high school diploma enjoy the highest average annual earnings of $58,125, while those with college or associate's degree education earn the least with $32,500. Women with an educational attainment of college or associate's degree earn the most with the average annual earnings of $46,000, while those with bachelor's degree education have the smallest earnings of $28,750.
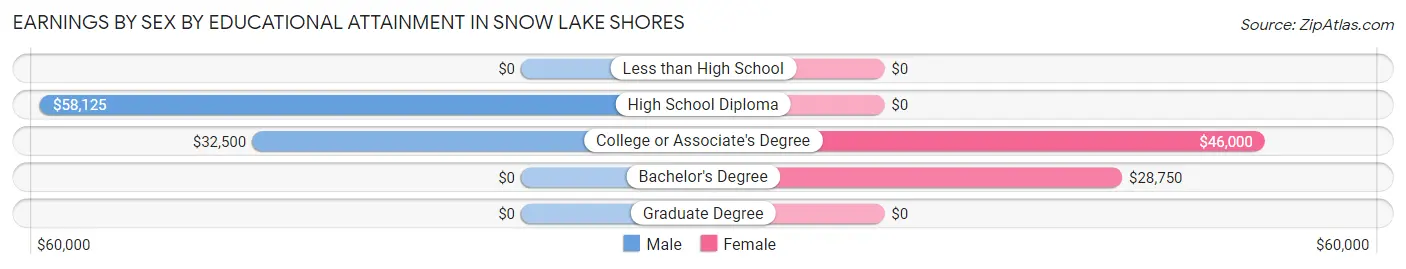
| Educational Attainment | Male Income | Female Income |
| Less than High School | - | - |
| High School Diploma | $58,125 | $0 |
| College or Associate's Degree | $32,500 | $46,000 |
| Bachelor's Degree | - | - |
| Graduate Degree | - | - |
| Total | $41,875 | $42,500 |
Family Income in Snow Lake Shores
Family Income Brackets in Snow Lake Shores
According to the Snow Lake Shores family income data, there are 26 families falling into the $50,000 to $74,999 income range, which is the most common income bracket and makes up 28.6% of all families.
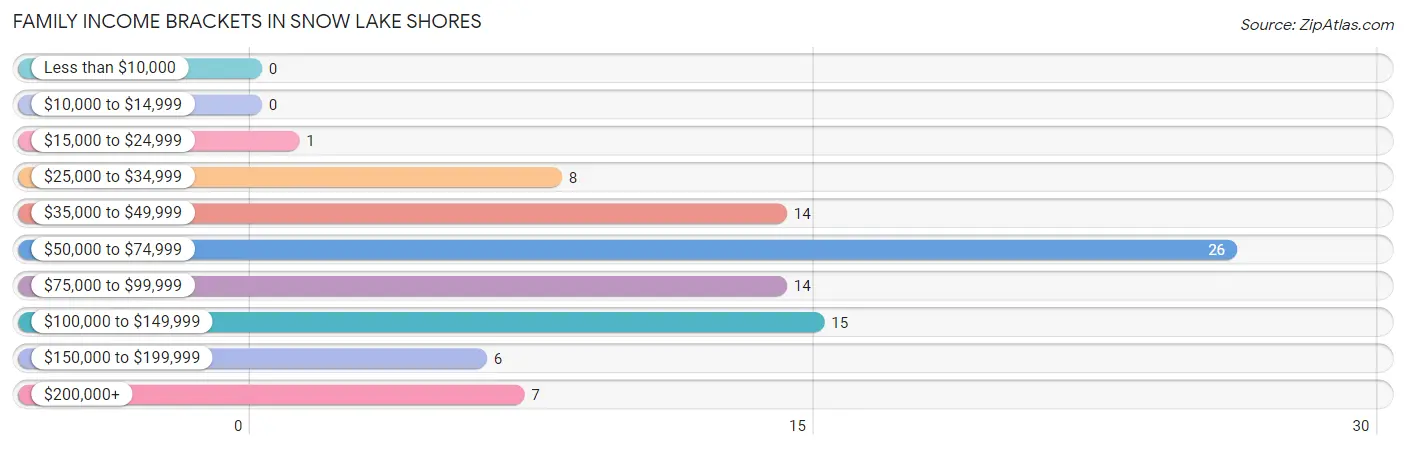
| Income Bracket | # Families | % Families |
| Less than $10,000 | 0 | 0.0% |
| $10,000 to $14,999 | 0 | 0.0% |
| $15,000 to $24,999 | 1 | 1.1% |
| $25,000 to $34,999 | 8 | 8.8% |
| $35,000 to $49,999 | 14 | 15.4% |
| $50,000 to $74,999 | 26 | 28.6% |
| $75,000 to $99,999 | 14 | 15.4% |
| $100,000 to $149,999 | 15 | 16.5% |
| $150,000 to $199,999 | 6 | 6.6% |
| $200,000+ | 7 | 7.7% |
Family Income by Famaliy Size in Snow Lake Shores
4-person families (11 | 12.1%) account for the highest median family income in Snow Lake Shores with $102,708 per family, while 2-person families (68 | 74.7%) have the highest median income of $34,688 per family member.
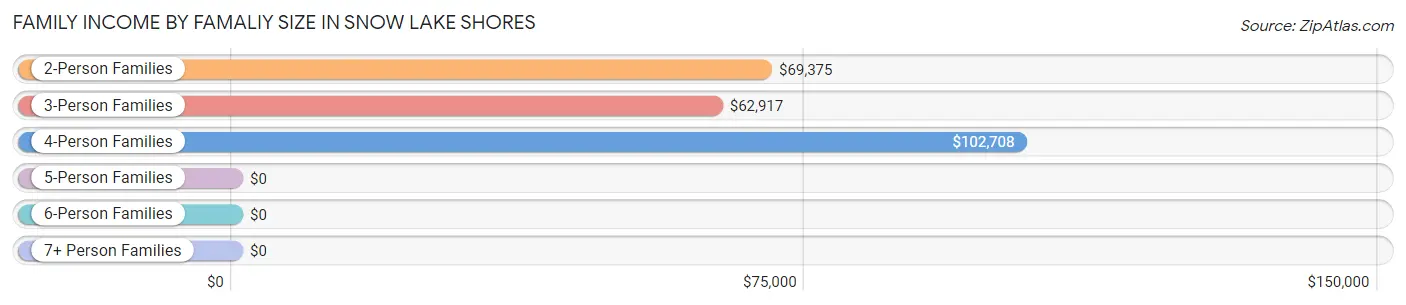
| Income Bracket | # Families | Median Income |
| 2-Person Families | 68 (74.7%) | $69,375 |
| 3-Person Families | 12 (13.2%) | $62,917 |
| 4-Person Families | 11 (12.1%) | $102,708 |
| 5-Person Families | 0 (0.0%) | $0 |
| 6-Person Families | 0 (0.0%) | $0 |
| 7+ Person Families | 0 (0.0%) | $0 |
| Total | 91 (100.0%) | $68,906 |
Family Income by Number of Earners in Snow Lake Shores
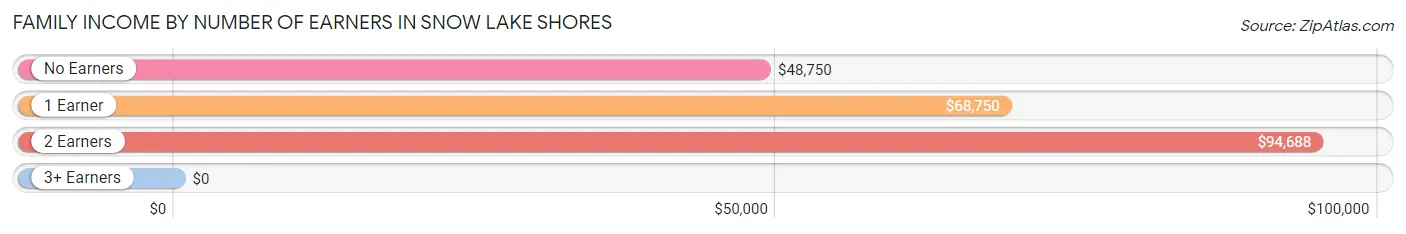
| Number of Earners | # Families | Median Income |
| No Earners | 25 (27.5%) | $48,750 |
| 1 Earner | 29 (31.9%) | $68,750 |
| 2 Earners | 37 (40.7%) | $94,688 |
| 3+ Earners | 0 (0.0%) | $0 |
| Total | 91 (100.0%) | $68,906 |
Household Income in Snow Lake Shores
Household Income Brackets in Snow Lake Shores
With 39 households falling in the category, the $50,000 to $74,999 income range is the most frequent in Snow Lake Shores, accounting for 18.7% of all households. In contrast, only 7 households (3.4%) fall into the $200,000+ income bracket, making it the least populous group.
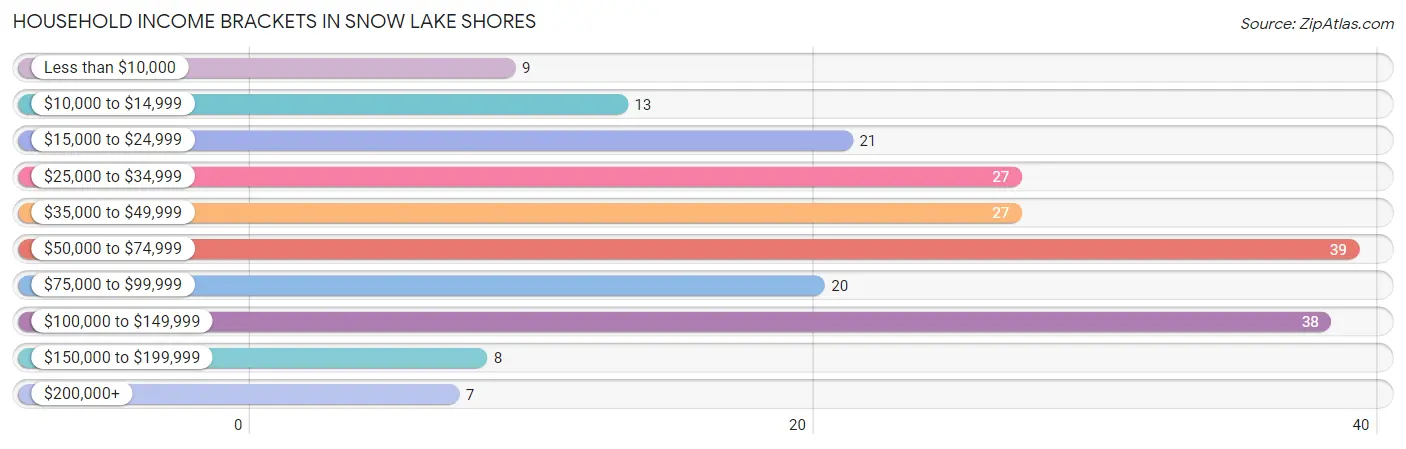
| Income Bracket | # Households | % Households |
| Less than $10,000 | 9 | 4.3% |
| $10,000 to $14,999 | 13 | 6.2% |
| $15,000 to $24,999 | 21 | 10.0% |
| $25,000 to $34,999 | 27 | 12.9% |
| $35,000 to $49,999 | 27 | 12.9% |
| $50,000 to $74,999 | 39 | 18.7% |
| $75,000 to $99,999 | 20 | 9.6% |
| $100,000 to $149,999 | 38 | 18.2% |
| $150,000 to $199,999 | 8 | 3.8% |
| $200,000+ | 7 | 3.3% |
Household Income by Householder Age in Snow Lake Shores
The median household income in Snow Lake Shores is $54,583, with the highest median household income of $62,375 found in the 45 to 64 years age bracket for the primary householder. A total of 105 households (50.2%) fall into this category.
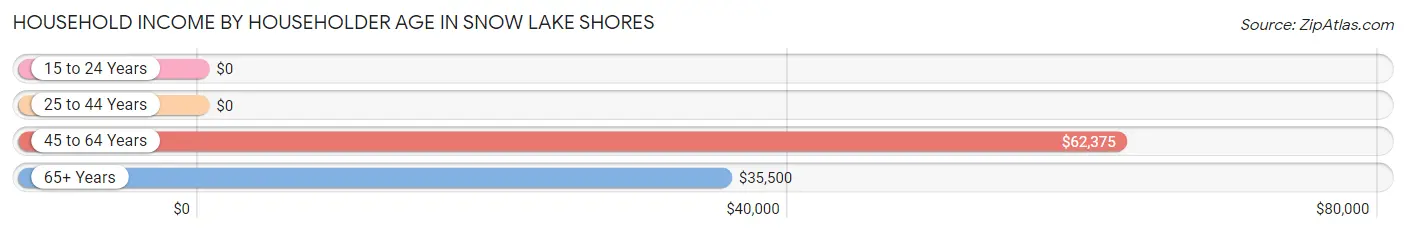
| Income Bracket | # Households | Median Income |
| 15 to 24 Years | 0 (0.0%) | $0 |
| 25 to 44 Years | 26 (12.4%) | $0 |
| 45 to 64 Years | 105 (50.2%) | $62,375 |
| 65+ Years | 78 (37.3%) | $35,500 |
| Total | 209 (100.0%) | $54,583 |
Poverty in Snow Lake Shores
Income Below Poverty by Sex and Age in Snow Lake Shores
With 7.8% poverty level for males and 6.9% for females among the residents of Snow Lake Shores, 55 to 64 year old males and 18 to 24 year old females are the most vulnerable to poverty, with 12 males (16.2%) and 3 females (60.0%) in their respective age groups living below the poverty level.
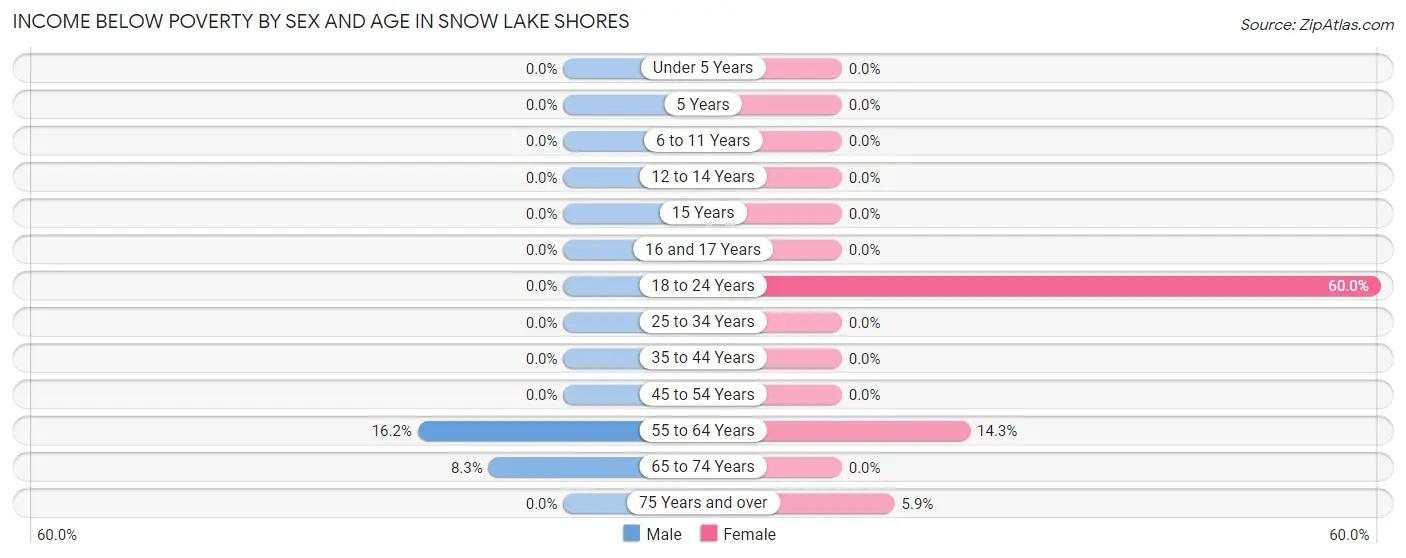
| Age Bracket | Male | Female |
| Under 5 Years | 0 (0.0%) | 0 (0.0%) |
| 5 Years | 0 (0.0%) | 0 (0.0%) |
| 6 to 11 Years | 0 (0.0%) | 0 (0.0%) |
| 12 to 14 Years | 0 (0.0%) | 0 (0.0%) |
| 15 Years | 0 (0.0%) | 0 (0.0%) |
| 16 and 17 Years | 0 (0.0%) | 0 (0.0%) |
| 18 to 24 Years | 0 (0.0%) | 3 (60.0%) |
| 25 to 34 Years | 0 (0.0%) | 0 (0.0%) |
| 35 to 44 Years | 0 (0.0%) | 0 (0.0%) |
| 45 to 54 Years | 0 (0.0%) | 0 (0.0%) |
| 55 to 64 Years | 12 (16.2%) | 6 (14.3%) |
| 65 to 74 Years | 4 (8.3%) | 0 (0.0%) |
| 75 Years and over | 0 (0.0%) | 2 (5.9%) |
| Total | 16 (7.8%) | 11 (6.9%) |
Income Above Poverty by Sex and Age in Snow Lake Shores
According to the poverty statistics in Snow Lake Shores, males aged under 5 years and females aged 12 to 14 years are the age groups that are most secure financially, with 100.0% of males and 100.0% of females in these age groups living above the poverty line.
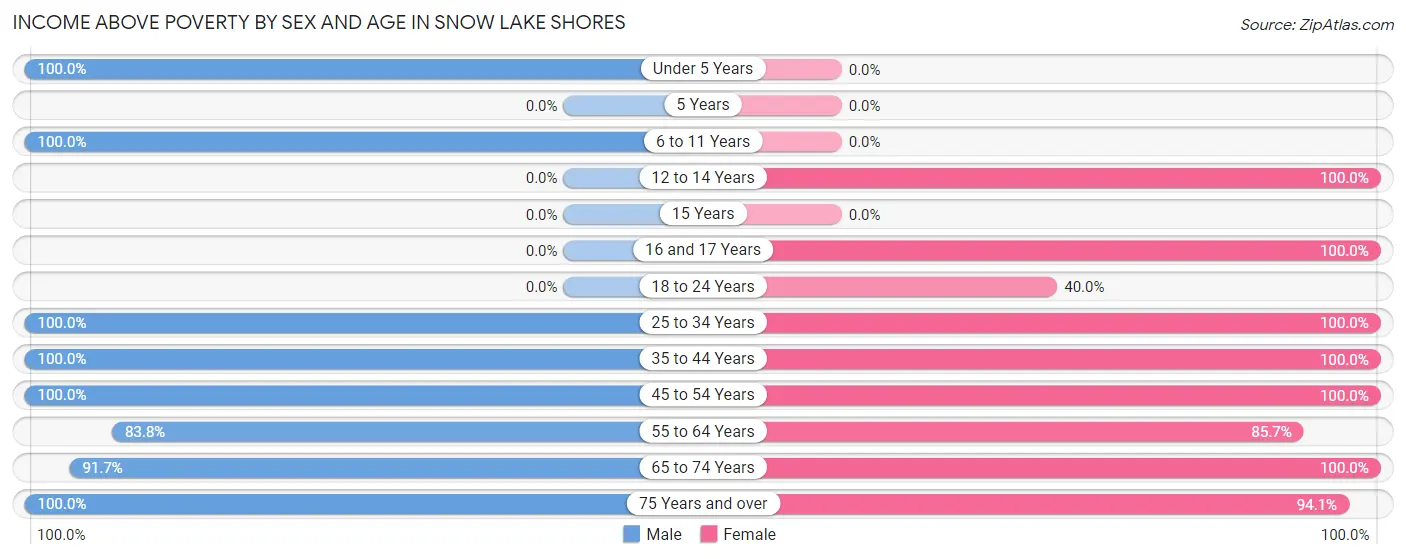
| Age Bracket | Male | Female |
| Under 5 Years | 12 (100.0%) | 0 (0.0%) |
| 5 Years | 0 (0.0%) | 0 (0.0%) |
| 6 to 11 Years | 9 (100.0%) | 0 (0.0%) |
| 12 to 14 Years | 0 (0.0%) | 4 (100.0%) |
| 15 Years | 0 (0.0%) | 0 (0.0%) |
| 16 and 17 Years | 0 (0.0%) | 1 (100.0%) |
| 18 to 24 Years | 0 (0.0%) | 2 (40.0%) |
| 25 to 34 Years | 5 (100.0%) | 10 (100.0%) |
| 35 to 44 Years | 23 (100.0%) | 22 (100.0%) |
| 45 to 54 Years | 18 (100.0%) | 11 (100.0%) |
| 55 to 64 Years | 62 (83.8%) | 36 (85.7%) |
| 65 to 74 Years | 44 (91.7%) | 30 (100.0%) |
| 75 Years and over | 16 (100.0%) | 32 (94.1%) |
| Total | 189 (92.2%) | 148 (93.1%) |
Income Below Poverty Among Married-Couple Families in Snow Lake Shores
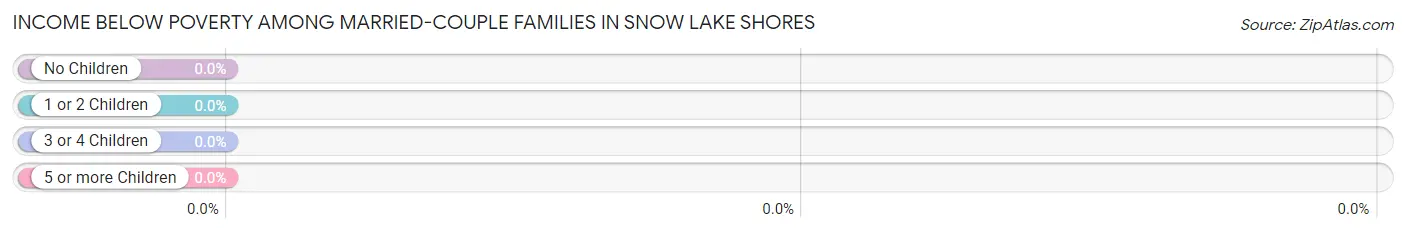
| Children | Above Poverty | Below Poverty |
| No Children | 68 (100.0%) | 0 (0.0%) |
| 1 or 2 Children | 16 (100.0%) | 0 (0.0%) |
| 3 or 4 Children | 0 (0.0%) | 0 (0.0%) |
| 5 or more Children | 0 (0.0%) | 0 (0.0%) |
| Total | 84 (100.0%) | 0 (0.0%) |
Income Below Poverty Among Single-Parent Households in Snow Lake Shores
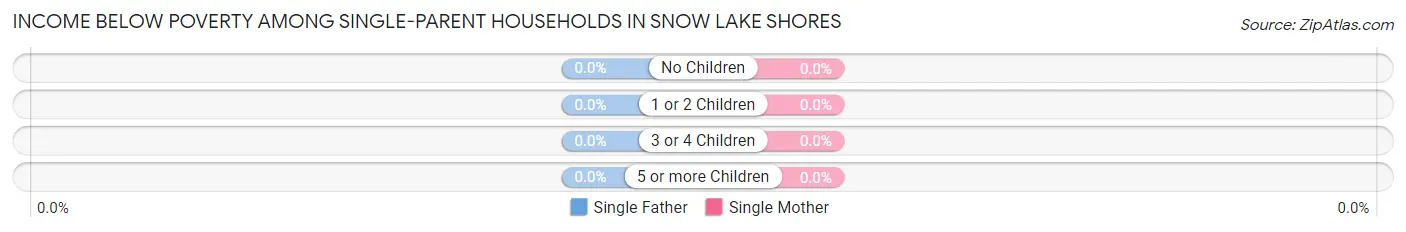
| Children | Single Father | Single Mother |
| No Children | 0 (0.0%) | 0 (0.0%) |
| 1 or 2 Children | 0 (0.0%) | 0 (0.0%) |
| 3 or 4 Children | 0 (0.0%) | 0 (0.0%) |
| 5 or more Children | 0 (0.0%) | 0 (0.0%) |
| Total | 0 (0.0%) | 0 (0.0%) |
Income Below Poverty Among Married-Couple vs Single-Parent Households in Snow Lake Shores
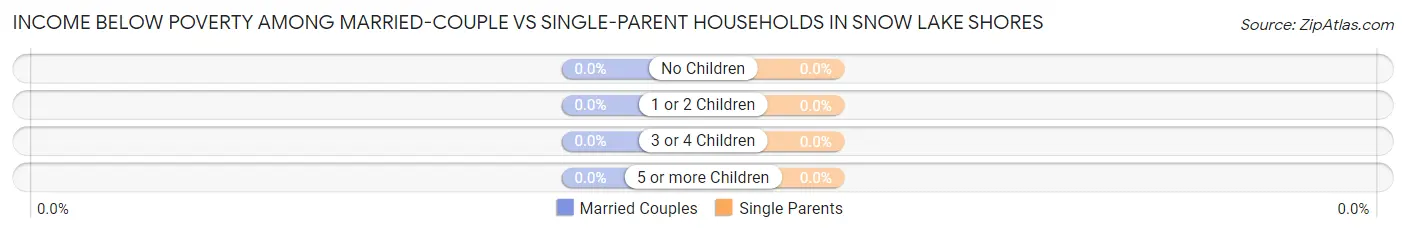
| Children | Married-Couple Families | Single-Parent Households |
| No Children | 0 (0.0%) | 0 (0.0%) |
| 1 or 2 Children | 0 (0.0%) | 0 (0.0%) |
| 3 or 4 Children | 0 (0.0%) | 0 (0.0%) |
| 5 or more Children | 0 (0.0%) | 0 (0.0%) |
| Total | 0 (0.0%) | 0 (0.0%) |
Race in Snow Lake Shores
The most populous races in Snow Lake Shores are White / Caucasian (320 | 87.9%), Asian (30 | 8.2%), and Hispanic or Latino (22 | 6.0%).
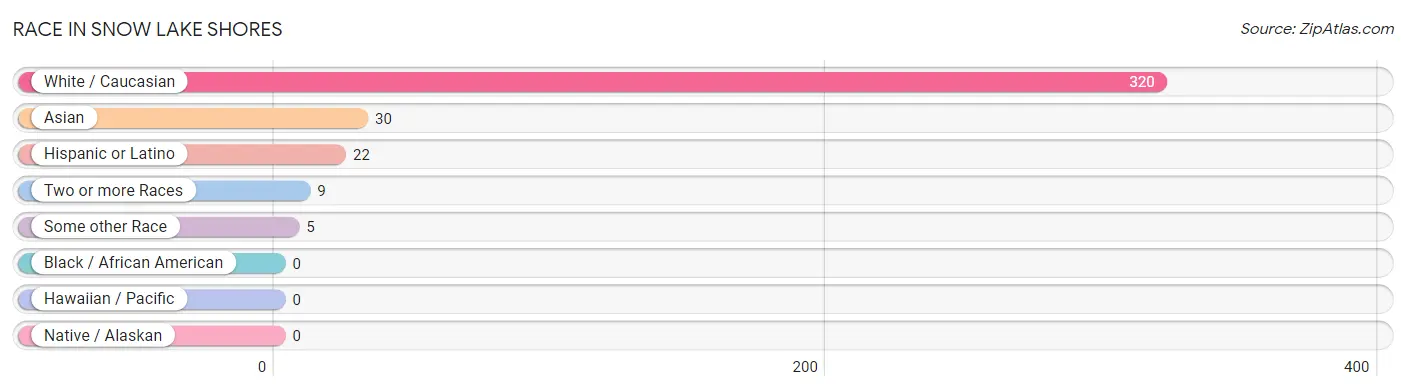
| Race | # Population | % Population |
| Asian | 30 | 8.2% |
| Black / African American | 0 | 0.0% |
| Hawaiian / Pacific | 0 | 0.0% |
| Hispanic or Latino | 22 | 6.0% |
| Native / Alaskan | 0 | 0.0% |
| White / Caucasian | 320 | 87.9% |
| Two or more Races | 9 | 2.5% |
| Some other Race | 5 | 1.4% |
| Total | 364 | 100.0% |
Ancestry in Snow Lake Shores
The most populous ancestries reported in Snow Lake Shores are English (90 | 24.7%), German (48 | 13.2%), Irish (44 | 12.1%), American (40 | 11.0%), and Korean (30 | 8.2%), together accounting for 69.2% of all Snow Lake Shores residents.
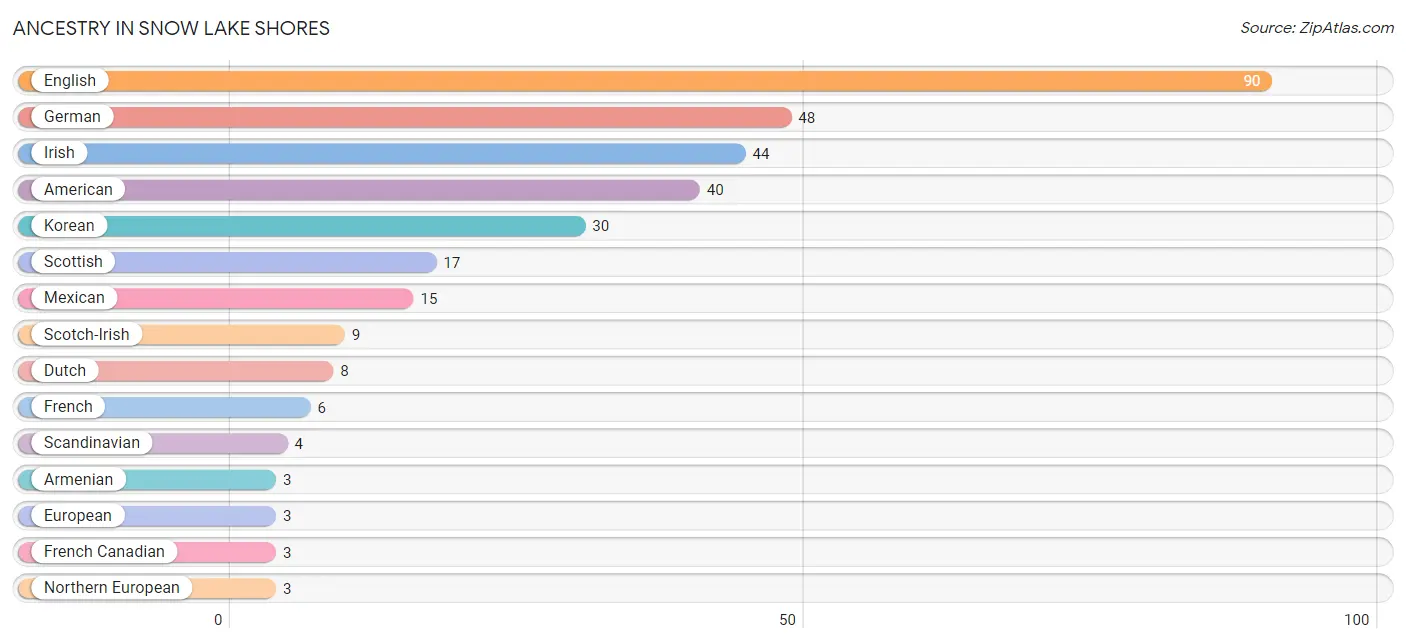
| Ancestry | # Population | % Population |
| American | 40 | 11.0% |
| Armenian | 3 | 0.8% |
| British | 1 | 0.3% |
| Canadian | 1 | 0.3% |
| Choctaw | 1 | 0.3% |
| Dutch | 8 | 2.2% |
| English | 90 | 24.7% |
| European | 3 | 0.8% |
| French | 6 | 1.7% |
| French Canadian | 3 | 0.8% |
| German | 48 | 13.2% |
| Irish | 44 | 12.1% |
| Italian | 2 | 0.5% |
| Korean | 30 | 8.2% |
| Luxembourger | 2 | 0.5% |
| Mexican | 15 | 4.1% |
| Northern European | 3 | 0.8% |
| Polish | 1 | 0.3% |
| Puerto Rican | 3 | 0.8% |
| Scandinavian | 4 | 1.1% |
| Scotch-Irish | 9 | 2.5% |
| Scottish | 17 | 4.7% |
| Swedish | 3 | 0.8% |
| Welsh | 1 | 0.3% | View All 24 Rows |
Immigrants in Snow Lake Shores
The most numerous immigrant groups reported in Snow Lake Shores came from Asia (21 | 5.8%), South Eastern Asia (21 | 5.8%), Philippines (12 | 3.3%), Vietnam (9 | 2.5%), and Canada (7 | 1.9%), together accounting for 19.2% of all Snow Lake Shores residents.
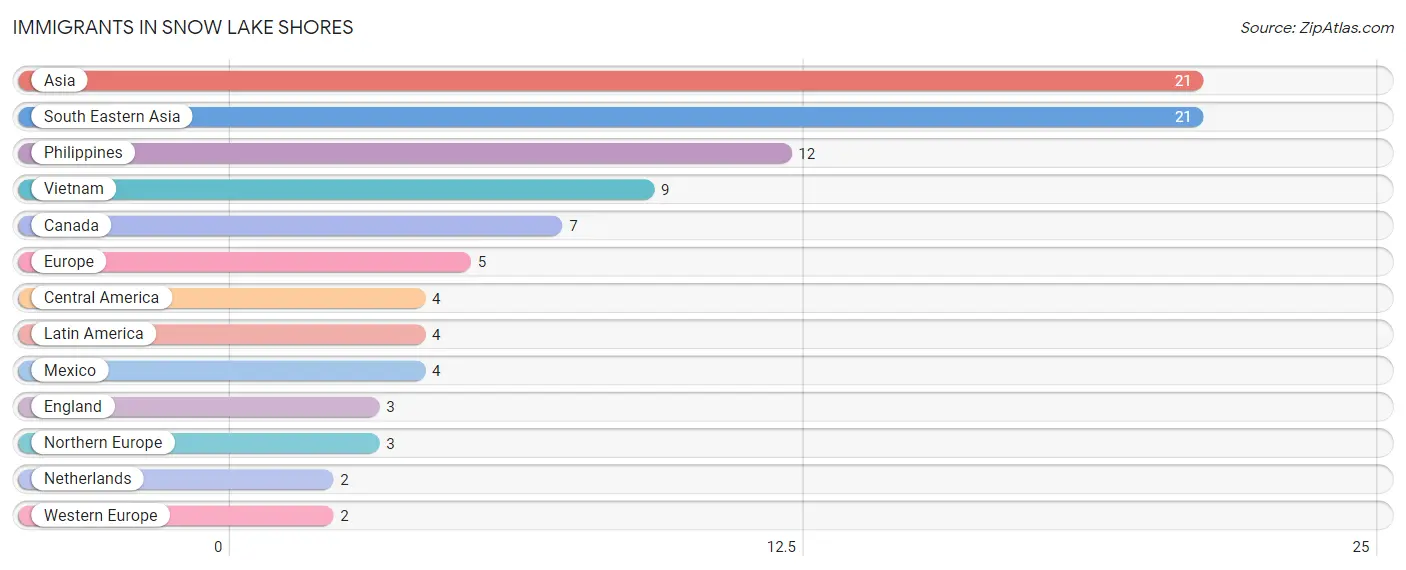
| Immigration Origin | # Population | % Population |
| Asia | 21 | 5.8% |
| Canada | 7 | 1.9% |
| Central America | 4 | 1.1% |
| England | 3 | 0.8% |
| Europe | 5 | 1.4% |
| Latin America | 4 | 1.1% |
| Mexico | 4 | 1.1% |
| Netherlands | 2 | 0.5% |
| Northern Europe | 3 | 0.8% |
| Philippines | 12 | 3.3% |
| South Eastern Asia | 21 | 5.8% |
| Vietnam | 9 | 2.5% |
| Western Europe | 2 | 0.5% | View All 13 Rows |
Sex and Age in Snow Lake Shores
Sex and Age in Snow Lake Shores
The most populous age groups in Snow Lake Shores are 60 to 64 Years (53 | 25.9%) for men and 55 to 59 Years (24 | 15.1%) for women.
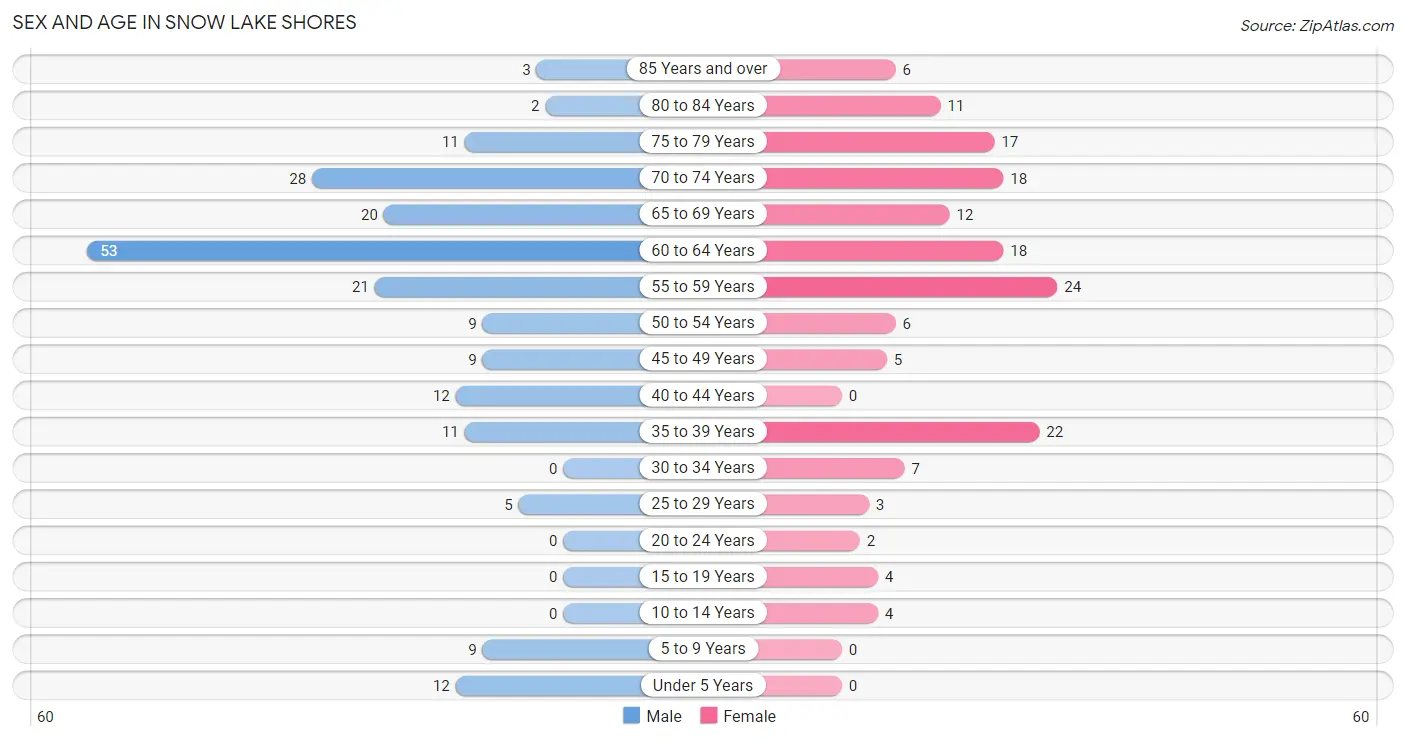
| Age Bracket | Male | Female |
| Under 5 Years | 12 (5.9%) | 0 (0.0%) |
| 5 to 9 Years | 9 (4.4%) | 0 (0.0%) |
| 10 to 14 Years | 0 (0.0%) | 4 (2.5%) |
| 15 to 19 Years | 0 (0.0%) | 4 (2.5%) |
| 20 to 24 Years | 0 (0.0%) | 2 (1.3%) |
| 25 to 29 Years | 5 (2.4%) | 3 (1.9%) |
| 30 to 34 Years | 0 (0.0%) | 7 (4.4%) |
| 35 to 39 Years | 11 (5.4%) | 22 (13.8%) |
| 40 to 44 Years | 12 (5.9%) | 0 (0.0%) |
| 45 to 49 Years | 9 (4.4%) | 5 (3.1%) |
| 50 to 54 Years | 9 (4.4%) | 6 (3.8%) |
| 55 to 59 Years | 21 (10.2%) | 24 (15.1%) |
| 60 to 64 Years | 53 (25.9%) | 18 (11.3%) |
| 65 to 69 Years | 20 (9.8%) | 12 (7.5%) |
| 70 to 74 Years | 28 (13.7%) | 18 (11.3%) |
| 75 to 79 Years | 11 (5.4%) | 17 (10.7%) |
| 80 to 84 Years | 2 (1.0%) | 11 (6.9%) |
| 85 Years and over | 3 (1.5%) | 6 (3.8%) |
| Total | 205 (100.0%) | 159 (100.0%) |
Families and Households in Snow Lake Shores
Median Family Size in Snow Lake Shores
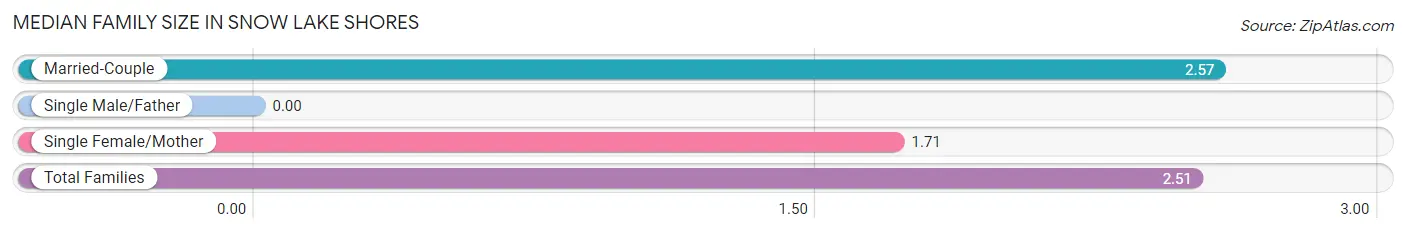
| Family Type | # Families | Family Size |
| Married-Couple | 84 (92.3%) | 2.57 |
| Single Male/Father | 0 (0.0%) | - |
| Single Female/Mother | 7 (7.7%) | 1.71 |
| Total Families | 91 (100.0%) | 2.51 |
Median Household Size in Snow Lake Shores
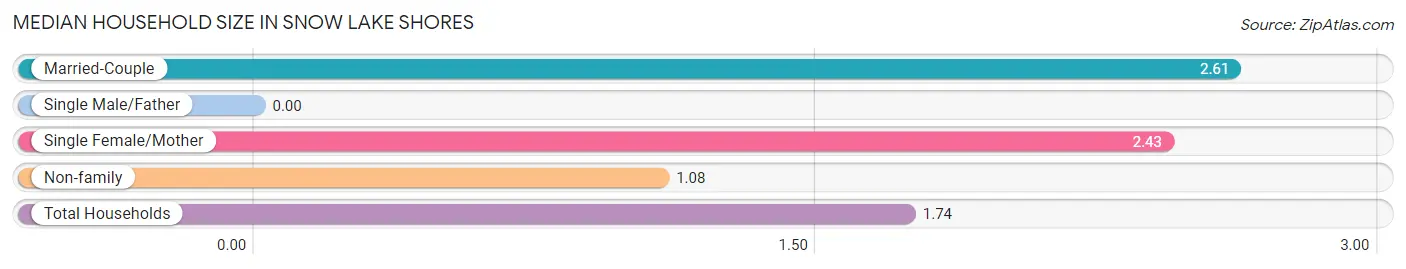
| Household Type | # Households | Household Size |
| Married-Couple | 84 (40.2%) | 2.61 |
| Single Male/Father | 0 (0.0%) | - |
| Single Female/Mother | 7 (3.4%) | 2.43 |
| Non-family | 118 (56.5%) | 1.08 |
| Total Households | 209 (100.0%) | 1.74 |
Household Size by Marriage Status in Snow Lake Shores
Out of a total of 209 households in Snow Lake Shores, 91 (43.5%) are family households, while 118 (56.5%) are nonfamily households. The most numerous type of family households are 2-person households, comprising 61, and the most common type of nonfamily households are 1-person households, comprising 110.
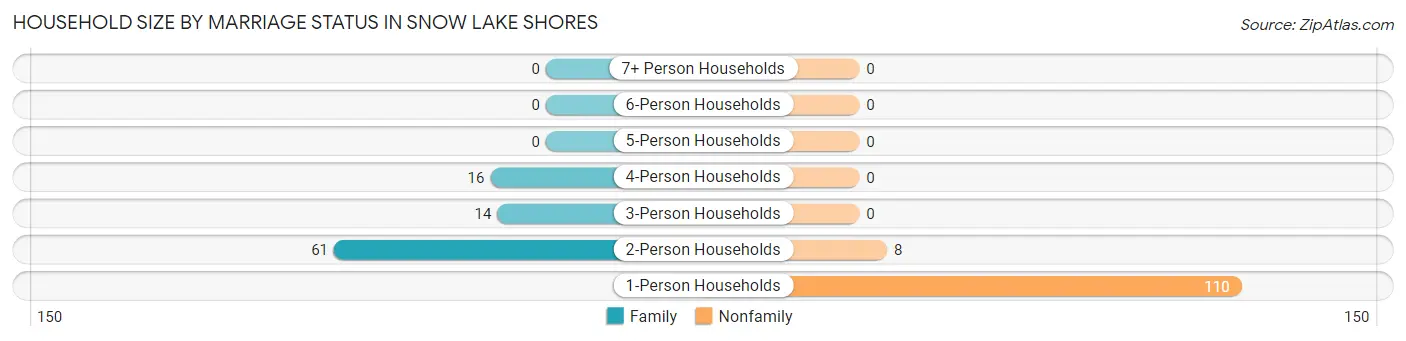
| Household Size | Family Households | Nonfamily Households |
| 1-Person Households | - | 110 (52.6%) |
| 2-Person Households | 61 (29.2%) | 8 (3.8%) |
| 3-Person Households | 14 (6.7%) | 0 (0.0%) |
| 4-Person Households | 16 (7.7%) | 0 (0.0%) |
| 5-Person Households | 0 (0.0%) | 0 (0.0%) |
| 6-Person Households | 0 (0.0%) | 0 (0.0%) |
| 7+ Person Households | 0 (0.0%) | 0 (0.0%) |
| Total | 91 (43.5%) | 118 (56.5%) |
Female Fertility in Snow Lake Shores
Fertility by Age in Snow Lake Shores
| Age Bracket | Women with Births | Births / 1,000 Women |
| 15 to 19 years | 0 (0.0%) | 0.0 |
| 20 to 34 years | 0 (0.0%) | 0.0 |
| 35 to 50 years | 0 (0.0%) | 0.0 |
| Total | 0 (0.0%) | 0.0 |
Fertility by Age by Marriage Status in Snow Lake Shores
| Age Bracket | Married | Unmarried |
| 15 to 19 years | 0 (0.0%) | 0 (0.0%) |
| 20 to 34 years | 0 (0.0%) | 0 (0.0%) |
| 35 to 50 years | 0 (0.0%) | 0 (0.0%) |
| Total | 0 (0.0%) | 0 (0.0%) |
Fertility by Education in Snow Lake Shores
| Educational Attainment | Women with Births | Births / 1,000 Women |
| Less than High School | 0 (0.0%) | 0.0 |
| High School Diploma | 0 (0.0%) | 0.0 |
| College or Associate's Degree | 0 (0.0%) | 0.0 |
| Bachelor's Degree | 0 (0.0%) | 0.0 |
| Graduate Degree | 0 (0.0%) | 0.0 |
| Total | 0 (0.0%) | 0.0 |
Fertility by Education by Marriage Status in Snow Lake Shores
| Educational Attainment | Married | Unmarried |
| Less than High School | 0 (0.0%) | 0 (0.0%) |
| High School Diploma | 0 (0.0%) | 0 (0.0%) |
| College or Associate's Degree | 0 (0.0%) | 0 (0.0%) |
| Bachelor's Degree | 0 (0.0%) | 0 (0.0%) |
| Graduate Degree | 0 (0.0%) | 0 (0.0%) |
| Total | 0 (0.0%) | 0 (0.0%) |
Employment Characteristics in Snow Lake Shores
Employment by Class of Employer in Snow Lake Shores
Among the 140 employed individuals in Snow Lake Shores, private company employees (117 | 83.6%), self-employed (incorporated) (8 | 5.7%), and state government employees (7 | 5.0%) make up the most common classes of employment.
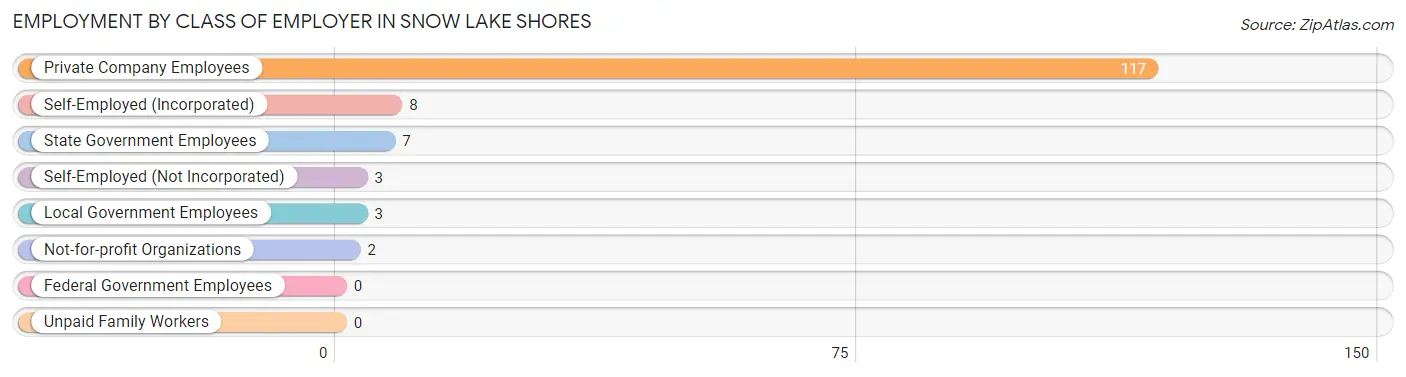
| Employer Class | # Employees | % Employees |
| Private Company Employees | 117 | 83.6% |
| Self-Employed (Incorporated) | 8 | 5.7% |
| Self-Employed (Not Incorporated) | 3 | 2.1% |
| Not-for-profit Organizations | 2 | 1.4% |
| Local Government Employees | 3 | 2.1% |
| State Government Employees | 7 | 5.0% |
| Federal Government Employees | 0 | 0.0% |
| Unpaid Family Workers | 0 | 0.0% |
| Total | 140 | 100.0% |
Employment Status by Age in Snow Lake Shores
According to the labor force statistics for Snow Lake Shores, out of the total population over 16 years of age (339), 46.9% or 159 individuals are in the labor force, with 11.9% or 19 of them unemployed. The age group with the highest labor force participation rate is 25 to 29 years, with 100.0% or 8 individuals in the labor force. Within the labor force, the 30 to 34 years age range has the highest percentage of unemployed individuals, with 85.7% or 6 of them being unemployed.
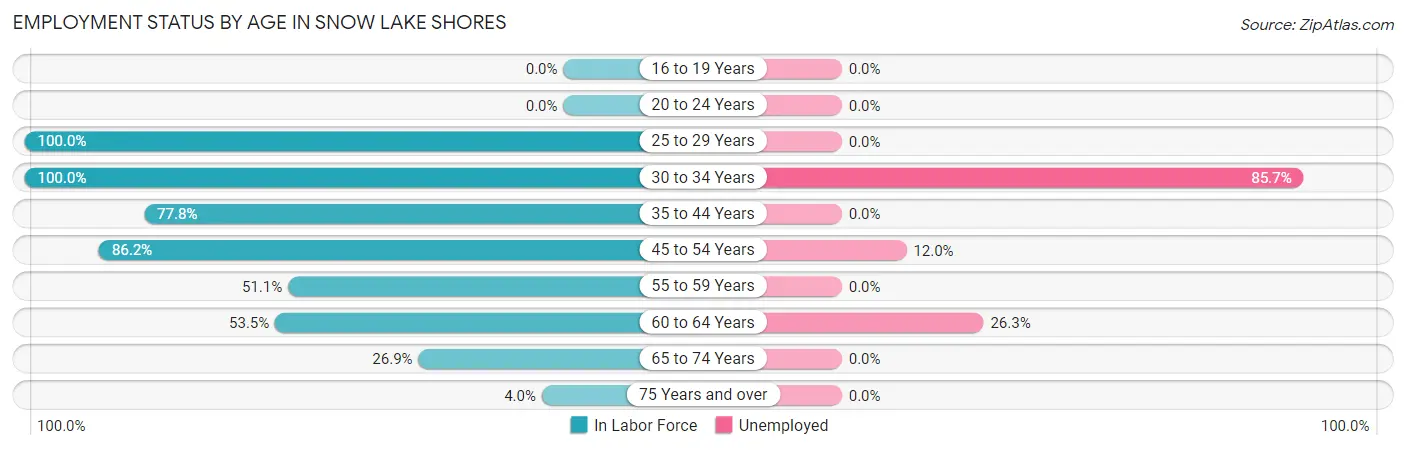
| Age Bracket | In Labor Force | Unemployed |
| 16 to 19 Years | 0 (0.0%) | 0 (0.0%) |
| 20 to 24 Years | 0 (0.0%) | 0 (0.0%) |
| 25 to 29 Years | 8 (100.0%) | 0 (0.0%) |
| 30 to 34 Years | 7 (100.0%) | 6 (85.7%) |
| 35 to 44 Years | 35 (77.8%) | 0 (0.0%) |
| 45 to 54 Years | 25 (86.2%) | 3 (12.0%) |
| 55 to 59 Years | 23 (51.1%) | 0 (0.0%) |
| 60 to 64 Years | 38 (53.5%) | 10 (26.3%) |
| 65 to 74 Years | 21 (26.9%) | 0 (0.0%) |
| 75 Years and over | 2 (4.0%) | 0 (0.0%) |
| Total | 159 (46.9%) | 19 (11.9%) |
Employment Status by Educational Attainment in Snow Lake Shores
According to labor force statistics for Snow Lake Shores, 66.3% of individuals (136) out of the total population between 25 and 64 years of age (205) are in the labor force, with 14.0% or 19 of them being unemployed. The group with the highest labor force participation rate are those with the educational attainment of high school diploma, with 78.0% or 64 individuals in the labor force. Within the labor force, individuals with less than high school education have the highest percentage of unemployment, with 85.7% or 6 of them being unemployed.
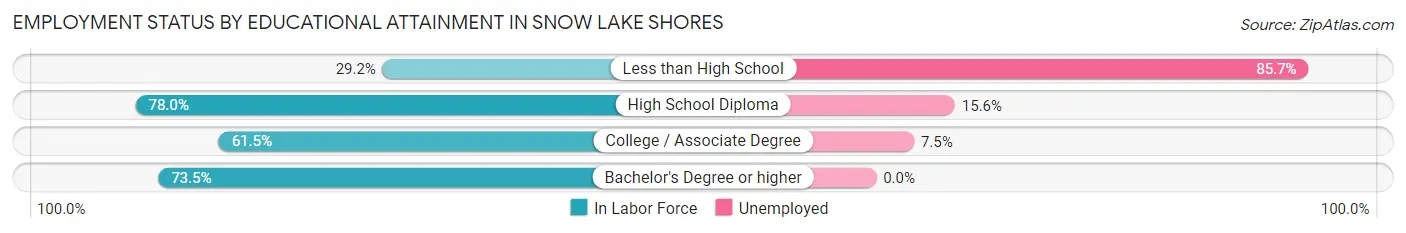
| Educational Attainment | In Labor Force | Unemployed |
| Less than High School | 7 (29.2%) | 21 (85.7%) |
| High School Diploma | 64 (78.0%) | 13 (15.6%) |
| College / Associate Degree | 40 (61.5%) | 5 (7.5%) |
| Bachelor's Degree or higher | 25 (73.5%) | 0 (0.0%) |
| Total | 136 (66.3%) | 29 (14.0%) |
Employment Occupations by Sex in Snow Lake Shores
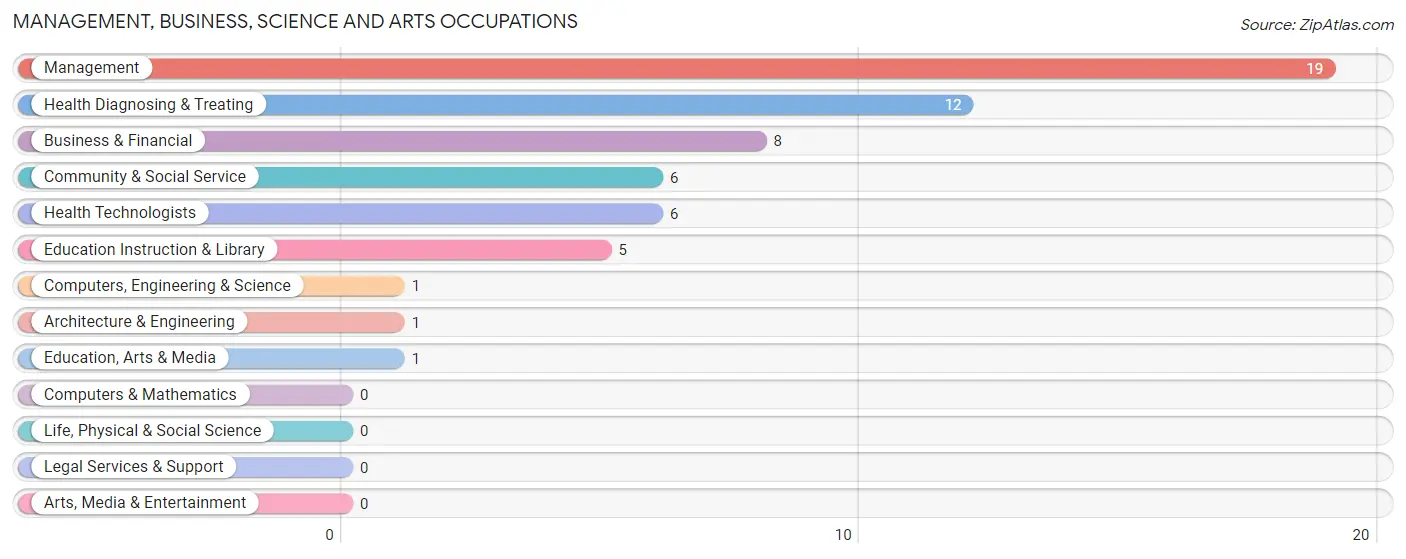
Management, Business, Science and Arts Occupations
The most common Management, Business, Science and Arts occupations in Snow Lake Shores are Management (19 | 13.6%), Health Diagnosing & Treating (12 | 8.6%), Business & Financial (8 | 5.7%), Community & Social Service (6 | 4.3%), and Health Technologists (6 | 4.3%).
Management, Business, Science and Arts Occupations by Sex
Within the Management, Business, Science and Arts occupations in Snow Lake Shores, the most male-oriented occupations are Management (84.2%), Health Technologists (50.0%), and Education Instruction & Library (40.0%), while the most female-oriented occupations are Computers, Engineering & Science (100.0%), Architecture & Engineering (100.0%), and Education, Arts & Media (100.0%).
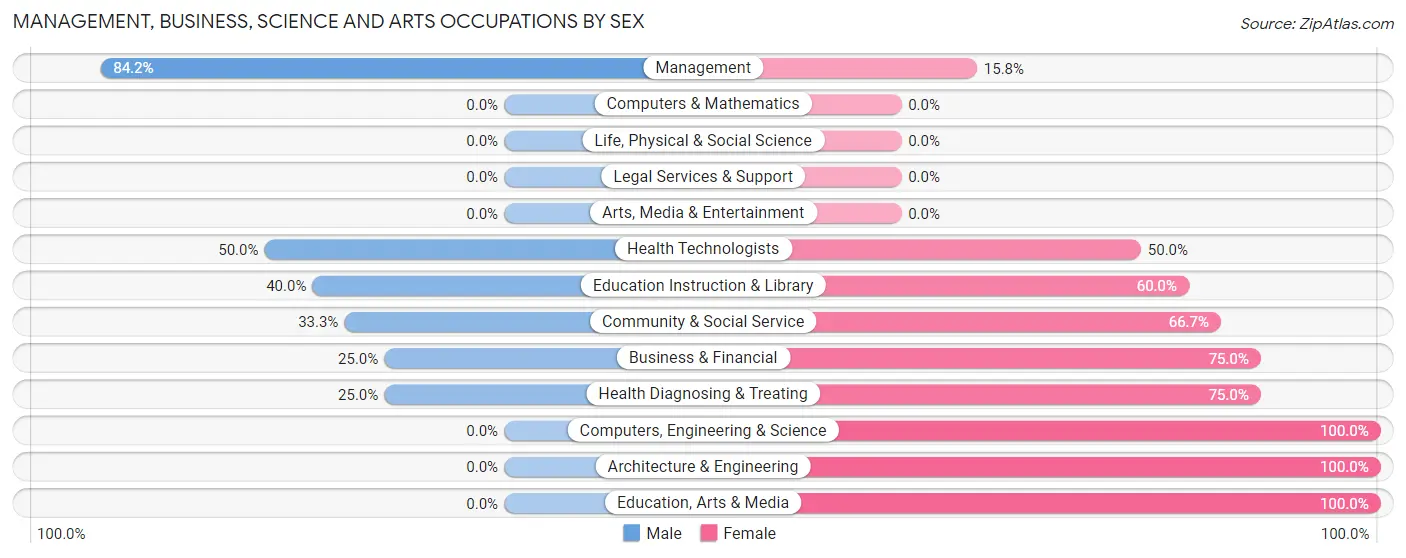
| Occupation | Male | Female |
| Management | 16 (84.2%) | 3 (15.8%) |
| Business & Financial | 2 (25.0%) | 6 (75.0%) |
| Computers, Engineering & Science | 0 (0.0%) | 1 (100.0%) |
| Computers & Mathematics | 0 (0.0%) | 0 (0.0%) |
| Architecture & Engineering | 0 (0.0%) | 1 (100.0%) |
| Life, Physical & Social Science | 0 (0.0%) | 0 (0.0%) |
| Community & Social Service | 2 (33.3%) | 4 (66.7%) |
| Education, Arts & Media | 0 (0.0%) | 1 (100.0%) |
| Legal Services & Support | 0 (0.0%) | 0 (0.0%) |
| Education Instruction & Library | 2 (40.0%) | 3 (60.0%) |
| Arts, Media & Entertainment | 0 (0.0%) | 0 (0.0%) |
| Health Diagnosing & Treating | 3 (25.0%) | 9 (75.0%) |
| Health Technologists | 3 (50.0%) | 3 (50.0%) |
| Total (Category) | 23 (50.0%) | 23 (50.0%) |
| Total (Overall) | 78 (55.7%) | 62 (44.3%) |
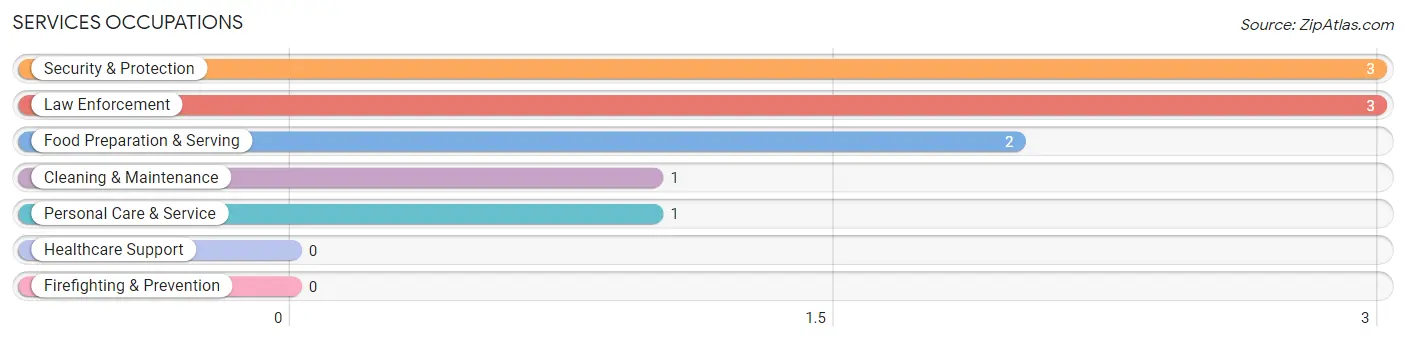
Services Occupations
The most common Services occupations in Snow Lake Shores are Security & Protection (3 | 2.1%), Law Enforcement (3 | 2.1%), Food Preparation & Serving (2 | 1.4%), Cleaning & Maintenance (1 | 0.7%), and Personal Care & Service (1 | 0.7%).
Services Occupations by Sex
Within the Services occupations in Snow Lake Shores, the most male-oriented occupations are Security & Protection (100.0%), and Law Enforcement (100.0%), while the most female-oriented occupations are Food Preparation & Serving (100.0%), Cleaning & Maintenance (100.0%), and Personal Care & Service (100.0%).
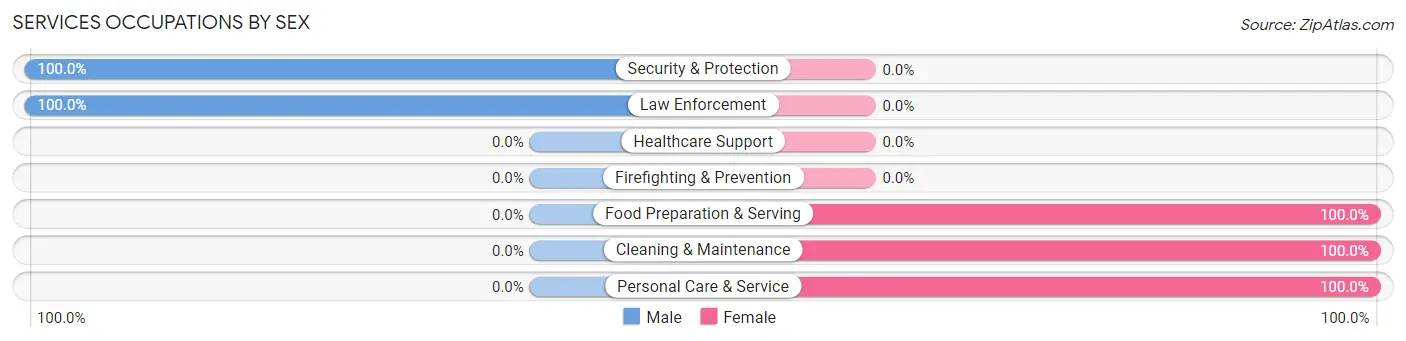
| Occupation | Male | Female |
| Healthcare Support | 0 (0.0%) | 0 (0.0%) |
| Security & Protection | 3 (100.0%) | 0 (0.0%) |
| Firefighting & Prevention | 0 (0.0%) | 0 (0.0%) |
| Law Enforcement | 3 (100.0%) | 0 (0.0%) |
| Food Preparation & Serving | 0 (0.0%) | 2 (100.0%) |
| Cleaning & Maintenance | 0 (0.0%) | 1 (100.0%) |
| Personal Care & Service | 0 (0.0%) | 1 (100.0%) |
| Total (Category) | 3 (42.9%) | 4 (57.1%) |
| Total (Overall) | 78 (55.7%) | 62 (44.3%) |
Sales and Office Occupations
The most common Sales and Office occupations in Snow Lake Shores are Office & Administration (19 | 13.6%), and Sales & Related (9 | 6.4%).
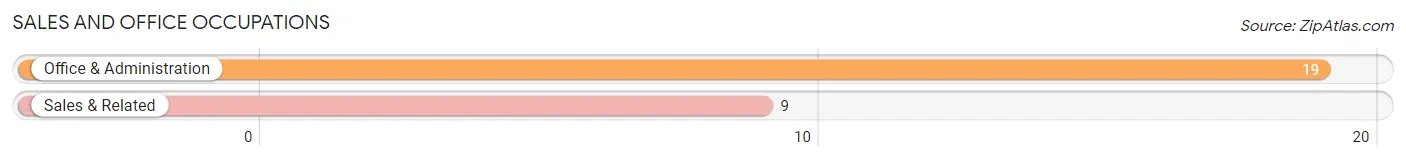
Sales and Office Occupations by Sex
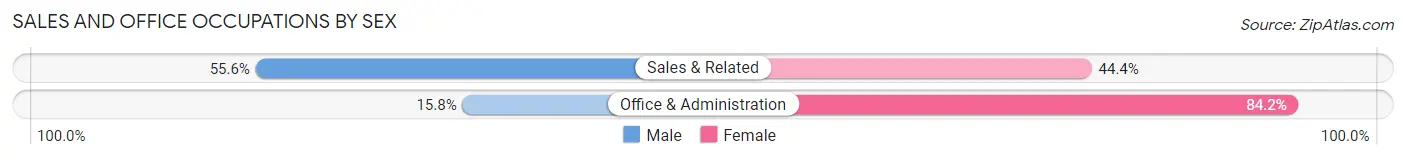
| Occupation | Male | Female |
| Sales & Related | 5 (55.6%) | 4 (44.4%) |
| Office & Administration | 3 (15.8%) | 16 (84.2%) |
| Total (Category) | 8 (28.6%) | 20 (71.4%) |
| Total (Overall) | 78 (55.7%) | 62 (44.3%) |
Natural Resources, Construction and Maintenance Occupations
The most common Natural Resources, Construction and Maintenance occupations in Snow Lake Shores are Construction & Extraction (8 | 5.7%), and Installation, Maintenance & Repair (5 | 3.6%).
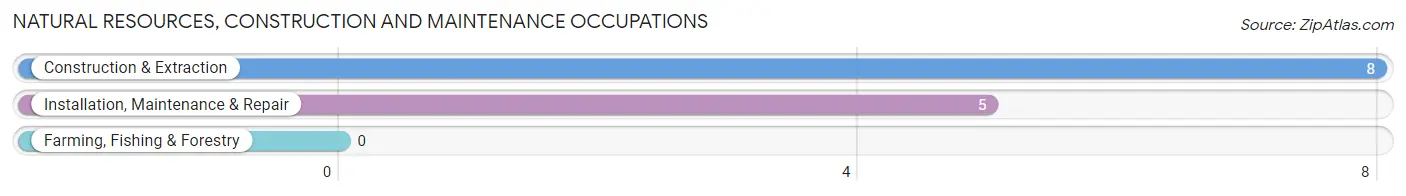
Natural Resources, Construction and Maintenance Occupations by Sex
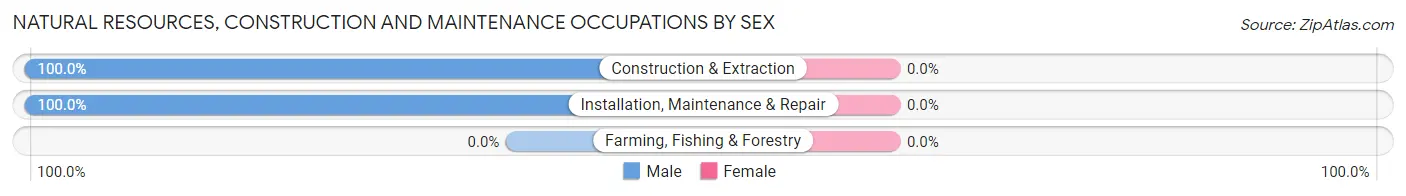
| Occupation | Male | Female |
| Farming, Fishing & Forestry | 0 (0.0%) | 0 (0.0%) |
| Construction & Extraction | 8 (100.0%) | 0 (0.0%) |
| Installation, Maintenance & Repair | 5 (100.0%) | 0 (0.0%) |
| Total (Category) | 13 (100.0%) | 0 (0.0%) |
| Total (Overall) | 78 (55.7%) | 62 (44.3%) |
Production, Transportation and Moving Occupations
The most common Production, Transportation and Moving occupations in Snow Lake Shores are Material Moving (18 | 12.9%), Production (14 | 10.0%), and Transportation (14 | 10.0%).
Production, Transportation and Moving Occupations by Sex
| Occupation | Male | Female |
| Production | 12 (85.7%) | 2 (14.3%) |
| Transportation | 7 (50.0%) | 7 (50.0%) |
| Material Moving | 12 (66.7%) | 6 (33.3%) |
| Total (Category) | 31 (67.4%) | 15 (32.6%) |
| Total (Overall) | 78 (55.7%) | 62 (44.3%) |
Employment Industries by Sex in Snow Lake Shores
Employment Industries in Snow Lake Shores
The major employment industries in Snow Lake Shores include Transportation & Warehousing (31 | 22.1%), Retail Trade (25 | 17.9%), Manufacturing (18 | 12.9%), Construction (13 | 9.3%), and Administrative & Support (11 | 7.9%).
Employment Industries by Sex in Snow Lake Shores
The Snow Lake Shores industries that see more men than women are Construction (100.0%), Information (100.0%), and Wholesale Trade (75.0%), whereas the industries that tend to have a higher number of women are Finance & Insurance (100.0%), Educational Services (100.0%), and Accommodation & Food Services (100.0%).
| Industry | Male | Female |
| Agriculture, Fishing & Hunting | 0 (0.0%) | 0 (0.0%) |
| Mining, Quarrying, & Extraction | 0 (0.0%) | 0 (0.0%) |
| Construction | 13 (100.0%) | 0 (0.0%) |
| Manufacturing | 11 (61.1%) | 7 (38.9%) |
| Wholesale Trade | 3 (75.0%) | 1 (25.0%) |
| Retail Trade | 13 (52.0%) | 12 (48.0%) |
| Transportation & Warehousing | 18 (58.1%) | 13 (41.9%) |
| Utilities | 0 (0.0%) | 0 (0.0%) |
| Information | 6 (100.0%) | 0 (0.0%) |
| Finance & Insurance | 0 (0.0%) | 3 (100.0%) |
| Real Estate, Rental & Leasing | 0 (0.0%) | 0 (0.0%) |
| Professional & Scientific | 2 (20.0%) | 8 (80.0%) |
| Enterprise Management | 0 (0.0%) | 0 (0.0%) |
| Administrative & Support | 6 (54.5%) | 5 (45.5%) |
| Educational Services | 0 (0.0%) | 1 (100.0%) |
| Health Care & Social Assistance | 3 (50.0%) | 3 (50.0%) |
| Arts, Entertainment & Recreation | 0 (0.0%) | 0 (0.0%) |
| Accommodation & Food Services | 0 (0.0%) | 3 (100.0%) |
| Public Administration | 3 (37.5%) | 5 (62.5%) |
| Total | 78 (55.7%) | 62 (44.3%) |
Education in Snow Lake Shores
School Enrollment in Snow Lake Shores
The most common levels of schooling among the 31 students in Snow Lake Shores are elementary school (9 | 29.0%), high school (9 | 29.0%), and college / undergraduate (8 | 25.8%).
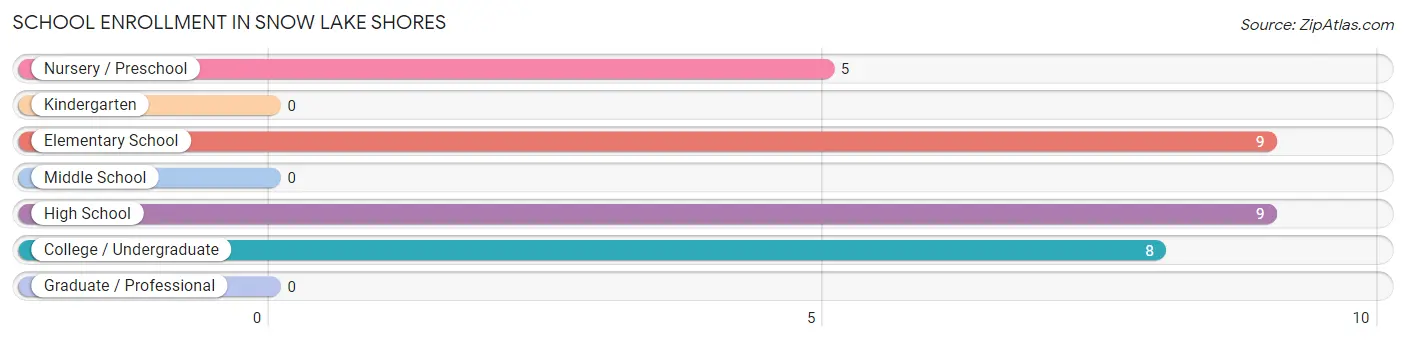
| School Level | # Students | % Students |
| Nursery / Preschool | 5 | 16.1% |
| Kindergarten | 0 | 0.0% |
| Elementary School | 9 | 29.0% |
| Middle School | 0 | 0.0% |
| High School | 9 | 29.0% |
| College / Undergraduate | 8 | 25.8% |
| Graduate / Professional | 0 | 0.0% |
| Total | 31 | 100.0% |
School Enrollment by Age by Funding Source in Snow Lake Shores
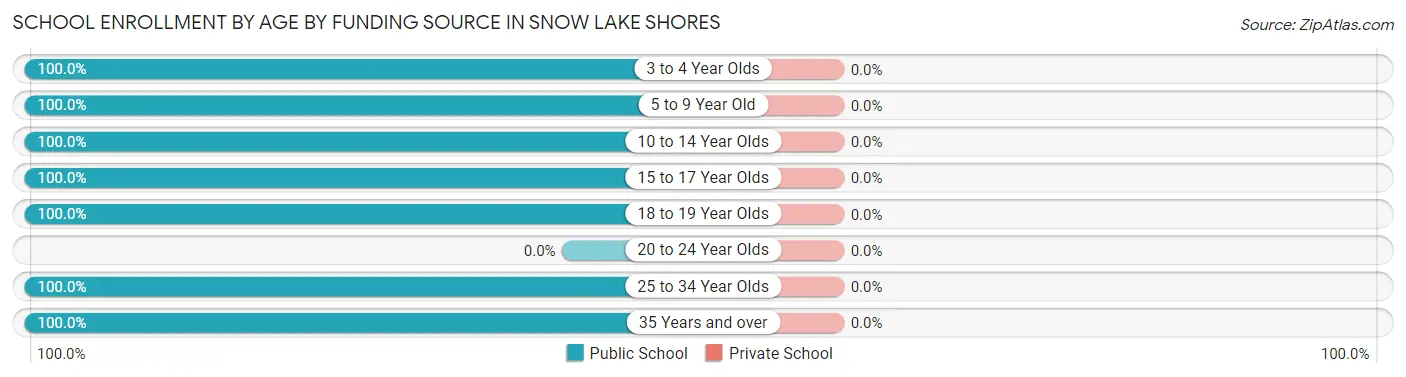
| Age Bracket | Public School | Private School |
| 3 to 4 Year Olds | 5 (100.0%) | 0 (0.0%) |
| 5 to 9 Year Old | 9 (100.0%) | 0 (0.0%) |
| 10 to 14 Year Olds | 4 (100.0%) | 0 (0.0%) |
| 15 to 17 Year Olds | 1 (100.0%) | 0 (0.0%) |
| 18 to 19 Year Olds | 3 (100.0%) | 0 (0.0%) |
| 20 to 24 Year Olds | 0 (0.0%) | 0 (0.0%) |
| 25 to 34 Year Olds | 5 (100.0%) | 0 (0.0%) |
| 35 Years and over | 4 (100.0%) | 0 (0.0%) |
| Total | 31 (100.0%) | 0 (0.0%) |
Educational Attainment by Field of Study in Snow Lake Shores
Business (17 | 22.1%), psychology (13 | 16.9%), education (10 | 13.0%), science & technology (9 | 11.7%), and visual & performing arts (8 | 10.4%) are the most common fields of study among 77 individuals in Snow Lake Shores who have obtained a bachelor's degree or higher.
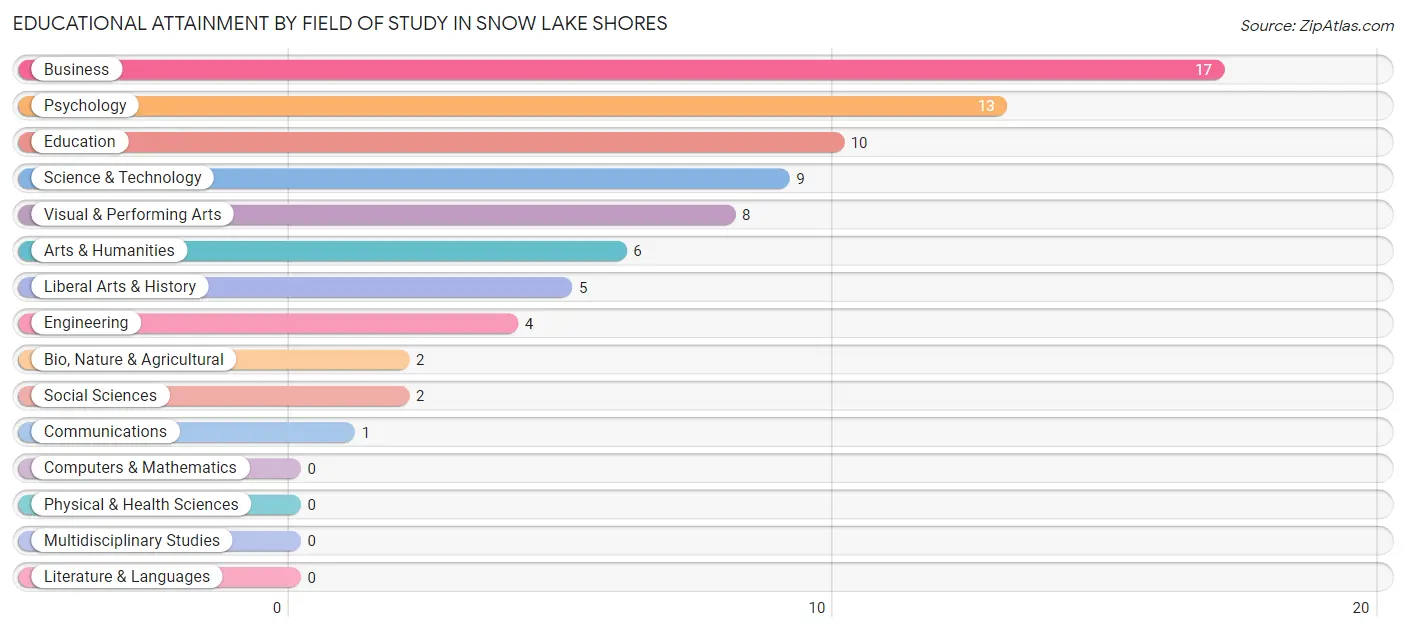
| Field of Study | # Graduates | % Graduates |
| Computers & Mathematics | 0 | 0.0% |
| Bio, Nature & Agricultural | 2 | 2.6% |
| Physical & Health Sciences | 0 | 0.0% |
| Psychology | 13 | 16.9% |
| Social Sciences | 2 | 2.6% |
| Engineering | 4 | 5.2% |
| Multidisciplinary Studies | 0 | 0.0% |
| Science & Technology | 9 | 11.7% |
| Business | 17 | 22.1% |
| Education | 10 | 13.0% |
| Literature & Languages | 0 | 0.0% |
| Liberal Arts & History | 5 | 6.5% |
| Visual & Performing Arts | 8 | 10.4% |
| Communications | 1 | 1.3% |
| Arts & Humanities | 6 | 7.8% |
| Total | 77 | 100.0% |
Transportation & Commute in Snow Lake Shores
Vehicle Availability by Sex in Snow Lake Shores
The most prevalent vehicle ownership categories in Snow Lake Shores are males with 2 vehicles (42, accounting for 53.8%) and females with 2 vehicles (39, making up 67.7%).
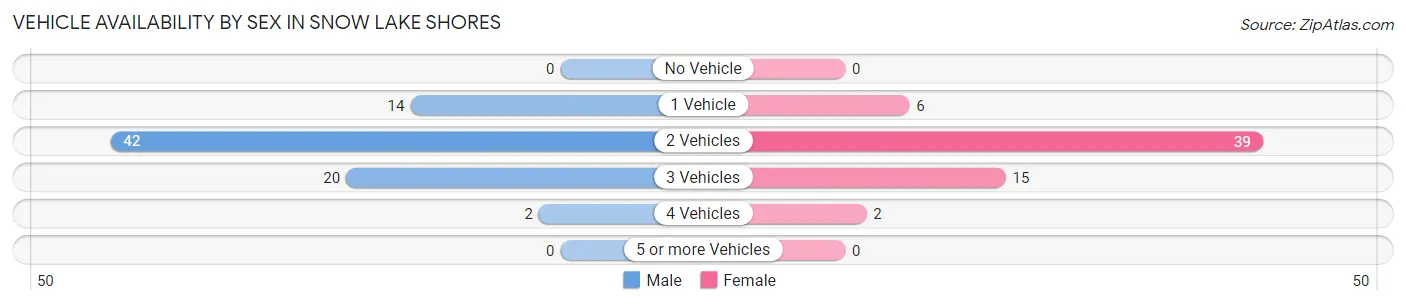
| Vehicles Available | Male | Female |
| No Vehicle | 0 (0.0%) | 0 (0.0%) |
| 1 Vehicle | 14 (17.9%) | 6 (9.7%) |
| 2 Vehicles | 42 (53.8%) | 39 (62.9%) |
| 3 Vehicles | 20 (25.6%) | 15 (24.2%) |
| 4 Vehicles | 2 (2.6%) | 2 (3.2%) |
| 5 or more Vehicles | 0 (0.0%) | 0 (0.0%) |
| Total | 78 (100.0%) | 62 (100.0%) |
Commute Time in Snow Lake Shores
The most frequently occuring commute durations in Snow Lake Shores are 60 to 89 minutes (30 commuters, 26.1%), 45 to 59 minutes (26 commuters, 22.6%), and 15 to 19 minutes (19 commuters, 16.5%).
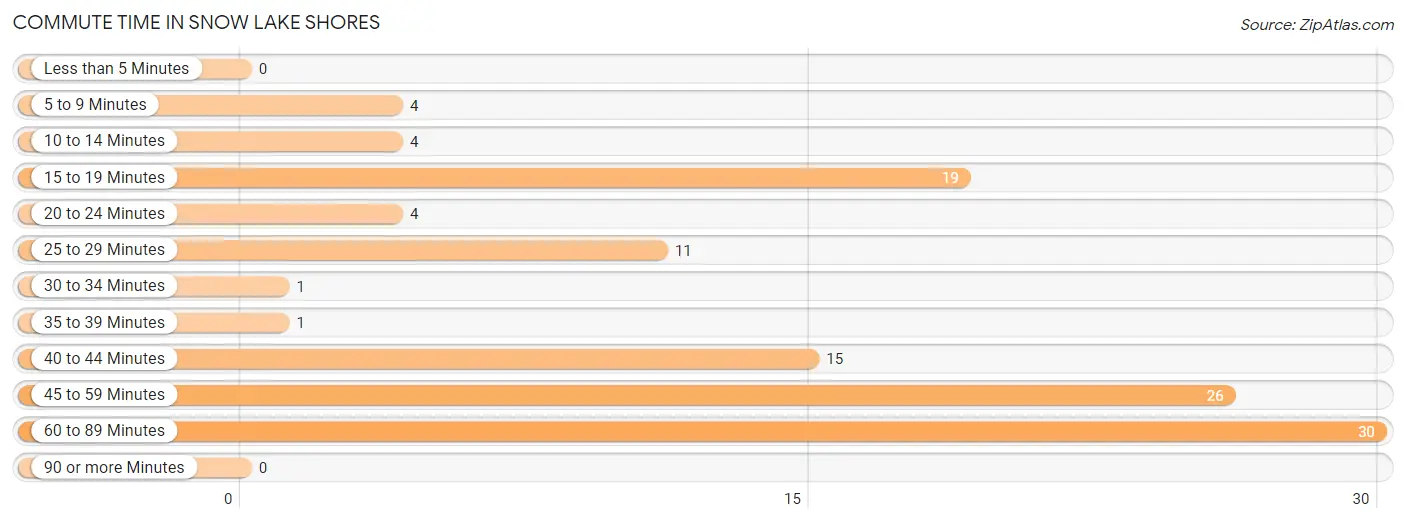
| Commute Time | # Commuters | % Commuters |
| Less than 5 Minutes | 0 | 0.0% |
| 5 to 9 Minutes | 4 | 3.5% |
| 10 to 14 Minutes | 4 | 3.5% |
| 15 to 19 Minutes | 19 | 16.5% |
| 20 to 24 Minutes | 4 | 3.5% |
| 25 to 29 Minutes | 11 | 9.6% |
| 30 to 34 Minutes | 1 | 0.9% |
| 35 to 39 Minutes | 1 | 0.9% |
| 40 to 44 Minutes | 15 | 13.0% |
| 45 to 59 Minutes | 26 | 22.6% |
| 60 to 89 Minutes | 30 | 26.1% |
| 90 or more Minutes | 0 | 0.0% |
Commute Time by Sex in Snow Lake Shores
The most common commute times in Snow Lake Shores are 60 to 89 minutes (25 commuters, 35.2%) for males and 15 to 19 minutes (15 commuters, 34.1%) for females.
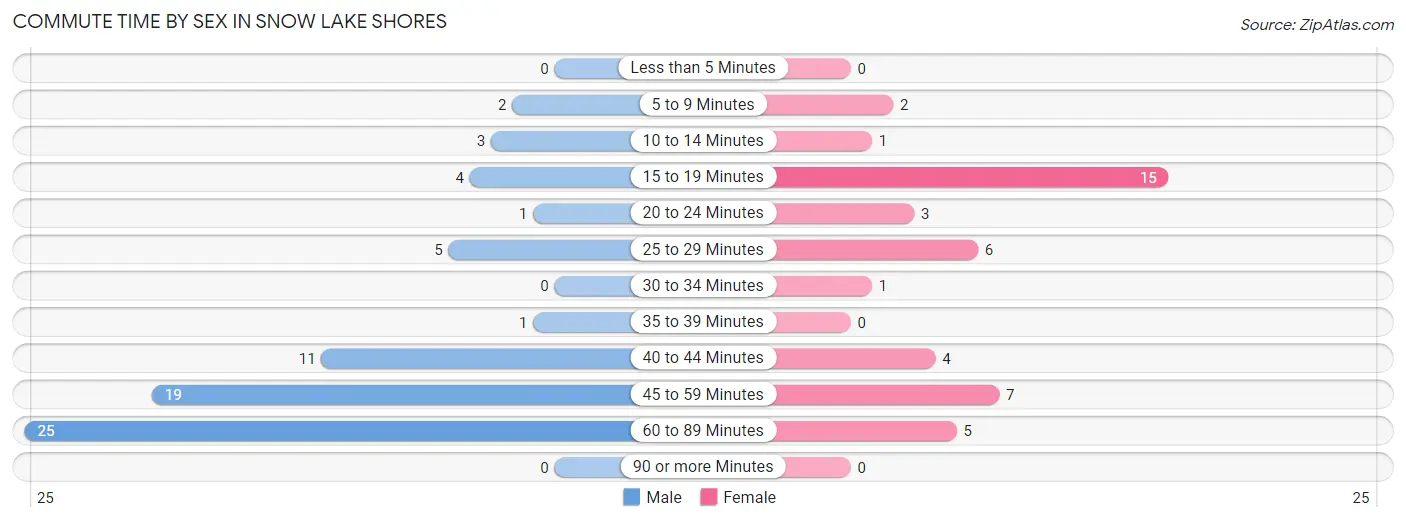
| Commute Time | Male | Female |
| Less than 5 Minutes | 0 (0.0%) | 0 (0.0%) |
| 5 to 9 Minutes | 2 (2.8%) | 2 (4.5%) |
| 10 to 14 Minutes | 3 (4.2%) | 1 (2.3%) |
| 15 to 19 Minutes | 4 (5.6%) | 15 (34.1%) |
| 20 to 24 Minutes | 1 (1.4%) | 3 (6.8%) |
| 25 to 29 Minutes | 5 (7.0%) | 6 (13.6%) |
| 30 to 34 Minutes | 0 (0.0%) | 1 (2.3%) |
| 35 to 39 Minutes | 1 (1.4%) | 0 (0.0%) |
| 40 to 44 Minutes | 11 (15.5%) | 4 (9.1%) |
| 45 to 59 Minutes | 19 (26.8%) | 7 (15.9%) |
| 60 to 89 Minutes | 25 (35.2%) | 5 (11.4%) |
| 90 or more Minutes | 0 (0.0%) | 0 (0.0%) |
Time of Departure to Work by Sex in Snow Lake Shores
The most frequent times of departure to work in Snow Lake Shores are 12:00 AM to 4:59 AM (20, 28.2%) for males and 7:00 AM to 7:29 AM (17, 38.6%) for females.
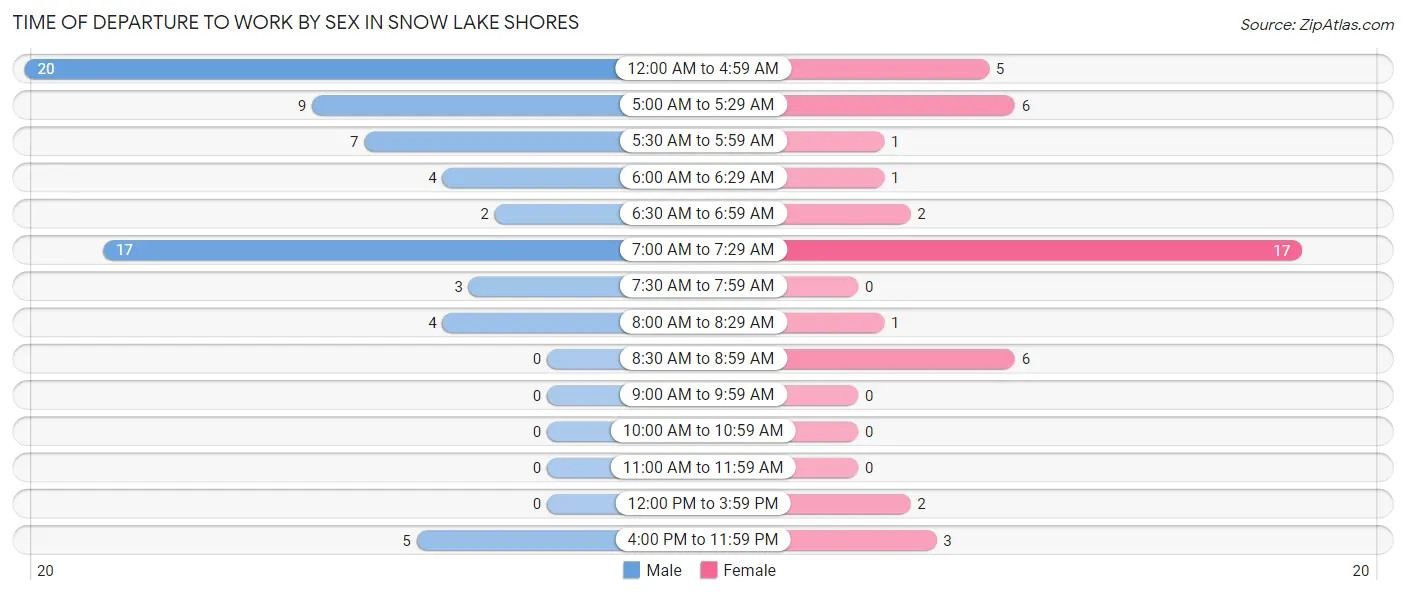
| Time of Departure | Male | Female |
| 12:00 AM to 4:59 AM | 20 (28.2%) | 5 (11.4%) |
| 5:00 AM to 5:29 AM | 9 (12.7%) | 6 (13.6%) |
| 5:30 AM to 5:59 AM | 7 (9.9%) | 1 (2.3%) |
| 6:00 AM to 6:29 AM | 4 (5.6%) | 1 (2.3%) |
| 6:30 AM to 6:59 AM | 2 (2.8%) | 2 (4.5%) |
| 7:00 AM to 7:29 AM | 17 (23.9%) | 17 (38.6%) |
| 7:30 AM to 7:59 AM | 3 (4.2%) | 0 (0.0%) |
| 8:00 AM to 8:29 AM | 4 (5.6%) | 1 (2.3%) |
| 8:30 AM to 8:59 AM | 0 (0.0%) | 6 (13.6%) |
| 9:00 AM to 9:59 AM | 0 (0.0%) | 0 (0.0%) |
| 10:00 AM to 10:59 AM | 0 (0.0%) | 0 (0.0%) |
| 11:00 AM to 11:59 AM | 0 (0.0%) | 0 (0.0%) |
| 12:00 PM to 3:59 PM | 0 (0.0%) | 2 (4.5%) |
| 4:00 PM to 11:59 PM | 5 (7.0%) | 3 (6.8%) |
| Total | 71 (100.0%) | 44 (100.0%) |
Housing Occupancy in Snow Lake Shores
Occupancy by Ownership in Snow Lake Shores
Of the total 209 dwellings in Snow Lake Shores, owner-occupied units account for 187 (89.5%), while renter-occupied units make up 22 (10.5%).
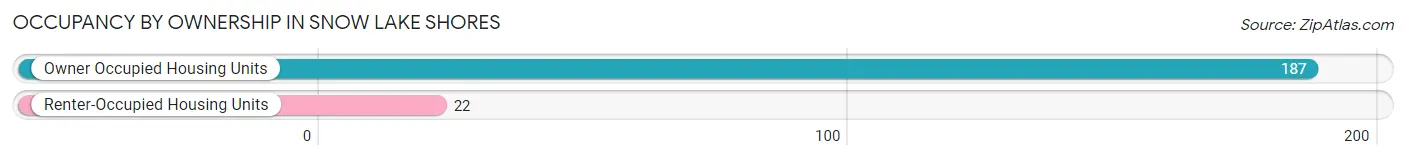
| Occupancy | # Housing Units | % Housing Units |
| Owner Occupied Housing Units | 187 | 89.5% |
| Renter-Occupied Housing Units | 22 | 10.5% |
| Total Occupied Housing Units | 209 | 100.0% |
Occupancy by Household Size in Snow Lake Shores
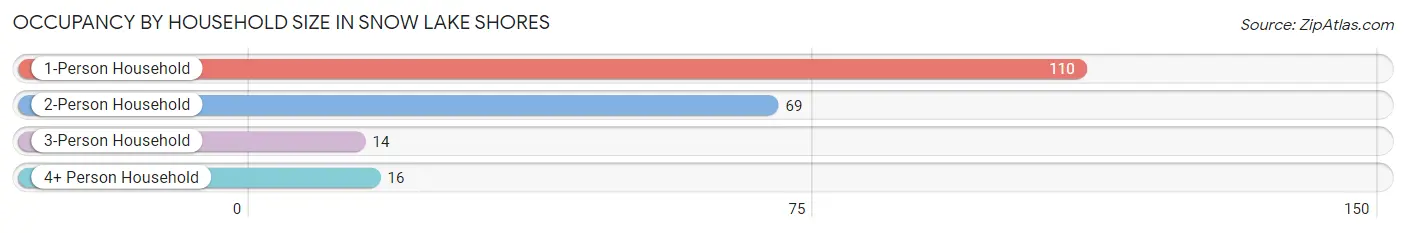
| Household Size | # Housing Units | % Housing Units |
| 1-Person Household | 110 | 52.6% |
| 2-Person Household | 69 | 33.0% |
| 3-Person Household | 14 | 6.7% |
| 4+ Person Household | 16 | 7.7% |
| Total Housing Units | 209 | 100.0% |
Occupancy by Ownership by Household Size in Snow Lake Shores
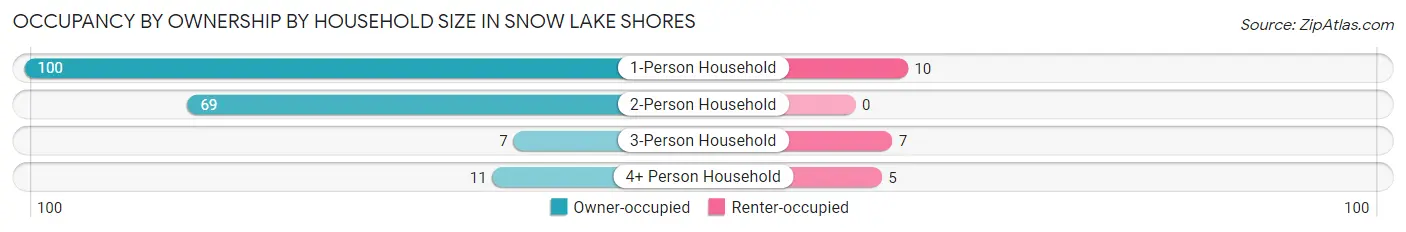
| Household Size | Owner-occupied | Renter-occupied |
| 1-Person Household | 100 (90.9%) | 10 (9.1%) |
| 2-Person Household | 69 (100.0%) | 0 (0.0%) |
| 3-Person Household | 7 (50.0%) | 7 (50.0%) |
| 4+ Person Household | 11 (68.8%) | 5 (31.2%) |
| Total Housing Units | 187 (89.5%) | 22 (10.5%) |
Occupancy by Educational Attainment in Snow Lake Shores
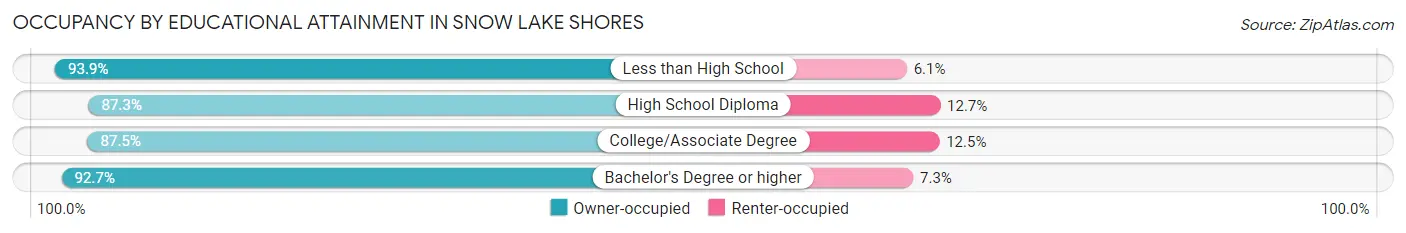
| Household Size | Owner-occupied | Renter-occupied |
| Less than High School | 31 (93.9%) | 2 (6.1%) |
| High School Diploma | 62 (87.3%) | 9 (12.7%) |
| College/Associate Degree | 56 (87.5%) | 8 (12.5%) |
| Bachelor's Degree or higher | 38 (92.7%) | 3 (7.3%) |
Occupancy by Age of Householder in Snow Lake Shores
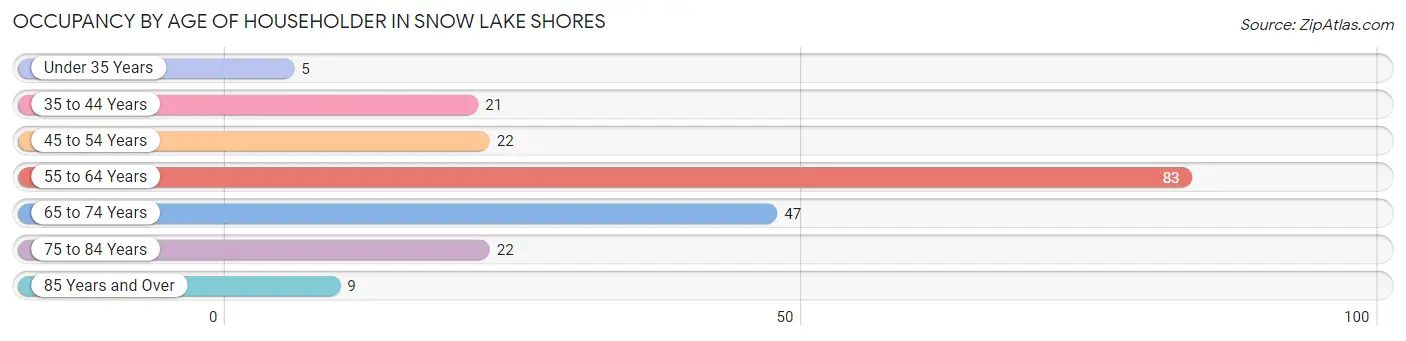
| Age Bracket | # Households | % Households |
| Under 35 Years | 5 | 2.4% |
| 35 to 44 Years | 21 | 10.1% |
| 45 to 54 Years | 22 | 10.5% |
| 55 to 64 Years | 83 | 39.7% |
| 65 to 74 Years | 47 | 22.5% |
| 75 to 84 Years | 22 | 10.5% |
| 85 Years and Over | 9 | 4.3% |
| Total | 209 | 100.0% |
Housing Finances in Snow Lake Shores
Median Income by Occupancy in Snow Lake Shores
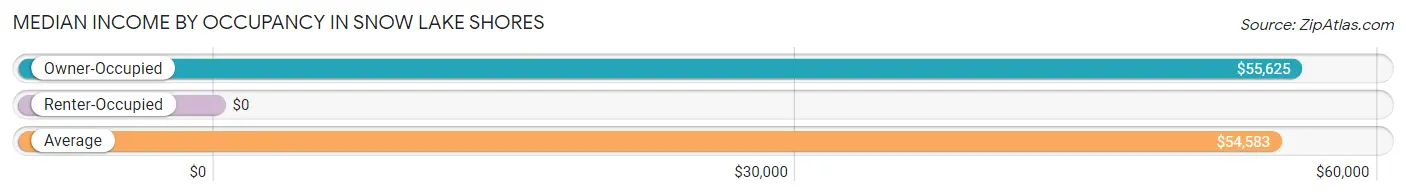
| Occupancy Type | # Households | Median Income |
| Owner-Occupied | 187 (89.5%) | $55,625 |
| Renter-Occupied | 22 (10.5%) | $0 |
| Average | 209 (100.0%) | $54,583 |
Occupancy by Householder Income Bracket in Snow Lake Shores
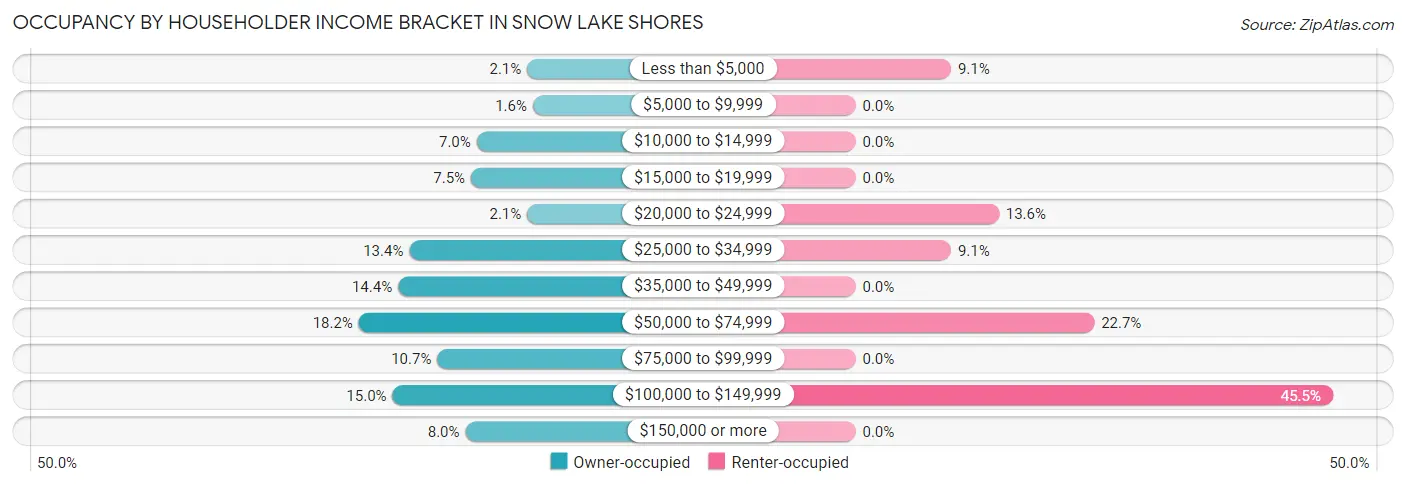
| Income Bracket | Owner-occupied | Renter-occupied |
| Less than $5,000 | 4 (2.1%) | 2 (9.1%) |
| $5,000 to $9,999 | 3 (1.6%) | 0 (0.0%) |
| $10,000 to $14,999 | 13 (7.0%) | 0 (0.0%) |
| $15,000 to $19,999 | 14 (7.5%) | 0 (0.0%) |
| $20,000 to $24,999 | 4 (2.1%) | 3 (13.6%) |
| $25,000 to $34,999 | 25 (13.4%) | 2 (9.1%) |
| $35,000 to $49,999 | 27 (14.4%) | 0 (0.0%) |
| $50,000 to $74,999 | 34 (18.2%) | 5 (22.7%) |
| $75,000 to $99,999 | 20 (10.7%) | 0 (0.0%) |
| $100,000 to $149,999 | 28 (15.0%) | 10 (45.5%) |
| $150,000 or more | 15 (8.0%) | 0 (0.0%) |
| Total | 187 (100.0%) | 22 (100.0%) |
Monthly Housing Cost Tiers in Snow Lake Shores
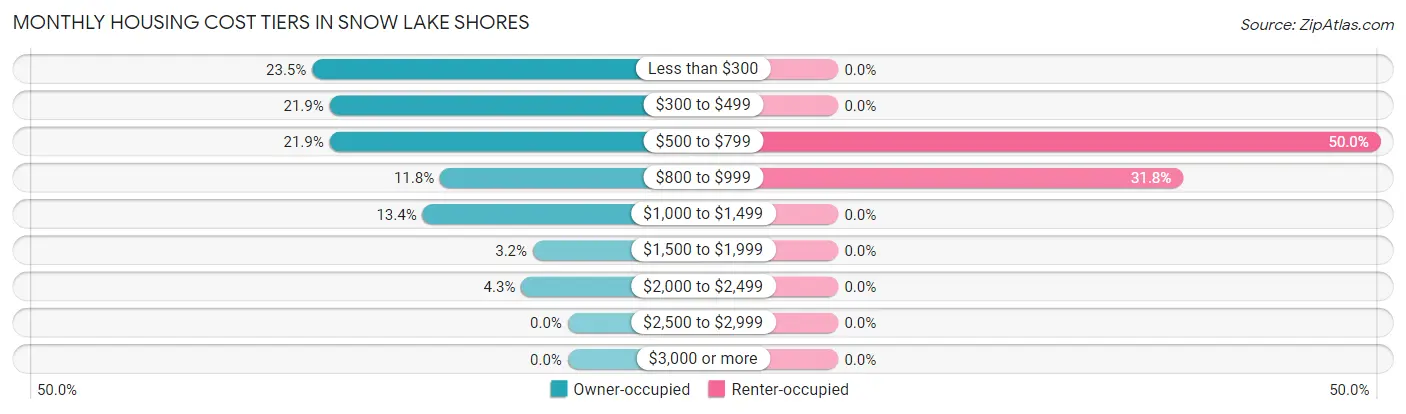
| Monthly Cost | Owner-occupied | Renter-occupied |
| Less than $300 | 44 (23.5%) | 0 (0.0%) |
| $300 to $499 | 41 (21.9%) | 0 (0.0%) |
| $500 to $799 | 41 (21.9%) | 11 (50.0%) |
| $800 to $999 | 22 (11.8%) | 7 (31.8%) |
| $1,000 to $1,499 | 25 (13.4%) | 0 (0.0%) |
| $1,500 to $1,999 | 6 (3.2%) | 0 (0.0%) |
| $2,000 to $2,499 | 8 (4.3%) | 0 (0.0%) |
| $2,500 to $2,999 | 0 (0.0%) | 0 (0.0%) |
| $3,000 or more | 0 (0.0%) | 0 (0.0%) |
| Total | 187 (100.0%) | 22 (100.0%) |
Physical Housing Characteristics in Snow Lake Shores
Housing Structures in Snow Lake Shores
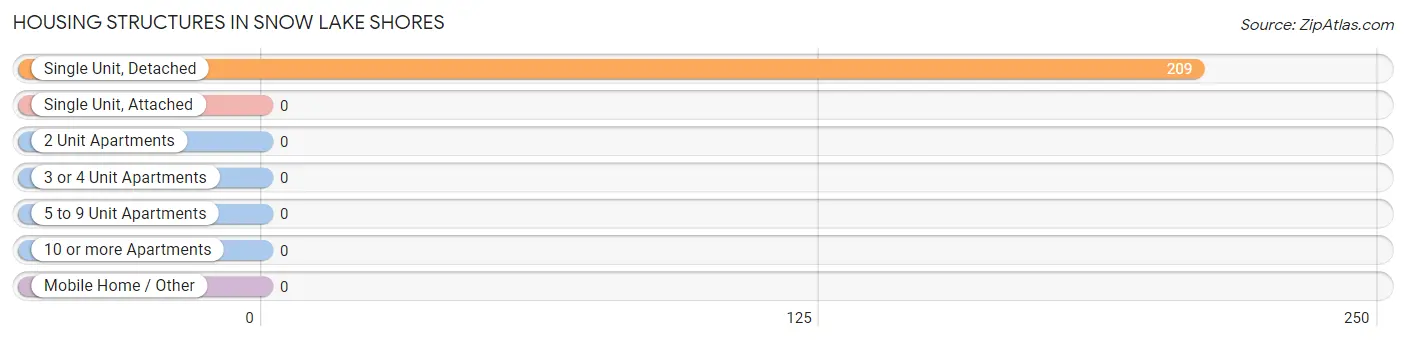
| Structure Type | # Housing Units | % Housing Units |
| Single Unit, Detached | 209 | 100.0% |
| Single Unit, Attached | 0 | 0.0% |
| 2 Unit Apartments | 0 | 0.0% |
| 3 or 4 Unit Apartments | 0 | 0.0% |
| 5 to 9 Unit Apartments | 0 | 0.0% |
| 10 or more Apartments | 0 | 0.0% |
| Mobile Home / Other | 0 | 0.0% |
| Total | 209 | 100.0% |
Housing Structures by Occupancy in Snow Lake Shores
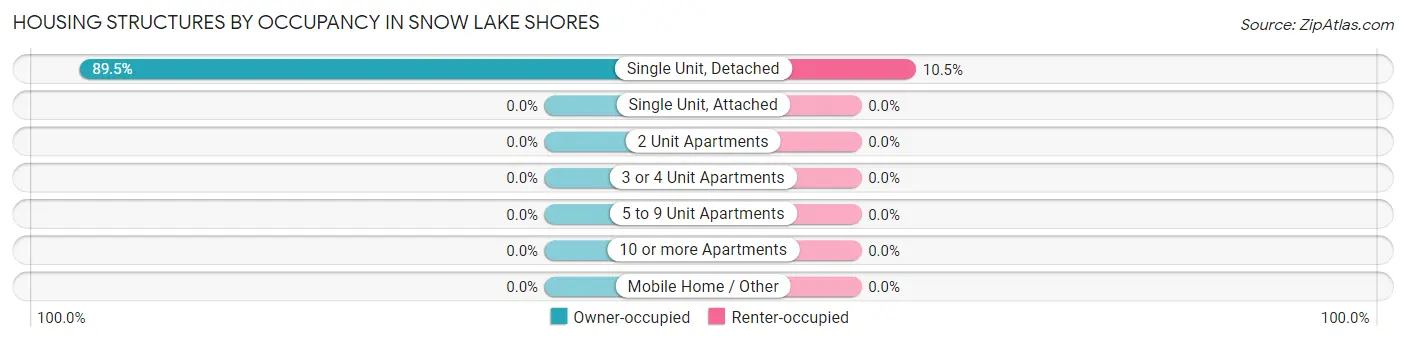
| Structure Type | Owner-occupied | Renter-occupied |
| Single Unit, Detached | 187 (89.5%) | 22 (10.5%) |
| Single Unit, Attached | 0 (0.0%) | 0 (0.0%) |
| 2 Unit Apartments | 0 (0.0%) | 0 (0.0%) |
| 3 or 4 Unit Apartments | 0 (0.0%) | 0 (0.0%) |
| 5 to 9 Unit Apartments | 0 (0.0%) | 0 (0.0%) |
| 10 or more Apartments | 0 (0.0%) | 0 (0.0%) |
| Mobile Home / Other | 0 (0.0%) | 0 (0.0%) |
| Total | 187 (89.5%) | 22 (10.5%) |
Housing Structures by Number of Rooms in Snow Lake Shores
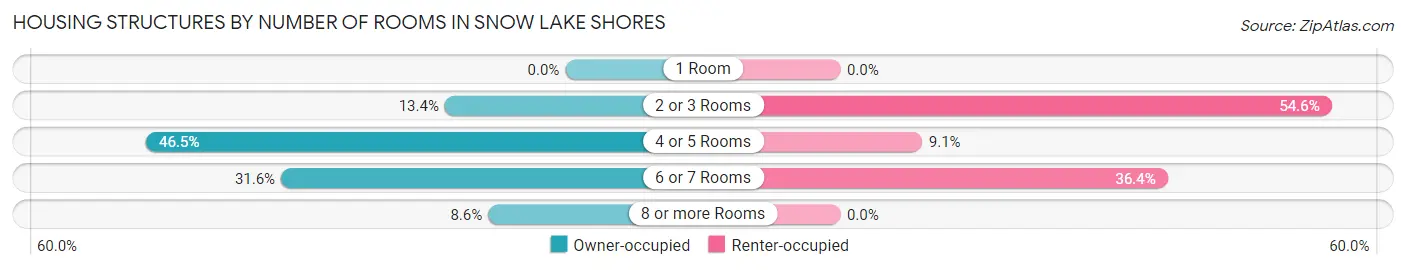
| Number of Rooms | Owner-occupied | Renter-occupied |
| 1 Room | 0 (0.0%) | 0 (0.0%) |
| 2 or 3 Rooms | 25 (13.4%) | 12 (54.5%) |
| 4 or 5 Rooms | 87 (46.5%) | 2 (9.1%) |
| 6 or 7 Rooms | 59 (31.6%) | 8 (36.4%) |
| 8 or more Rooms | 16 (8.6%) | 0 (0.0%) |
| Total | 187 (100.0%) | 22 (100.0%) |
Housing Structure by Heating Type in Snow Lake Shores
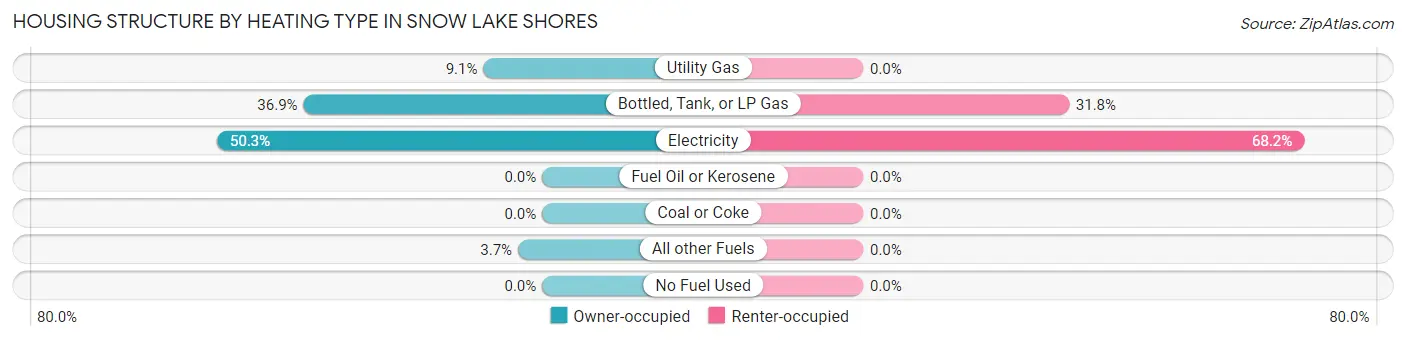
| Heating Type | Owner-occupied | Renter-occupied |
| Utility Gas | 17 (9.1%) | 0 (0.0%) |
| Bottled, Tank, or LP Gas | 69 (36.9%) | 7 (31.8%) |
| Electricity | 94 (50.3%) | 15 (68.2%) |
| Fuel Oil or Kerosene | 0 (0.0%) | 0 (0.0%) |
| Coal or Coke | 0 (0.0%) | 0 (0.0%) |
| All other Fuels | 7 (3.7%) | 0 (0.0%) |
| No Fuel Used | 0 (0.0%) | 0 (0.0%) |
| Total | 187 (100.0%) | 22 (100.0%) |
Household Vehicle Usage in Snow Lake Shores
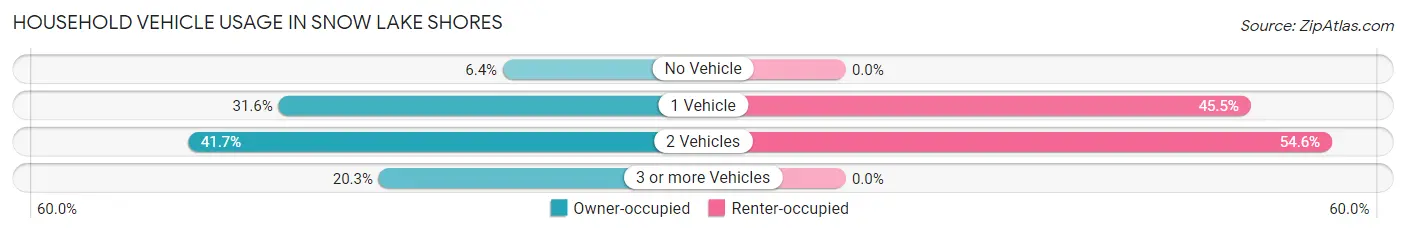
| Vehicles per Household | Owner-occupied | Renter-occupied |
| No Vehicle | 12 (6.4%) | 0 (0.0%) |
| 1 Vehicle | 59 (31.6%) | 10 (45.5%) |
| 2 Vehicles | 78 (41.7%) | 12 (54.5%) |
| 3 or more Vehicles | 38 (20.3%) | 0 (0.0%) |
| Total | 187 (100.0%) | 22 (100.0%) |
Real Estate & Mortgages in Snow Lake Shores
Real Estate and Mortgage Overview in Snow Lake Shores
| Characteristic | Without Mortgage | With Mortgage |
| Housing Units | 101 | 86 |
| Median Property Value | $112,500 | $143,800 |
| Median Household Income | $35,893 | $3 |
| Monthly Housing Costs | $325 | $0 |
| Real Estate Taxes | $560 | $9 |
Property Value by Mortgage Status in Snow Lake Shores
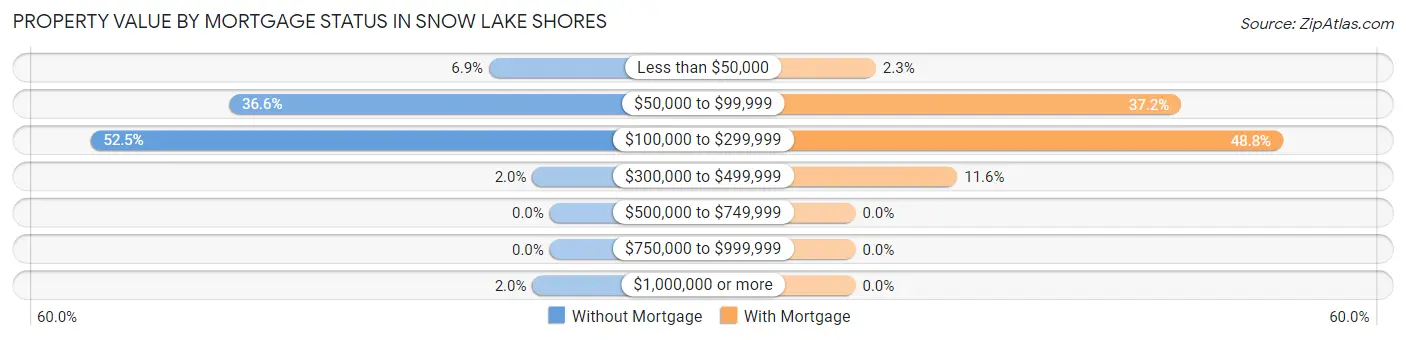
| Property Value | Without Mortgage | With Mortgage |
| Less than $50,000 | 7 (6.9%) | 2 (2.3%) |
| $50,000 to $99,999 | 37 (36.6%) | 32 (37.2%) |
| $100,000 to $299,999 | 53 (52.5%) | 42 (48.8%) |
| $300,000 to $499,999 | 2 (2.0%) | 10 (11.6%) |
| $500,000 to $749,999 | 0 (0.0%) | 0 (0.0%) |
| $750,000 to $999,999 | 0 (0.0%) | 0 (0.0%) |
| $1,000,000 or more | 2 (2.0%) | 0 (0.0%) |
| Total | 101 (100.0%) | 86 (100.0%) |
Household Income by Mortgage Status in Snow Lake Shores
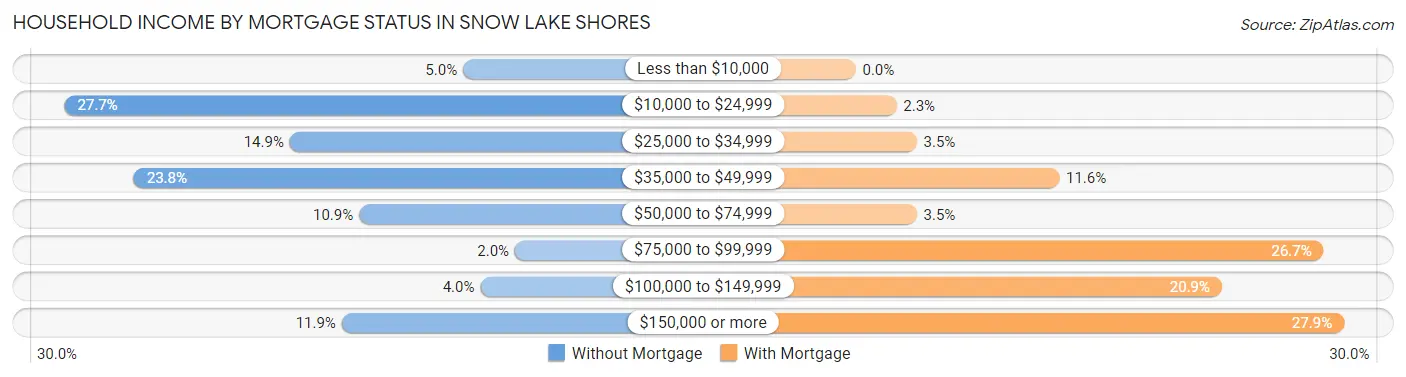
| Household Income | Without Mortgage | With Mortgage |
| Less than $10,000 | 5 (5.0%) | 0 (0.0%) |
| $10,000 to $24,999 | 28 (27.7%) | 2 (2.3%) |
| $25,000 to $34,999 | 15 (14.8%) | 3 (3.5%) |
| $35,000 to $49,999 | 24 (23.8%) | 10 (11.6%) |
| $50,000 to $74,999 | 11 (10.9%) | 3 (3.5%) |
| $75,000 to $99,999 | 2 (2.0%) | 23 (26.7%) |
| $100,000 to $149,999 | 4 (4.0%) | 18 (20.9%) |
| $150,000 or more | 12 (11.9%) | 24 (27.9%) |
| Total | 101 (100.0%) | 86 (100.0%) |
Property Value to Household Income Ratio in Snow Lake Shores
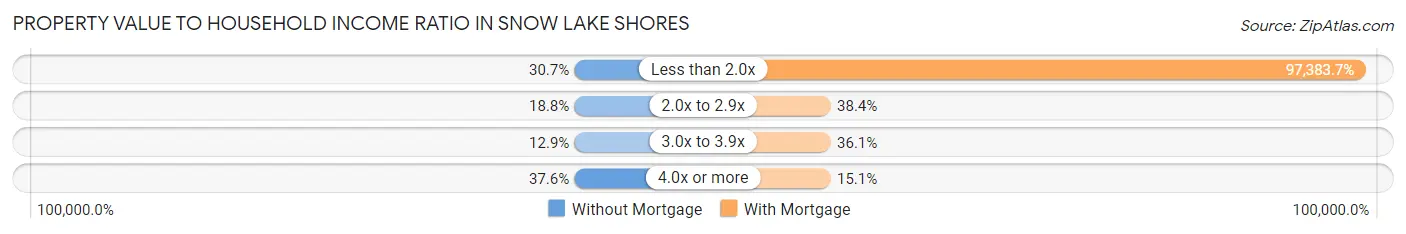
| Value-to-Income Ratio | Without Mortgage | With Mortgage |
| Less than 2.0x | 31 (30.7%) | 83,750 (97,383.7%) |
| 2.0x to 2.9x | 19 (18.8%) | 33 (38.4%) |
| 3.0x to 3.9x | 13 (12.9%) | 31 (36.0%) |
| 4.0x or more | 38 (37.6%) | 13 (15.1%) |
| Total | 101 (100.0%) | 86 (100.0%) |
Real Estate Taxes by Mortgage Status in Snow Lake Shores
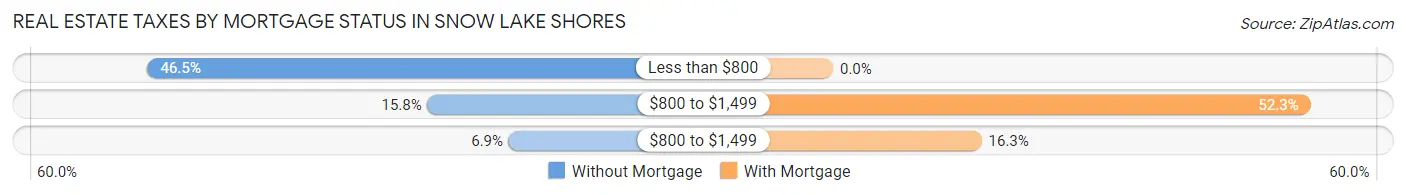
| Property Taxes | Without Mortgage | With Mortgage |
| Less than $800 | 47 (46.5%) | 0 (0.0%) |
| $800 to $1,499 | 16 (15.8%) | 45 (52.3%) |
| $800 to $1,499 | 7 (6.9%) | 14 (16.3%) |
| Total | 101 (100.0%) | 86 (100.0%) |
Health & Disability in Snow Lake Shores
Health Insurance Coverage by Age in Snow Lake Shores
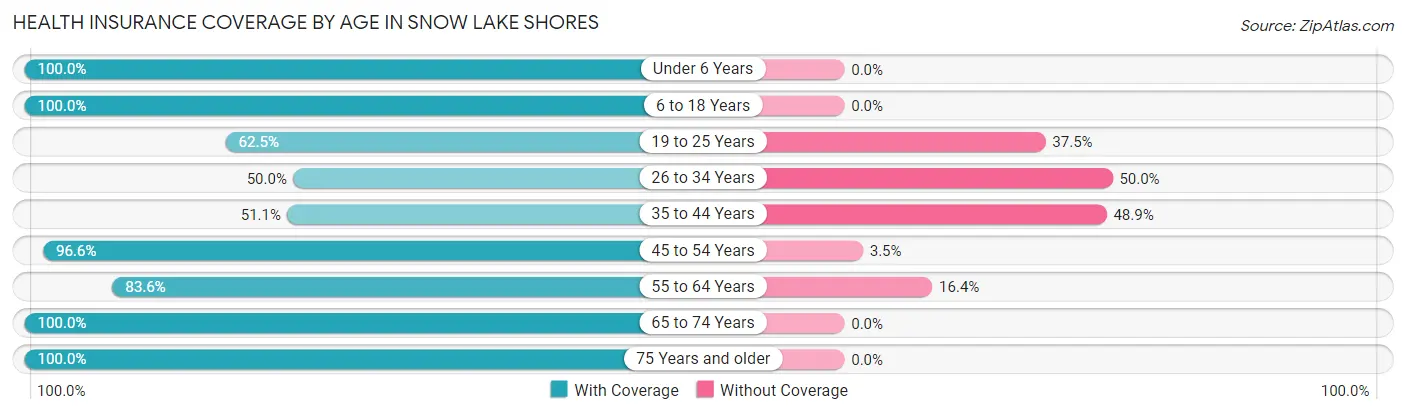
| Age Bracket | With Coverage | Without Coverage |
| Under 6 Years | 12 (100.0%) | 0 (0.0%) |
| 6 to 18 Years | 14 (100.0%) | 0 (0.0%) |
| 19 to 25 Years | 5 (62.5%) | 3 (37.5%) |
| 26 to 34 Years | 6 (50.0%) | 6 (50.0%) |
| 35 to 44 Years | 23 (51.1%) | 22 (48.9%) |
| 45 to 54 Years | 28 (96.6%) | 1 (3.5%) |
| 55 to 64 Years | 97 (83.6%) | 19 (16.4%) |
| 65 to 74 Years | 78 (100.0%) | 0 (0.0%) |
| 75 Years and older | 50 (100.0%) | 0 (0.0%) |
| Total | 313 (86.0%) | 51 (14.0%) |
Health Insurance Coverage by Citizenship Status in Snow Lake Shores
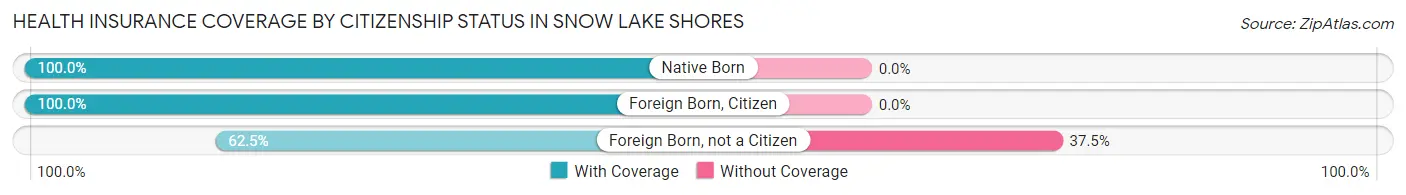
| Citizenship Status | With Coverage | Without Coverage |
| Native Born | 12 (100.0%) | 0 (0.0%) |
| Foreign Born, Citizen | 14 (100.0%) | 0 (0.0%) |
| Foreign Born, not a Citizen | 5 (62.5%) | 3 (37.5%) |
Health Insurance Coverage by Household Income in Snow Lake Shores
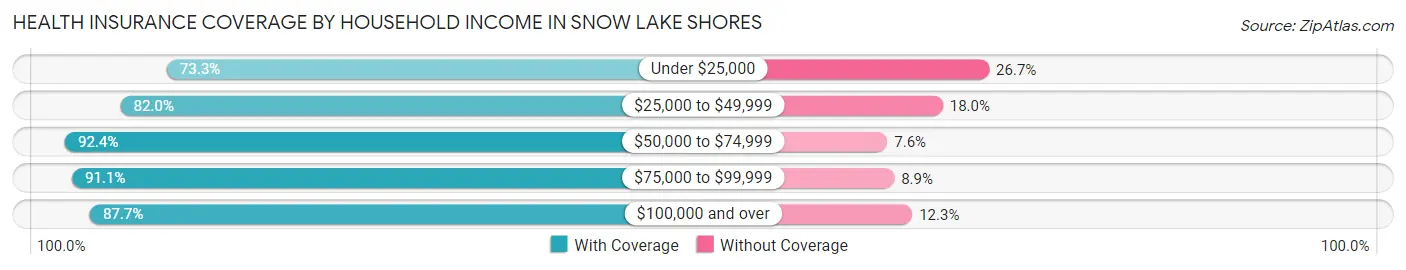
| Household Income | With Coverage | Without Coverage |
| Under $25,000 | 33 (73.3%) | 12 (26.7%) |
| $25,000 to $49,999 | 73 (82.0%) | 16 (18.0%) |
| $50,000 to $74,999 | 73 (92.4%) | 6 (7.6%) |
| $75,000 to $99,999 | 41 (91.1%) | 4 (8.9%) |
| $100,000 and over | 93 (87.7%) | 13 (12.3%) |
Public vs Private Health Insurance Coverage by Age in Snow Lake Shores
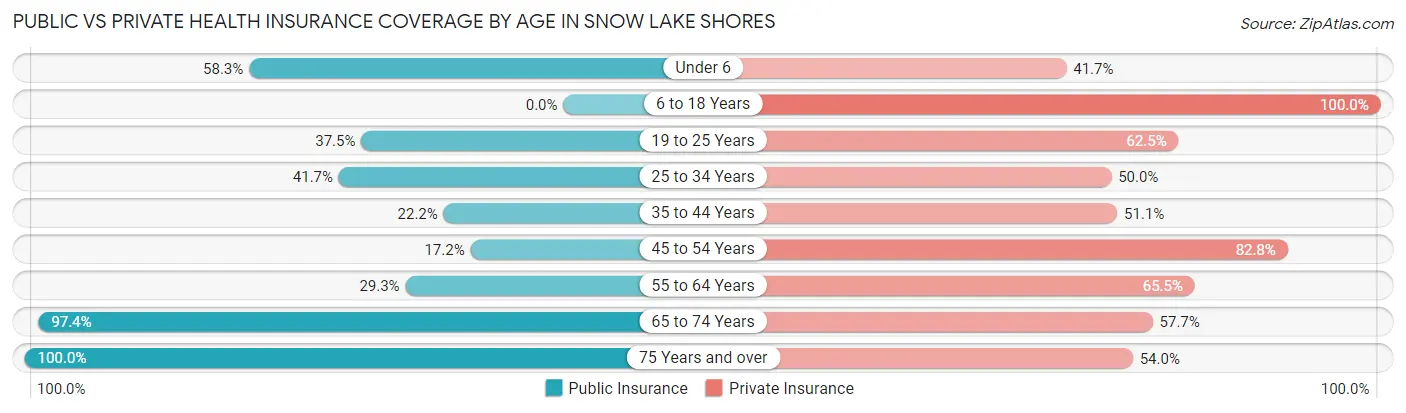
| Age Bracket | Public Insurance | Private Insurance |
| Under 6 | 7 (58.3%) | 5 (41.7%) |
| 6 to 18 Years | 0 (0.0%) | 14 (100.0%) |
| 19 to 25 Years | 3 (37.5%) | 5 (62.5%) |
| 25 to 34 Years | 5 (41.7%) | 6 (50.0%) |
| 35 to 44 Years | 10 (22.2%) | 23 (51.1%) |
| 45 to 54 Years | 5 (17.2%) | 24 (82.8%) |
| 55 to 64 Years | 34 (29.3%) | 76 (65.5%) |
| 65 to 74 Years | 76 (97.4%) | 45 (57.7%) |
| 75 Years and over | 50 (100.0%) | 27 (54.0%) |
| Total | 190 (52.2%) | 225 (61.8%) |
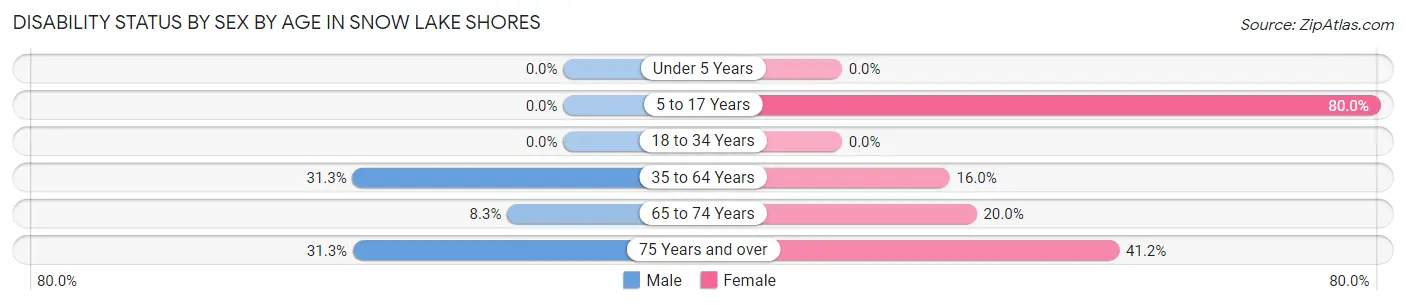
Disability Status by Sex by Age in Snow Lake Shores
| Age Bracket | Male | Female |
| Under 5 Years | 0 (0.0%) | 0 (0.0%) |
| 5 to 17 Years | 0 (0.0%) | 4 (80.0%) |
| 18 to 34 Years | 0 (0.0%) | 0 (0.0%) |
| 35 to 64 Years | 36 (31.3%) | 12 (16.0%) |
| 65 to 74 Years | 4 (8.3%) | 6 (20.0%) |
| 75 Years and over | 5 (31.2%) | 14 (41.2%) |
Disability Class by Sex by Age in Snow Lake Shores
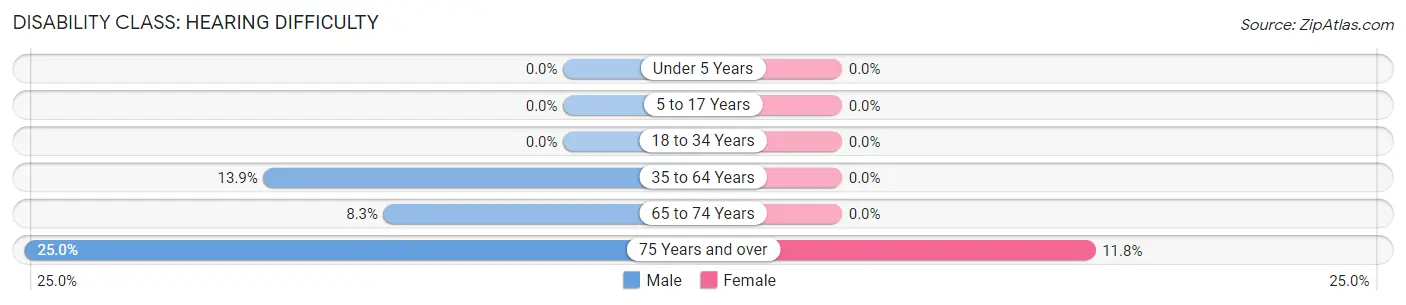
Disability Class: Hearing Difficulty
| Age Bracket | Male | Female |
| Under 5 Years | 0 (0.0%) | 0 (0.0%) |
| 5 to 17 Years | 0 (0.0%) | 0 (0.0%) |
| 18 to 34 Years | 0 (0.0%) | 0 (0.0%) |
| 35 to 64 Years | 16 (13.9%) | 0 (0.0%) |
| 65 to 74 Years | 4 (8.3%) | 0 (0.0%) |
| 75 Years and over | 4 (25.0%) | 4 (11.8%) |
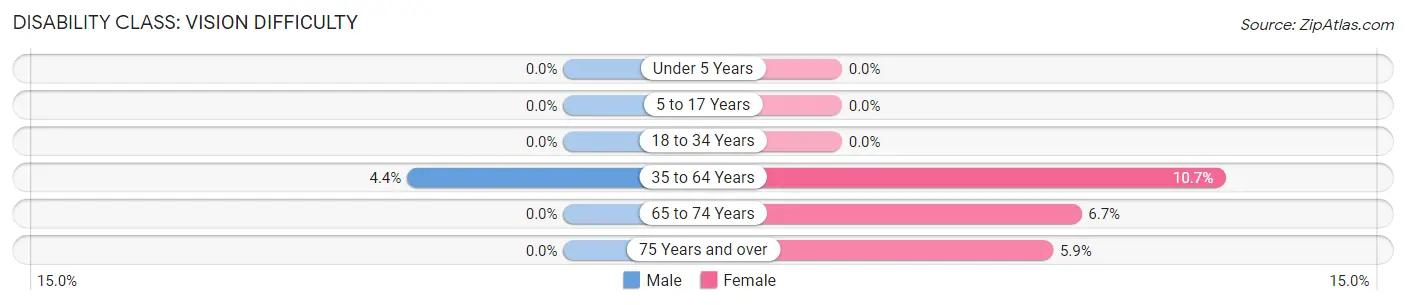
Disability Class: Vision Difficulty
| Age Bracket | Male | Female |
| Under 5 Years | 0 (0.0%) | 0 (0.0%) |
| 5 to 17 Years | 0 (0.0%) | 0 (0.0%) |
| 18 to 34 Years | 0 (0.0%) | 0 (0.0%) |
| 35 to 64 Years | 5 (4.3%) | 8 (10.7%) |
| 65 to 74 Years | 0 (0.0%) | 2 (6.7%) |
| 75 Years and over | 0 (0.0%) | 2 (5.9%) |
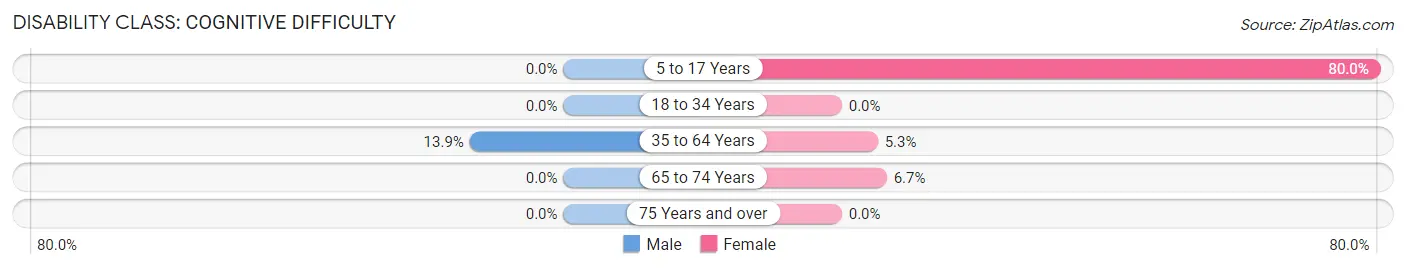
Disability Class: Cognitive Difficulty
| Age Bracket | Male | Female |
| 5 to 17 Years | 0 (0.0%) | 4 (80.0%) |
| 18 to 34 Years | 0 (0.0%) | 0 (0.0%) |
| 35 to 64 Years | 16 (13.9%) | 4 (5.3%) |
| 65 to 74 Years | 0 (0.0%) | 2 (6.7%) |
| 75 Years and over | 0 (0.0%) | 0 (0.0%) |
Disability Class: Ambulatory Difficulty
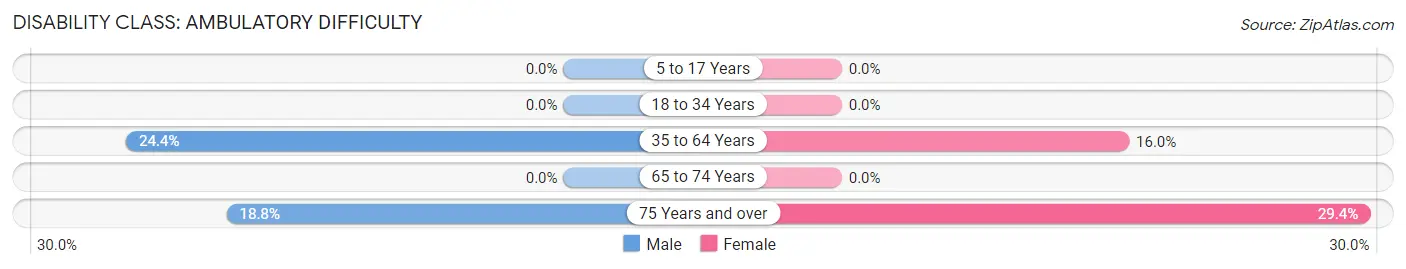
| Age Bracket | Male | Female |
| 5 to 17 Years | 0 (0.0%) | 0 (0.0%) |
| 18 to 34 Years | 0 (0.0%) | 0 (0.0%) |
| 35 to 64 Years | 28 (24.3%) | 12 (16.0%) |
| 65 to 74 Years | 0 (0.0%) | 0 (0.0%) |
| 75 Years and over | 3 (18.8%) | 10 (29.4%) |
Disability Class: Self-Care Difficulty
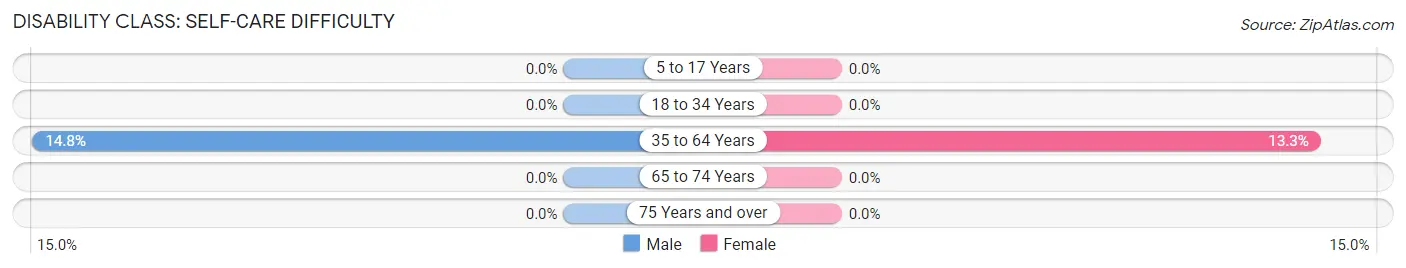
| Age Bracket | Male | Female |
| 5 to 17 Years | 0 (0.0%) | 0 (0.0%) |
| 18 to 34 Years | 0 (0.0%) | 0 (0.0%) |
| 35 to 64 Years | 17 (14.8%) | 10 (13.3%) |
| 65 to 74 Years | 0 (0.0%) | 0 (0.0%) |
| 75 Years and over | 0 (0.0%) | 0 (0.0%) |
Technology Access in Snow Lake Shores
Computing Device Access in Snow Lake Shores
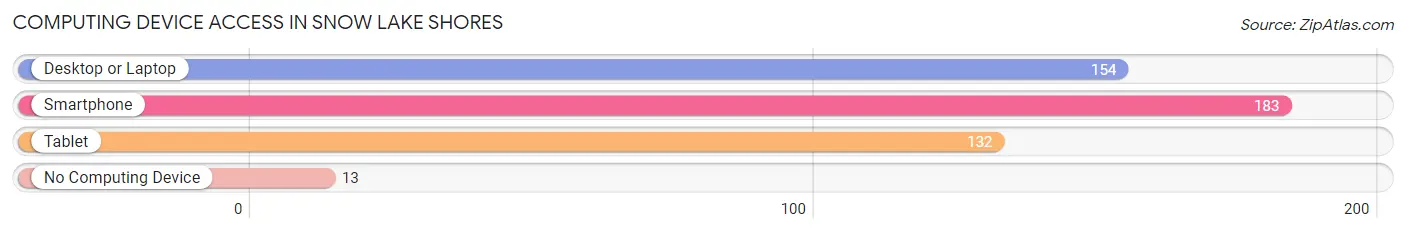
| Device Type | # Households | % Households |
| Desktop or Laptop | 154 | 73.7% |
| Smartphone | 183 | 87.6% |
| Tablet | 132 | 63.2% |
| No Computing Device | 13 | 6.2% |
| Total | 209 | 100.0% |
Internet Access in Snow Lake Shores
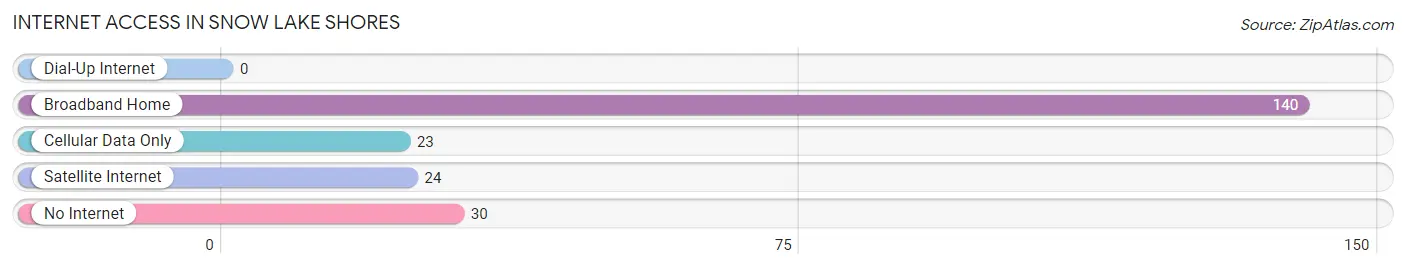
| Internet Type | # Households | % Households |
| Dial-Up Internet | 0 | 0.0% |
| Broadband Home | 140 | 67.0% |
| Cellular Data Only | 23 | 11.0% |
| Satellite Internet | 24 | 11.5% |
| No Internet | 30 | 14.3% |
| Total | 209 | 100.0% |
Snow Lake Shores Summary
Snow Lake Shores, Mississippi is a small town located in the northern part of the state, near the border of Tennessee. It is situated on the banks of the Tennessee River, and is part of the larger Jackson metropolitan area. The town has a population of just over 1,000 people, and is known for its rural charm and small-town atmosphere.
History
The area that is now Snow Lake Shores was first settled in the early 1800s by a group of settlers from Tennessee. The town was originally known as Snow Lake, and was named after the nearby lake of the same name. The lake was named for the snow that would accumulate on its banks during the winter months. The town was officially incorporated in 1845, and the first post office was established in 1847.
In the late 1800s, the town began to grow and develop, and by the early 1900s, it had become a popular tourist destination. The town was known for its beautiful scenery and its abundance of outdoor activities, such as fishing, hunting, and boating.
Geography
Snow Lake Shores is located in the northern part of Mississippi, near the border of Tennessee. It is situated on the banks of the Tennessee River, and is part of the larger Jackson metropolitan area. The town is surrounded by rolling hills and lush forests, and is home to several small lakes and streams. The climate in the area is generally mild, with hot summers and cold winters.
Economy
The economy of Snow Lake Shores is largely based on tourism and agriculture. The town is home to several small businesses, including restaurants, shops, and lodging. The town also has a small manufacturing sector, which produces a variety of products, including furniture and clothing.
Demographics
As of the 2010 census, the population of Snow Lake Shores was 1,072. The racial makeup of the town was 95.3% White, 1.2% African American, 0.3% Native American, 0.2% Asian, 0.1% Pacific Islander, and 2.9% from other races. The median household income in the town was $37,917, and the median family income was $45,625.
Conclusion
Snow Lake Shores, Mississippi is a small town located in the northern part of the state, near the border of Tennessee. It is situated on the banks of the Tennessee River, and is part of the larger Jackson metropolitan area. The town has a population of just over 1,000 people, and is known for its rural charm and small-town atmosphere. The economy of Snow Lake Shores is largely based on tourism and agriculture, and the town is home to several small businesses. The racial makeup of the town is predominantly White, with a small percentage of African American, Native American, Asian, and Pacific Islander residents.
Common Questions
What is Per Capita Income in Snow Lake Shores?
Per Capita income in Snow Lake Shores is $41,964.
What is the Median Family Income in Snow Lake Shores?
Median Family Income in Snow Lake Shores is $68,906.
What is the Median Household income in Snow Lake Shores?
Median Household Income in Snow Lake Shores is $54,583.
What is Income or Wage Gap in Snow Lake Shores?
Income or Wage Gap in Snow Lake Shores is 1.5%.
Women in Snow Lake Shores earn 98.5 cents for every dollar earned by a man.
What is Inequality or Gini Index in Snow Lake Shores?
Inequality or Gini Index in Snow Lake Shores is 0.44.
What is the Total Population of Snow Lake Shores?
Total Population of Snow Lake Shores is 364.
What is the Total Male Population of Snow Lake Shores?
Total Male Population of Snow Lake Shores is 205.
What is the Total Female Population of Snow Lake Shores?
Total Female Population of Snow Lake Shores is 159.
What is the Ratio of Males per 100 Females in Snow Lake Shores?
There are 128.93 Males per 100 Females in Snow Lake Shores.
What is the Ratio of Females per 100 Males in Snow Lake Shores?
There are 77.56 Females per 100 Males in Snow Lake Shores.
What is the Median Population Age in Snow Lake Shores?
Median Population Age in Snow Lake Shores is 61.0 Years.
What is the Average Family Size in Snow Lake Shores
Average Family Size in Snow Lake Shores is 2.5 People.
What is the Average Household Size in Snow Lake Shores
Average Household Size in Snow Lake Shores is 1.7 People.
How Large is the Labor Force in Snow Lake Shores?
There are 159 People in the Labor Forcein in Snow Lake Shores.
What is the Percentage of People in the Labor Force in Snow Lake Shores?
46.9% of People are in the Labor Force in Snow Lake Shores.
What is the Unemployment Rate in Snow Lake Shores?
Unemployment Rate in Snow Lake Shores is 11.9%.