Zip Codes with the Highest Percentage of Population with a Degree in Arts and Humanities in Minnesota
RELATED REPORTS & OPTIONS
Arts and Humanities
Minnesota
Compare Zip Codes
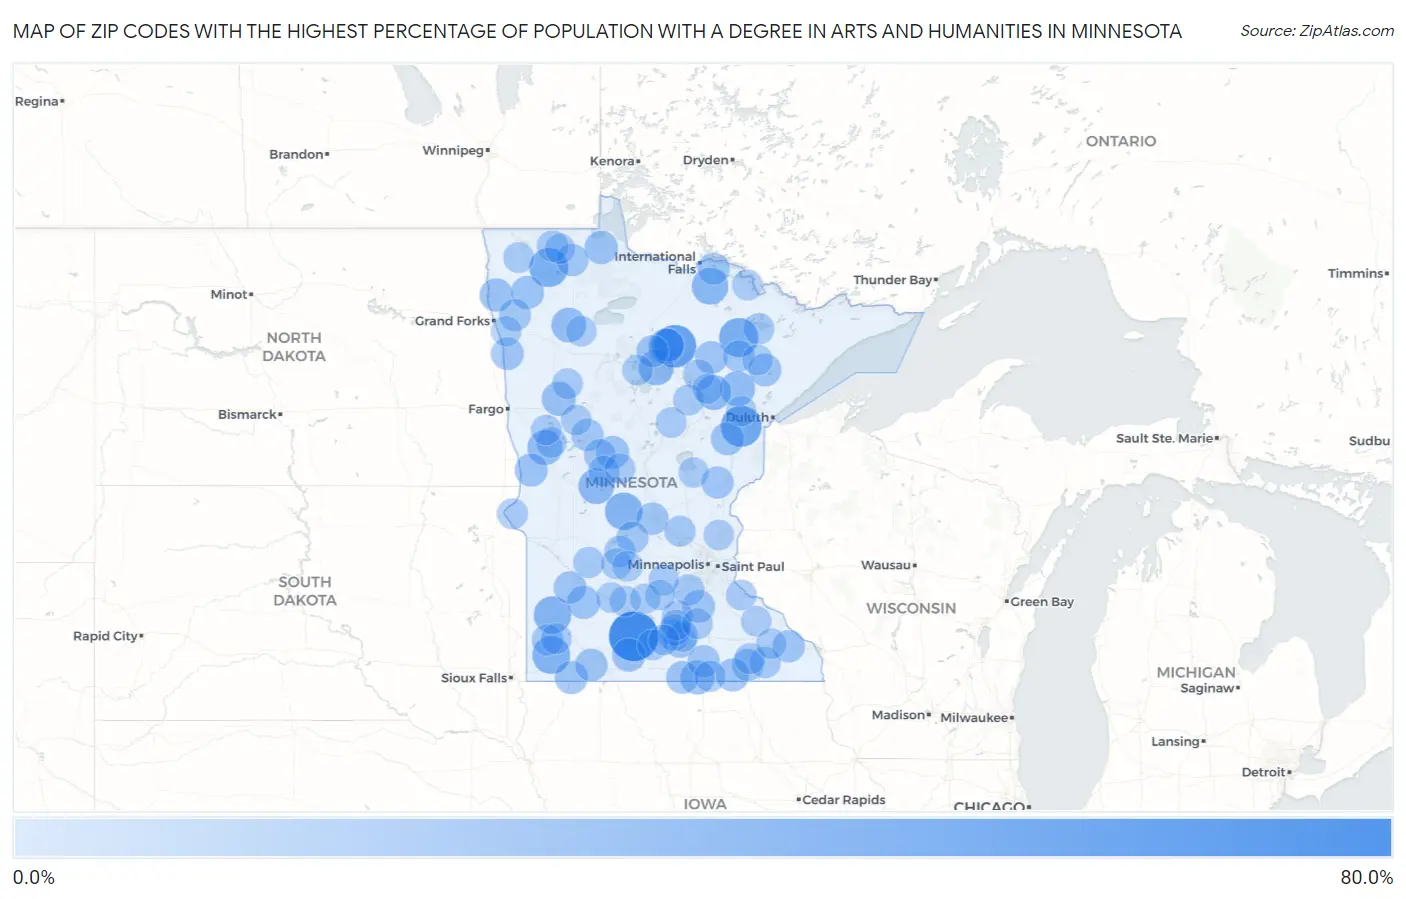
Map of Zip Codes with the Highest Percentage of Population with a Degree in Arts and Humanities in Minnesota
0.0%
80.0%
Zip Codes with the Highest Percentage of Population with a Degree in Arts and Humanities in Minnesota
| Zip Code | % Graduates | vs State | vs National | |
| 1. | 56056 | 66.7% | 6.2%(+60.5)#1 | 6.0%(+60.7)#136 |
| 2. | 56637 | 46.7% | 6.2%(+40.5)#2 | 6.0%(+40.7)#257 |
| 3. | 55780 | 41.7% | 6.2%(+35.5)#3 | 6.0%(+35.7)#321 |
| 4. | 55703 | 36.8% | 6.2%(+30.6)#4 | 6.0%(+30.8)#423 |
| 5. | 56759 | 36.4% | 6.2%(+30.2)#5 | 6.0%(+30.4)#440 |
| 6. | 56153 | 33.3% | 6.2%(+27.2)#6 | 6.0%(+27.3)#528 |
| 7. | 56356 | 32.0% | 6.2%(+25.8)#7 | 6.0%(+26.0)#584 |
| 8. | 56169 | 31.9% | 6.2%(+25.7)#8 | 6.0%(+25.9)#587 |
| 9. | 56669 | 29.5% | 6.2%(+23.4)#9 | 6.0%(+23.5)#680 |
| 10. | 56355 | 26.9% | 6.2%(+20.7)#10 | 6.0%(+20.9)#831 |
| 11. | 56626 | 26.7% | 6.2%(+20.5)#11 | 6.0%(+20.7)#848 |
| 12. | 56659 | 26.2% | 6.2%(+20.0)#12 | 6.0%(+20.2)#877 |
| 13. | 55765 | 25.3% | 6.2%(+19.1)#13 | 6.0%(+19.3)#935 |
| 14. | 56533 | 25.0% | 6.2%(+18.8)#14 | 6.0%(+19.0)#967 |
| 15. | 55784 | 25.0% | 6.2%(+18.8)#15 | 6.0%(+19.0)#978 |
| 16. | 56684 | 24.0% | 6.2%(+17.8)#16 | 6.0%(+18.0)#1,035 |
| 17. | 56521 | 22.3% | 6.2%(+16.2)#17 | 6.0%(+16.3)#1,183 |
| 18. | 56089 | 22.2% | 6.2%(+16.1)#18 | 6.0%(+16.2)#1,201 |
| 19. | 56162 | 20.7% | 6.2%(+14.5)#19 | 6.0%(+14.7)#1,393 |
| 20. | 56673 | 20.4% | 6.2%(+14.3)#20 | 6.0%(+14.4)#1,427 |
| 21. | 56710 | 20.3% | 6.2%(+14.2)#21 | 6.0%(+14.3)#1,442 |
| 22. | 56760 | 20.0% | 6.2%(+13.8)#22 | 6.0%(+14.0)#1,488 |
| 23. | 56434 | 20.0% | 6.2%(+13.8)#23 | 6.0%(+14.0)#1,495 |
| 24. | 56680 | 20.0% | 6.2%(+13.8)#24 | 6.0%(+14.0)#1,501 |
| 25. | 55757 | 19.8% | 6.2%(+13.6)#25 | 6.0%(+13.8)#1,527 |
| 26. | 56292 | 19.7% | 6.2%(+13.5)#26 | 6.0%(+13.7)#1,539 |
| 27. | 56117 | 19.6% | 6.2%(+13.4)#27 | 6.0%(+13.6)#1,558 |
| 28. | 56522 | 19.4% | 6.2%(+13.3)#28 | 6.0%(+13.4)#1,581 |
| 29. | 55970 | 19.2% | 6.2%(+13.1)#29 | 6.0%(+13.2)#1,618 |
| 30. | 56078 | 19.0% | 6.2%(+12.8)#30 | 6.0%(+13.0)#1,657 |
| 31. | 55763 | 19.0% | 6.2%(+12.8)#31 | 6.0%(+13.0)#1,658 |
| 32. | 55769 | 18.5% | 6.2%(+12.3)#32 | 6.0%(+12.5)#1,728 |
| 33. | 56051 | 18.5% | 6.2%(+12.3)#33 | 6.0%(+12.5)#1,735 |
| 34. | 56161 | 18.4% | 6.2%(+12.3)#34 | 6.0%(+12.4)#1,751 |
| 35. | 55046 | 18.3% | 6.2%(+12.2)#35 | 6.0%(+12.3)#1,767 |
| 36. | 56245 | 18.2% | 6.2%(+12.0)#36 | 6.0%(+12.2)#1,802 |
| 37. | 56568 | 18.2% | 6.2%(+12.0)#37 | 6.0%(+12.2)#1,813 |
| 38. | 55952 | 18.0% | 6.2%(+11.8)#38 | 6.0%(+12.0)#1,851 |
| 39. | 56567 | 18.0% | 6.2%(+11.8)#39 | 6.0%(+12.0)#1,853 |
| 40. | 56387 | 17.7% | 6.2%(+11.5)#40 | 6.0%(+11.7)#1,917 |
| 41. | 55007 | 17.3% | 6.2%(+11.2)#41 | 6.0%(+11.3)#2,008 |
| 42. | 56016 | 17.3% | 6.2%(+11.1)#42 | 6.0%(+11.3)#2,013 |
| 43. | 56681 | 17.2% | 6.2%(+11.1)#43 | 6.0%(+11.2)#2,026 |
| 44. | 56761 | 17.0% | 6.2%(+10.9)#44 | 6.0%(+11.0)#2,076 |
| 45. | 55936 | 16.7% | 6.2%(+10.5)#45 | 6.0%(+10.7)#2,147 |
| 46. | 56722 | 16.7% | 6.2%(+10.5)#46 | 6.0%(+10.7)#2,166 |
| 47. | 55329 | 16.6% | 6.2%(+10.4)#47 | 6.0%(+10.6)#2,194 |
| 48. | 56649 | 16.5% | 6.2%(+10.3)#48 | 6.0%(+10.5)#2,230 |
| 49. | 56080 | 16.3% | 6.2%(+10.1)#49 | 6.0%(+10.3)#2,275 |
| 50. | 56453 | 16.0% | 6.2%(+9.84)#50 | 6.0%(+10.0)#2,342 |
| 51. | 55758 | 15.8% | 6.2%(+9.63)#51 | 6.0%(+9.79)#2,400 |
| 52. | 55990 | 15.3% | 6.2%(+9.18)#52 | 6.0%(+9.34)#2,551 |
| 53. | 56714 | 15.2% | 6.2%(+9.06)#53 | 6.0%(+9.22)#2,588 |
| 54. | 56017 | 15.2% | 6.2%(+9.01)#54 | 6.0%(+9.17)#2,612 |
| 55. | 56186 | 15.0% | 6.2%(+8.84)#55 | 6.0%(+9.00)#2,673 |
| 56. | 55352 | 15.0% | 6.2%(+8.80)#56 | 6.0%(+8.96)#2,698 |
| 57. | 56036 | 14.8% | 6.2%(+8.66)#57 | 6.0%(+8.82)#2,749 |
| 58. | 56209 | 14.8% | 6.2%(+8.64)#58 | 6.0%(+8.80)#2,760 |
| 59. | 56048 | 14.8% | 6.2%(+8.63)#59 | 6.0%(+8.79)#2,767 |
| 60. | 56024 | 14.6% | 6.2%(+8.40)#60 | 6.0%(+8.56)#2,853 |
| 61. | 55790 | 14.6% | 6.2%(+8.40)#61 | 6.0%(+8.56)#2,855 |
| 62. | 56446 | 14.5% | 6.2%(+8.39)#62 | 6.0%(+8.55)#2,858 |
| 63. | 55722 | 14.4% | 6.2%(+8.21)#63 | 6.0%(+8.37)#2,943 |
| 64. | 56222 | 14.3% | 6.2%(+8.18)#64 | 6.0%(+8.34)#2,952 |
| 65. | 55967 | 14.0% | 6.2%(+7.86)#65 | 6.0%(+8.02)#3,123 |
| 66. | 55309 | 14.0% | 6.2%(+7.81)#66 | 6.0%(+7.97)#3,148 |
| 67. | 55748 | 13.9% | 6.2%(+7.71)#67 | 6.0%(+7.87)#3,191 |
| 68. | 56253 | 13.7% | 6.2%(+7.55)#68 | 6.0%(+7.71)#3,256 |
| 69. | 56151 | 13.7% | 6.2%(+7.53)#69 | 6.0%(+7.69)#3,272 |
| 70. | 55725 | 13.6% | 6.2%(+7.48)#70 | 6.0%(+7.64)#3,306 |
| 71. | 56063 | 13.6% | 6.2%(+7.40)#71 | 6.0%(+7.56)#3,333 |
| 72. | 56211 | 13.5% | 6.2%(+7.36)#72 | 6.0%(+7.52)#3,359 |
| 73. | 56090 | 13.5% | 6.2%(+7.31)#73 | 6.0%(+7.47)#3,382 |
| 74. | 56438 | 13.4% | 6.2%(+7.28)#74 | 6.0%(+7.44)#3,396 |
| 75. | 56534 | 13.4% | 6.2%(+7.25)#75 | 6.0%(+7.41)#3,408 |
| 76. | 56729 | 13.3% | 6.2%(+7.18)#76 | 6.0%(+7.34)#3,456 |
| 77. | 56544 | 13.3% | 6.2%(+7.16)#77 | 6.0%(+7.32)#3,462 |
| 78. | 56447 | 13.3% | 6.2%(+7.15)#78 | 6.0%(+7.30)#3,471 |
| 79. | 55741 | 13.3% | 6.2%(+7.12)#79 | 6.0%(+7.28)#3,482 |
| 80. | 55052 | 13.2% | 6.2%(+7.08)#80 | 6.0%(+7.24)#3,506 |
| 81. | 55332 | 13.1% | 6.2%(+6.97)#81 | 6.0%(+7.13)#3,566 |
| 82. | 56589 | 13.1% | 6.2%(+6.95)#82 | 6.0%(+7.11)#3,580 |
| 83. | 56037 | 12.9% | 6.2%(+6.78)#83 | 6.0%(+6.94)#3,689 |
| 84. | 55370 | 12.9% | 6.2%(+6.75)#84 | 6.0%(+6.91)#3,703 |
| 85. | 56572 | 12.9% | 6.2%(+6.71)#85 | 6.0%(+6.87)#3,731 |
| 86. | 56751 | 12.8% | 6.2%(+6.65)#86 | 6.0%(+6.81)#3,766 |
| 87. | 55089 | 12.7% | 6.2%(+6.57)#87 | 6.0%(+6.73)#3,819 |
| 88. | 56633 | 12.7% | 6.2%(+6.55)#88 | 6.0%(+6.71)#3,832 |
| 89. | 56644 | 12.7% | 6.2%(+6.50)#89 | 6.0%(+6.66)#3,856 |
| 90. | 55092 | 12.7% | 6.2%(+6.50)#90 | 6.0%(+6.66)#3,859 |
| 91. | 55991 | 12.5% | 6.2%(+6.34)#91 | 6.0%(+6.50)#3,953 |
| 92. | 56228 | 12.5% | 6.2%(+6.34)#92 | 6.0%(+6.50)#3,959 |
| 93. | 55793 | 12.5% | 6.2%(+6.34)#93 | 6.0%(+6.50)#3,965 |
| 94. | 55711 | 12.5% | 6.2%(+6.34)#94 | 6.0%(+6.50)#3,968 |
| 95. | 55929 | 12.4% | 6.2%(+6.29)#95 | 6.0%(+6.45)#4,020 |
| 96. | 56270 | 12.4% | 6.2%(+6.23)#96 | 6.0%(+6.39)#4,060 |
| 97. | 56386 | 12.4% | 6.2%(+6.20)#97 | 6.0%(+6.36)#4,078 |
| 98. | 56723 | 12.2% | 6.2%(+6.07)#98 | 6.0%(+6.23)#4,167 |
| 99. | 55396 | 12.2% | 6.2%(+6.02)#99 | 6.0%(+6.18)#4,192 |
| 100. | 55307 | 12.1% | 6.2%(+5.97)#100 | 6.0%(+6.13)#4,220 |
Common Questions
What are the Top 10 Zip Codes with the Highest Percentage of Population with a Degree in Arts and Humanities in Minnesota?
Top 10 Zip Codes with the Highest Percentage of Population with a Degree in Arts and Humanities in Minnesota are:
What zip code has the Highest Percentage of Population with a Degree in Arts and Humanities in Minnesota?
56056 has the Highest Percentage of Population with a Degree in Arts and Humanities in Minnesota with 66.7%.
What is the Percentage of Population with a Degree in Arts and Humanities in the State of Minnesota?
Percentage of Population with a Degree in Arts and Humanities in Minnesota is 6.2%.
What is the Percentage of Population with a Degree in Arts and Humanities in the United States?
Percentage of Population with a Degree in Arts and Humanities in the United States is 6.0%.