Scandinavian Self-Care Disability

COMPARE

Scandinavian
Race
Ancestry
AfghanAfricanAlaska NativeAlaskan AthabascanAlbanianAleutAlsatianAmericanApacheArabArapahoArgentineanArmenianAssyrian/Chaldean/SyriacAustralianAustrianBahamianBangladeshiBarbadianBasqueBelgianBelizeanBermudanBhutaneseBlackfeetBolivianBrazilianBritishBritish West IndianBulgarianBurmeseCajunCambodianCanadianCape VerdeanCarpatho RusynCelticCentral AmericanCentral American IndianCherokeeCheyenneChickasawChileanChineseChippewaChoctawColombianColvilleComancheCosta RicanCreeCreekCroatianCrowCubanCypriotCzechCzechoslovakianDanishDelawareDominicanDutchDutch West IndianEastern EuropeanEcuadorianEgyptianEnglishEstonianEthiopianEuropeanFijianFilipinoFinnishFrenchFrench American IndianFrench CanadianGermanGerman RussianGhanaianGreekGuamanian/ChamorroGuatemalanGuyaneseHaitianHmongHonduranHopiHoumaHungarianIcelanderIndian (Asian)IndonesianInupiatIranianIraqiIrishIroquoisIsraeliItalianJamaicanJapaneseJordanianKenyanKiowaKoreanLaotianLatvianLebaneseLiberianLithuanianLumbeeLuxembourgerMacedonianMalaysianMalteseMarshalleseMenomineeMexicanMexican American IndianMongolianMoroccanNative HawaiianNavajoNepaleseNew ZealanderNicaraguanNigerianNorthern EuropeanNorwegianOkinawanOsageOttawaPaiutePakistaniPalestinianPanamanianParaguayanPennsylvania GermanPeruvianPimaPolishPortuguesePotawatomiPuebloPuerto RicanPuget Sound SalishRomanianRussianSalvadoranSamoanScandinavianScotch-IrishScottishSeminoleSenegaleseSerbianShoshoneSierra LeoneanSiouxSlavicSlovakSloveneSomaliSouth AfricanSouth AmericanSouth American IndianSoviet UnionSpaniardSpanishSpanish AmericanSpanish American IndianSri LankanSubsaharan AfricanSudaneseSwedishSwissSyrianTaiwaneseThaiTlingit-HaidaTohono O'OdhamTonganTrinidadian and TobagonianTsimshianTurkishU.S. Virgin IslanderUgandanUkrainianUruguayanUteVenezuelanVietnameseWelshWest IndianYakamaYaquiYugoslavianYumanYup'ikZimbabwean
Immigration
NonimmigrantsImmigrantsAfghanistanAfricaAlbaniaArgentinaArmeniaAsiaAustraliaAustriaBahamasBangladeshBarbadosBelarusBelgiumBelizeBoliviaBosnia and HerzegovinaBrazilBulgariaBurma/MyanmarCabo VerdeCambodiaCameroonCanadaCaribbeanCentral AmericaChileChinaColombiaCongoCosta RicaCroatiaCubaCzechoslovakiaDenmarkDominicaDominican RepublicEastern AfricaEastern AsiaEastern EuropeEcuadorEgyptEl SalvadorEnglandEritreaEthiopiaEuropeFijiFranceGermanyGhanaGreeceGrenadaGuatemalaGuyanaHaitiHondurasHong KongHungaryIndiaIndonesiaIranIraqIrelandIsraelItalyJamaicaJapanJordanKazakhstanKenyaKoreaKuwaitLaosLatin AmericaLatviaLebanonLiberiaLithuaniaMalaysiaMexicoMicronesiaMiddle AfricaMoldovaMoroccoNepalNetherlandsNicaraguaNigeriaNorth AmericaNorth MacedoniaNorthern AfricaNorthern EuropeNorwayOceaniaPakistanPanamaPeruPhilippinesPolandPortugalRomaniaRussiaSaudi ArabiaScotlandSenegalSerbiaSierra LeoneSingaporeSomaliaSouth AfricaSouth AmericaSouth Central AsiaSouth Eastern AsiaSouthern EuropeSpainSri LankaSt. Vincent and the GrenadinesSudanSwedenSwitzerlandSyriaTaiwanThailandTrinidad and TobagoTurkeyUgandaUkraineUruguayUzbekistanVenezuelaVietnamWest IndiesWestern AfricaWestern AsiaWestern EuropeYemenZaireZimbabweAzores
Select to Compare
Race
Ancestry
AfghanAfricanAlaska NativeAlaskan AthabascanAlbanianAleutAlsatianAmericanApacheArabArapahoArgentineanArmenianAssyrian/Chaldean/SyriacAustralianAustrianBahamianBangladeshiBarbadianBasqueBelgianBelizeanBermudanBhutaneseBlackfeetBolivianBrazilianBritishBritish West IndianBulgarianBurmeseCajunCambodianCanadianCape VerdeanCarpatho RusynCelticCentral AmericanCentral American IndianCherokeeCheyenneChickasawChileanChineseChippewaChoctawColombianColvilleComancheCosta RicanCreeCreekCroatianCrowCubanCypriotCzechCzechoslovakianDanishDelawareDominicanDutchDutch West IndianEastern EuropeanEcuadorianEgyptianEnglishEstonianEthiopianEuropeanFijianFilipinoFinnishFrenchFrench American IndianFrench CanadianGermanGerman RussianGhanaianGreekGuamanian/ChamorroGuatemalanGuyaneseHaitianHmongHonduranHopiHoumaHungarianIcelanderIndian (Asian)IndonesianInupiatIranianIraqiIrishIroquoisIsraeliItalianJamaicanJapaneseJordanianKenyanKiowaKoreanLaotianLatvianLebaneseLiberianLithuanianLumbeeLuxembourgerMacedonianMalaysianMalteseMarshalleseMenomineeMexicanMexican American IndianMongolianMoroccanNative HawaiianNavajoNepaleseNew ZealanderNicaraguanNigerianNorthern EuropeanNorwegianOkinawanOsageOttawaPaiutePakistaniPalestinianPanamanianParaguayanPennsylvania GermanPeruvianPimaPolishPortuguesePotawatomiPuebloPuerto RicanPuget Sound SalishRomanianRussianSalvadoranSamoanScotch-IrishScottishSeminoleSenegaleseSerbianShoshoneSierra LeoneanSiouxSlavicSlovakSloveneSomaliSouth AfricanSouth AmericanSouth American IndianSoviet UnionSpaniardSpanishSpanish AmericanSpanish American IndianSri LankanSubsaharan AfricanSudaneseSwedishSwissSyrianTaiwaneseThaiTlingit-HaidaTohono O'OdhamTonganTrinidadian and TobagonianTsimshianTurkishU.S. Virgin IslanderUgandanUkrainianUruguayanUteVenezuelanVietnameseWelshWest IndianYakamaYaquiYugoslavianYumanYup'ikZimbabwean
Immigration
NonimmigrantsImmigrantsAfghanistanAfricaAlbaniaArgentinaArmeniaAsiaAustraliaAustriaBahamasBangladeshBarbadosBelarusBelgiumBelizeBoliviaBosnia and HerzegovinaBrazilBulgariaBurma/MyanmarCabo VerdeCambodiaCameroonCanadaCaribbeanCentral AmericaChileChinaColombiaCongoCosta RicaCroatiaCubaCzechoslovakiaDenmarkDominicaDominican RepublicEastern AfricaEastern AsiaEastern EuropeEcuadorEgyptEl SalvadorEnglandEritreaEthiopiaEuropeFijiFranceGermanyGhanaGreeceGrenadaGuatemalaGuyanaHaitiHondurasHong KongHungaryIndiaIndonesiaIranIraqIrelandIsraelItalyJamaicaJapanJordanKazakhstanKenyaKoreaKuwaitLaosLatin AmericaLatviaLebanonLiberiaLithuaniaMalaysiaMexicoMicronesiaMiddle AfricaMoldovaMoroccoNepalNetherlandsNicaraguaNigeriaNorth AmericaNorth MacedoniaNorthern AfricaNorthern EuropeNorwayOceaniaPakistanPanamaPeruPhilippinesPolandPortugalRomaniaRussiaSaudi ArabiaScotlandSenegalSerbiaSierra LeoneSingaporeSomaliaSouth AfricaSouth AmericaSouth Central AsiaSouth Eastern AsiaSouthern EuropeSpainSri LankaSt. Vincent and the GrenadinesSudanSwedenSwitzerlandSyriaTaiwanThailandTrinidad and TobagoTurkeyUgandaUkraineUruguayUzbekistanVenezuelaVietnamWest IndiesWestern AfricaWestern AsiaWestern EuropeYemenZaireZimbabweAzores
Self-Care Disability
Income
Poverty
Unemployment
Labor Participation
Family Structure
Vehicle Availability
Education Level
Disability

Scandinavian Self-Care Disability
Exceptional

2.4%
SELF-CARE DISABILITY
93.5/ 100
METRIC RATING
112th/ 347
METRIC RANK

Scandinavian Self-Care Disability Correlation Chart

The statistical analysis conducted on geographies consisting of 471,531,720 people shows a substantial positive correlation between the proportion of Scandinavians and percentage of population with self-care disability in the United States with a correlation coefficient (R) of 0.559 and weighted average of 2.4%. On average, for every 1% (one percent) increase in Scandinavians within a typical geography, there is an increase of 0.26% in percentage of population with self-care disability.
Scandinavian Self-Care Disability
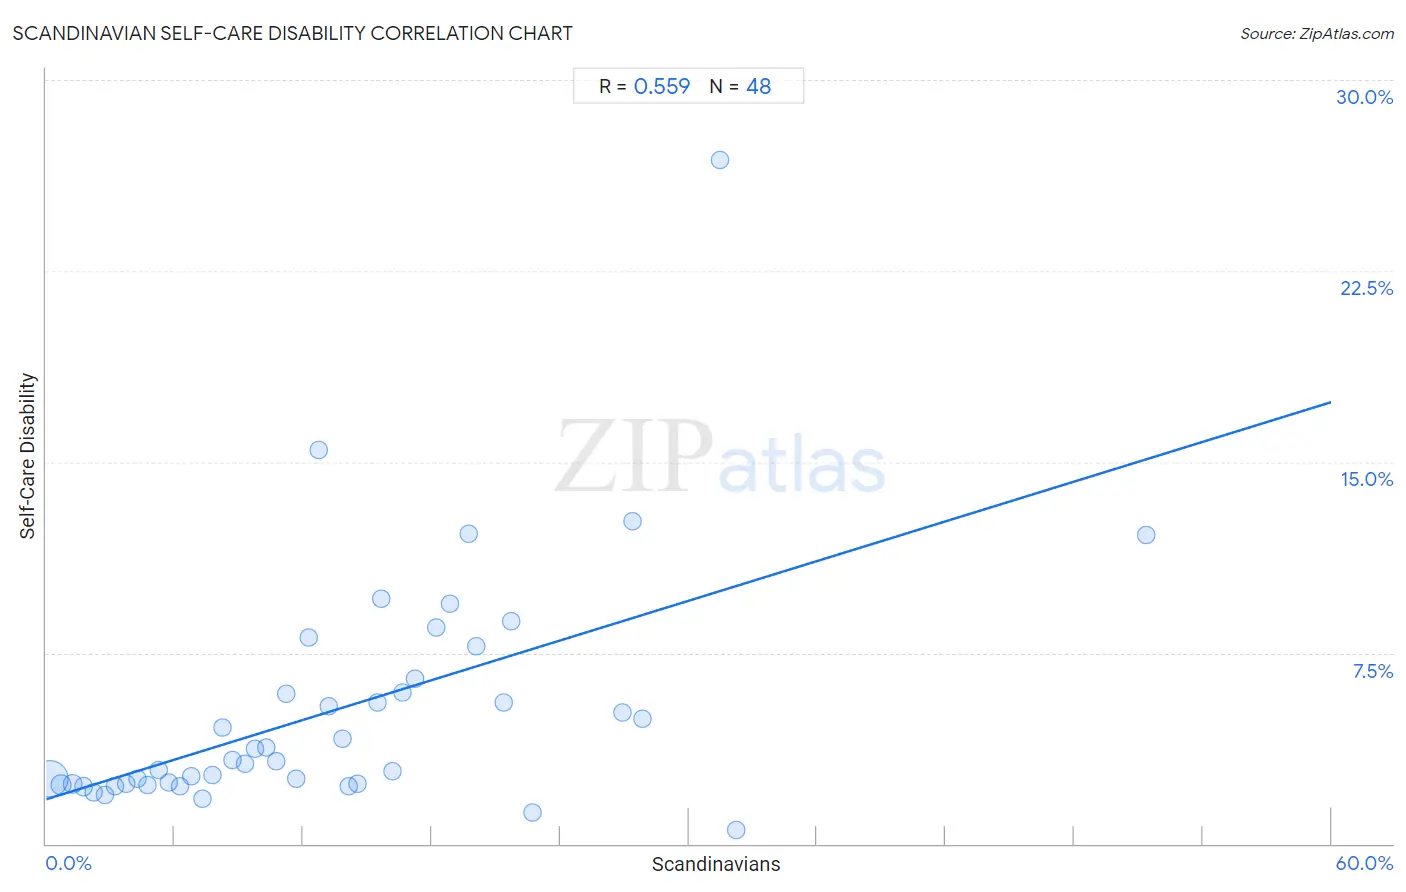
It is essential to understand that the correlation between the percentage of Scandinavians and percentage of population with self-care disability does not imply a direct cause-and-effect relationship. It remains uncertain whether the presence of Scandinavians influences an upward or downward trend in the level of percentage of population with self-care disability within an area, or if Scandinavians simply ended up residing in those areas with higher or lower levels of percentage of population with self-care disability due to other factors.

Demographics Similar to Scandinavians by Self-Care Disability

In terms of self-care disability, the demographic groups most similar to Scandinavians are Serbian (2.4%, a difference of 0.020%), Immigrants from Africa (2.4%, a difference of 0.050%), South American (2.4%, a difference of 0.060%), Immigrants from North Macedonia (2.4%, a difference of 0.070%), and Immigrants from Hong Kong (2.4%, a difference of 0.070%).
DemographicsRating | RankSelf-Care Disability
Carpatho Rusyns
94.4
/100
|
#105
Exceptional
2.4%
Immigrants from Indonesia
94.3
/100
|
#106
Exceptional
2.4%
British
94.3
/100
|
#107
Exceptional
2.4%
Greeks
94.1
/100
|
#108
Exceptional
2.4%
Slovenes
94.1
/100
|
#109
Exceptional
2.4%
Immigrants from Africa
93.7
/100
|
#110
Exceptional
2.4%
Serbians
93.6
/100
|
#111
Exceptional
2.4%
Scandinavians
93.5
/100
|
#112
Exceptional
2.4%
South Americans
93.2
/100
|
#113
Exceptional
2.4%
Immigrants from North Macedonia
93.1
/100
|
#114
Exceptional
2.4%
Immigrants from Hong Kong
93.1
/100
|
#115
Exceptional
2.4%
Northern Europeans
92.9
/100
|
#116
Exceptional
2.4%
Taiwanese
92.5
/100
|
#117
Exceptional
2.4%
Immigrants from Canada
92.0
/100
|
#118
Exceptional
2.4%
Immigrants from Sierra Leone
91.8
/100
|
#119
Exceptional
2.4%

Scandinavian Self-Care Disability Correlation Summary

MeasurementScandinavian DataSelf-Care Disability Data
Minimum0.19%0.56%
Maximum51.4%26.9%
Range51.2%26.3%
Mean13.4%5.2%
Median11.9%3.3%
Interquartile 25% (IQ1)6.0%2.4%
Interquartile 75% (IQ3)18.5%6.2%
Interquartile Range (IQR)12.5%3.9%
Standard Deviation (Sample)10.0%4.7%
Standard Deviation (Population)9.9%4.6%

Correlation Details

Scandinavian PercentileSample SizeSelf-Care Disability
[
0.0%
-
0.5%
]
0.19%
375,345,4432.5%
[
0.5%
-
1.0%
]
0.70%
59,905,8772.3%
[
1.0%
-
1.5%
]
1.22%
18,831,5942.3%
[
1.5%
-
2.0%
]
1.73%
8,370,8342.2%
[
2.0%
-
2.5%
]
2.21%
4,701,5742.0%
[
2.5%
-
3.0%
]
2.73%
2,308,0601.9%
[
3.0%
-
3.5%
]
3.21%
875,2692.3%
[
3.5%
-
4.0%
]
3.72%
470,5302.4%
[
4.0%
-
4.5%
]
4.24%
186,6602.6%
[
4.5%
-
5.0%
]
4.73%
110,9682.3%
[
5.0%
-
5.5%
]
5.26%
89,4302.9%
[
5.5%
-
6.0%
]
5.74%
101,4882.4%
[
6.0%
-
6.5%
]
6.27%
49,5632.3%
[
6.5%
-
7.0%
]
6.76%
53,1172.7%
[
7.0%
-
7.5%
]
7.29%
30,2701.8%
[
7.5%
-
8.0%
]
7.73%
19,4472.7%
[
8.0%
-
8.5%
]
8.23%
16,3454.6%
[
8.5%
-
9.0%
]
8.69%
12,3933.3%
[
9.0%
-
9.5%
]
9.26%
5,8503.1%
[
9.5%
-
10.0%
]
9.76%
3,1753.7%
[
10.0%
-
10.5%
]
10.25%
12,5383.8%
[
10.5%
-
11.0%
]
10.75%
5,4613.2%
[
11.0%
-
11.5%
]
11.22%
4195.9%
[
11.5%
-
12.0%
]
11.67%
2,4172.5%
[
12.0%
-
12.5%
]
12.23%
3,0918.1%
[
12.5%
-
13.0%
]
12.73%
1,19415.4%
[
13.0%
-
13.5%
]
13.20%
5535.4%
[
13.5%
-
14.0%
]
13.80%
5944.1%
[
14.0%
-
14.5%
]
14.11%
3,9752.3%
[
14.5%
-
15.0%
]
14.54%
3,9542.4%
[
15.0%
-
15.5%
]
15.44%
5575.6%
[
15.5%
-
16.0%
]
15.61%
3019.6%
[
16.0%
-
16.5%
]
16.19%
1052.9%
[
16.5%
-
17.0%
]
16.63%
8426.0%
[
17.0%
-
17.5%
]
17.24%
2,1006.5%
[
18.0%
-
18.5%
]
18.21%
2,0928.5%
[
18.5%
-
19.0%
]
18.87%
539.4%
[
19.5%
-
20.0%
]
19.75%
23812.2%
[
20.0%
-
20.5%
]
20.05%
7787.8%
[
21.0%
-
21.5%
]
21.37%
2345.6%
[
21.5%
-
22.0%
]
21.73%
9348.8%
[
22.5%
-
23.0%
]
22.70%
1631.2%
[
26.5%
-
27.0%
]
26.88%
7595.1%
[
27.0%
-
27.5%
]
27.37%
9512.6%
[
27.5%
-
28.0%
]
27.87%
614.9%
[
31.0%
-
31.5%
]
31.48%
10826.9%
[
32.0%
-
32.5%
]
32.22%
1800.56%
[
51.0%
-
51.5%
]
51.35%
3712.1%