Scandinavian 4 or more Vehicles in Household
COMPARE
Scandinavian
Select to Compare
4 or more Vehicles in Household
Scandinavian 4 or more Vehicles in Household
8.0%
4+ VEHICLES AVAILABLE
100.0/ 100
METRIC RATING
37th/ 347
METRIC RANK
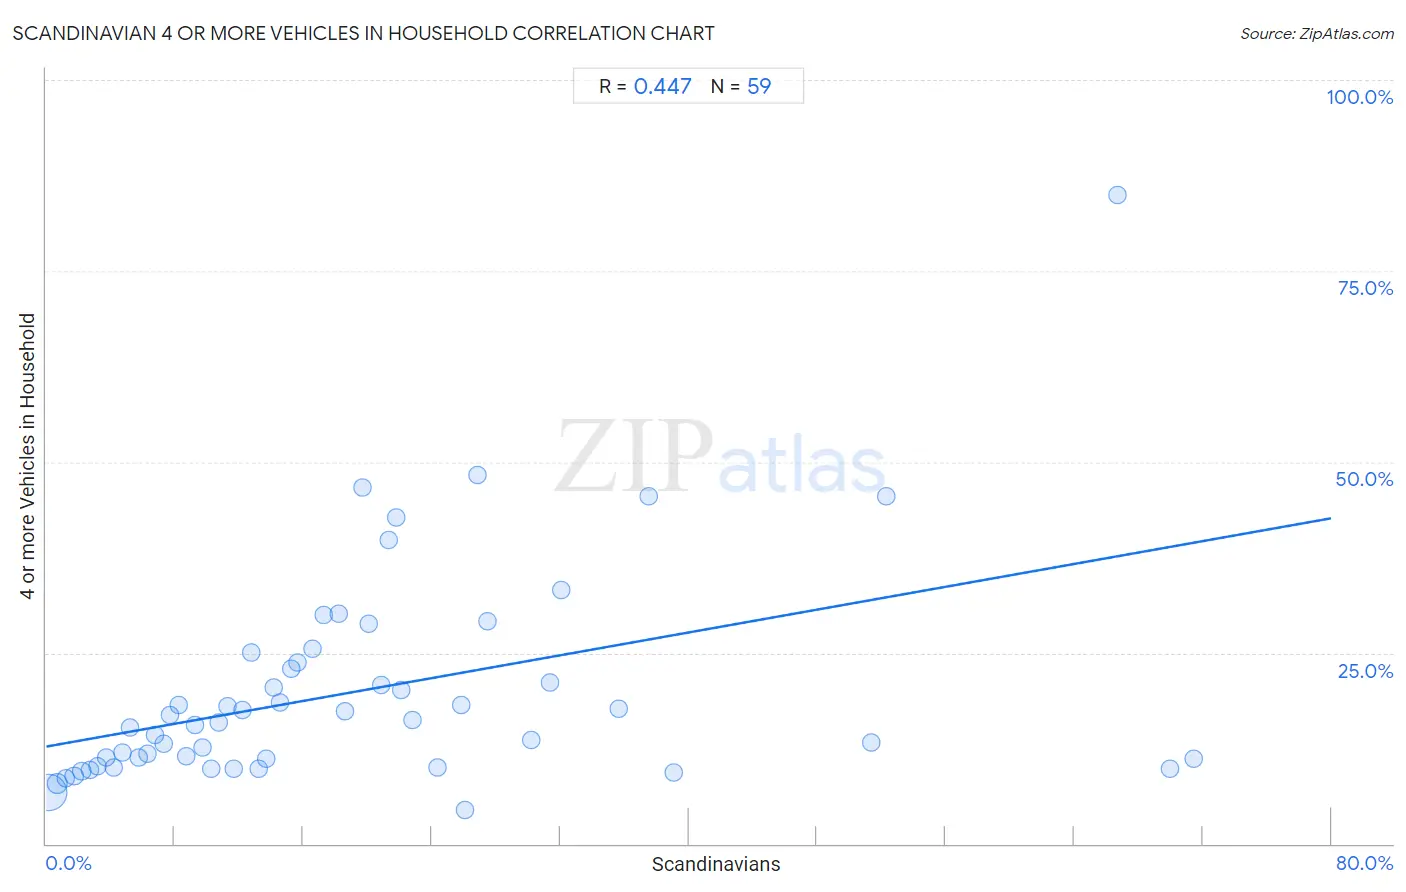
Scandinavian 4 or more Vehicles in Household Correlation Chart
The statistical analysis conducted on geographies consisting of 470,673,976 people shows a moderate positive correlation between the proportion of Scandinavians and percentage of households with 4 or more vehicles available in the United States with a correlation coefficient (R) of 0.447 and weighted average of 8.0%. On average, for every 1% (one percent) increase in Scandinavians within a typical geography, there is an increase of 0.37% in percentage of households with 4 or more vehicles available.
It is essential to understand that the correlation between the percentage of Scandinavians and percentage of households with 4 or more vehicles available does not imply a direct cause-and-effect relationship. It remains uncertain whether the presence of Scandinavians influences an upward or downward trend in the level of percentage of households with 4 or more vehicles available within an area, or if Scandinavians simply ended up residing in those areas with higher or lower levels of percentage of households with 4 or more vehicles available due to other factors.
Demographics Similar to Scandinavians by 4 or more Vehicles in Household
In terms of 4 or more vehicles in household, the demographic groups most similar to Scandinavians are Sioux (8.0%, a difference of 0.030%), Norwegian (8.0%, a difference of 0.17%), Spanish American (8.0%, a difference of 0.26%), Spanish (7.9%, a difference of 0.89%), and Guamanian/Chamorro (8.1%, a difference of 0.96%).
| Demographics | Rating | Rank | 4 or more Vehicles in Household |
| Navajo | 100.0 /100 | #30 | Exceptional 8.2% |
| Natives/Alaskans | 100.0 /100 | #31 | Exceptional 8.2% |
| Marshallese | 100.0 /100 | #32 | Exceptional 8.1% |
| Yaqui | 100.0 /100 | #33 | Exceptional 8.1% |
| Alaskan Athabascans | 100.0 /100 | #34 | Exceptional 8.1% |
| Guamanians/Chamorros | 100.0 /100 | #35 | Exceptional 8.1% |
| Norwegians | 100.0 /100 | #36 | Exceptional 8.0% |
| Scandinavians | 100.0 /100 | #37 | Exceptional 8.0% |
| Sioux | 100.0 /100 | #38 | Exceptional 8.0% |
| Spanish Americans | 100.0 /100 | #39 | Exceptional 8.0% |
| Spanish | 100.0 /100 | #40 | Exceptional 7.9% |
| Pima | 100.0 /100 | #41 | Exceptional 7.9% |
| Salvadorans | 100.0 /100 | #42 | Exceptional 7.8% |
| Fijians | 100.0 /100 | #43 | Exceptional 7.8% |
| Bhutanese | 100.0 /100 | #44 | Exceptional 7.8% |
Scandinavian 4 or more Vehicles in Household Correlation Summary
| Measurement | Scandinavian Data | 4 or more Vehicles in Household Data |
| Minimum | 0.19% | 4.3% |
| Maximum | 71.4% | 85.0% |
| Range | 71.2% | 80.7% |
| Mean | 19.0% | 19.8% |
| Median | 14.6% | 15.9% |
| Interquartile 25% (IQ1) | 7.3% | 10.2% |
| Interquartile 75% (IQ3) | 25.8% | 23.7% |
| Interquartile Range (IQR) | 18.5% | 13.5% |
| Standard Deviation (Sample) | 16.7% | 13.9% |
| Standard Deviation (Population) | 16.5% | 13.8% |
Correlation Details
| Scandinavian Percentile | Sample Size | 4 or more Vehicles in Household |
[ 0.0% - 0.5% ] 0.19% | 374,340,533 | 6.7% |
[ 0.5% - 1.0% ] 0.70% | 59,879,148 | 7.9% |
[ 1.0% - 1.5% ] 1.22% | 18,844,415 | 8.6% |
[ 1.5% - 2.0% ] 1.73% | 8,402,041 | 8.9% |
[ 2.0% - 2.5% ] 2.21% | 4,745,995 | 9.5% |
[ 2.5% - 3.0% ] 2.73% | 2,329,937 | 9.7% |
[ 3.0% - 3.5% ] 3.22% | 885,105 | 10.2% |
[ 3.5% - 4.0% ] 3.72% | 481,659 | 11.4% |
[ 4.0% - 4.5% ] 4.24% | 189,040 | 10.0% |
[ 4.5% - 5.0% ] 4.74% | 120,324 | 11.9% |
[ 5.0% - 5.5% ] 5.25% | 96,221 | 15.3% |
[ 5.5% - 6.0% ] 5.75% | 105,271 | 11.3% |
[ 6.0% - 6.5% ] 6.27% | 50,843 | 11.8% |
[ 6.5% - 7.0% ] 6.75% | 56,286 | 14.3% |
[ 7.0% - 7.5% ] 7.29% | 31,853 | 13.1% |
[ 7.5% - 8.0% ] 7.69% | 18,524 | 16.8% |
[ 8.0% - 8.5% ] 8.25% | 19,284 | 18.2% |
[ 8.5% - 9.0% ] 8.70% | 14,200 | 11.5% |
[ 9.0% - 9.5% ] 9.23% | 7,132 | 15.5% |
[ 9.5% - 10.0% ] 9.73% | 6,313 | 12.7% |
[ 10.0% - 10.5% ] 10.25% | 11,800 | 9.7% |
[ 10.5% - 11.0% ] 10.73% | 5,347 | 15.9% |
[ 11.0% - 11.5% ] 11.28% | 1,232 | 17.9% |
[ 11.5% - 12.0% ] 11.66% | 2,522 | 9.8% |
[ 12.0% - 12.5% ] 12.24% | 2,263 | 17.5% |
[ 12.5% - 13.0% ] 12.74% | 895 | 25.0% |
[ 13.0% - 13.5% ] 13.21% | 333 | 9.8% |
[ 13.5% - 14.0% ] 13.70% | 1,080 | 11.1% |
[ 14.0% - 14.5% ] 14.13% | 4,205 | 20.4% |
[ 14.5% - 15.0% ] 14.56% | 4,368 | 18.4% |
[ 15.0% - 15.5% ] 15.22% | 276 | 22.9% |
[ 15.5% - 16.0% ] 15.67% | 766 | 23.7% |
[ 16.5% - 17.0% ] 16.59% | 3,509 | 25.5% |
[ 17.0% - 17.5% ] 17.26% | 1,709 | 30.0% |
[ 18.0% - 18.5% ] 18.21% | 2,092 | 30.1% |
[ 18.5% - 19.0% ] 18.60% | 43 | 17.4% |
[ 19.5% - 20.0% ] 19.72% | 213 | 46.6% |
[ 20.0% - 20.5% ] 20.07% | 827 | 28.8% |
[ 20.5% - 21.0% ] 20.86% | 374 | 20.8% |
[ 21.0% - 21.5% ] 21.35% | 342 | 39.8% |
[ 21.5% - 22.0% ] 21.82% | 1,297 | 42.8% |
[ 22.0% - 22.5% ] 22.10% | 448 | 20.1% |
[ 22.5% - 23.0% ] 22.83% | 184 | 16.1% |
[ 24.0% - 24.5% ] 24.32% | 37 | 10.0% |
[ 25.5% - 26.0% ] 25.81% | 31 | 18.2% |
[ 26.0% - 26.5% ] 26.09% | 46 | 4.3% |
[ 26.5% - 27.0% ] 26.86% | 1,627 | 48.2% |
[ 27.0% - 27.5% ] 27.44% | 215 | 29.1% |
[ 30.0% - 30.5% ] 30.23% | 311 | 13.6% |
[ 31.0% - 31.5% ] 31.37% | 255 | 21.1% |
[ 32.0% - 32.5% ] 32.10% | 539 | 33.2% |
[ 35.5% - 36.0% ] 35.63% | 87 | 17.6% |
[ 37.0% - 37.5% ] 37.50% | 16 | 45.5% |
[ 39.0% - 39.5% ] 39.10% | 156 | 9.4% |
[ 51.0% - 51.5% ] 51.35% | 37 | 13.3% |
[ 52.0% - 52.5% ] 52.27% | 88 | 45.5% |
[ 66.5% - 67.0% ] 66.67% | 87 | 85.0% |
[ 69.5% - 70.0% ] 69.93% | 153 | 9.8% |
[ 71.0% - 71.5% ] 71.43% | 42 | 11.1% |