Scandinavian vs Immigrants from Oceania Wage/Income Gap
COMPARE
Scandinavian
Immigrants from Oceania
Wage/Income Gap
Wage/Income Gap Comparison
Scandinavians
Immigrants from Oceania
29.1%
WAGE/INCOME GAP
0.0/ 100
METRIC RATING
328th/ 347
METRIC RANK
25.6%
WAGE/INCOME GAP
57.5/ 100
METRIC RATING
170th/ 347
METRIC RANK
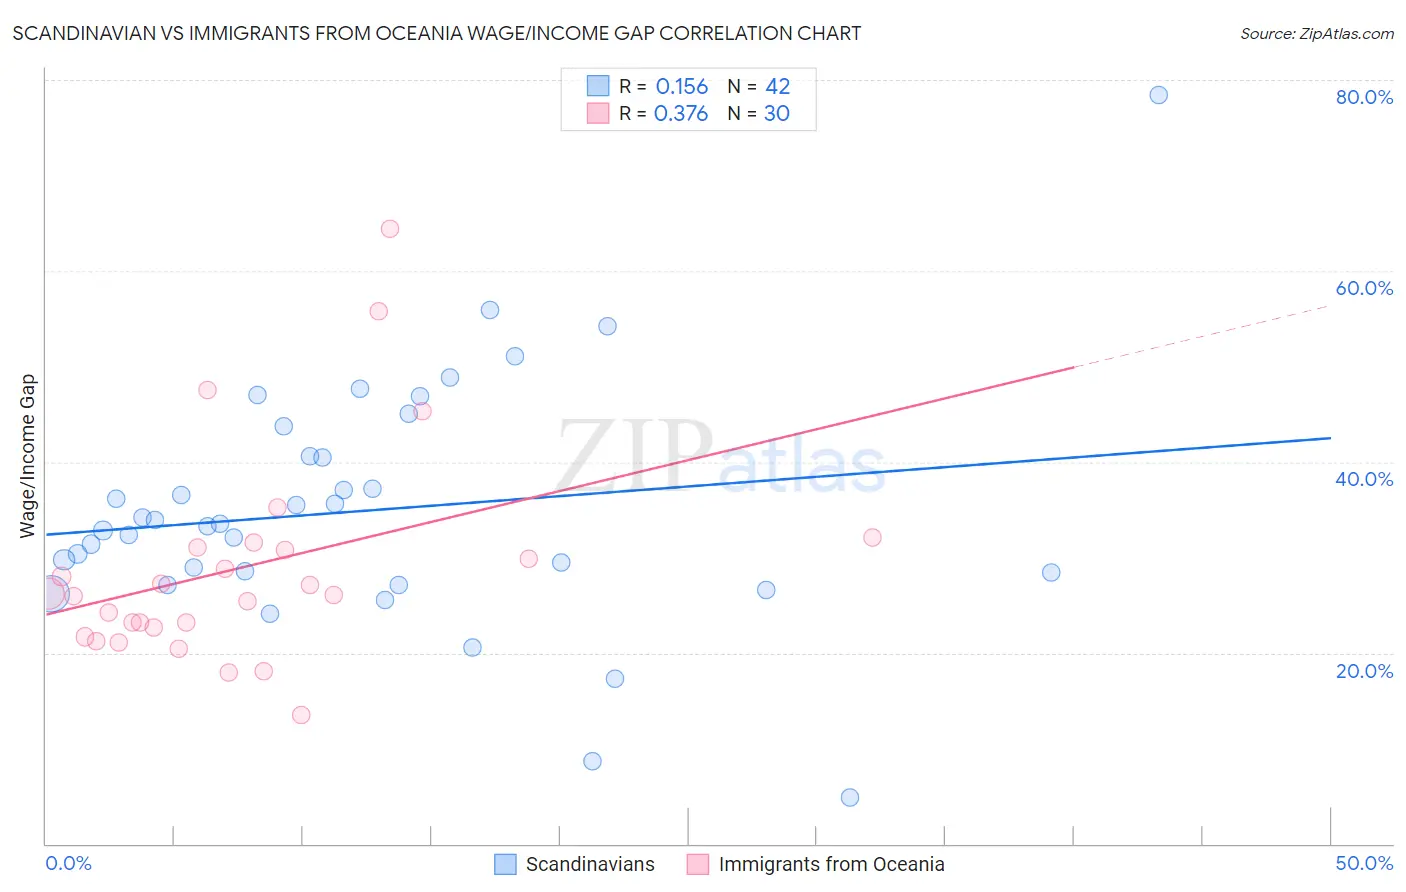
Scandinavian vs Immigrants from Oceania Wage/Income Gap Correlation Chart
The statistical analysis conducted on geographies consisting of 471,744,681 people shows a poor positive correlation between the proportion of Scandinavians and wage/income gap percentage in the United States with a correlation coefficient (R) of 0.156 and weighted average of 29.1%. Similarly, the statistical analysis conducted on geographies consisting of 305,340,706 people shows a mild positive correlation between the proportion of Immigrants from Oceania and wage/income gap percentage in the United States with a correlation coefficient (R) of 0.376 and weighted average of 25.6%, a difference of 13.5%.
Wage/Income Gap Correlation Summary
| Measurement | Scandinavian | Immigrants from Oceania |
| Minimum | 4.8% | 13.4% |
| Maximum | 78.5% | 64.4% |
| Range | 73.7% | 50.9% |
| Mean | 34.9% | 29.0% |
| Median | 33.4% | 26.1% |
| Interquartile 25% (IQ1) | 28.4% | 22.7% |
| Interquartile 75% (IQ3) | 40.6% | 31.1% |
| Interquartile Range (IQR) | 12.2% | 8.4% |
| Standard Deviation (Sample) | 12.8% | 11.1% |
| Standard Deviation (Population) | 12.6% | 10.9% |
Similar Demographics by Wage/Income Gap
Demographics Similar to Scandinavians by Wage/Income Gap
In terms of wage/income gap, the demographic groups most similar to Scandinavians are Immigrants from Iran (29.1%, a difference of 0.060%), Scottish (29.1%, a difference of 0.14%), Immigrants from Belgium (29.0%, a difference of 0.17%), Hungarian (29.0%, a difference of 0.24%), and German (29.2%, a difference of 0.24%).
| Demographics | Rating | Rank | Wage/Income Gap |
| Welsh | 0.1 /100 | #321 | Tragic 28.9% |
| Immigrants | Singapore | 0.1 /100 | #322 | Tragic 28.9% |
| Norwegians | 0.1 /100 | #323 | Tragic 29.0% |
| Croatians | 0.0 /100 | #324 | Tragic 29.0% |
| Hungarians | 0.0 /100 | #325 | Tragic 29.0% |
| Immigrants | Belgium | 0.0 /100 | #326 | Tragic 29.0% |
| Immigrants | Iran | 0.0 /100 | #327 | Tragic 29.1% |
| Scandinavians | 0.0 /100 | #328 | Tragic 29.1% |
| Scottish | 0.0 /100 | #329 | Tragic 29.1% |
| Germans | 0.0 /100 | #330 | Tragic 29.2% |
| Czechs | 0.0 /100 | #331 | Tragic 29.2% |
| Immigrants | South Central Asia | 0.0 /100 | #332 | Tragic 29.3% |
| Europeans | 0.0 /100 | #333 | Tragic 29.4% |
| Swedes | 0.0 /100 | #334 | Tragic 29.4% |
| Immigrants | Taiwan | 0.0 /100 | #335 | Tragic 29.5% |
Demographics Similar to Immigrants from Oceania by Wage/Income Gap
In terms of wage/income gap, the demographic groups most similar to Immigrants from Oceania are Immigrants from Greece (25.7%, a difference of 0.060%), Peruvian (25.6%, a difference of 0.17%), Immigrants from Chile (25.7%, a difference of 0.28%), Immigrants from Belarus (25.7%, a difference of 0.31%), and Seminole (25.6%, a difference of 0.35%).
| Demographics | Rating | Rank | Wage/Income Gap |
| Native Hawaiians | 69.0 /100 | #163 | Good 25.4% |
| Koreans | 68.6 /100 | #164 | Good 25.4% |
| Immigrants | Hong Kong | 64.0 /100 | #165 | Good 25.5% |
| Immigrants | Ukraine | 63.8 /100 | #166 | Good 25.5% |
| Paiute | 62.9 /100 | #167 | Good 25.5% |
| Seminole | 62.6 /100 | #168 | Good 25.6% |
| Peruvians | 60.1 /100 | #169 | Good 25.6% |
| Immigrants | Oceania | 57.5 /100 | #170 | Average 25.6% |
| Immigrants | Greece | 56.6 /100 | #171 | Average 25.7% |
| Immigrants | Chile | 53.2 /100 | #172 | Average 25.7% |
| Immigrants | Belarus | 52.9 /100 | #173 | Average 25.7% |
| Alaskan Athabascans | 50.0 /100 | #174 | Average 25.8% |
| Sri Lankans | 47.0 /100 | #175 | Average 25.8% |
| Paraguayans | 46.7 /100 | #176 | Average 25.8% |
| Cambodians | 45.1 /100 | #177 | Average 25.8% |