Scandinavian College, 1 year or more
COMPARE
Scandinavian
Select to Compare
College, 1 year or more
Scandinavian College, 1 year or more
61.0%
COLLEGE, 1 YEAR OR MORE
88.2/ 100
METRIC RATING
132nd/ 347
METRIC RANK
Scandinavian College, 1 year or more Correlation Chart
The statistical analysis conducted on geographies consisting of 472,656,557 people shows a mild positive correlation between the proportion of Scandinavians and percentage of population with at least college, 1 year or more education in the United States with a correlation coefficient (R) of 0.312 and weighted average of 61.0%. On average, for every 1% (one percent) increase in Scandinavians within a typical geography, there is an increase of 0.32% in percentage of population with at least college, 1 year or more education.
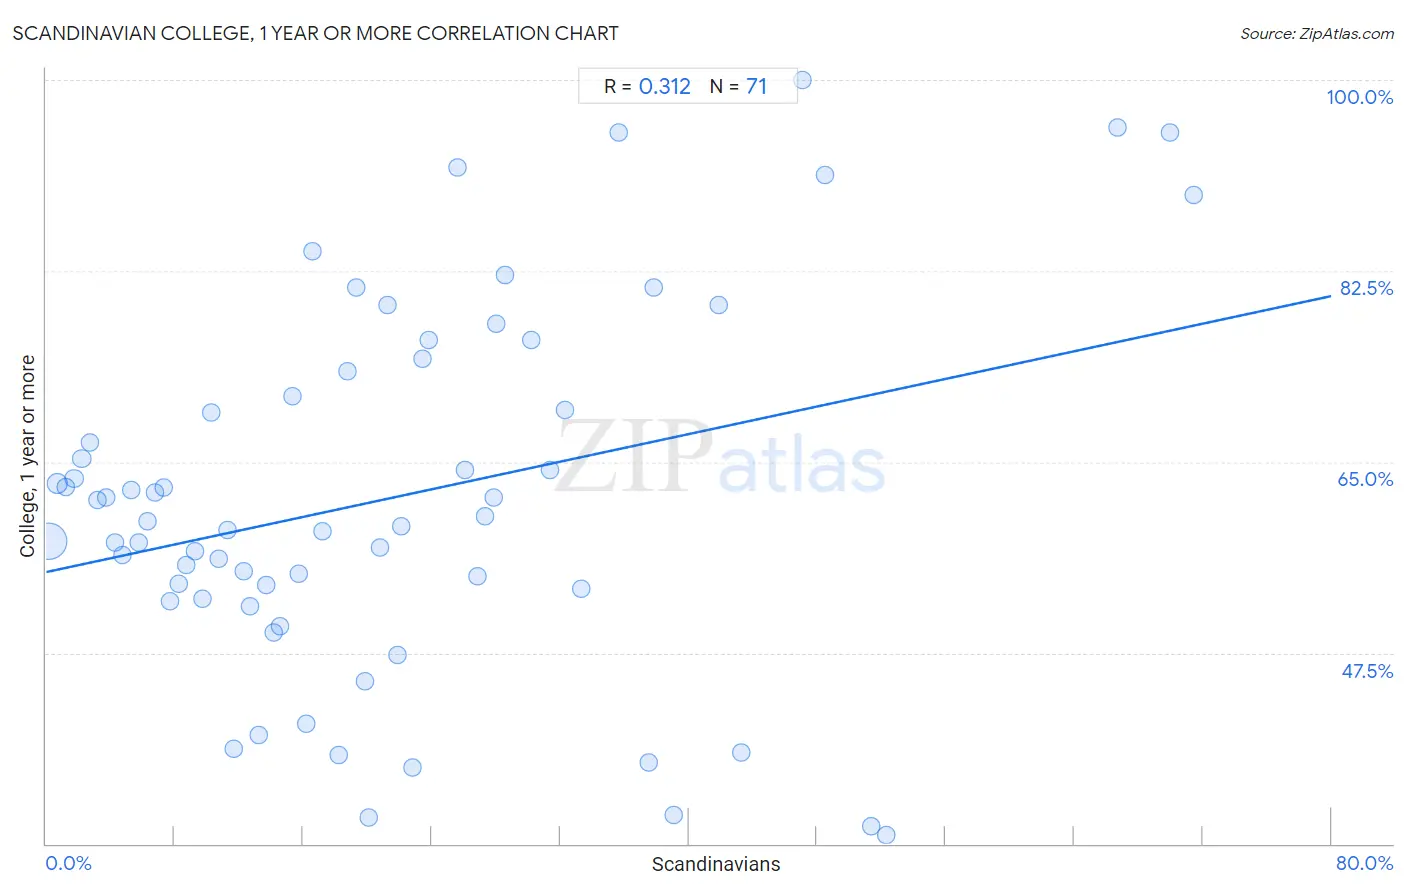
It is essential to understand that the correlation between the percentage of Scandinavians and percentage of population with at least college, 1 year or more education does not imply a direct cause-and-effect relationship. It remains uncertain whether the presence of Scandinavians influences an upward or downward trend in the level of percentage of population with at least college, 1 year or more education within an area, or if Scandinavians simply ended up residing in those areas with higher or lower levels of percentage of population with at least college, 1 year or more education due to other factors.
Demographics Similar to Scandinavians by College, 1 year or more
In terms of college, 1 year or more, the demographic groups most similar to Scandinavians are Immigrants from Uzbekistan (61.0%, a difference of 0.030%), Immigrants from Venezuela (61.0%, a difference of 0.040%), Immigrants from Uganda (60.9%, a difference of 0.10%), Basque (60.9%, a difference of 0.12%), and Immigrants from Morocco (61.1%, a difference of 0.16%).
| Demographics | Rating | Rank | College, 1 year or more |
| Immigrants from Syria | 91.6 /100 | #125 | Exceptional 61.3% |
| Alsatians | 91.3 /100 | #126 | Exceptional 61.3% |
| Immigrants from Eastern Africa | 91.1 /100 | #127 | Exceptional 61.2% |
| Immigrants from Italy | 91.1 /100 | #128 | Exceptional 61.2% |
| Ugandans | 90.7 /100 | #129 | Exceptional 61.2% |
| Italians | 89.5 /100 | #130 | Excellent 61.1% |
| Immigrants from Morocco | 89.5 /100 | #131 | Excellent 61.1% |
| Scandinavians | 88.2 /100 | #132 | Excellent 61.0% |
| Immigrants from Uzbekistan | 88.0 /100 | #133 | Excellent 61.0% |
| Immigrants from Venezuela | 87.9 /100 | #134 | Excellent 61.0% |
| Immigrants from Uganda | 87.4 /100 | #135 | Excellent 60.9% |
| Basques | 87.2 /100 | #136 | Excellent 60.9% |
| Slovenes | 86.5 /100 | #137 | Excellent 60.9% |
| Taiwanese | 84.3 /100 | #138 | Excellent 60.7% |
| Immigrants from Eritrea | 84.3 /100 | #139 | Excellent 60.7% |
Scandinavian College, 1 year or more Correlation Summary
| Measurement | Scandinavian Data | College, 1 year or more Data |
| Minimum | 0.19% | 30.8% |
| Maximum | 71.4% | 100.0% |
| Range | 71.2% | 69.2% |
| Mean | 21.4% | 61.7% |
| Median | 18.2% | 59.5% |
| Interquartile 25% (IQ1) | 8.7% | 52.4% |
| Interquartile 75% (IQ3) | 28.6% | 73.2% |
| Interquartile Range (IQR) | 19.9% | 20.8% |
| Standard Deviation (Sample) | 16.6% | 16.9% |
| Standard Deviation (Population) | 16.5% | 16.7% |
Correlation Details
| Scandinavian Percentile | Sample Size | College, 1 year or more |
[ 0.0% - 0.5% ] 0.19% | 375,811,332 | 57.7% |
[ 0.5% - 1.0% ] 0.70% | 60,157,476 | 63.0% |
[ 1.0% - 1.5% ] 1.22% | 18,946,263 | 62.7% |
[ 1.5% - 2.0% ] 1.73% | 8,443,958 | 63.5% |
[ 2.0% - 2.5% ] 2.21% | 4,762,903 | 65.3% |
[ 2.5% - 3.0% ] 2.73% | 2,339,944 | 66.8% |
[ 3.0% - 3.5% ] 3.21% | 894,228 | 61.5% |
[ 3.5% - 4.0% ] 3.72% | 488,528 | 61.8% |
[ 4.0% - 4.5% ] 4.24% | 197,654 | 57.6% |
[ 4.5% - 5.0% ] 4.74% | 123,911 | 56.5% |
[ 5.0% - 5.5% ] 5.25% | 100,799 | 62.4% |
[ 5.5% - 6.0% ] 5.75% | 112,087 | 57.6% |
[ 6.0% - 6.5% ] 6.27% | 53,828 | 59.5% |
[ 6.5% - 7.0% ] 6.76% | 57,061 | 62.2% |
[ 7.0% - 7.5% ] 7.29% | 32,490 | 62.7% |
[ 7.5% - 8.0% ] 7.71% | 22,983 | 52.2% |
[ 8.0% - 8.5% ] 8.25% | 19,965 | 53.9% |
[ 8.5% - 9.0% ] 8.71% | 14,653 | 55.5% |
[ 9.0% - 9.5% ] 9.23% | 7,642 | 56.9% |
[ 9.5% - 10.0% ] 9.72% | 6,386 | 52.4% |
[ 10.0% - 10.5% ] 10.25% | 13,080 | 69.5% |
[ 10.5% - 11.0% ] 10.74% | 6,174 | 56.1% |
[ 11.0% - 11.5% ] 11.29% | 2,029 | 58.8% |
[ 11.5% - 12.0% ] 11.66% | 2,882 | 38.8% |
[ 12.0% - 12.5% ] 12.27% | 3,725 | 55.0% |
[ 12.5% - 13.0% ] 12.71% | 1,707 | 51.8% |
[ 13.0% - 13.5% ] 13.19% | 614 | 39.9% |
[ 13.5% - 14.0% ] 13.68% | 1,447 | 53.7% |
[ 14.0% - 14.5% ] 14.13% | 4,472 | 49.3% |
[ 14.5% - 15.0% ] 14.58% | 4,726 | 49.9% |
[ 15.0% - 15.5% ] 15.31% | 980 | 71.0% |
[ 15.5% - 16.0% ] 15.71% | 1,470 | 54.8% |
[ 16.0% - 16.5% ] 16.19% | 105 | 41.0% |
[ 16.5% - 17.0% ] 16.60% | 3,874 | 84.3% |
[ 17.0% - 17.5% ] 17.23% | 2,240 | 58.6% |
[ 18.0% - 18.5% ] 18.21% | 2,164 | 38.1% |
[ 18.5% - 19.0% ] 18.78% | 181 | 73.2% |
[ 19.0% - 19.5% ] 19.33% | 150 | 80.9% |
[ 19.5% - 20.0% ] 19.87% | 463 | 44.9% |
[ 20.0% - 20.5% ] 20.10% | 960 | 32.3% |
[ 20.5% - 21.0% ] 20.80% | 524 | 57.1% |
[ 21.0% - 21.5% ] 21.27% | 489 | 79.4% |
[ 21.5% - 22.0% ] 21.83% | 1,548 | 47.3% |
[ 22.0% - 22.5% ] 22.10% | 534 | 59.1% |
[ 22.5% - 23.0% ] 22.78% | 259 | 37.0% |
[ 23.0% - 23.5% ] 23.40% | 47 | 74.5% |
[ 23.5% - 24.0% ] 23.81% | 21 | 76.2% |
[ 25.5% - 26.0% ] 25.58% | 215 | 92.0% |
[ 26.0% - 26.5% ] 26.09% | 46 | 64.3% |
[ 26.5% - 27.0% ] 26.86% | 1,627 | 54.5% |
[ 27.0% - 27.5% ] 27.32% | 388 | 60.1% |
[ 27.5% - 28.0% ] 27.87% | 61 | 61.7% |
[ 28.0% - 28.5% ] 28.03% | 603 | 77.6% |
[ 28.5% - 29.0% ] 28.57% | 28 | 82.1% |
[ 30.0% - 30.5% ] 30.23% | 311 | 76.1% |
[ 31.0% - 31.5% ] 31.37% | 255 | 64.3% |
[ 32.0% - 32.5% ] 32.27% | 313 | 69.7% |
[ 33.0% - 33.5% ] 33.33% | 30 | 53.3% |
[ 35.5% - 36.0% ] 35.63% | 87 | 95.2% |
[ 37.0% - 37.5% ] 37.50% | 16 | 37.5% |
[ 37.5% - 38.0% ] 37.79% | 217 | 81.0% |
[ 39.0% - 39.5% ] 39.10% | 156 | 32.7% |
[ 41.5% - 42.0% ] 41.90% | 179 | 79.3% |
[ 43.0% - 43.5% ] 43.27% | 312 | 38.3% |
[ 47.0% - 47.5% ] 47.06% | 51 | 100.0% |
[ 48.0% - 48.5% ] 48.49% | 299 | 91.3% |
[ 51.0% - 51.5% ] 51.35% | 37 | 31.6% |
[ 52.0% - 52.5% ] 52.27% | 88 | 30.8% |
[ 66.5% - 67.0% ] 66.67% | 87 | 95.7% |
[ 69.5% - 70.0% ] 69.93% | 153 | 95.2% |
[ 71.0% - 71.5% ] 71.43% | 42 | 89.5% |