Scandinavian Receiving Food Stamps
COMPARE
Scandinavian
Select to Compare
Receiving Food Stamps
Scandinavian Receiving Food Stamps
9.7%
PUBLIC INCOME | FOOD STAMPS
99.2/ 100
METRIC RATING
58th/ 347
METRIC RANK
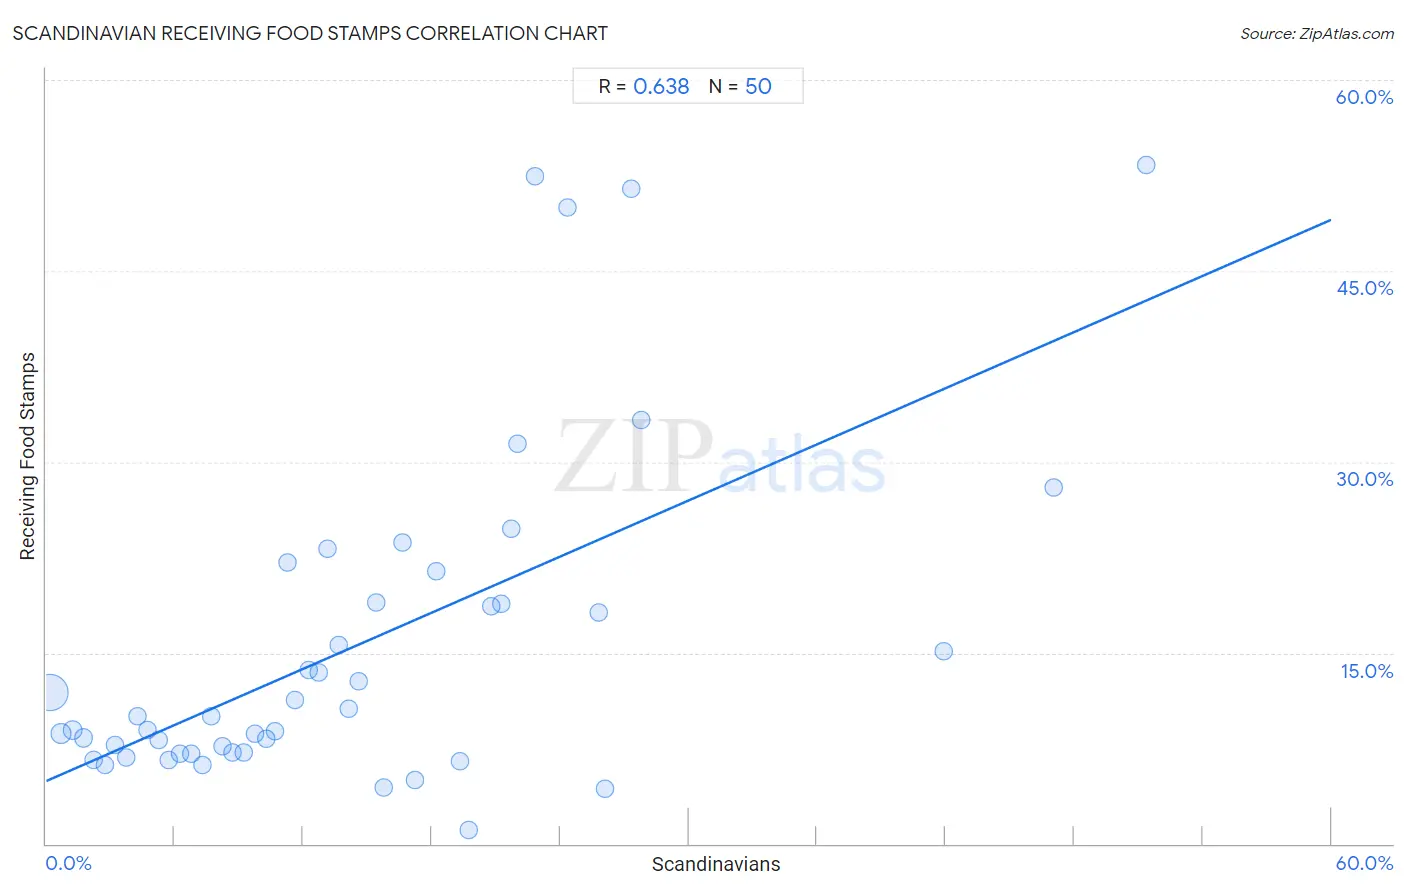
Scandinavian Receiving Food Stamps Correlation Chart
The statistical analysis conducted on geographies consisting of 470,816,598 people shows a significant positive correlation between the proportion of Scandinavians and percentage of population receiving government assistance and/or food stamps in the United States with a correlation coefficient (R) of 0.638 and weighted average of 9.7%. On average, for every 1% (one percent) increase in Scandinavians within a typical geography, there is an increase of 0.74% in percentage of population receiving government assistance and/or food stamps.
It is essential to understand that the correlation between the percentage of Scandinavians and percentage of population receiving government assistance and/or food stamps does not imply a direct cause-and-effect relationship. It remains uncertain whether the presence of Scandinavians influences an upward or downward trend in the level of percentage of population receiving government assistance and/or food stamps within an area, or if Scandinavians simply ended up residing in those areas with higher or lower levels of percentage of population receiving government assistance and/or food stamps due to other factors.
Demographics Similar to Scandinavians by Receiving Food Stamps
In terms of receiving food stamps, the demographic groups most similar to Scandinavians are British (9.7%, a difference of 0.030%), Greek (9.7%, a difference of 0.060%), German (9.7%, a difference of 0.13%), Immigrants from Canada (9.7%, a difference of 0.17%), and English (9.8%, a difference of 0.27%).
| Demographics | Rating | Rank | Receiving Food Stamps |
| Asians | 99.3 /100 | #51 | Exceptional 9.7% |
| Immigrants from South Africa | 99.3 /100 | #52 | Exceptional 9.7% |
| Tongans | 99.3 /100 | #53 | Exceptional 9.7% |
| Swiss | 99.3 /100 | #54 | Exceptional 9.7% |
| Immigrants from Switzerland | 99.3 /100 | #55 | Exceptional 9.7% |
| Immigrants from Canada | 99.3 /100 | #56 | Exceptional 9.7% |
| Greeks | 99.3 /100 | #57 | Exceptional 9.7% |
| Scandinavians | 99.2 /100 | #58 | Exceptional 9.7% |
| British | 99.2 /100 | #59 | Exceptional 9.7% |
| Germans | 99.2 /100 | #60 | Exceptional 9.7% |
| English | 99.2 /100 | #61 | Exceptional 9.8% |
| Immigrants from Bulgaria | 99.2 /100 | #62 | Exceptional 9.8% |
| Chinese | 99.2 /100 | #63 | Exceptional 9.8% |
| Immigrants from North America | 99.2 /100 | #64 | Exceptional 9.8% |
| Immigrants from Turkey | 99.1 /100 | #65 | Exceptional 9.8% |
Scandinavian Receiving Food Stamps Correlation Summary
| Measurement | Scandinavian Data | Receiving Food Stamps Data |
| Minimum | 0.19% | 1.1% |
| Maximum | 51.4% | 53.3% |
| Range | 51.2% | 52.2% |
| Mean | 14.5% | 15.6% |
| Median | 12.5% | 10.0% |
| Interquartile 25% (IQ1) | 6.3% | 7.1% |
| Interquartile 75% (IQ3) | 20.8% | 18.9% |
| Interquartile Range (IQR) | 14.5% | 11.8% |
| Standard Deviation (Sample) | 11.3% | 13.0% |
| Standard Deviation (Population) | 11.2% | 12.9% |
Correlation Details
| Scandinavian Percentile | Sample Size | Receiving Food Stamps |
[ 0.0% - 0.5% ] 0.19% | 374,831,226 | 11.9% |
[ 0.5% - 1.0% ] 0.70% | 59,823,936 | 8.7% |
[ 1.0% - 1.5% ] 1.22% | 18,774,278 | 8.9% |
[ 1.5% - 2.0% ] 1.73% | 8,339,372 | 8.3% |
[ 2.0% - 2.5% ] 2.21% | 4,694,284 | 6.6% |
[ 2.5% - 3.0% ] 2.73% | 2,306,687 | 6.2% |
[ 3.0% - 3.5% ] 3.21% | 866,344 | 7.8% |
[ 3.5% - 4.0% ] 3.72% | 466,153 | 6.7% |
[ 4.0% - 4.5% ] 4.24% | 186,846 | 10.0% |
[ 4.5% - 5.0% ] 4.74% | 112,645 | 9.0% |
[ 5.0% - 5.5% ] 5.25% | 76,910 | 8.1% |
[ 5.5% - 6.0% ] 5.75% | 102,441 | 6.6% |
[ 6.0% - 6.5% ] 6.27% | 50,087 | 7.1% |
[ 6.5% - 7.0% ] 6.76% | 54,771 | 7.1% |
[ 7.0% - 7.5% ] 7.30% | 29,870 | 6.2% |
[ 7.5% - 8.0% ] 7.73% | 19,305 | 10.0% |
[ 8.0% - 8.5% ] 8.23% | 17,647 | 7.6% |
[ 8.5% - 9.0% ] 8.69% | 11,412 | 7.1% |
[ 9.0% - 9.5% ] 9.22% | 6,787 | 7.2% |
[ 9.5% - 10.0% ] 9.74% | 4,848 | 8.6% |
[ 10.0% - 10.5% ] 10.25% | 12,868 | 8.3% |
[ 10.5% - 11.0% ] 10.70% | 3,513 | 8.8% |
[ 11.0% - 11.5% ] 11.29% | 939 | 22.1% |
[ 11.5% - 12.0% ] 11.63% | 1,763 | 11.3% |
[ 12.0% - 12.5% ] 12.26% | 2,986 | 13.6% |
[ 12.5% - 13.0% ] 12.73% | 770 | 13.4% |
[ 13.0% - 13.5% ] 13.15% | 464 | 23.1% |
[ 13.5% - 14.0% ] 13.68% | 1,367 | 15.6% |
[ 14.0% - 14.5% ] 14.12% | 4,051 | 10.6% |
[ 14.5% - 15.0% ] 14.57% | 4,393 | 12.8% |
[ 15.0% - 15.5% ] 15.38% | 676 | 18.9% |
[ 15.5% - 16.0% ] 15.75% | 508 | 4.5% |
[ 16.5% - 17.0% ] 16.63% | 806 | 23.7% |
[ 17.0% - 17.5% ] 17.24% | 2,100 | 5.0% |
[ 18.0% - 18.5% ] 18.20% | 813 | 21.4% |
[ 19.0% - 19.5% ] 19.33% | 150 | 6.5% |
[ 19.5% - 20.0% ] 19.72% | 213 | 1.1% |
[ 20.5% - 21.0% ] 20.80% | 524 | 18.6% |
[ 21.0% - 21.5% ] 21.26% | 127 | 18.9% |
[ 21.5% - 22.0% ] 21.69% | 687 | 24.7% |
[ 22.0% - 22.5% ] 22.02% | 168 | 31.4% |
[ 22.5% - 23.0% ] 22.81% | 171 | 52.4% |
[ 24.0% - 24.5% ] 24.32% | 37 | 50.0% |
[ 25.5% - 26.0% ] 25.81% | 31 | 18.2% |
[ 26.0% - 26.5% ] 26.09% | 46 | 4.3% |
[ 27.0% - 27.5% ] 27.30% | 293 | 51.5% |
[ 27.5% - 28.0% ] 27.78% | 18 | 33.3% |
[ 41.5% - 42.0% ] 41.90% | 179 | 15.1% |
[ 47.0% - 47.5% ] 47.06% | 51 | 28.0% |
[ 51.0% - 51.5% ] 51.35% | 37 | 53.3% |