Scandinavian Child Poverty Under the Age of 5

COMPARE

Scandinavian
Race
Ancestry
AfghanAfricanAlaska NativeAlaskan AthabascanAlbanianAleutAlsatianAmericanApacheArabArapahoArgentineanArmenianAssyrian/Chaldean/SyriacAustralianAustrianBahamianBangladeshiBarbadianBasqueBelgianBelizeanBermudanBhutaneseBlackfeetBolivianBrazilianBritishBritish West IndianBulgarianBurmeseCajunCambodianCanadianCape VerdeanCarpatho RusynCelticCentral AmericanCentral American IndianCherokeeCheyenneChickasawChileanChineseChippewaChoctawColombianColvilleComancheCosta RicanCreeCreekCroatianCrowCubanCypriotCzechCzechoslovakianDanishDelawareDominicanDutchDutch West IndianEastern EuropeanEcuadorianEgyptianEnglishEstonianEthiopianEuropeanFijianFilipinoFinnishFrenchFrench American IndianFrench CanadianGermanGerman RussianGhanaianGreekGuamanian/ChamorroGuatemalanGuyaneseHaitianHmongHonduranHopiHoumaHungarianIcelanderIndian (Asian)IndonesianInupiatIranianIraqiIrishIroquoisIsraeliItalianJamaicanJapaneseJordanianKenyanKiowaKoreanLaotianLatvianLebaneseLiberianLithuanianLumbeeLuxembourgerMacedonianMalaysianMalteseMarshalleseMenomineeMexicanMexican American IndianMongolianMoroccanNative HawaiianNavajoNepaleseNew ZealanderNicaraguanNigerianNorthern EuropeanNorwegianOkinawanOsageOttawaPaiutePakistaniPalestinianPanamanianParaguayanPennsylvania GermanPeruvianPimaPolishPortuguesePotawatomiPuebloPuerto RicanPuget Sound SalishRomanianRussianSalvadoranSamoanScandinavianScotch-IrishScottishSeminoleSenegaleseSerbianShoshoneSierra LeoneanSiouxSlavicSlovakSloveneSomaliSouth AfricanSouth AmericanSouth American IndianSoviet UnionSpaniardSpanishSpanish AmericanSpanish American IndianSri LankanSubsaharan AfricanSudaneseSwedishSwissSyrianTaiwaneseThaiTlingit-HaidaTohono O'OdhamTonganTrinidadian and TobagonianTsimshianTurkishU.S. Virgin IslanderUgandanUkrainianUruguayanUteVenezuelanVietnameseWelshWest IndianYakamaYaquiYugoslavianYumanYup'ikZimbabwean
Immigration
NonimmigrantsImmigrantsAfghanistanAfricaAlbaniaArgentinaArmeniaAsiaAustraliaAustriaBahamasBangladeshBarbadosBelarusBelgiumBelizeBoliviaBosnia and HerzegovinaBrazilBulgariaBurma/MyanmarCabo VerdeCambodiaCameroonCanadaCaribbeanCentral AmericaChileChinaColombiaCongoCosta RicaCroatiaCubaCzechoslovakiaDenmarkDominicaDominican RepublicEastern AfricaEastern AsiaEastern EuropeEcuadorEgyptEl SalvadorEnglandEritreaEthiopiaEuropeFijiFranceGermanyGhanaGreeceGrenadaGuatemalaGuyanaHaitiHondurasHong KongHungaryIndiaIndonesiaIranIraqIrelandIsraelItalyJamaicaJapanJordanKazakhstanKenyaKoreaKuwaitLaosLatin AmericaLatviaLebanonLiberiaLithuaniaMalaysiaMexicoMicronesiaMiddle AfricaMoldovaMoroccoNepalNetherlandsNicaraguaNigeriaNorth AmericaNorth MacedoniaNorthern AfricaNorthern EuropeNorwayOceaniaPakistanPanamaPeruPhilippinesPolandPortugalRomaniaRussiaSaudi ArabiaScotlandSenegalSerbiaSierra LeoneSingaporeSomaliaSouth AfricaSouth AmericaSouth Central AsiaSouth Eastern AsiaSouthern EuropeSpainSri LankaSt. Vincent and the GrenadinesSudanSwedenSwitzerlandSyriaTaiwanThailandTrinidad and TobagoTurkeyUgandaUkraineUruguayUzbekistanVenezuelaVietnamWest IndiesWestern AfricaWestern AsiaWestern EuropeYemenZaireZimbabweAzores
Select to Compare
Race
Ancestry
AfghanAfricanAlaska NativeAlaskan AthabascanAlbanianAleutAlsatianAmericanApacheArabArapahoArgentineanArmenianAssyrian/Chaldean/SyriacAustralianAustrianBahamianBangladeshiBarbadianBasqueBelgianBelizeanBermudanBhutaneseBlackfeetBolivianBrazilianBritishBritish West IndianBulgarianBurmeseCajunCambodianCanadianCape VerdeanCarpatho RusynCelticCentral AmericanCentral American IndianCherokeeCheyenneChickasawChileanChineseChippewaChoctawColombianColvilleComancheCosta RicanCreeCreekCroatianCrowCubanCypriotCzechCzechoslovakianDanishDelawareDominicanDutchDutch West IndianEastern EuropeanEcuadorianEgyptianEnglishEstonianEthiopianEuropeanFijianFilipinoFinnishFrenchFrench American IndianFrench CanadianGermanGerman RussianGhanaianGreekGuamanian/ChamorroGuatemalanGuyaneseHaitianHmongHonduranHopiHoumaHungarianIcelanderIndian (Asian)IndonesianInupiatIranianIraqiIrishIroquoisIsraeliItalianJamaicanJapaneseJordanianKenyanKiowaKoreanLaotianLatvianLebaneseLiberianLithuanianLumbeeLuxembourgerMacedonianMalaysianMalteseMarshalleseMenomineeMexicanMexican American IndianMongolianMoroccanNative HawaiianNavajoNepaleseNew ZealanderNicaraguanNigerianNorthern EuropeanNorwegianOkinawanOsageOttawaPaiutePakistaniPalestinianPanamanianParaguayanPennsylvania GermanPeruvianPimaPolishPortuguesePotawatomiPuebloPuerto RicanPuget Sound SalishRomanianRussianSalvadoranSamoanScotch-IrishScottishSeminoleSenegaleseSerbianShoshoneSierra LeoneanSiouxSlavicSlovakSloveneSomaliSouth AfricanSouth AmericanSouth American IndianSoviet UnionSpaniardSpanishSpanish AmericanSpanish American IndianSri LankanSubsaharan AfricanSudaneseSwedishSwissSyrianTaiwaneseThaiTlingit-HaidaTohono O'OdhamTonganTrinidadian and TobagonianTsimshianTurkishU.S. Virgin IslanderUgandanUkrainianUruguayanUteVenezuelanVietnameseWelshWest IndianYakamaYaquiYugoslavianYumanYup'ikZimbabwean
Immigration
NonimmigrantsImmigrantsAfghanistanAfricaAlbaniaArgentinaArmeniaAsiaAustraliaAustriaBahamasBangladeshBarbadosBelarusBelgiumBelizeBoliviaBosnia and HerzegovinaBrazilBulgariaBurma/MyanmarCabo VerdeCambodiaCameroonCanadaCaribbeanCentral AmericaChileChinaColombiaCongoCosta RicaCroatiaCubaCzechoslovakiaDenmarkDominicaDominican RepublicEastern AfricaEastern AsiaEastern EuropeEcuadorEgyptEl SalvadorEnglandEritreaEthiopiaEuropeFijiFranceGermanyGhanaGreeceGrenadaGuatemalaGuyanaHaitiHondurasHong KongHungaryIndiaIndonesiaIranIraqIrelandIsraelItalyJamaicaJapanJordanKazakhstanKenyaKoreaKuwaitLaosLatin AmericaLatviaLebanonLiberiaLithuaniaMalaysiaMexicoMicronesiaMiddle AfricaMoldovaMoroccoNepalNetherlandsNicaraguaNigeriaNorth AmericaNorth MacedoniaNorthern AfricaNorthern EuropeNorwayOceaniaPakistanPanamaPeruPhilippinesPolandPortugalRomaniaRussiaSaudi ArabiaScotlandSenegalSerbiaSierra LeoneSingaporeSomaliaSouth AfricaSouth AmericaSouth Central AsiaSouth Eastern AsiaSouthern EuropeSpainSri LankaSt. Vincent and the GrenadinesSudanSwedenSwitzerlandSyriaTaiwanThailandTrinidad and TobagoTurkeyUgandaUkraineUruguayUzbekistanVenezuelaVietnamWest IndiesWestern AfricaWestern AsiaWestern EuropeYemenZaireZimbabweAzores
Child Poverty Under the Age of 5
Income
Poverty
Unemployment
Labor Participation
Family Structure
Vehicle Availability
Education Level
Disability

Scandinavian Child Poverty Under the Age of 5
Exceptional

15.7%
POVERTY | CHILDREN < 5
97.1/ 100
METRIC RATING
92nd/ 347
METRIC RANK

Scandinavian Child Poverty Under the Age of 5 Correlation Chart

The statistical analysis conducted on geographies consisting of 447,069,136 people shows a significant positive correlation between the proportion of Scandinavians and poverty level among children under the age of 5 in the United States with a correlation coefficient (R) of 0.680 and weighted average of 15.7%. On average, for every 1% (one percent) increase in Scandinavians within a typical geography, there is an increase of 2.2% in poverty level among children under the age of 5.
Scandinavian Child Poverty Under the Age of 5
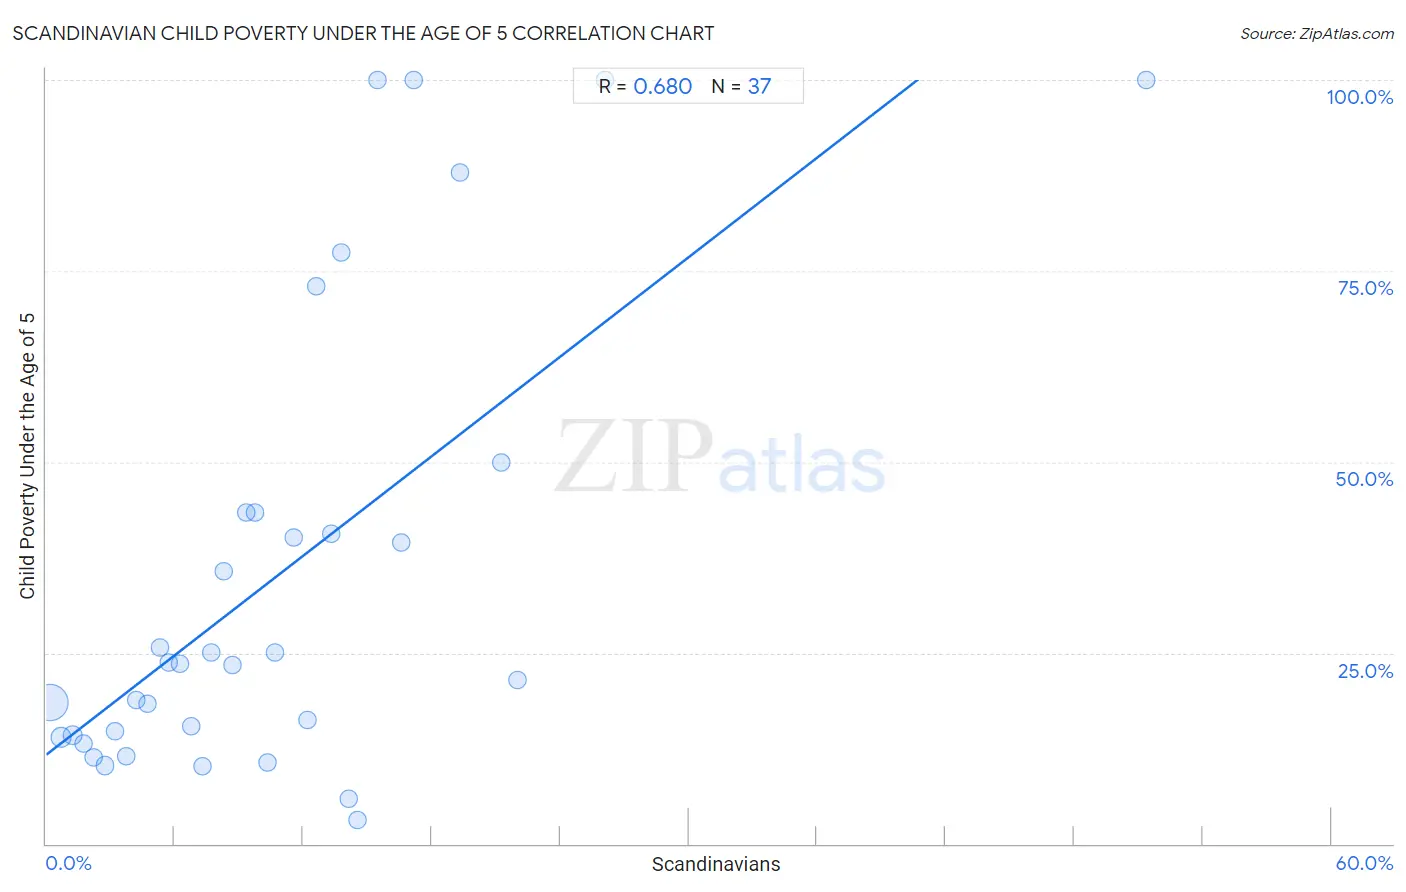
It is essential to understand that the correlation between the percentage of Scandinavians and poverty level among children under the age of 5 does not imply a direct cause-and-effect relationship. It remains uncertain whether the presence of Scandinavians influences an upward or downward trend in the level of poverty level among children under the age of 5 within an area, or if Scandinavians simply ended up residing in those areas with higher or lower levels of poverty level among children under the age of 5 due to other factors.

Demographics Similar to Scandinavians by Child Poverty Under the Age of 5

In terms of child poverty under the age of 5, the demographic groups most similar to Scandinavians are Ukrainian (15.7%, a difference of 0.020%), Immigrants from South Eastern Asia (15.7%, a difference of 0.040%), Polish (15.7%, a difference of 0.060%), Immigrants from France (15.6%, a difference of 0.17%), and Immigrants from Croatia (15.6%, a difference of 0.18%).
DemographicsRating | RankChild Poverty Under the Age of 5
Immigrants from Latvia
97.4
/100
|
#85
Exceptional
15.6%
Immigrants from Malaysia
97.4
/100
|
#86
Exceptional
15.6%
Immigrants from Vietnam
97.4
/100
|
#87
Exceptional
15.6%
Jordanians
97.3
/100
|
#88
Exceptional
15.6%
Immigrants from Croatia
97.3
/100
|
#89
Exceptional
15.6%
Immigrants from France
97.3
/100
|
#90
Exceptional
15.6%
Poles
97.2
/100
|
#91
Exceptional
15.7%
Scandinavians
97.1
/100
|
#92
Exceptional
15.7%
Ukrainians
97.1
/100
|
#93
Exceptional
15.7%
Immigrants from South Eastern Asia
97.1
/100
|
#94
Exceptional
15.7%
Immigrants from Switzerland
96.4
/100
|
#95
Exceptional
15.8%
Immigrants from Kazakhstan
96.2
/100
|
#96
Exceptional
15.8%
Macedonians
96.2
/100
|
#97
Exceptional
15.8%
Immigrants from South Africa
96.1
/100
|
#98
Exceptional
15.8%
Palestinians
95.9
/100
|
#99
Exceptional
15.8%

Scandinavian Child Poverty Under the Age of 5 Correlation Summary

MeasurementScandinavian DataChild Poverty Under the Age of 5 Data
Minimum0.19%3.2%
Maximum51.4%100.0%
Range51.2%96.8%
Mean10.9%35.3%
Median9.3%23.5%
Interquartile 25% (IQ1)4.5%14.0%
Interquartile 75% (IQ3)14.3%43.4%
Interquartile Range (IQR)9.8%29.4%
Standard Deviation (Sample)9.4%30.0%
Standard Deviation (Population)9.3%29.6%

Correlation Details

Scandinavian PercentileSample SizeChild Poverty Under the Age of 5
[
0.0%
-
0.5%
]
0.19%
360,062,88418.5%
[
0.5%
-
1.0%
]
0.70%
54,825,84113.9%
[
1.0%
-
1.5%
]
1.22%
16,909,97814.2%
[
1.5%
-
2.0%
]
1.73%
7,534,81313.1%
[
2.0%
-
2.5%
]
2.21%
4,251,65411.3%
[
2.5%
-
3.0%
]
2.72%
1,993,97110.2%
[
3.0%
-
3.5%
]
3.20%
691,25814.7%
[
3.5%
-
4.0%
]
3.71%
330,29211.4%
[
4.0%
-
4.5%
]
4.23%
127,32518.8%
[
4.5%
-
5.0%
]
4.73%
89,40918.3%
[
5.0%
-
5.5%
]
5.32%
41,53525.7%
[
5.5%
-
6.0%
]
5.72%
69,70023.8%
[
6.0%
-
6.5%
]
6.26%
31,27923.5%
[
6.5%
-
7.0%
]
6.78%
33,19915.5%
[
7.0%
-
7.5%
]
7.32%
23,89210.1%
[
7.5%
-
8.0%
]
7.68%
9,11725.1%
[
8.0%
-
8.5%
]
8.26%
8,65135.6%
[
8.5%
-
9.0%
]
8.69%
5,23423.4%
[
9.0%
-
9.5%
]
9.35%
2,06543.4%
[
9.5%
-
10.0%
]
9.76%
2,37843.4%
[
10.0%
-
10.5%
]
10.31%
6,34410.7%
[
10.5%
-
11.0%
]
10.69%
2,68625.0%
[
11.5%
-
12.0%
]
11.58%
1,04540.1%
[
12.0%
-
12.5%
]
12.20%
1,28716.2%
[
12.5%
-
13.0%
]
12.61%
35773.0%
[
13.0%
-
13.5%
]
13.33%
15040.6%
[
13.5%
-
14.0%
]
13.75%
74977.3%
[
14.0%
-
14.5%
]
14.10%
3,8365.8%
[
14.5%
-
15.0%
]
14.53%
3,3653.2%
[
15.0%
-
15.5%
]
15.48%
465100.0%
[
16.5%
-
17.0%
]
16.59%
3,01439.5%
[
17.0%
-
17.5%
]
17.14%
420100.0%
[
19.0%
-
19.5%
]
19.33%
11987.9%
[
21.0%
-
21.5%
]
21.26%
12750.0%
[
21.5%
-
22.0%
]
21.99%
61421.4%
[
26.0%
-
26.5%
]
26.09%
46100.0%
[
51.0%
-
51.5%
]
51.35%
37100.0%