Scandinavian Disability Age Under 5
COMPARE
Scandinavian
Select to Compare
Disability Age Under 5
Scandinavian Disability Age Under 5
1.5%
DISABILITY | AGE UNDER 5
0.0/ 100
METRIC RATING
287th/ 347
METRIC RANK
Scandinavian Disability Age Under 5 Correlation Chart
The statistical analysis conducted on geographies consisting of 234,208,425 people shows a strong positive correlation between the proportion of Scandinavians and percentage of population with a disability under the age of 5 in the United States with a correlation coefficient (R) of 0.735 and weighted average of 1.5%. On average, for every 1% (one percent) increase in Scandinavians within a typical geography, there is an increase of 3.4% in percentage of population with a disability under the age of 5.
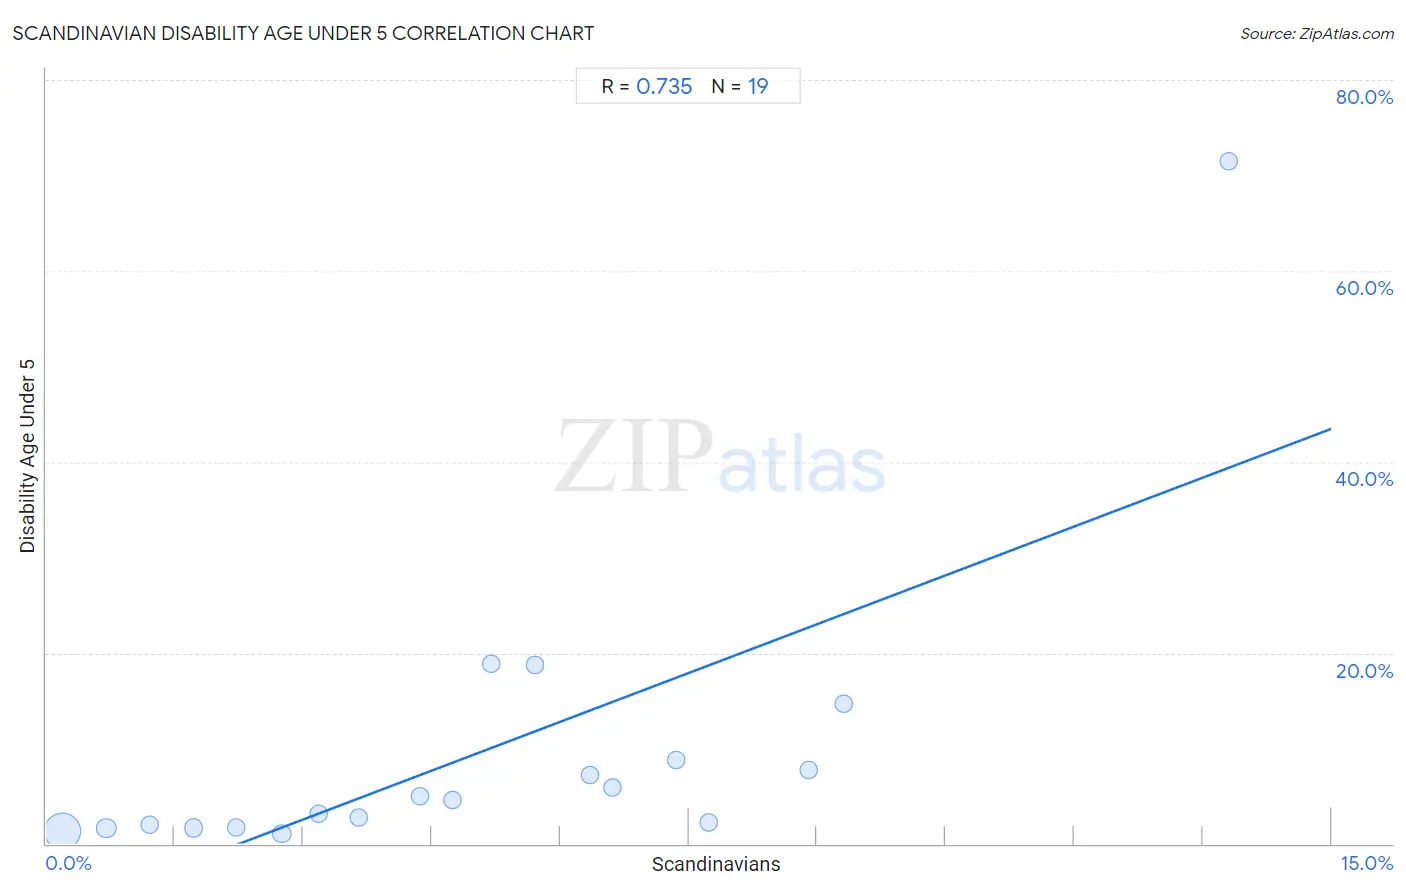
It is essential to understand that the correlation between the percentage of Scandinavians and percentage of population with a disability under the age of 5 does not imply a direct cause-and-effect relationship. It remains uncertain whether the presence of Scandinavians influences an upward or downward trend in the level of percentage of population with a disability under the age of 5 within an area, or if Scandinavians simply ended up residing in those areas with higher or lower levels of percentage of population with a disability under the age of 5 due to other factors.
Demographics Similar to Scandinavians by Disability Age Under 5
In terms of disability age under 5, the demographic groups most similar to Scandinavians are Tlingit-Haida (1.5%, a difference of 0.050%), Estonian (1.5%, a difference of 0.18%), Croatian (1.5%, a difference of 0.30%), Hungarian (1.5%, a difference of 0.32%), and Czech (1.5%, a difference of 0.45%).
| Demographics | Rating | Rank | Disability Age Under 5 |
| British | 0.0 /100 | #280 | Tragic 1.5% |
| Czechoslovakians | 0.0 /100 | #281 | Tragic 1.5% |
| Cheyenne | 0.0 /100 | #282 | Tragic 1.5% |
| Delaware | 0.0 /100 | #283 | Tragic 1.5% |
| Europeans | 0.0 /100 | #284 | Tragic 1.5% |
| Croatians | 0.0 /100 | #285 | Tragic 1.5% |
| Tlingit-Haida | 0.0 /100 | #286 | Tragic 1.5% |
| Scandinavians | 0.0 /100 | #287 | Tragic 1.5% |
| Estonians | 0.0 /100 | #288 | Tragic 1.5% |
| Hungarians | 0.0 /100 | #289 | Tragic 1.5% |
| Czechs | 0.0 /100 | #290 | Tragic 1.5% |
| Northern Europeans | 0.0 /100 | #291 | Tragic 1.6% |
| Italians | 0.0 /100 | #292 | Tragic 1.6% |
| Lithuanians | 0.0 /100 | #293 | Tragic 1.6% |
| Swedes | 0.0 /100 | #294 | Tragic 1.6% |
Scandinavian Disability Age Under 5 Correlation Summary
| Measurement | Scandinavian Data | Disability Age Under 5 Data |
| Minimum | 0.18% | 1.1% |
| Maximum | 13.8% | 71.4% |
| Range | 13.6% | 70.3% |
| Mean | 5.0% | 9.5% |
| Median | 4.7% | 4.6% |
| Interquartile 25% (IQ1) | 2.2% | 1.7% |
| Interquartile 75% (IQ3) | 7.3% | 8.7% |
| Interquartile Range (IQR) | 5.1% | 7.0% |
| Standard Deviation (Sample) | 3.5% | 16.0% |
| Standard Deviation (Population) | 3.4% | 15.6% |
Correlation Details
| Scandinavian Percentile | Sample Size | Disability Age Under 5 |
[ 0.0% - 0.5% ] 0.18% | 196,004,444 | 1.3% |
[ 0.5% - 1.0% ] 0.70% | 25,041,711 | 1.6% |
[ 1.0% - 1.5% ] 1.21% | 6,793,647 | 2.0% |
[ 1.5% - 2.0% ] 1.72% | 3,526,443 | 1.7% |
[ 2.0% - 2.5% ] 2.21% | 1,557,475 | 1.7% |
[ 2.5% - 3.0% ] 2.75% | 833,423 | 1.1% |
[ 3.0% - 3.5% ] 3.17% | 301,817 | 3.1% |
[ 3.5% - 4.0% ] 3.65% | 94,895 | 2.7% |
[ 4.0% - 4.5% ] 4.36% | 28,922 | 4.9% |
[ 4.5% - 5.0% ] 4.74% | 13,807 | 4.6% |
[ 5.0% - 5.5% ] 5.19% | 1,829 | 18.8% |
[ 5.5% - 6.0% ] 5.70% | 965 | 18.8% |
[ 6.0% - 6.5% ] 6.35% | 4,834 | 7.2% |
[ 6.5% - 7.0% ] 6.61% | 560 | 5.9% |
[ 7.0% - 7.5% ] 7.35% | 1,184 | 8.7% |
[ 7.5% - 8.0% ] 7.74% | 1,008 | 2.2% |
[ 8.5% - 9.0% ] 8.89% | 416 | 7.7% |
[ 9.0% - 9.5% ] 9.31% | 451 | 14.7% |
[ 13.5% - 14.0% ] 13.80% | 594 | 71.4% |