Scandinavian Disability Age 5 to 17

COMPARE

Scandinavian
Race
Ancestry
AfghanAfricanAlaska NativeAlaskan AthabascanAlbanianAleutAlsatianAmericanApacheArabArapahoArgentineanArmenianAssyrian/Chaldean/SyriacAustralianAustrianBahamianBangladeshiBarbadianBasqueBelgianBelizeanBermudanBhutaneseBlackfeetBolivianBrazilianBritishBritish West IndianBulgarianBurmeseCajunCambodianCanadianCape VerdeanCarpatho RusynCelticCentral AmericanCentral American IndianCherokeeCheyenneChickasawChileanChineseChippewaChoctawColombianColvilleComancheCosta RicanCreeCreekCroatianCrowCubanCypriotCzechCzechoslovakianDanishDelawareDominicanDutchDutch West IndianEastern EuropeanEcuadorianEgyptianEnglishEstonianEthiopianEuropeanFijianFilipinoFinnishFrenchFrench American IndianFrench CanadianGermanGerman RussianGhanaianGreekGuamanian/ChamorroGuatemalanGuyaneseHaitianHmongHonduranHopiHoumaHungarianIcelanderIndian (Asian)IndonesianInupiatIranianIraqiIrishIroquoisIsraeliItalianJamaicanJapaneseJordanianKenyanKiowaKoreanLaotianLatvianLebaneseLiberianLithuanianLumbeeLuxembourgerMacedonianMalaysianMalteseMarshalleseMenomineeMexicanMexican American IndianMongolianMoroccanNative HawaiianNavajoNepaleseNew ZealanderNicaraguanNigerianNorthern EuropeanNorwegianOkinawanOsageOttawaPaiutePakistaniPalestinianPanamanianParaguayanPennsylvania GermanPeruvianPimaPolishPortuguesePotawatomiPuebloPuerto RicanPuget Sound SalishRomanianRussianSalvadoranSamoanScandinavianScotch-IrishScottishSeminoleSenegaleseSerbianShoshoneSierra LeoneanSiouxSlavicSlovakSloveneSomaliSouth AfricanSouth AmericanSouth American IndianSoviet UnionSpaniardSpanishSpanish AmericanSpanish American IndianSri LankanSubsaharan AfricanSudaneseSwedishSwissSyrianTaiwaneseThaiTlingit-HaidaTohono O'OdhamTonganTrinidadian and TobagonianTsimshianTurkishU.S. Virgin IslanderUgandanUkrainianUruguayanUteVenezuelanVietnameseWelshWest IndianYakamaYaquiYugoslavianYumanYup'ikZimbabwean
Immigration
NonimmigrantsImmigrantsAfghanistanAfricaAlbaniaArgentinaArmeniaAsiaAustraliaAustriaBahamasBangladeshBarbadosBelarusBelgiumBelizeBoliviaBosnia and HerzegovinaBrazilBulgariaBurma/MyanmarCabo VerdeCambodiaCameroonCanadaCaribbeanCentral AmericaChileChinaColombiaCongoCosta RicaCroatiaCubaCzechoslovakiaDenmarkDominicaDominican RepublicEastern AfricaEastern AsiaEastern EuropeEcuadorEgyptEl SalvadorEnglandEritreaEthiopiaEuropeFijiFranceGermanyGhanaGreeceGrenadaGuatemalaGuyanaHaitiHondurasHong KongHungaryIndiaIndonesiaIranIraqIrelandIsraelItalyJamaicaJapanJordanKazakhstanKenyaKoreaKuwaitLaosLatin AmericaLatviaLebanonLiberiaLithuaniaMalaysiaMexicoMicronesiaMiddle AfricaMoldovaMoroccoNepalNetherlandsNicaraguaNigeriaNorth AmericaNorth MacedoniaNorthern AfricaNorthern EuropeNorwayOceaniaPakistanPanamaPeruPhilippinesPolandPortugalRomaniaRussiaSaudi ArabiaScotlandSenegalSerbiaSierra LeoneSingaporeSomaliaSouth AfricaSouth AmericaSouth Central AsiaSouth Eastern AsiaSouthern EuropeSpainSri LankaSt. Vincent and the GrenadinesSudanSwedenSwitzerlandSyriaTaiwanThailandTrinidad and TobagoTurkeyUgandaUkraineUruguayUzbekistanVenezuelaVietnamWest IndiesWestern AfricaWestern AsiaWestern EuropeYemenZaireZimbabweAzores
Select to Compare
Race
Ancestry
AfghanAfricanAlaska NativeAlaskan AthabascanAlbanianAleutAlsatianAmericanApacheArabArapahoArgentineanArmenianAssyrian/Chaldean/SyriacAustralianAustrianBahamianBangladeshiBarbadianBasqueBelgianBelizeanBermudanBhutaneseBlackfeetBolivianBrazilianBritishBritish West IndianBulgarianBurmeseCajunCambodianCanadianCape VerdeanCarpatho RusynCelticCentral AmericanCentral American IndianCherokeeCheyenneChickasawChileanChineseChippewaChoctawColombianColvilleComancheCosta RicanCreeCreekCroatianCrowCubanCypriotCzechCzechoslovakianDanishDelawareDominicanDutchDutch West IndianEastern EuropeanEcuadorianEgyptianEnglishEstonianEthiopianEuropeanFijianFilipinoFinnishFrenchFrench American IndianFrench CanadianGermanGerman RussianGhanaianGreekGuamanian/ChamorroGuatemalanGuyaneseHaitianHmongHonduranHopiHoumaHungarianIcelanderIndian (Asian)IndonesianInupiatIranianIraqiIrishIroquoisIsraeliItalianJamaicanJapaneseJordanianKenyanKiowaKoreanLaotianLatvianLebaneseLiberianLithuanianLumbeeLuxembourgerMacedonianMalaysianMalteseMarshalleseMenomineeMexicanMexican American IndianMongolianMoroccanNative HawaiianNavajoNepaleseNew ZealanderNicaraguanNigerianNorthern EuropeanNorwegianOkinawanOsageOttawaPaiutePakistaniPalestinianPanamanianParaguayanPennsylvania GermanPeruvianPimaPolishPortuguesePotawatomiPuebloPuerto RicanPuget Sound SalishRomanianRussianSalvadoranSamoanScotch-IrishScottishSeminoleSenegaleseSerbianShoshoneSierra LeoneanSiouxSlavicSlovakSloveneSomaliSouth AfricanSouth AmericanSouth American IndianSoviet UnionSpaniardSpanishSpanish AmericanSpanish American IndianSri LankanSubsaharan AfricanSudaneseSwedishSwissSyrianTaiwaneseThaiTlingit-HaidaTohono O'OdhamTonganTrinidadian and TobagonianTsimshianTurkishU.S. Virgin IslanderUgandanUkrainianUruguayanUteVenezuelanVietnameseWelshWest IndianYakamaYaquiYugoslavianYumanYup'ikZimbabwean
Immigration
NonimmigrantsImmigrantsAfghanistanAfricaAlbaniaArgentinaArmeniaAsiaAustraliaAustriaBahamasBangladeshBarbadosBelarusBelgiumBelizeBoliviaBosnia and HerzegovinaBrazilBulgariaBurma/MyanmarCabo VerdeCambodiaCameroonCanadaCaribbeanCentral AmericaChileChinaColombiaCongoCosta RicaCroatiaCubaCzechoslovakiaDenmarkDominicaDominican RepublicEastern AfricaEastern AsiaEastern EuropeEcuadorEgyptEl SalvadorEnglandEritreaEthiopiaEuropeFijiFranceGermanyGhanaGreeceGrenadaGuatemalaGuyanaHaitiHondurasHong KongHungaryIndiaIndonesiaIranIraqIrelandIsraelItalyJamaicaJapanJordanKazakhstanKenyaKoreaKuwaitLaosLatin AmericaLatviaLebanonLiberiaLithuaniaMalaysiaMexicoMicronesiaMiddle AfricaMoldovaMoroccoNepalNetherlandsNicaraguaNigeriaNorth AmericaNorth MacedoniaNorthern AfricaNorthern EuropeNorwayOceaniaPakistanPanamaPeruPhilippinesPolandPortugalRomaniaRussiaSaudi ArabiaScotlandSenegalSerbiaSierra LeoneSingaporeSomaliaSouth AfricaSouth AmericaSouth Central AsiaSouth Eastern AsiaSouthern EuropeSpainSri LankaSt. Vincent and the GrenadinesSudanSwedenSwitzerlandSyriaTaiwanThailandTrinidad and TobagoTurkeyUgandaUkraineUruguayUzbekistanVenezuelaVietnamWest IndiesWestern AfricaWestern AsiaWestern EuropeYemenZaireZimbabweAzores
Disability Age 5 to 17
Income
Poverty
Unemployment
Labor Participation
Family Structure
Vehicle Availability
Education Level
Disability

Scandinavian Disability Age 5 to 17
Tragic

5.9%
DISABILITY | AGE 5 TO 17
1.4/ 100
METRIC RATING
253rd/ 347
METRIC RANK

Scandinavian Disability Age 5 to 17 Correlation Chart

The statistical analysis conducted on geographies consisting of 465,927,365 people shows a significant positive correlation between the proportion of Scandinavians and percentage of population with a disability between the ages 5 and 17 in the United States with a correlation coefficient (R) of 0.604 and weighted average of 5.9%. On average, for every 1% (one percent) increase in Scandinavians within a typical geography, there is an increase of 1.4% in percentage of population with a disability between the ages 5 and 17.
Scandinavian Disability Age 5 to 17
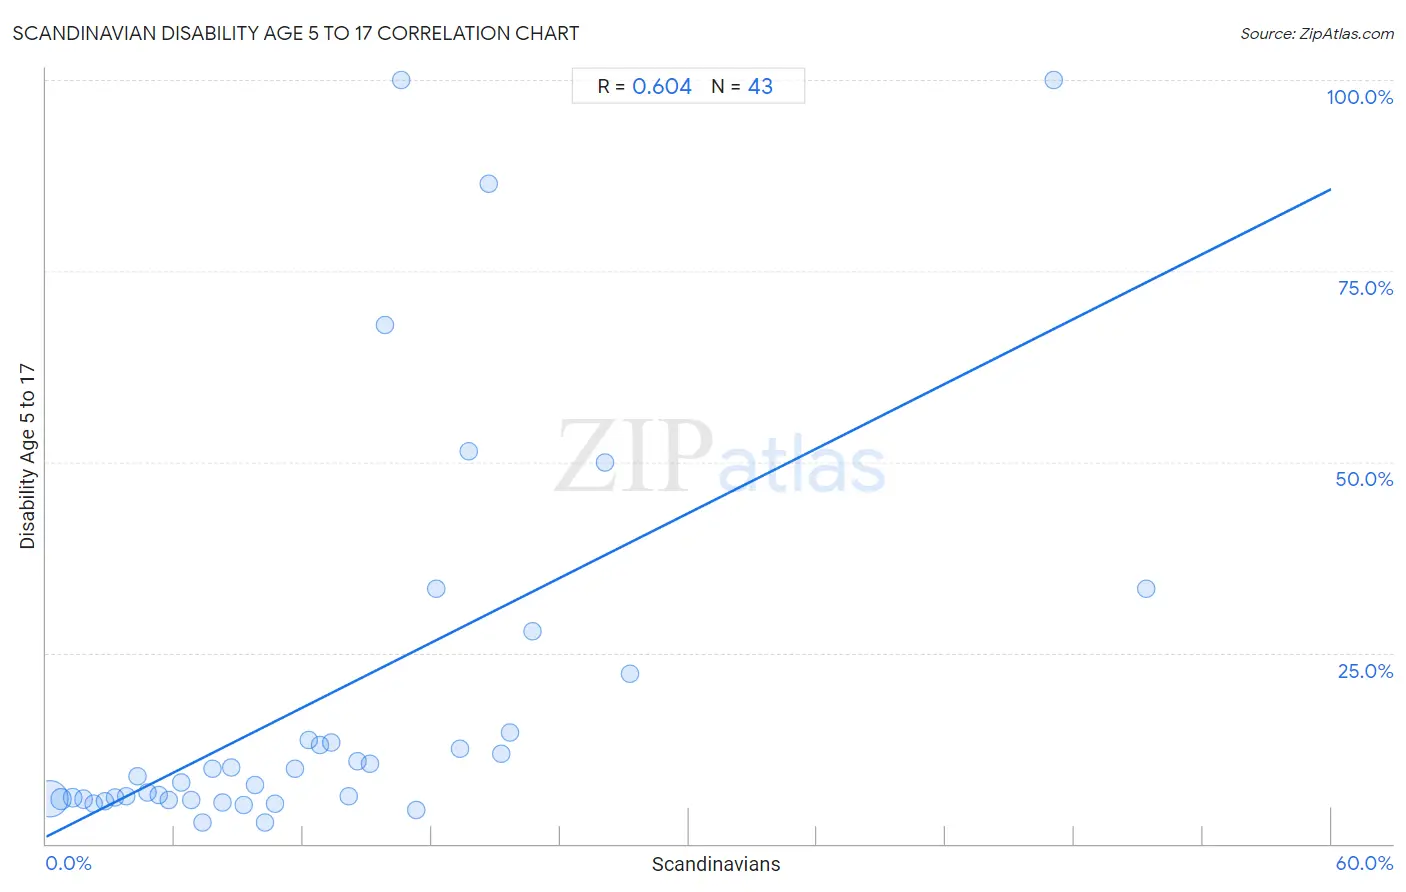
It is essential to understand that the correlation between the percentage of Scandinavians and percentage of population with a disability between the ages 5 and 17 does not imply a direct cause-and-effect relationship. It remains uncertain whether the presence of Scandinavians influences an upward or downward trend in the level of percentage of population with a disability between the ages 5 and 17 within an area, or if Scandinavians simply ended up residing in those areas with higher or lower levels of percentage of population with a disability between the ages 5 and 17 due to other factors.

Demographics Similar to Scandinavians by Disability Age 5 to 17

In terms of disability age 5 to 17, the demographic groups most similar to Scandinavians are Honduran (5.9%, a difference of 0.070%), Immigrants from Cambodia (5.9%, a difference of 0.090%), Barbadian (5.9%, a difference of 0.10%), Polish (5.9%, a difference of 0.11%), and Italian (5.9%, a difference of 0.17%).
DemographicsRating | RankDisability Age 5 to 17
Tlingit-Haida
1.9
/100
|
#246
Tragic
5.9%
Immigrants from Honduras
1.8
/100
|
#247
Tragic
5.9%
British
1.7
/100
|
#248
Tragic
5.9%
Immigrants from Ghana
1.7
/100
|
#249
Tragic
5.9%
Poles
1.5
/100
|
#250
Tragic
5.9%
Immigrants from Cambodia
1.5
/100
|
#251
Tragic
5.9%
Hondurans
1.5
/100
|
#252
Tragic
5.9%
Scandinavians
1.4
/100
|
#253
Tragic
5.9%
Barbadians
1.3
/100
|
#254
Tragic
5.9%
Italians
1.2
/100
|
#255
Tragic
5.9%
Hopi
1.0
/100
|
#256
Tragic
5.9%
Hispanics or Latinos
1.0
/100
|
#257
Tragic
5.9%
Brazilians
0.9
/100
|
#258
Tragic
5.9%
Slavs
0.9
/100
|
#259
Tragic
5.9%
Somalis
0.8
/100
|
#260
Tragic
5.9%

Scandinavian Disability Age 5 to 17 Correlation Summary

MeasurementScandinavian DataDisability Age 5 to 17 Data
Minimum0.19%2.7%
Maximum51.4%100.0%
Range51.2%97.3%
Mean13.0%19.3%
Median10.7%8.8%
Interquartile 25% (IQ1)5.3%5.8%
Interquartile 75% (IQ3)18.2%14.5%
Interquartile Range (IQR)12.9%8.7%
Standard Deviation (Sample)10.8%25.4%
Standard Deviation (Population)10.7%25.1%

Correlation Details

Scandinavian PercentileSample SizeDisability Age 5 to 17
[
0.0%
-
0.5%
]
0.19%
372,299,4795.9%
[
0.5%
-
1.0%
]
0.70%
58,499,8155.9%
[
1.0%
-
1.5%
]
1.22%
18,382,9106.0%
[
1.5%
-
2.0%
]
1.73%
8,098,2005.8%
[
2.0%
-
2.5%
]
2.21%
4,569,7915.2%
[
2.5%
-
3.0%
]
2.73%
2,235,8465.6%
[
3.0%
-
3.5%
]
3.21%
813,6226.1%
[
3.5%
-
4.0%
]
3.72%
434,5156.3%
[
4.0%
-
4.5%
]
4.23%
157,6678.8%
[
4.5%
-
5.0%
]
4.73%
107,6416.8%
[
5.0%
-
5.5%
]
5.26%
74,4666.3%
[
5.5%
-
6.0%
]
5.73%
91,9755.8%
[
6.0%
-
6.5%
]
6.28%
41,7118.0%
[
6.5%
-
7.0%
]
6.76%
34,9765.8%
[
7.0%
-
7.5%
]
7.32%
24,7532.8%
[
7.5%
-
8.0%
]
7.77%
9,1249.8%
[
8.0%
-
8.5%
]
8.24%
11,6295.5%
[
8.5%
-
9.0%
]
8.65%
8,7499.9%
[
9.0%
-
9.5%
]
9.21%
2,7265.1%
[
9.5%
-
10.0%
]
9.75%
2,3387.8%
[
10.0%
-
10.5%
]
10.19%
6,5472.7%
[
10.5%
-
11.0%
]
10.69%
2,6865.3%
[
11.5%
-
12.0%
]
11.62%
1,4119.9%
[
12.0%
-
12.5%
]
12.24%
2,14113.6%
[
12.5%
-
13.0%
]
12.81%
48412.9%
[
13.0%
-
13.5%
]
13.33%
15013.3%
[
14.0%
-
14.5%
]
14.10%
3,7606.2%
[
14.5%
-
15.0%
]
14.55%
4,16510.9%
[
15.0%
-
15.5%
]
15.13%
11910.5%
[
15.5%
-
16.0%
]
15.84%
30367.9%
[
16.5%
-
17.0%
]
16.57%
495100.0%
[
17.0%
-
17.5%
]
17.26%
1,6804.5%
[
18.0%
-
18.5%
]
18.18%
19833.3%
[
19.0%
-
19.5%
]
19.33%
11912.5%
[
19.5%
-
20.0%
]
19.72%
21351.4%
[
20.5%
-
21.0%
]
20.67%
15086.4%
[
21.0%
-
21.5%
]
21.26%
12711.8%
[
21.5%
-
22.0%
]
21.65%
19414.5%
[
22.5%
-
23.0%
]
22.73%
8827.8%
[
26.0%
-
26.5%
]
26.09%
4650.0%
[
27.0%
-
27.5%
]
27.24%
26822.3%
[
47.0%
-
47.5%
]
47.06%
51100.0%
[
51.0%
-
51.5%
]
51.35%
3733.3%