Navajo vs Immigrants from Sudan Wage/Income Gap
COMPARE
Navajo
Immigrants from Sudan
Wage/Income Gap
Wage/Income Gap Comparison
Navajo
Immigrants from Sudan
22.4%
WAGE/INCOME GAP
100.0/ 100
METRIC RATING
59th/ 347
METRIC RANK
23.6%
WAGE/INCOME GAP
99.4/ 100
METRIC RATING
97th/ 347
METRIC RANK
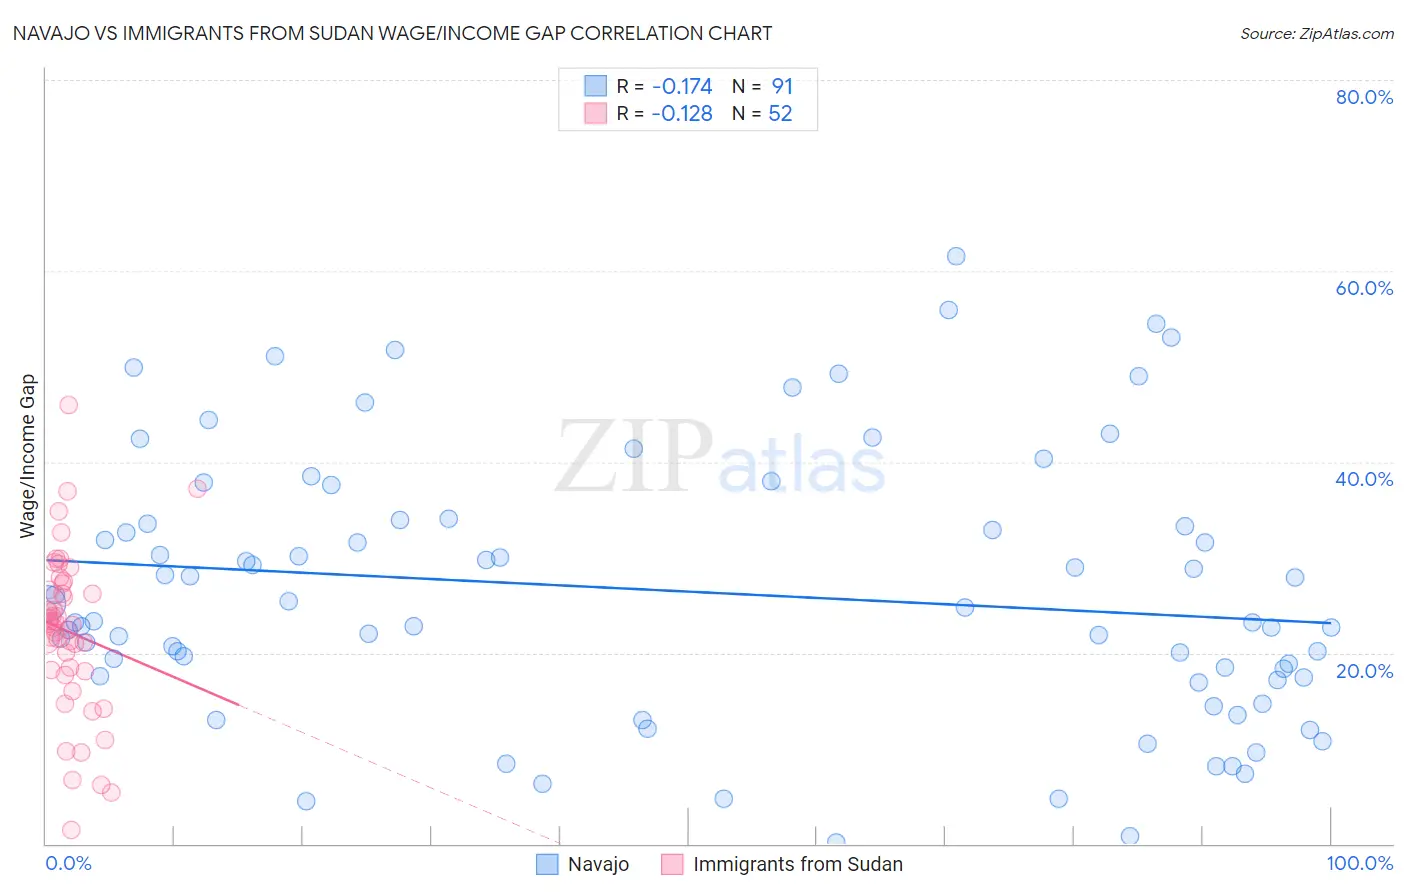
Navajo vs Immigrants from Sudan Wage/Income Gap Correlation Chart
The statistical analysis conducted on geographies consisting of 224,670,877 people shows a poor negative correlation between the proportion of Navajo and wage/income gap percentage in the United States with a correlation coefficient (R) of -0.174 and weighted average of 22.4%. Similarly, the statistical analysis conducted on geographies consisting of 118,934,661 people shows a poor negative correlation between the proportion of Immigrants from Sudan and wage/income gap percentage in the United States with a correlation coefficient (R) of -0.128 and weighted average of 23.6%, a difference of 5.7%.
Wage/Income Gap Correlation Summary
| Measurement | Navajo | Immigrants from Sudan |
| Minimum | 0.15% | 1.4% |
| Maximum | 61.5% | 46.0% |
| Range | 61.3% | 44.6% |
| Mean | 26.4% | 22.2% |
| Median | 23.3% | 23.0% |
| Interquartile 25% (IQ1) | 17.5% | 18.1% |
| Interquartile 75% (IQ3) | 33.9% | 26.9% |
| Interquartile Range (IQR) | 16.4% | 8.8% |
| Standard Deviation (Sample) | 13.9% | 8.5% |
| Standard Deviation (Population) | 13.8% | 8.4% |
Similar Demographics by Wage/Income Gap
Demographics Similar to Navajo by Wage/Income Gap
In terms of wage/income gap, the demographic groups most similar to Navajo are Immigrants from Middle Africa (22.4%, a difference of 0.020%), Immigrants from Cuba (22.4%, a difference of 0.040%), Ghanaian (22.3%, a difference of 0.12%), Immigrants from Fiji (22.4%, a difference of 0.19%), and Immigrants from Ghana (22.3%, a difference of 0.22%).
| Demographics | Rating | Rank | Wage/Income Gap |
| Immigrants | Cameroon | 100.0 /100 | #52 | Exceptional 22.2% |
| Bangladeshis | 100.0 /100 | #53 | Exceptional 22.2% |
| Nepalese | 100.0 /100 | #54 | Exceptional 22.2% |
| Immigrants | Zaire | 100.0 /100 | #55 | Exceptional 22.3% |
| Immigrants | Ghana | 100.0 /100 | #56 | Exceptional 22.3% |
| Ghanaians | 100.0 /100 | #57 | Exceptional 22.3% |
| Immigrants | Cuba | 100.0 /100 | #58 | Exceptional 22.4% |
| Navajo | 100.0 /100 | #59 | Exceptional 22.4% |
| Immigrants | Middle Africa | 100.0 /100 | #60 | Exceptional 22.4% |
| Immigrants | Fiji | 100.0 /100 | #61 | Exceptional 22.4% |
| Immigrants | Guatemala | 100.0 /100 | #62 | Exceptional 22.5% |
| Immigrants | Ecuador | 100.0 /100 | #63 | Exceptional 22.5% |
| Spanish American Indians | 100.0 /100 | #64 | Exceptional 22.5% |
| Guatemalans | 99.9 /100 | #65 | Exceptional 22.6% |
| Central American Indians | 99.9 /100 | #66 | Exceptional 22.7% |
Demographics Similar to Immigrants from Sudan by Wage/Income Gap
In terms of wage/income gap, the demographic groups most similar to Immigrants from Sudan are Kiowa (23.6%, a difference of 0.090%), Cape Verdean (23.6%, a difference of 0.21%), Honduran (23.6%, a difference of 0.24%), Immigrants from Cabo Verde (23.6%, a difference of 0.33%), and Immigrants from Latin America (23.7%, a difference of 0.40%).
| Demographics | Rating | Rank | Wage/Income Gap |
| Nicaraguans | 99.6 /100 | #90 | Exceptional 23.4% |
| Arapaho | 99.6 /100 | #91 | Exceptional 23.5% |
| Immigrants | Honduras | 99.5 /100 | #92 | Exceptional 23.5% |
| Immigrants | Cabo Verde | 99.5 /100 | #93 | Exceptional 23.6% |
| Hondurans | 99.5 /100 | #94 | Exceptional 23.6% |
| Cape Verdeans | 99.4 /100 | #95 | Exceptional 23.6% |
| Kiowa | 99.4 /100 | #96 | Exceptional 23.6% |
| Immigrants | Sudan | 99.4 /100 | #97 | Exceptional 23.6% |
| Immigrants | Latin America | 99.2 /100 | #98 | Exceptional 23.7% |
| Aleuts | 99.2 /100 | #99 | Exceptional 23.7% |
| Yakama | 99.2 /100 | #100 | Exceptional 23.7% |
| Japanese | 99.1 /100 | #101 | Exceptional 23.8% |
| Immigrants | Laos | 99.0 /100 | #102 | Exceptional 23.8% |
| Tsimshian | 98.9 /100 | #103 | Exceptional 23.9% |
| Tlingit-Haida | 98.7 /100 | #104 | Exceptional 24.0% |