Navajo vs Burmese Wage/Income Gap
COMPARE
Navajo
Burmese
Wage/Income Gap
Wage/Income Gap Comparison
Navajo
Burmese
22.4%
WAGE/INCOME GAP
100.0/ 100
METRIC RATING
59th/ 347
METRIC RANK
28.0%
WAGE/INCOME GAP
0.5/ 100
METRIC RATING
281st/ 347
METRIC RANK
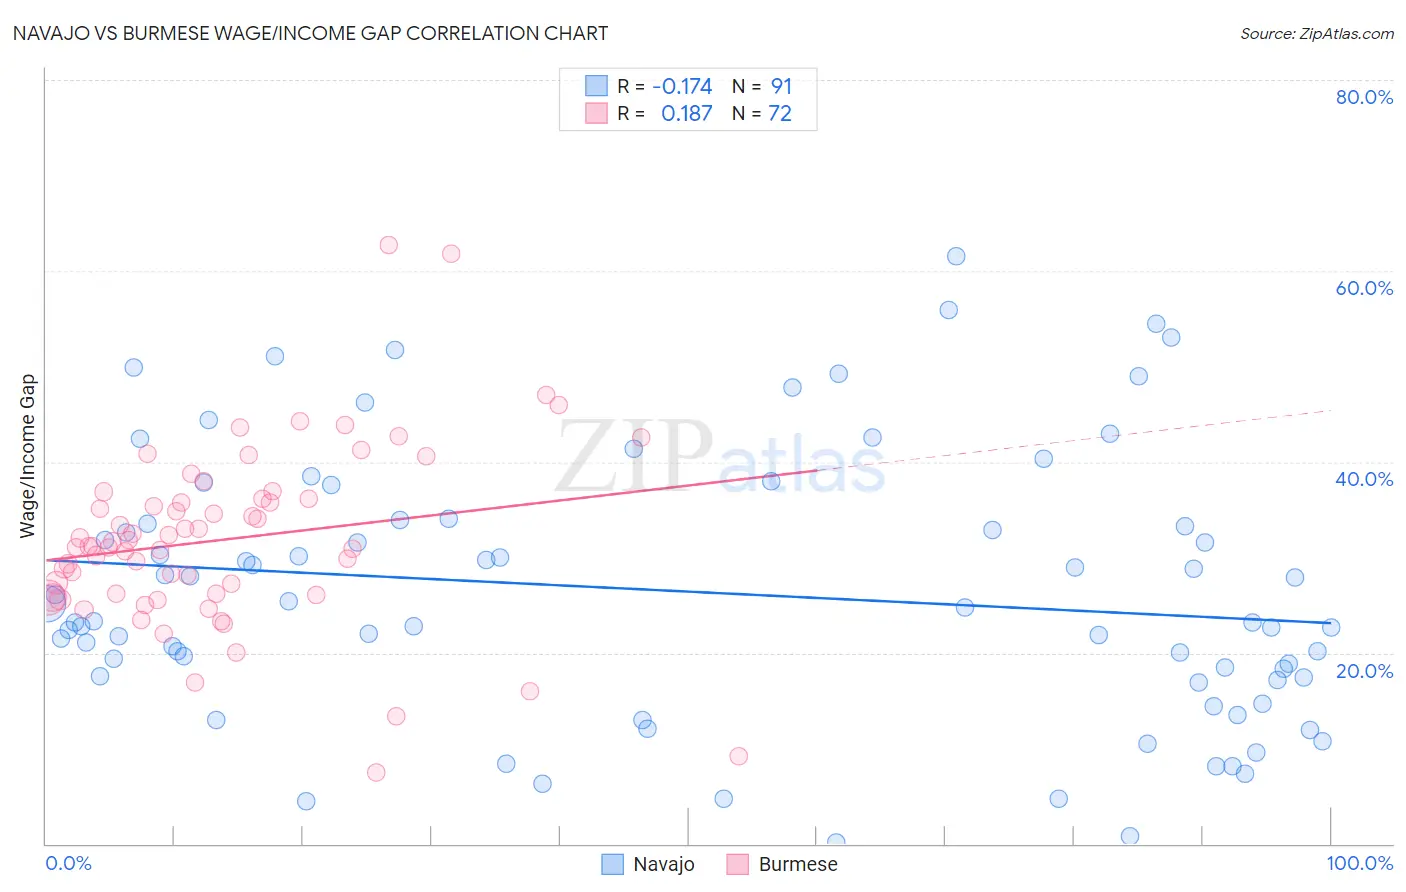
Navajo vs Burmese Wage/Income Gap Correlation Chart
The statistical analysis conducted on geographies consisting of 224,670,877 people shows a poor negative correlation between the proportion of Navajo and wage/income gap percentage in the United States with a correlation coefficient (R) of -0.174 and weighted average of 22.4%. Similarly, the statistical analysis conducted on geographies consisting of 464,918,136 people shows a poor positive correlation between the proportion of Burmese and wage/income gap percentage in the United States with a correlation coefficient (R) of 0.187 and weighted average of 28.0%, a difference of 25.3%.
Wage/Income Gap Correlation Summary
| Measurement | Navajo | Burmese |
| Minimum | 0.15% | 7.4% |
| Maximum | 61.5% | 62.7% |
| Range | 61.3% | 55.3% |
| Mean | 26.4% | 31.9% |
| Median | 23.3% | 31.2% |
| Interquartile 25% (IQ1) | 17.5% | 26.1% |
| Interquartile 75% (IQ3) | 33.9% | 36.1% |
| Interquartile Range (IQR) | 16.4% | 10.0% |
| Standard Deviation (Sample) | 13.9% | 9.5% |
| Standard Deviation (Population) | 13.8% | 9.5% |
Similar Demographics by Wage/Income Gap
Demographics Similar to Navajo by Wage/Income Gap
In terms of wage/income gap, the demographic groups most similar to Navajo are Immigrants from Middle Africa (22.4%, a difference of 0.020%), Immigrants from Cuba (22.4%, a difference of 0.040%), Ghanaian (22.3%, a difference of 0.12%), Immigrants from Fiji (22.4%, a difference of 0.19%), and Immigrants from Ghana (22.3%, a difference of 0.22%).
| Demographics | Rating | Rank | Wage/Income Gap |
| Immigrants | Cameroon | 100.0 /100 | #52 | Exceptional 22.2% |
| Bangladeshis | 100.0 /100 | #53 | Exceptional 22.2% |
| Nepalese | 100.0 /100 | #54 | Exceptional 22.2% |
| Immigrants | Zaire | 100.0 /100 | #55 | Exceptional 22.3% |
| Immigrants | Ghana | 100.0 /100 | #56 | Exceptional 22.3% |
| Ghanaians | 100.0 /100 | #57 | Exceptional 22.3% |
| Immigrants | Cuba | 100.0 /100 | #58 | Exceptional 22.4% |
| Navajo | 100.0 /100 | #59 | Exceptional 22.4% |
| Immigrants | Middle Africa | 100.0 /100 | #60 | Exceptional 22.4% |
| Immigrants | Fiji | 100.0 /100 | #61 | Exceptional 22.4% |
| Immigrants | Guatemala | 100.0 /100 | #62 | Exceptional 22.5% |
| Immigrants | Ecuador | 100.0 /100 | #63 | Exceptional 22.5% |
| Spanish American Indians | 100.0 /100 | #64 | Exceptional 22.5% |
| Guatemalans | 99.9 /100 | #65 | Exceptional 22.6% |
| Central American Indians | 99.9 /100 | #66 | Exceptional 22.7% |
Demographics Similar to Burmese by Wage/Income Gap
In terms of wage/income gap, the demographic groups most similar to Burmese are South African (28.0%, a difference of 0.030%), Russian (28.0%, a difference of 0.050%), Romanian (28.0%, a difference of 0.20%), French Canadian (28.1%, a difference of 0.21%), and Immigrants from Sweden (28.1%, a difference of 0.22%).
| Demographics | Rating | Rank | Wage/Income Gap |
| Americans | 0.7 /100 | #274 | Tragic 27.8% |
| Immigrants | Japan | 0.7 /100 | #275 | Tragic 27.9% |
| Lebanese | 0.7 /100 | #276 | Tragic 27.9% |
| Latvians | 0.7 /100 | #277 | Tragic 27.9% |
| Immigrants | England | 0.6 /100 | #278 | Tragic 27.9% |
| Romanians | 0.5 /100 | #279 | Tragic 28.0% |
| Russians | 0.5 /100 | #280 | Tragic 28.0% |
| Burmese | 0.5 /100 | #281 | Tragic 28.0% |
| South Africans | 0.5 /100 | #282 | Tragic 28.0% |
| French Canadians | 0.4 /100 | #283 | Tragic 28.1% |
| Immigrants | Sweden | 0.4 /100 | #284 | Tragic 28.1% |
| Italians | 0.4 /100 | #285 | Tragic 28.1% |
| Immigrants | Austria | 0.4 /100 | #286 | Tragic 28.1% |
| Okinawans | 0.4 /100 | #287 | Tragic 28.1% |
| Choctaw | 0.4 /100 | #288 | Tragic 28.1% |