Immigrants from Vietnam vs Greek Wage/Income Gap
COMPARE
Immigrants from Vietnam
Greek
Wage/Income Gap
Wage/Income Gap Comparison
Immigrants from Vietnam
Greeks
25.2%
WAGE/INCOME GAP
77.7/ 100
METRIC RATING
155th/ 347
METRIC RANK
28.2%
WAGE/INCOME GAP
0.3/ 100
METRIC RATING
294th/ 347
METRIC RANK
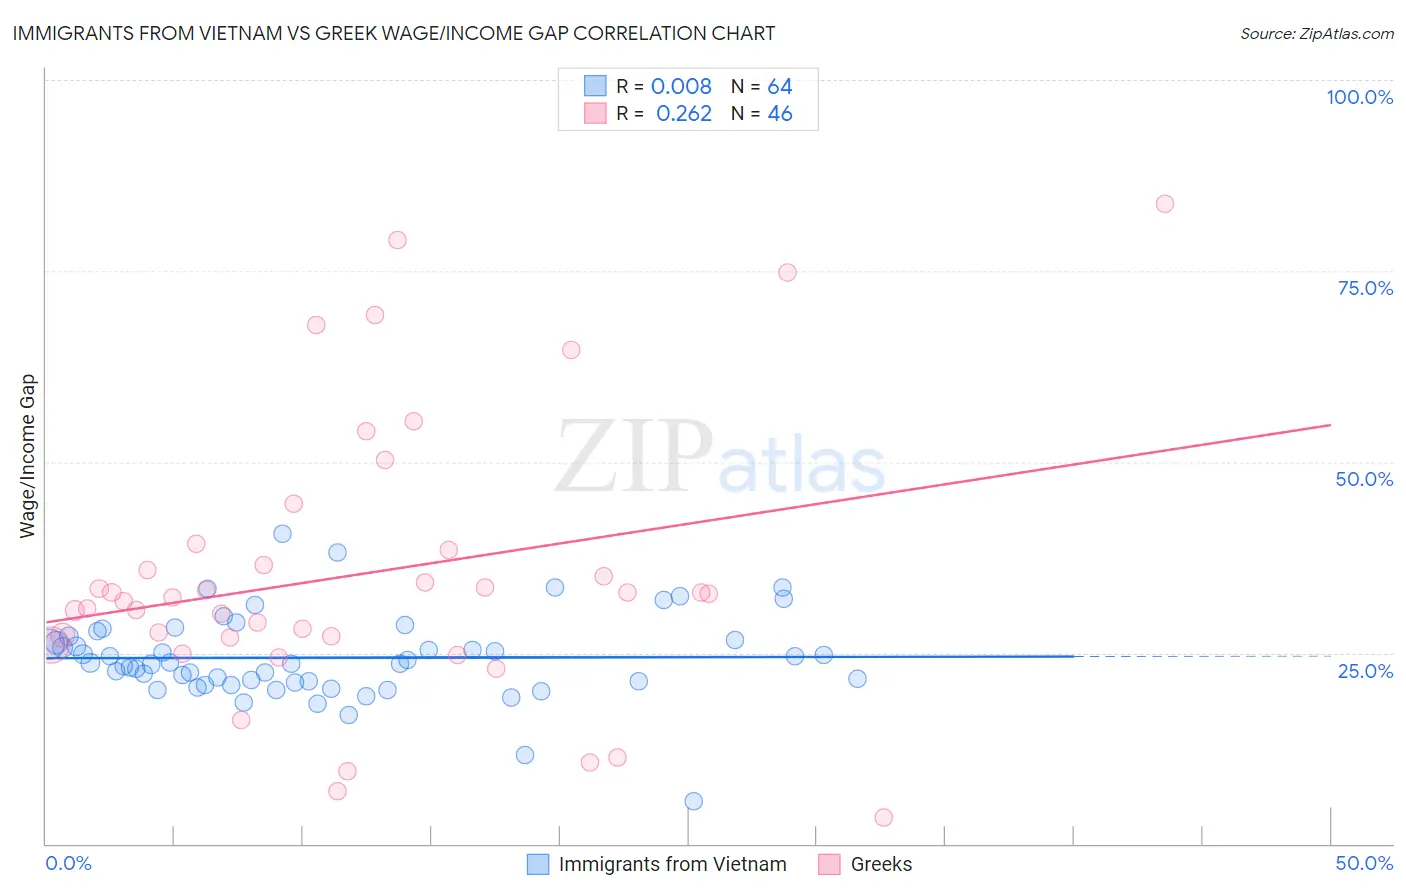
Immigrants from Vietnam vs Greek Wage/Income Gap Correlation Chart
The statistical analysis conducted on geographies consisting of 404,669,724 people shows no correlation between the proportion of Immigrants from Vietnam and wage/income gap percentage in the United States with a correlation coefficient (R) of 0.008 and weighted average of 25.2%. Similarly, the statistical analysis conducted on geographies consisting of 482,094,899 people shows a weak positive correlation between the proportion of Greeks and wage/income gap percentage in the United States with a correlation coefficient (R) of 0.262 and weighted average of 28.2%, a difference of 11.9%.
Wage/Income Gap Correlation Summary
| Measurement | Immigrants from Vietnam | Greek |
| Minimum | 5.6% | 3.5% |
| Maximum | 40.6% | 83.8% |
| Range | 35.1% | 80.3% |
| Mean | 24.4% | 35.4% |
| Median | 23.6% | 32.4% |
| Interquartile 25% (IQ1) | 21.1% | 27.0% |
| Interquartile 75% (IQ3) | 26.9% | 38.5% |
| Interquartile Range (IQR) | 5.8% | 11.5% |
| Standard Deviation (Sample) | 5.6% | 18.3% |
| Standard Deviation (Population) | 5.6% | 18.1% |
Similar Demographics by Wage/Income Gap
Demographics Similar to Immigrants from Vietnam by Wage/Income Gap
In terms of wage/income gap, the demographic groups most similar to Immigrants from Vietnam are Blackfeet (25.2%, a difference of 0.040%), Immigrants from Northern Africa (25.2%, a difference of 0.040%), Immigrants from Mexico (25.3%, a difference of 0.12%), Costa Rican (25.3%, a difference of 0.18%), and Immigrants from Zimbabwe (25.3%, a difference of 0.36%).
| Demographics | Rating | Rank | Wage/Income Gap |
| Iroquois | 83.9 /100 | #148 | Excellent 25.1% |
| Immigrants | Peru | 82.6 /100 | #149 | Excellent 25.1% |
| Immigrants | Immigrants | 82.3 /100 | #150 | Excellent 25.1% |
| Taiwanese | 81.6 /100 | #151 | Excellent 25.1% |
| Uruguayans | 81.3 /100 | #152 | Excellent 25.2% |
| Blackfeet | 78.1 /100 | #153 | Good 25.2% |
| Immigrants | Northern Africa | 78.1 /100 | #154 | Good 25.2% |
| Immigrants | Vietnam | 77.7 /100 | #155 | Good 25.2% |
| Immigrants | Mexico | 76.4 /100 | #156 | Good 25.3% |
| Costa Ricans | 75.8 /100 | #157 | Good 25.3% |
| Immigrants | Zimbabwe | 73.7 /100 | #158 | Good 25.3% |
| Puget Sound Salish | 73.0 /100 | #159 | Good 25.3% |
| French American Indians | 72.5 /100 | #160 | Good 25.4% |
| Albanians | 69.4 /100 | #161 | Good 25.4% |
| Shoshone | 69.0 /100 | #162 | Good 25.4% |
Demographics Similar to Greeks by Wage/Income Gap
In terms of wage/income gap, the demographic groups most similar to Greeks are Immigrants from Israel (28.2%, a difference of 0.020%), Immigrants from Australia (28.2%, a difference of 0.13%), Slovene (28.3%, a difference of 0.13%), Northern European (28.3%, a difference of 0.13%), and Czechoslovakian (28.2%, a difference of 0.19%).
| Demographics | Rating | Rank | Wage/Income Gap |
| Okinawans | 0.4 /100 | #287 | Tragic 28.1% |
| Choctaw | 0.4 /100 | #288 | Tragic 28.1% |
| Canadians | 0.3 /100 | #289 | Tragic 28.1% |
| Australians | 0.3 /100 | #290 | Tragic 28.2% |
| Czechoslovakians | 0.3 /100 | #291 | Tragic 28.2% |
| Immigrants | Australia | 0.3 /100 | #292 | Tragic 28.2% |
| Immigrants | Israel | 0.3 /100 | #293 | Tragic 28.2% |
| Greeks | 0.3 /100 | #294 | Tragic 28.2% |
| Slovenes | 0.3 /100 | #295 | Tragic 28.3% |
| Northern Europeans | 0.3 /100 | #296 | Tragic 28.3% |
| Immigrants | North America | 0.2 /100 | #297 | Tragic 28.4% |
| Austrians | 0.2 /100 | #298 | Tragic 28.4% |
| Immigrants | North Macedonia | 0.2 /100 | #299 | Tragic 28.4% |
| Immigrants | Northern Europe | 0.2 /100 | #300 | Tragic 28.5% |
| Immigrants | Canada | 0.2 /100 | #301 | Tragic 28.5% |