Immigrants from Vietnam vs Immigrants Wage/Income Gap
COMPARE
Immigrants from Vietnam
Immigrants
Wage/Income Gap
Wage/Income Gap Comparison
Immigrants from Vietnam
Immigrants
25.2%
WAGE/INCOME GAP
77.7/ 100
METRIC RATING
155th/ 347
METRIC RANK
25.1%
WAGE/INCOME GAP
82.3/ 100
METRIC RATING
150th/ 347
METRIC RANK
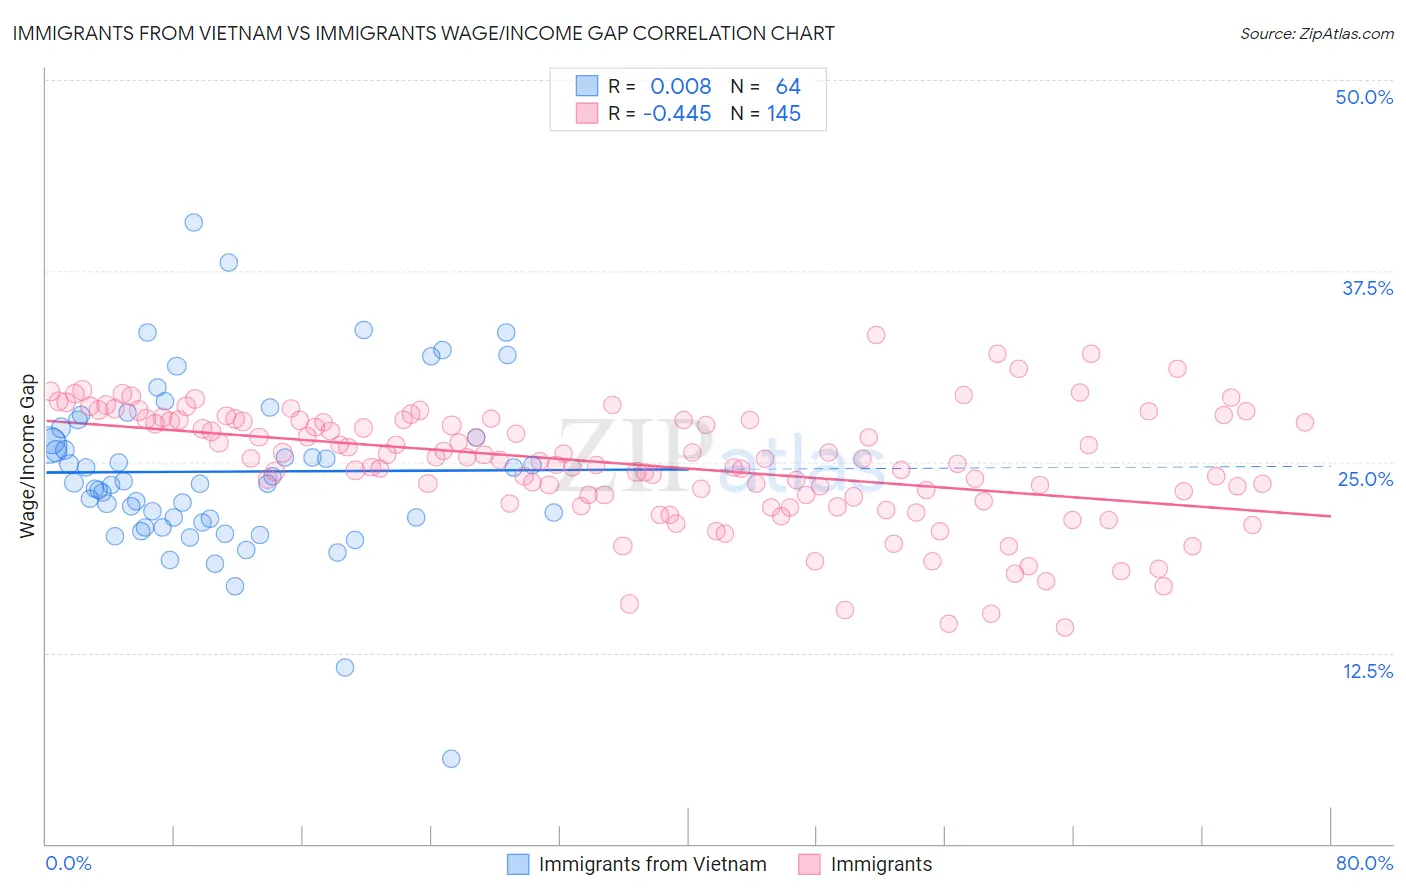
Immigrants from Vietnam vs Immigrants Wage/Income Gap Correlation Chart
The statistical analysis conducted on geographies consisting of 404,669,724 people shows no correlation between the proportion of Immigrants from Vietnam and wage/income gap percentage in the United States with a correlation coefficient (R) of 0.008 and weighted average of 25.2%. Similarly, the statistical analysis conducted on geographies consisting of 574,033,804 people shows a moderate negative correlation between the proportion of Immigrants and wage/income gap percentage in the United States with a correlation coefficient (R) of -0.445 and weighted average of 25.1%, a difference of 0.48%.
Wage/Income Gap Correlation Summary
| Measurement | Immigrants from Vietnam | Immigrants |
| Minimum | 5.6% | 14.2% |
| Maximum | 40.6% | 33.3% |
| Range | 35.1% | 19.1% |
| Mean | 24.4% | 24.8% |
| Median | 23.6% | 25.2% |
| Interquartile 25% (IQ1) | 21.1% | 22.8% |
| Interquartile 75% (IQ3) | 26.9% | 27.7% |
| Interquartile Range (IQR) | 5.8% | 5.0% |
| Standard Deviation (Sample) | 5.6% | 3.8% |
| Standard Deviation (Population) | 5.6% | 3.8% |
Demographics Similar to Immigrants from Vietnam and Immigrants by Wage/Income Gap
In terms of wage/income gap, the demographic groups most similar to Immigrants from Vietnam are Blackfeet (25.2%, a difference of 0.040%), Immigrants from Northern Africa (25.2%, a difference of 0.040%), Immigrants from Mexico (25.3%, a difference of 0.12%), Costa Rican (25.3%, a difference of 0.18%), and Immigrants from Zimbabwe (25.3%, a difference of 0.36%). Similarly, the demographic groups most similar to Immigrants are Immigrants from Peru (25.1%, a difference of 0.040%), Taiwanese (25.1%, a difference of 0.080%), Uruguayan (25.2%, a difference of 0.11%), Iroquois (25.1%, a difference of 0.19%), and Malaysian (25.0%, a difference of 0.33%).
| Demographics | Rating | Rank | Wage/Income Gap |
| Afghans | 88.1 /100 | #142 | Excellent 24.9% |
| Immigrants | Uganda | 88.0 /100 | #143 | Excellent 24.9% |
| Chippewa | 86.9 /100 | #144 | Excellent 25.0% |
| Comanche | 85.2 /100 | #145 | Excellent 25.0% |
| South Americans | 85.2 /100 | #146 | Excellent 25.0% |
| Malaysians | 84.9 /100 | #147 | Excellent 25.0% |
| Iroquois | 83.9 /100 | #148 | Excellent 25.1% |
| Immigrants | Peru | 82.6 /100 | #149 | Excellent 25.1% |
| Immigrants | Immigrants | 82.3 /100 | #150 | Excellent 25.1% |
| Taiwanese | 81.6 /100 | #151 | Excellent 25.1% |
| Uruguayans | 81.3 /100 | #152 | Excellent 25.2% |
| Blackfeet | 78.1 /100 | #153 | Good 25.2% |
| Immigrants | Northern Africa | 78.1 /100 | #154 | Good 25.2% |
| Immigrants | Vietnam | 77.7 /100 | #155 | Good 25.2% |
| Immigrants | Mexico | 76.4 /100 | #156 | Good 25.3% |
| Costa Ricans | 75.8 /100 | #157 | Good 25.3% |
| Immigrants | Zimbabwe | 73.7 /100 | #158 | Good 25.3% |
| Puget Sound Salish | 73.0 /100 | #159 | Good 25.3% |
| French American Indians | 72.5 /100 | #160 | Good 25.4% |
| Albanians | 69.4 /100 | #161 | Good 25.4% |
| Shoshone | 69.0 /100 | #162 | Good 25.4% |