Houma vs Mongolian Wage/Income Gap
COMPARE
Houma
Mongolian
Wage/Income Gap
Wage/Income Gap Comparison
Houma
Mongolians
38.7%
WAGE/INCOME GAP
0.0/ 100
METRIC RATING
347th/ 347
METRIC RANK
26.6%
WAGE/INCOME GAP
11.4/ 100
METRIC RATING
211th/ 347
METRIC RANK
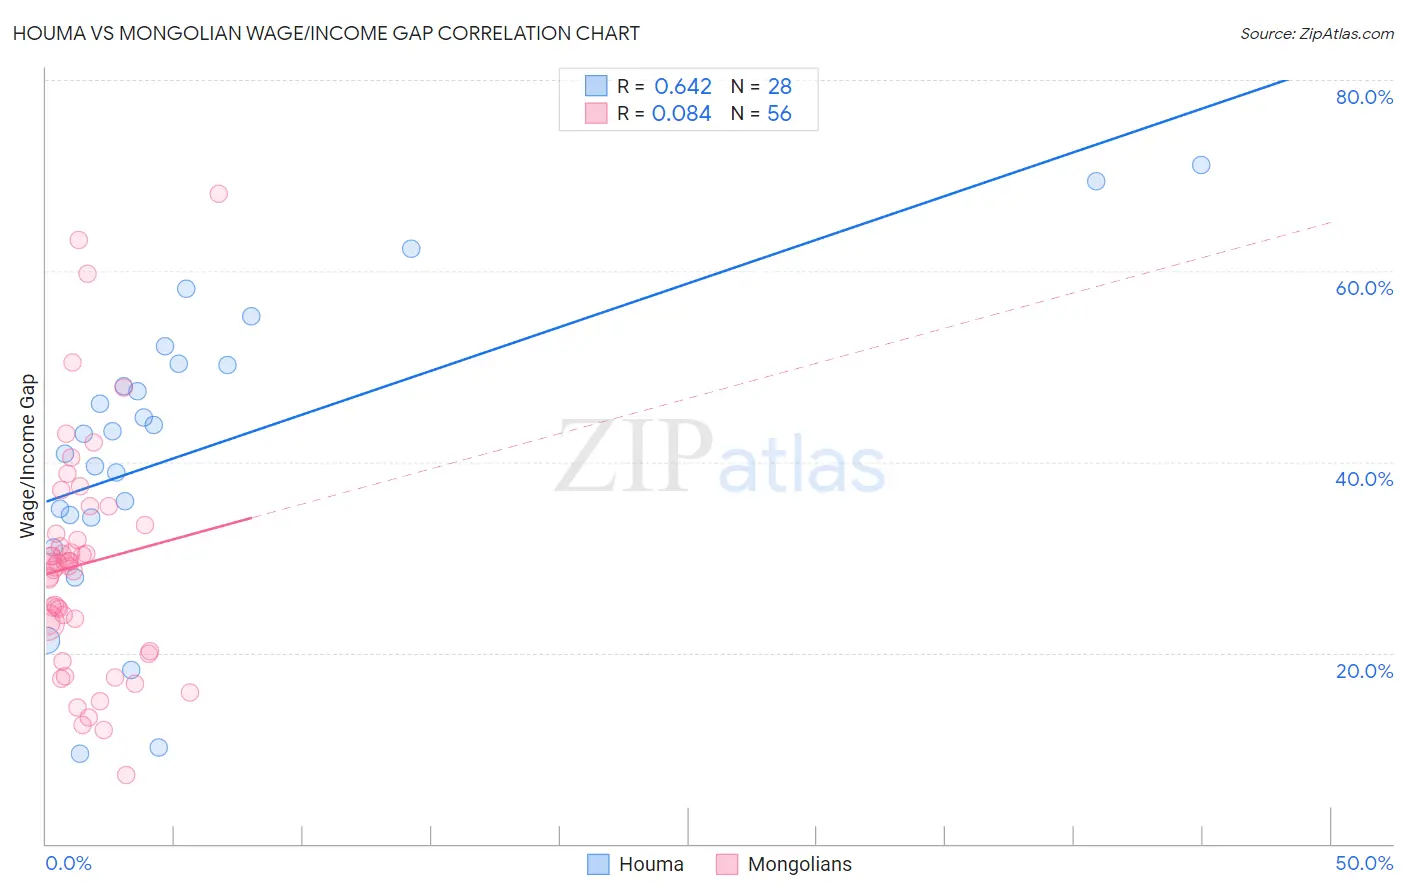
Houma vs Mongolian Wage/Income Gap Correlation Chart
The statistical analysis conducted on geographies consisting of 36,791,242 people shows a significant positive correlation between the proportion of Houma and wage/income gap percentage in the United States with a correlation coefficient (R) of 0.642 and weighted average of 38.7%. Similarly, the statistical analysis conducted on geographies consisting of 140,332,926 people shows a slight positive correlation between the proportion of Mongolians and wage/income gap percentage in the United States with a correlation coefficient (R) of 0.084 and weighted average of 26.6%, a difference of 45.2%.
Wage/Income Gap Correlation Summary
| Measurement | Houma | Mongolian |
| Minimum | 9.5% | 7.3% |
| Maximum | 71.0% | 68.0% |
| Range | 61.6% | 60.8% |
| Mean | 41.5% | 29.3% |
| Median | 43.1% | 29.2% |
| Interquartile 25% (IQ1) | 34.3% | 21.7% |
| Interquartile 75% (IQ3) | 50.2% | 32.9% |
| Interquartile Range (IQR) | 15.9% | 11.2% |
| Standard Deviation (Sample) | 15.4% | 12.2% |
| Standard Deviation (Population) | 15.1% | 12.1% |
Similar Demographics by Wage/Income Gap
Demographics Similar to Houma by Wage/Income Gap
In terms of wage/income gap, the demographic groups most similar to Houma are Cajun (33.9%, a difference of 14.1%), Immigrants from India (31.5%, a difference of 22.6%), Assyrian/Chaldean/Syriac (31.0%, a difference of 24.7%), Danish (31.0%, a difference of 24.9%), and Pennsylvania German (30.7%, a difference of 25.9%).
| Demographics | Rating | Rank | Wage/Income Gap |
| Europeans | 0.0 /100 | #333 | Tragic 29.4% |
| Swedes | 0.0 /100 | #334 | Tragic 29.4% |
| Immigrants | Taiwan | 0.0 /100 | #335 | Tragic 29.5% |
| English | 0.0 /100 | #336 | Tragic 29.5% |
| Dutch | 0.0 /100 | #337 | Tragic 29.6% |
| Filipinos | 0.0 /100 | #338 | Tragic 29.7% |
| Iranians | 0.0 /100 | #339 | Tragic 29.7% |
| Swiss | 0.0 /100 | #340 | Tragic 30.0% |
| Thais | 0.0 /100 | #341 | Tragic 30.5% |
| Pennsylvania Germans | 0.0 /100 | #342 | Tragic 30.7% |
| Danes | 0.0 /100 | #343 | Tragic 31.0% |
| Assyrians/Chaldeans/Syriacs | 0.0 /100 | #344 | Tragic 31.0% |
| Immigrants | India | 0.0 /100 | #345 | Tragic 31.5% |
| Cajuns | 0.0 /100 | #346 | Tragic 33.9% |
| Houma | 0.0 /100 | #347 | Tragic 38.7% |
Demographics Similar to Mongolians by Wage/Income Gap
In terms of wage/income gap, the demographic groups most similar to Mongolians are Iraqi (26.6%, a difference of 0.030%), Arab (26.6%, a difference of 0.13%), Immigrants from Kuwait (26.6%, a difference of 0.17%), Immigrants from Iraq (26.7%, a difference of 0.18%), and Egyptian (26.6%, a difference of 0.19%).
| Demographics | Rating | Rank | Wage/Income Gap |
| Immigrants | Russia | 19.0 /100 | #204 | Poor 26.4% |
| Immigrants | Southern Europe | 17.3 /100 | #205 | Poor 26.4% |
| Indians (Asian) | 16.5 /100 | #206 | Poor 26.4% |
| Immigrants | Italy | 15.8 /100 | #207 | Poor 26.5% |
| Egyptians | 12.7 /100 | #208 | Poor 26.6% |
| Immigrants | Kuwait | 12.6 /100 | #209 | Poor 26.6% |
| Arabs | 12.3 /100 | #210 | Poor 26.6% |
| Mongolians | 11.4 /100 | #211 | Poor 26.6% |
| Iraqis | 11.2 /100 | #212 | Poor 26.6% |
| Immigrants | Iraq | 10.3 /100 | #213 | Poor 26.7% |
| Immigrants | China | 10.3 /100 | #214 | Poor 26.7% |
| Yugoslavians | 9.7 /100 | #215 | Tragic 26.7% |
| Immigrants | Portugal | 9.5 /100 | #216 | Tragic 26.7% |
| Brazilians | 9.2 /100 | #217 | Tragic 26.7% |
| Immigrants | Saudi Arabia | 9.1 /100 | #218 | Tragic 26.7% |