Houma vs Ukrainian Wage/Income Gap
COMPARE
Houma
Ukrainian
Wage/Income Gap
Wage/Income Gap Comparison
Houma
Ukrainians
38.7%
WAGE/INCOME GAP
0.0/ 100
METRIC RATING
347th/ 347
METRIC RANK
27.3%
WAGE/INCOME GAP
2.4/ 100
METRIC RATING
252nd/ 347
METRIC RANK
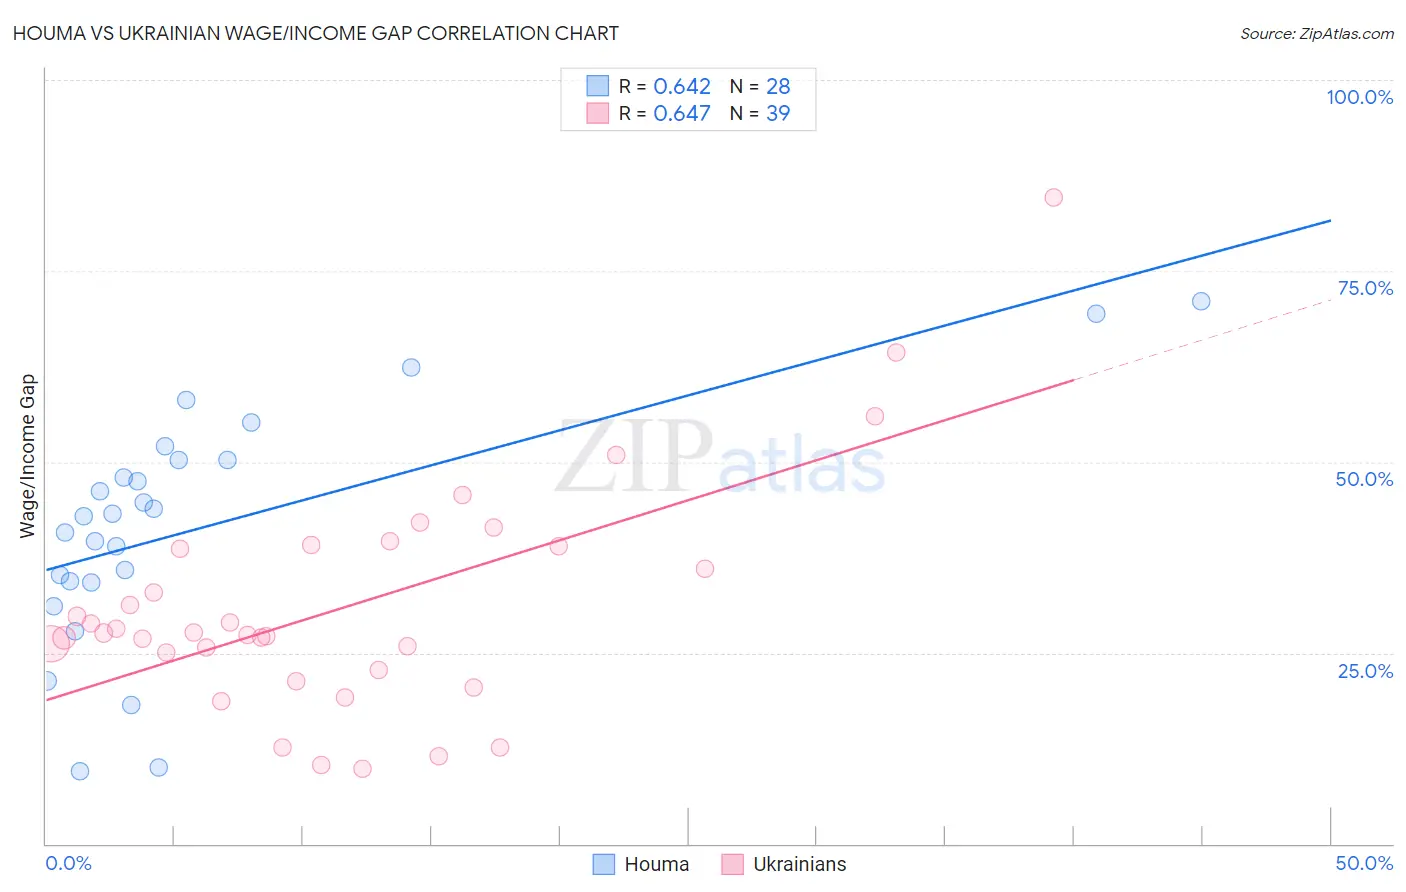
Houma vs Ukrainian Wage/Income Gap Correlation Chart
The statistical analysis conducted on geographies consisting of 36,791,242 people shows a significant positive correlation between the proportion of Houma and wage/income gap percentage in the United States with a correlation coefficient (R) of 0.642 and weighted average of 38.7%. Similarly, the statistical analysis conducted on geographies consisting of 448,085,539 people shows a significant positive correlation between the proportion of Ukrainians and wage/income gap percentage in the United States with a correlation coefficient (R) of 0.647 and weighted average of 27.3%, a difference of 41.5%.
Wage/Income Gap Correlation Summary
| Measurement | Houma | Ukrainian |
| Minimum | 9.5% | 9.8% |
| Maximum | 71.0% | 84.6% |
| Range | 61.6% | 74.9% |
| Mean | 41.5% | 31.0% |
| Median | 43.1% | 27.6% |
| Interquartile 25% (IQ1) | 34.3% | 22.7% |
| Interquartile 75% (IQ3) | 50.2% | 39.0% |
| Interquartile Range (IQR) | 15.9% | 16.3% |
| Standard Deviation (Sample) | 15.4% | 14.9% |
| Standard Deviation (Population) | 15.1% | 14.7% |
Similar Demographics by Wage/Income Gap
Demographics Similar to Houma by Wage/Income Gap
In terms of wage/income gap, the demographic groups most similar to Houma are Cajun (33.9%, a difference of 14.1%), Immigrants from India (31.5%, a difference of 22.6%), Assyrian/Chaldean/Syriac (31.0%, a difference of 24.7%), Danish (31.0%, a difference of 24.9%), and Pennsylvania German (30.7%, a difference of 25.9%).
| Demographics | Rating | Rank | Wage/Income Gap |
| Europeans | 0.0 /100 | #333 | Tragic 29.4% |
| Swedes | 0.0 /100 | #334 | Tragic 29.4% |
| Immigrants | Taiwan | 0.0 /100 | #335 | Tragic 29.5% |
| English | 0.0 /100 | #336 | Tragic 29.5% |
| Dutch | 0.0 /100 | #337 | Tragic 29.6% |
| Filipinos | 0.0 /100 | #338 | Tragic 29.7% |
| Iranians | 0.0 /100 | #339 | Tragic 29.7% |
| Swiss | 0.0 /100 | #340 | Tragic 30.0% |
| Thais | 0.0 /100 | #341 | Tragic 30.5% |
| Pennsylvania Germans | 0.0 /100 | #342 | Tragic 30.7% |
| Danes | 0.0 /100 | #343 | Tragic 31.0% |
| Assyrians/Chaldeans/Syriacs | 0.0 /100 | #344 | Tragic 31.0% |
| Immigrants | India | 0.0 /100 | #345 | Tragic 31.5% |
| Cajuns | 0.0 /100 | #346 | Tragic 33.9% |
| Houma | 0.0 /100 | #347 | Tragic 38.7% |
Demographics Similar to Ukrainians by Wage/Income Gap
In terms of wage/income gap, the demographic groups most similar to Ukrainians are Immigrants from Norway (27.3%, a difference of 0.060%), Immigrants from Czechoslovakia (27.3%, a difference of 0.16%), Portuguese (27.4%, a difference of 0.16%), Carpatho Rusyn (27.3%, a difference of 0.18%), and Cypriot (27.3%, a difference of 0.19%).
| Demographics | Rating | Rank | Wage/Income Gap |
| Immigrants | Azores | 3.5 /100 | #245 | Tragic 27.2% |
| Immigrants | Nonimmigrants | 3.3 /100 | #246 | Tragic 27.2% |
| Celtics | 2.8 /100 | #247 | Tragic 27.3% |
| Cypriots | 2.8 /100 | #248 | Tragic 27.3% |
| Carpatho Rusyns | 2.7 /100 | #249 | Tragic 27.3% |
| Immigrants | Czechoslovakia | 2.7 /100 | #250 | Tragic 27.3% |
| Immigrants | Norway | 2.5 /100 | #251 | Tragic 27.3% |
| Ukrainians | 2.4 /100 | #252 | Tragic 27.3% |
| Portuguese | 2.2 /100 | #253 | Tragic 27.4% |
| Israelis | 2.1 /100 | #254 | Tragic 27.4% |
| Immigrants | France | 2.1 /100 | #255 | Tragic 27.4% |
| Cherokee | 1.9 /100 | #256 | Tragic 27.4% |
| Luxembourgers | 1.9 /100 | #257 | Tragic 27.4% |
| Slavs | 1.8 /100 | #258 | Tragic 27.4% |
| Icelanders | 1.8 /100 | #259 | Tragic 27.5% |