Zip Codes with the Highest Percentage of Population with a Degree in Physical and Health Sciences in Delaware

RELATED REPORTS & OPTIONS

Physical and Health Sciences
Population
Families and Households
Female Fertility
Female Fertility (Unmarried)
Race (Community Size)
Race (Percentage)
Ancestry (Community Size)
AfghanAfricanAlaska NativeAlaskan AthabascanAlbanianAleutAlsatianAmericanApacheArabArapahoArgentineanArmenianAssyrian / Chaldean / SyriacAustralianAustrianBahamianBangladeshiBarbadianBasqueBelgianBelizeanBermudanBhutaneseBlackfeetBolivianBrazilianBritishBritish West IndianBulgarianBurmeseCajunCambodianCanadianCape VerdeanCarpatho RusynCelticCentral AmericanCentral American IndianCherokeeCheyenneChickasawChileanChineseChippewaChoctawColombianColvilleComancheCosta RicanCreeCreekCroatianCrowCubanCypriotCzechCzechoslovakianDanishDelawareDominicanDutchDutch West IndianEastern EuropeanEcuadorianEgyptianEnglishEstonianEthiopianEuropeanFijianFilipinoFinnishFrenchFrench American IndianFrench CanadianGermanGerman RussianGhanaianGreekGuamanian / ChamorroGuatemalanGuyaneseHaitianHmongHonduranHopiHoumaHungarianIcelanderIndian (Asian)IndonesianInupiatIranianIraqiIrishIroquoisIsraeliItalianJamaicanJapaneseJordanianKenyanKiowaKoreanLaotianLatvianLebaneseLiberianLithuanianLumbeeLuxembourgerMacedonianMalaysianMalteseMarshalleseMenomineeMexicanMexican American IndianMongolianMoroccanNative HawaiianNavajoNepaleseNew ZealanderNicaraguanNigerianNorthern EuropeanNorwegianOkinawanOsageOttawaPaiutePakistaniPalestinianPanamanianParaguayanPennsylvania GermanPeruvianPimaPolishPortuguesePotawatomiPuebloPuerto RicanPuget Sound SalishRomanianRussianSalvadoranSamoanScandinavianScotch-IrishScottishSeminoleSenegaleseSerbianShoshoneSierra LeoneanSiouxSlavicSlovakSloveneSomaliSouth AfricanSouth AmericanSouth American IndianSoviet UnionSpaniardSpanishSpanish AmericanSpanish American IndianSri LankanSubsaharan AfricanSudaneseSwedishSwissSyrianTaiwaneseThaiTlingit-HaidaTohono O'OdhamTonganTrinidadian and TobagonianTsimshianTurkishU.S. Virgin IslanderUgandanUkrainianUruguayanUteVenezuelanVietnameseWelshWest IndianYakamaYaquiYugoslavianYumanYup'ikZimbabwean
Ancestry (Percentage)
AfghanAfricanAlaska NativeAlaskan AthabascanAlbanianAleutAlsatianAmericanApacheArabArapahoArgentineanArmenianAssyrian / Chaldean / SyriacAustralianAustrianBahamianBangladeshiBarbadianBasqueBelgianBelizeanBermudanBhutaneseBlackfeetBolivianBrazilianBritishBritish West IndianBulgarianBurmeseCajunCambodianCanadianCape VerdeanCarpatho RusynCelticCentral AmericanCentral American IndianCherokeeCheyenneChickasawChileanChineseChippewaChoctawColombianColvilleComancheCosta RicanCreeCreekCroatianCrowCubanCypriotCzechCzechoslovakianDanishDelawareDominicanDutchDutch West IndianEastern EuropeanEcuadorianEgyptianEnglishEstonianEthiopianEuropeanFijianFilipinoFinnishFrenchFrench American IndianFrench CanadianGermanGerman RussianGhanaianGreekGuamanian / ChamorroGuatemalanGuyaneseHaitianHmongHonduranHopiHoumaHungarianIcelanderIndian (Asian)IndonesianInupiatIranianIraqiIrishIroquoisIsraeliItalianJamaicanJapaneseJordanianKenyanKiowaKoreanLaotianLatvianLebaneseLiberianLithuanianLumbeeLuxembourgerMacedonianMalaysianMalteseMarshalleseMenomineeMexicanMexican American IndianMongolianMoroccanNative HawaiianNavajoNepaleseNew ZealanderNicaraguanNigerianNorthern EuropeanNorwegianOkinawanOsageOttawaPaiutePakistaniPalestinianPanamanianParaguayanPennsylvania GermanPeruvianPimaPolishPortuguesePotawatomiPuebloPuerto RicanPuget Sound SalishRomanianRussianSalvadoranSamoanScandinavianScotch-IrishScottishSeminoleSenegaleseSerbianShoshoneSierra LeoneanSiouxSlavicSlovakSloveneSomaliSouth AfricanSouth AmericanSouth American IndianSoviet UnionSpaniardSpanishSpanish AmericanSpanish American IndianSri LankanSubsaharan AfricanSudaneseSwedishSwissSyrianTaiwaneseThaiTlingit-HaidaTohono O'OdhamTonganTrinidadian and TobagonianTsimshianTurkishU.S. Virgin IslanderUgandanUkrainianUruguayanUteVenezuelanVietnameseWelshWest IndianYakamaYaquiYugoslavianYumanYup'ikZimbabwean
Immigrant Origin (Total)
AfghanistanAfricaAlbaniaArgentinaArmeniaAsiaAustraliaAustriaAzoresBahamasBangladeshBarbadosBelarusBelgiumBelizeBoliviaBosnia and HerzegovinaBrazilBulgariaBurma / MyanmarCabo VerdeCambodiaCameroonCanadaCaribbeanCentral AmericaChileChinaColombiaCongoCosta RicaCroatiaCubaCzechoslovakiaDenmarkDominicaDominican RepublicEastern AfricaEastern AsiaEastern EuropeEcuadorEgyptEl SalvadorEnglandEritreaEthiopiaEuropeFijiFranceGermanyGhanaGreeceGrenadaGuatemalaGuyanaHaitiHondurasHong KongHungaryIndiaIndonesiaIranIraqIrelandIsraelItalyJamaicaJapanJordanKazakhstanKenyaKoreaKuwaitLaosLatin AmericaLatviaLebanonLiberiaLithuaniaMalaysiaMexicoMicronesiaMiddle AfricaMoldovaMoroccoNepalNetherlandsNicaraguaNigeriaNorth MacedoniaNorthern AfricaNorthern EuropeNorwayOceaniaPakistanPanamaPeruPhilippinesPolandPortugalRomaniaRussiaSaudi ArabiaScotlandSenegalSerbiaSierra LeoneSingaporeSomaliaSouth AfricaSouth AmericaSouth Central AsiaSouth Eastern AsiaSouthern EuropeSpainSri LankaSt. Vincent and the GrenadinesSudanSwedenSwitzerlandSyriaTaiwanThailandTrinidad and TobagoTurkeyUgandaUkraineUruguayUzbekistanVenezuelaVietnamWest IndiesWestern AfricaWestern AsiaWestern EuropeYemenZaireZimbabwe
Immigrant Origin (Percentage)
AfghanistanAfricaAlbaniaArgentinaArmeniaAsiaAustraliaAustriaAzoresBahamasBangladeshBarbadosBelarusBelgiumBelizeBoliviaBosnia and HerzegovinaBrazilBulgariaBurma / MyanmarCabo VerdeCambodiaCameroonCanadaCaribbeanCentral AmericaChileChinaColombiaCongoCosta RicaCroatiaCubaCzechoslovakiaDenmarkDominicaDominican RepublicEastern AfricaEastern AsiaEastern EuropeEcuadorEgyptEl SalvadorEnglandEritreaEthiopiaEuropeFijiFranceGermanyGhanaGreeceGrenadaGuatemalaGuyanaHaitiHondurasHong KongHungaryIndiaIndonesiaIranIraqIrelandIsraelItalyJamaicaJapanJordanKazakhstanKenyaKoreaKuwaitLaosLatin AmericaLatviaLebanonLiberiaLithuaniaMalaysiaMexicoMicronesiaMiddle AfricaMoldovaMoroccoNepalNetherlandsNicaraguaNigeriaNorth MacedoniaNorthern AfricaNorthern EuropeNorwayOceaniaPakistanPanamaPeruPhilippinesPolandPortugalRomaniaRussiaSaudi ArabiaScotlandSenegalSerbiaSierra LeoneSingaporeSomaliaSouth AfricaSouth AmericaSouth Central AsiaSouth Eastern AsiaSouthern EuropeSpainSri LankaSt. Vincent and the GrenadinesSudanSwedenSwitzerlandSyriaTaiwanThailandTrinidad and TobagoTurkeyUgandaUkraineUruguayUzbekistanVenezuelaVietnamWest IndiesWestern AfricaWestern AsiaWestern EuropeYemenZaireZimbabwe
Income
Income (Families)
Income (Households)
Poverty
Poverty (Families)
Unemployment
Employment Occupations
Employment Industries
Employer Class
Commute Time
Commute Means
School Enrollment
Education by Degree Field
Occupancy
Finances
Physical Characteristics
Delaware
Compare Zip Codes
Comparison Subject

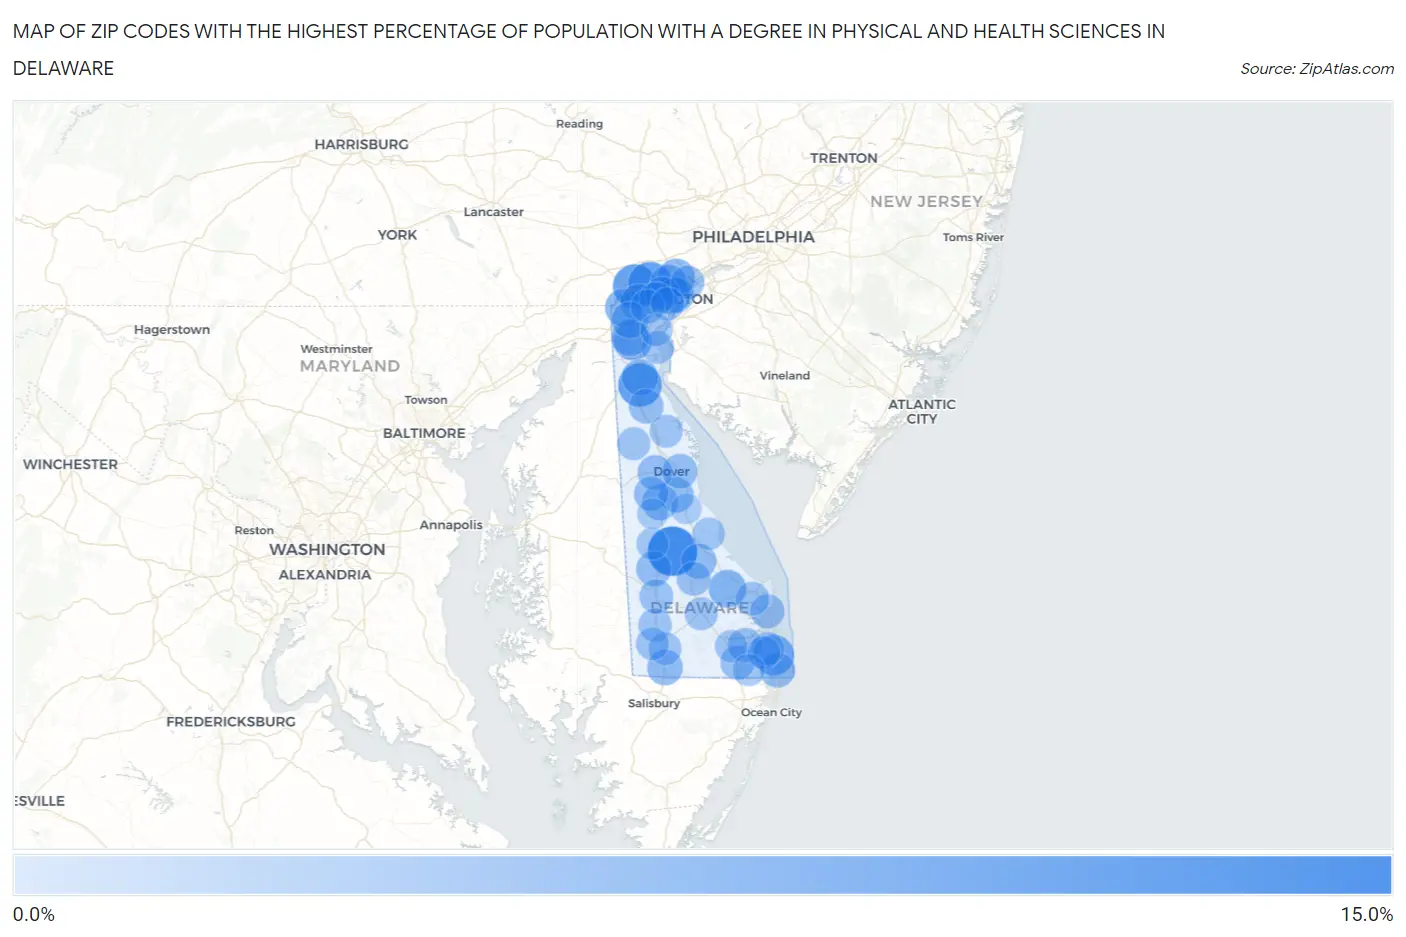
Map of Zip Codes with the Highest Percentage of Population with a Degree in Physical and Health Sciences in Delaware

0.0%
15.0%
Zip Codes with the Highest Percentage of Population with a Degree in Physical and Health Sciences in Delaware Map

Zip Codes with the Highest Percentage of Population with a Degree in Physical and Health Sciences in Delaware

Zip Code % Graduates vs State vs National
1.1995414.5%4.1%(+10.4)#13.1%(+11.4)#714
2.1970710.4%4.1%(+6.23)#23.1%(+7.26)#1,285
3.1980710.3%4.1%(+6.13)#33.1%(+7.16)#1,307
4.197309.9%4.1%(+5.81)#43.1%(+6.84)#1,386
5.199307.8%4.1%(+3.63)#53.1%(+4.65)#2,116
6.197016.0%4.1%(+1.87)#63.1%(+2.89)#3,279
7.198025.6%4.1%(+1.49)#73.1%(+2.51)#3,675
8.199685.5%4.1%(+1.34)#83.1%(+2.37)#3,874
9.198105.4%4.1%(+1.25)#93.1%(+2.28)#3,983
10.197115.3%4.1%(+1.14)#103.1%(+2.17)#4,124
11.198085.2%4.1%(+1.03)#113.1%(+2.06)#4,300
12.197025.1%4.1%(+0.992)#123.1%(+2.02)#4,371
13.197135.0%4.1%(+0.857)#133.1%(+1.88)#4,588
14.197094.6%4.1%(+0.501)#143.1%(+1.53)#5,269
15.198034.4%4.1%(+0.266)#153.1%(+1.29)#5,776
16.199794.1%4.1%(-0.070)#163.1%(+0.954)#6,590
17.199404.0%4.1%(-0.150)#173.1%(+0.874)#6,833
18.198093.8%4.1%(-0.311)#183.1%(+0.714)#7,315
19.199623.7%4.1%(-0.428)#193.1%(+0.596)#7,732
20.199503.7%4.1%(-0.458)#203.1%(+0.567)#7,830
21.199603.6%4.1%(-0.491)#213.1%(+0.533)#7,950
22.199443.6%4.1%(-0.574)#223.1%(+0.451)#8,248
23.199013.4%4.1%(-0.720)#233.1%(+0.304)#8,785
24.199043.4%4.1%(-0.754)#243.1%(+0.270)#8,921
25.197343.3%4.1%(-0.840)#253.1%(+0.184)#9,248
26.199343.2%4.1%(-0.948)#263.1%(+0.076)#9,666
27.199452.9%4.1%(-1.18)#273.1%(-0.160)#10,701
28.198062.9%4.1%(-1.20)#283.1%(-0.171)#10,747
29.199712.9%4.1%(-1.27)#293.1%(-0.243)#11,059
30.198052.8%4.1%(-1.31)#303.1%(-0.287)#11,261
31.199392.8%4.1%(-1.33)#313.1%(-0.303)#11,348
32.199412.8%4.1%(-1.37)#323.1%(-0.341)#11,513
33.199332.7%4.1%(-1.40)#333.1%(-0.378)#11,686
34.199582.6%4.1%(-1.50)#343.1%(-0.473)#12,107
35.198042.6%4.1%(-1.51)#353.1%(-0.489)#12,184
36.197032.6%4.1%(-1.52)#363.1%(-0.497)#12,232
37.199702.3%4.1%(-1.78)#373.1%(-0.751)#13,438
38.199732.3%4.1%(-1.86)#383.1%(-0.832)#13,832
39.198012.2%4.1%(-1.96)#393.1%(-0.934)#14,293
40.199382.1%4.1%(-2.02)#403.1%(-0.999)#14,635
41.199472.1%4.1%(-2.07)#413.1%(-1.04)#14,853
42.197062.0%4.1%(-2.17)#423.1%(-1.15)#15,321
43.199672.0%4.1%(-2.17)#433.1%(-1.15)#15,330
44.199561.9%4.1%(-2.18)#443.1%(-1.16)#15,357
45.199771.9%4.1%(-2.18)#453.1%(-1.16)#15,370
46.199311.9%4.1%(-2.20)#463.1%(-1.18)#15,447
47.199661.8%4.1%(-2.35)#473.1%(-1.33)#16,120
48.199631.7%4.1%(-2.45)#483.1%(-1.42)#16,521
49.197201.6%4.1%(-2.49)#493.1%(-1.46)#16,712
50.199751.5%4.1%(-2.61)#503.1%(-1.59)#17,239
51.199521.5%4.1%(-2.67)#513.1%(-1.64)#17,482
52.199430.39%4.1%(-3.74)#523.1%(-2.71)#20,819
53.199460.31%4.1%(-3.81)#533.1%(-2.79)#20,921

Common Questions

What are the Top 10 Zip Codes with the Highest Percentage of Population with a Degree in Physical and Health Sciences in Delaware?
Top 10 Zip Codes with the Highest Percentage of Population with a Degree in Physical and Health Sciences in Delaware are:
#1
14.5%
#2
10.4%
#3
10.3%
#4
9.9%
#5
7.8%
#6
6.0%
#7
5.6%
#8
5.5%
#9
5.4%
#10
5.3%
What zip code has the Highest Percentage of Population with a Degree in Physical and Health Sciences in Delaware?
19954 has the Highest Percentage of Population with a Degree in Physical and Health Sciences in Delaware with 14.5%.
What is the Percentage of Population with a Degree in Physical and Health Sciences in the State of Delaware?
Percentage of Population with a Degree in Physical and Health Sciences in Delaware is 4.1%.
What is the Percentage of Population with a Degree in Physical and Health Sciences in the United States?
Percentage of Population with a Degree in Physical and Health Sciences in the United States is 3.1%.