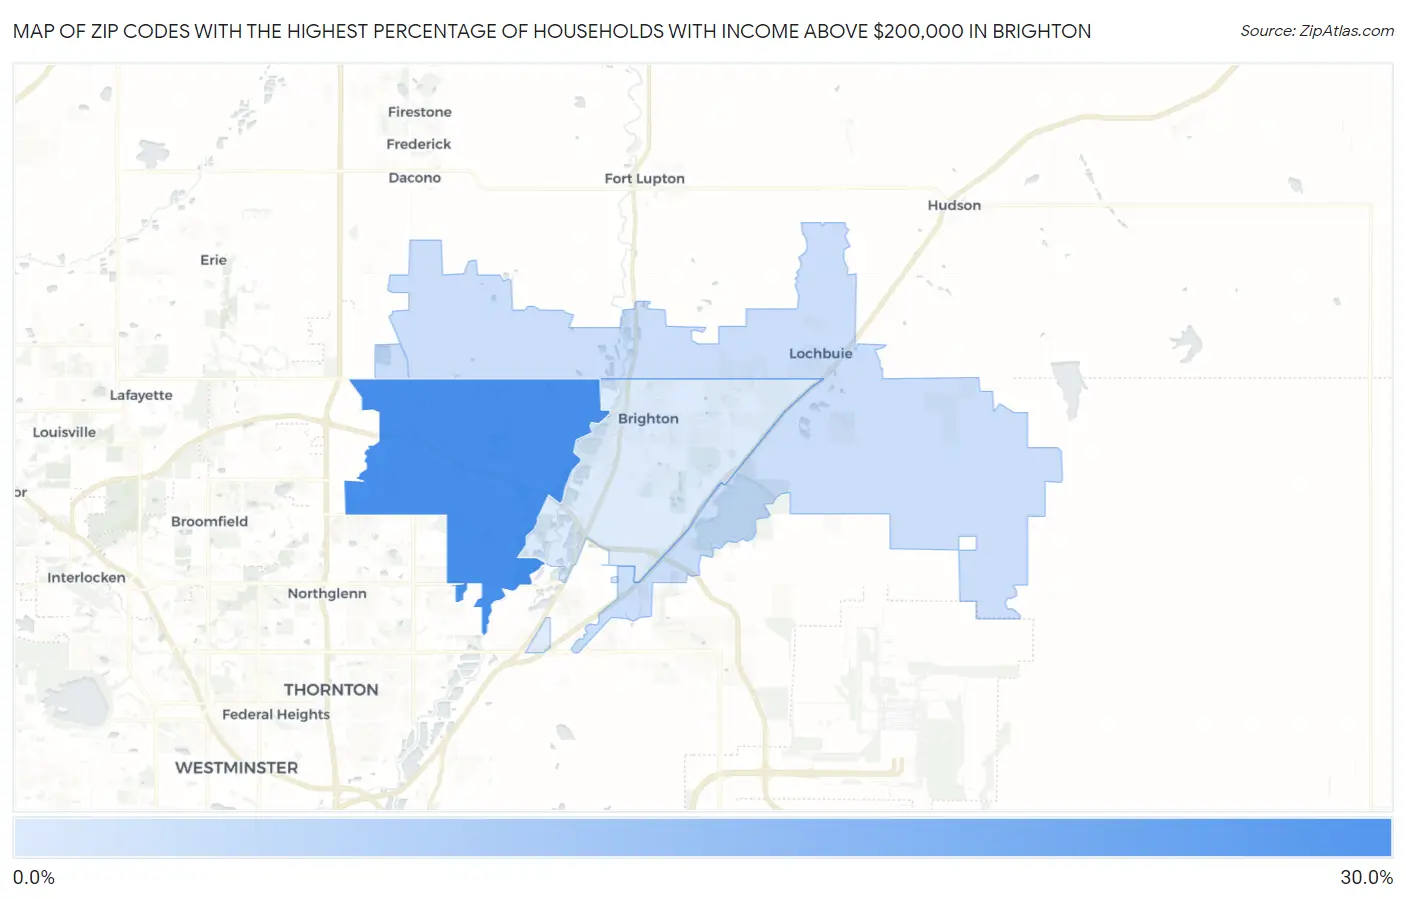
Zip Codes with the Highest Percentage of Households with Income Above $200,000 in Brighton, CO
RELATED REPORTS & OPTIONS
Household Income | $200k+
Brighton
Compare Zip Codes
Map of Zip Codes with the Highest Percentage of Households with Income Above $200,000 in Brighton
8.3%
28.1%
Zip Codes with the Highest Percentage of Households with Income Above $200,000 in Brighton, CO
| Zip Code | Households with Income > $200k | vs State | vs National | |
| 1. | 80602 | 28.1% | 13.9%(+14.2)#35 | 11.4%(+16.7)#1,698 |
| 2. | 80603 | 10.6% | 13.9%(-3.30)#172 | 11.4%(-0.800)#7,712 |
| 3. | 80601 | 8.3% | 13.9%(-5.60)#217 | 11.4%(-3.10)#9,985 |
1
Common Questions
What are the Top Zip Codes with the Highest Percentage of Households with Income Above $200,000 in Brighton, CO?
Top Zip Codes with the Highest Percentage of Households with Income Above $200,000 in Brighton, CO are:
What zip code has the Highest Percentage of Households with Income Above $200,000 in Brighton, CO?
80602 has the Highest Percentage of Households with Income Above $200,000 in Brighton, CO with 28.1%.
What is the Percentage of Households with Income Above $200,000 in Brighton, CO?
Percentage of Households with Income Above $200,000 in Brighton is 8.6%.
What is the Percentage of Households with Income Above $200,000 in Colorado?
Percentage of Households with Income Above $200,000 in Colorado is 13.9%.
What is the Percentage of Households with Income Above $200,000 in the United States?
Percentage of Households with Income Above $200,000 in the United States is 11.4%.