Sheldon, TX Map & Demographics
Sheldon Map
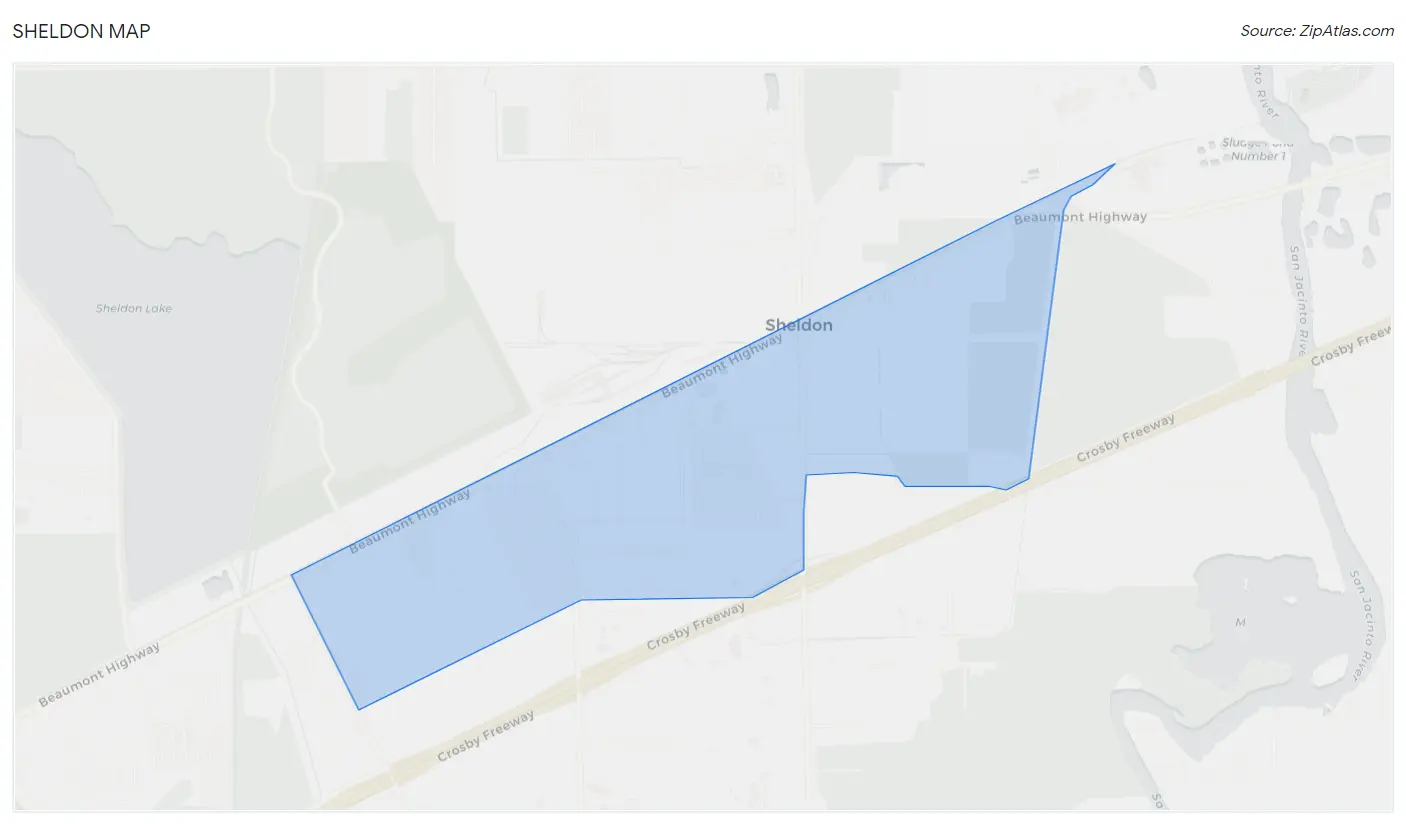
Sheldon Overview
$18,824
PER CAPITA INCOME
$54,464
AVG FAMILY INCOME
$70,285
AVG HOUSEHOLD INCOME
0.27
INEQUALITY / GINI INDEX
2,410
TOTAL POPULATION
1,094
MALE POPULATION
1,316
FEMALE POPULATION
83.13
MALES / 100 FEMALES
120.29
FEMALES / 100 MALES
26.4
MEDIAN AGE
4.1
AVG FAMILY SIZE
3.6
AVG HOUSEHOLD SIZE
1,162
LABOR FORCE [ PEOPLE ]
72.7%
PERCENT IN LABOR FORCE
3.9%
UNEMPLOYMENT RATE
Income in Sheldon
Income Overview in Sheldon
Per Capita Income in Sheldon is $18,824, while median incomes of families and households are $54,464 and $70,285 respectively.
| Characteristic | Number | Measure |
| Per Capita Income | 2,410 | $18,824 |
| Median Family Income | 494 | $54,464 |
| Mean Family Income | 494 | $59,620 |
| Median Household Income | 673 | $70,285 |
| Mean Household Income | 673 | $63,895 |
| Income Deficit | 494 | $0 |
| Wage / Income Gap (%) | 2,410 | 0.00% |
| Wage / Income Gap ($) | 2,410 | 100.00¢ per $1 |
| Gini / Inequality Index | 2,410 | 0.27 |
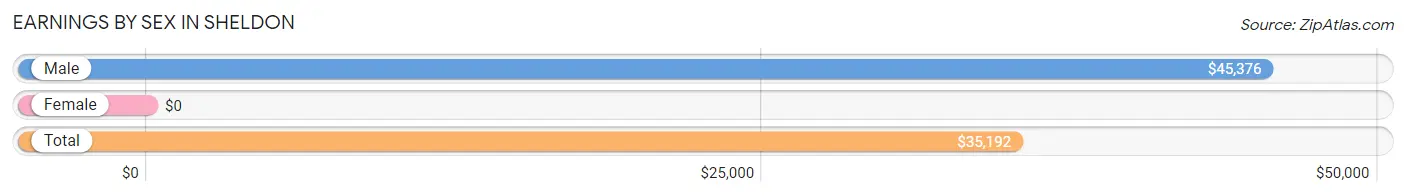
Earnings by Sex in Sheldon
| Sex | Number | Average Earnings |
| Male | 526 (46.8%) | $45,376 |
| Female | 598 (53.2%) | $0 |
| Total | 1,124 (100.0%) | $35,192 |
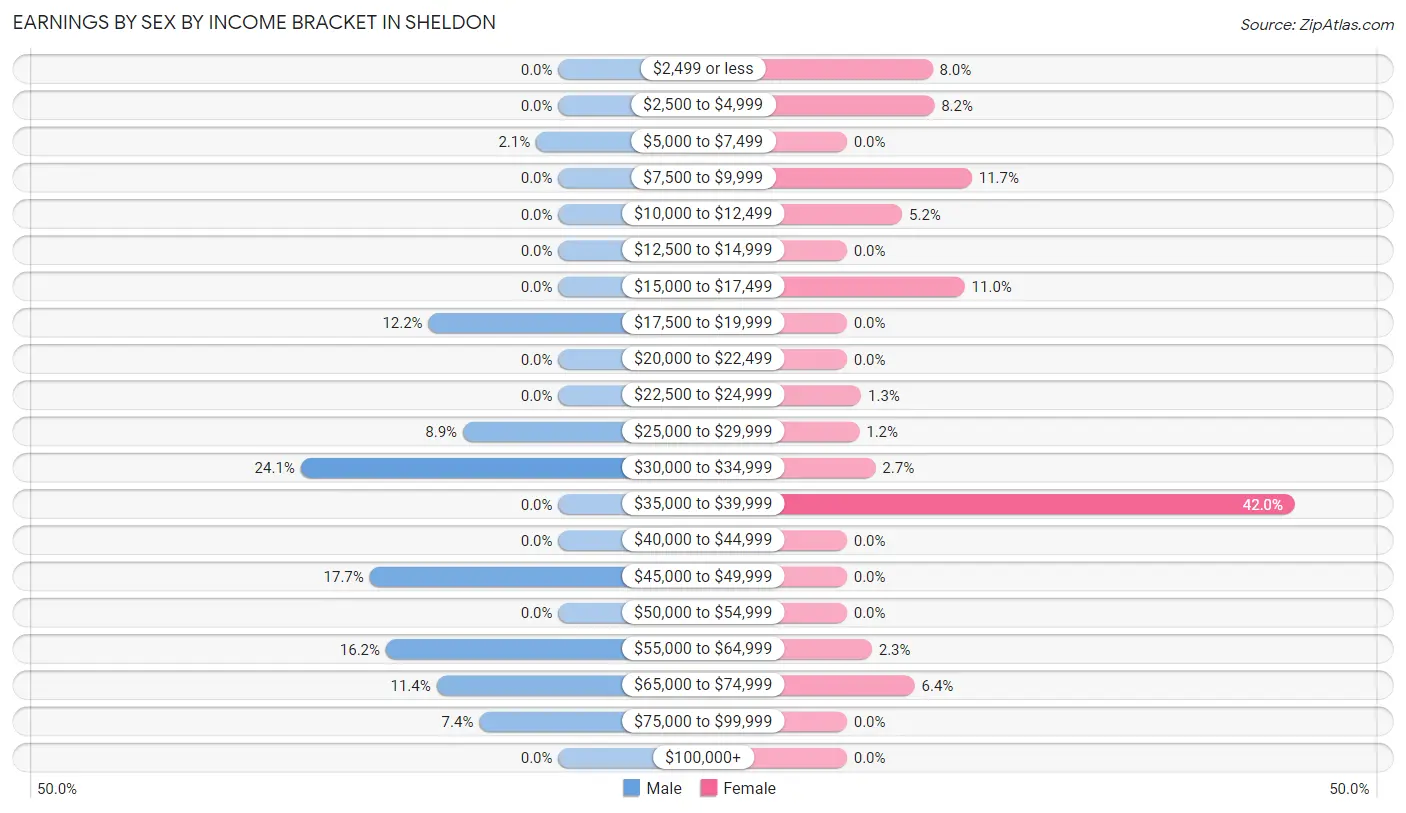
Earnings by Sex by Income Bracket in Sheldon
The most common earnings brackets in Sheldon are $30,000 to $34,999 for men (127 | 24.1%) and $35,000 to $39,999 for women (251 | 42.0%).
| Income | Male | Female |
| $2,499 or less | 0 (0.0%) | 48 (8.0%) |
| $2,500 to $4,999 | 0 (0.0%) | 49 (8.2%) |
| $5,000 to $7,499 | 11 (2.1%) | 0 (0.0%) |
| $7,500 to $9,999 | 0 (0.0%) | 70 (11.7%) |
| $10,000 to $12,499 | 0 (0.0%) | 31 (5.2%) |
| $12,500 to $14,999 | 0 (0.0%) | 0 (0.0%) |
| $15,000 to $17,499 | 0 (0.0%) | 66 (11.0%) |
| $17,500 to $19,999 | 64 (12.2%) | 0 (0.0%) |
| $20,000 to $22,499 | 0 (0.0%) | 0 (0.0%) |
| $22,500 to $24,999 | 0 (0.0%) | 8 (1.3%) |
| $25,000 to $29,999 | 47 (8.9%) | 7 (1.2%) |
| $30,000 to $34,999 | 127 (24.1%) | 16 (2.7%) |
| $35,000 to $39,999 | 0 (0.0%) | 251 (42.0%) |
| $40,000 to $44,999 | 0 (0.0%) | 0 (0.0%) |
| $45,000 to $49,999 | 93 (17.7%) | 0 (0.0%) |
| $50,000 to $54,999 | 0 (0.0%) | 0 (0.0%) |
| $55,000 to $64,999 | 85 (16.2%) | 14 (2.3%) |
| $65,000 to $74,999 | 60 (11.4%) | 38 (6.4%) |
| $75,000 to $99,999 | 39 (7.4%) | 0 (0.0%) |
| $100,000+ | 0 (0.0%) | 0 (0.0%) |
| Total | 526 (100.0%) | 598 (100.0%) |
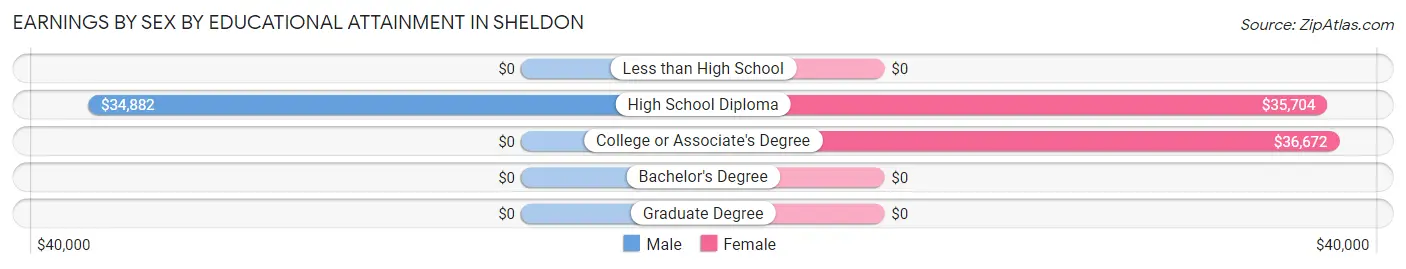
Earnings by Sex by Educational Attainment in Sheldon
Average earnings in Sheldon are $45,376 for men and $35,844 for women, a difference of 21.0%. Men with an educational attainment of high school diploma enjoy the highest average annual earnings of $34,882, while those with high school diploma education earn the least with $34,882. Women with an educational attainment of college or associate's degree earn the most with the average annual earnings of $36,672, while those with high school diploma education have the smallest earnings of $35,704.
| Educational Attainment | Male Income | Female Income |
| Less than High School | - | - |
| High School Diploma | $34,882 | $35,704 |
| College or Associate's Degree | - | - |
| Bachelor's Degree | - | - |
| Graduate Degree | - | - |
| Total | $45,376 | $35,844 |
Family Income in Sheldon
Family Income Brackets in Sheldon
According to the Sheldon family income data, there are 185 families falling into the $35,000 to $49,999 income range, which is the most common income bracket and makes up 37.4% of all families.
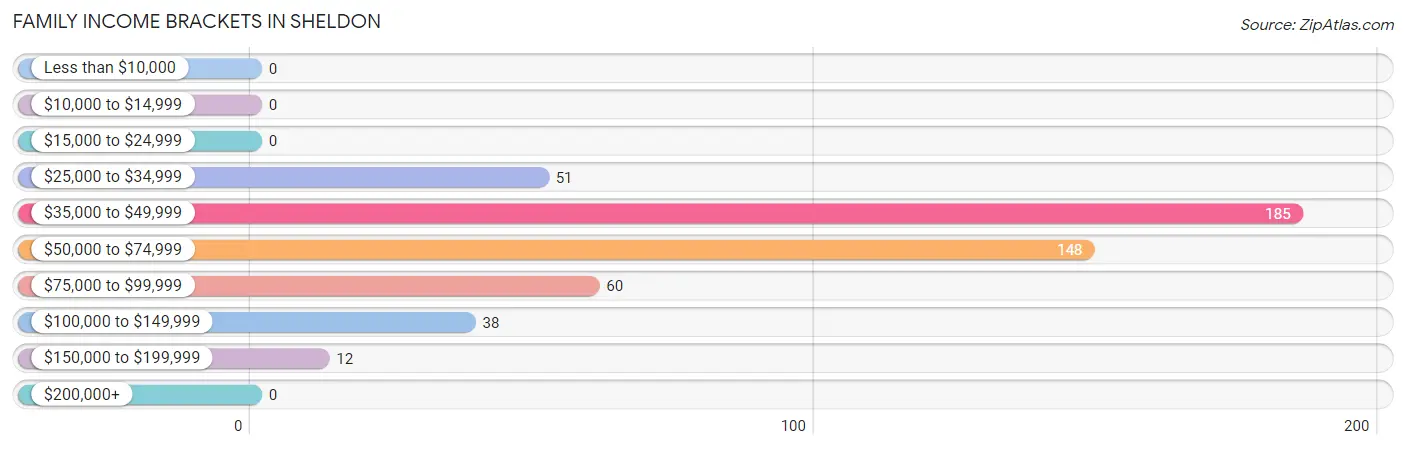
| Income Bracket | # Families | % Families |
| Less than $10,000 | 0 | 0.0% |
| $10,000 to $14,999 | 0 | 0.0% |
| $15,000 to $24,999 | 0 | 0.0% |
| $25,000 to $34,999 | 51 | 10.3% |
| $35,000 to $49,999 | 185 | 37.4% |
| $50,000 to $74,999 | 148 | 30.0% |
| $75,000 to $99,999 | 60 | 12.1% |
| $100,000 to $149,999 | 38 | 7.7% |
| $150,000 to $199,999 | 12 | 2.4% |
| $200,000+ | 0 | 0.0% |
Family Income by Famaliy Size in Sheldon
4-person families (137 | 27.7%) account for the highest median family income in Sheldon with $76,314 per family, while 4-person families (137 | 27.7%) have the highest median income of $19,078 per family member.
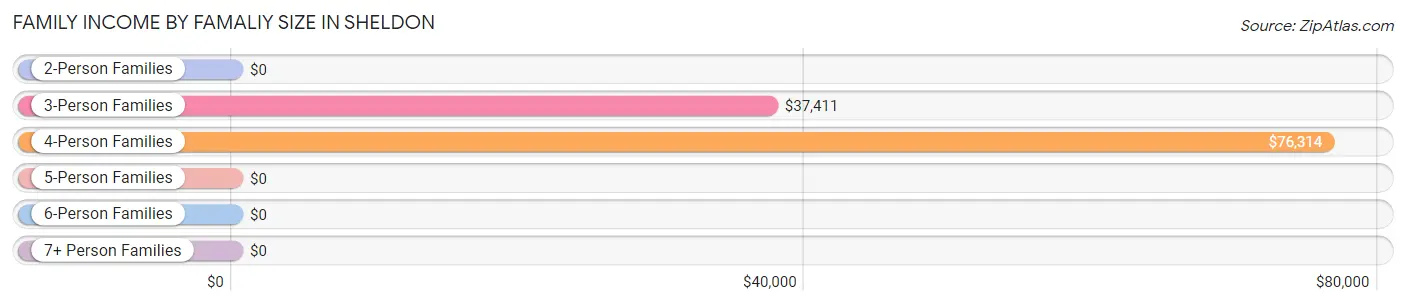
| Income Bracket | # Families | Median Income |
| 2-Person Families | 51 (10.3%) | $0 |
| 3-Person Families | 245 (49.6%) | $37,411 |
| 4-Person Families | 137 (27.7%) | $76,314 |
| 5-Person Families | 0 (0.0%) | $0 |
| 6-Person Families | 0 (0.0%) | $0 |
| 7+ Person Families | 61 (12.3%) | $0 |
| Total | 494 (100.0%) | $54,464 |
Family Income by Number of Earners in Sheldon
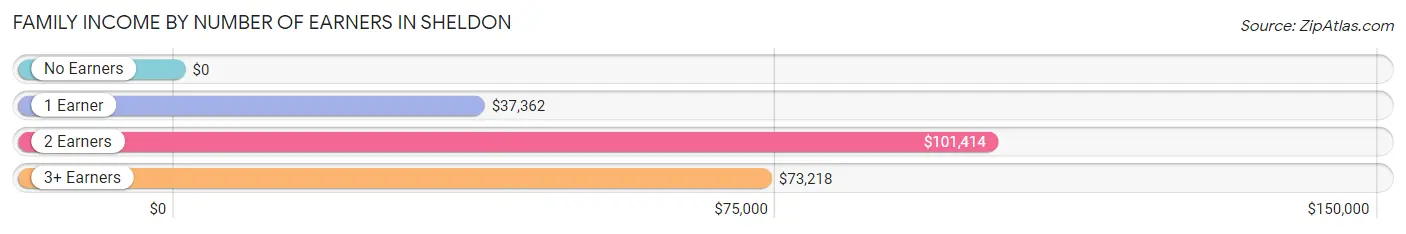
| Number of Earners | # Families | Median Income |
| No Earners | 0 (0.0%) | $0 |
| 1 Earner | 342 (69.2%) | $37,362 |
| 2 Earners | 57 (11.5%) | $101,414 |
| 3+ Earners | 95 (19.2%) | $73,218 |
| Total | 494 (100.0%) | $54,464 |
Household Income in Sheldon
Household Income Brackets in Sheldon
With 240 households falling in the category, the $50,000 to $74,999 income range is the most frequent in Sheldon, accounting for 35.7% of all households.
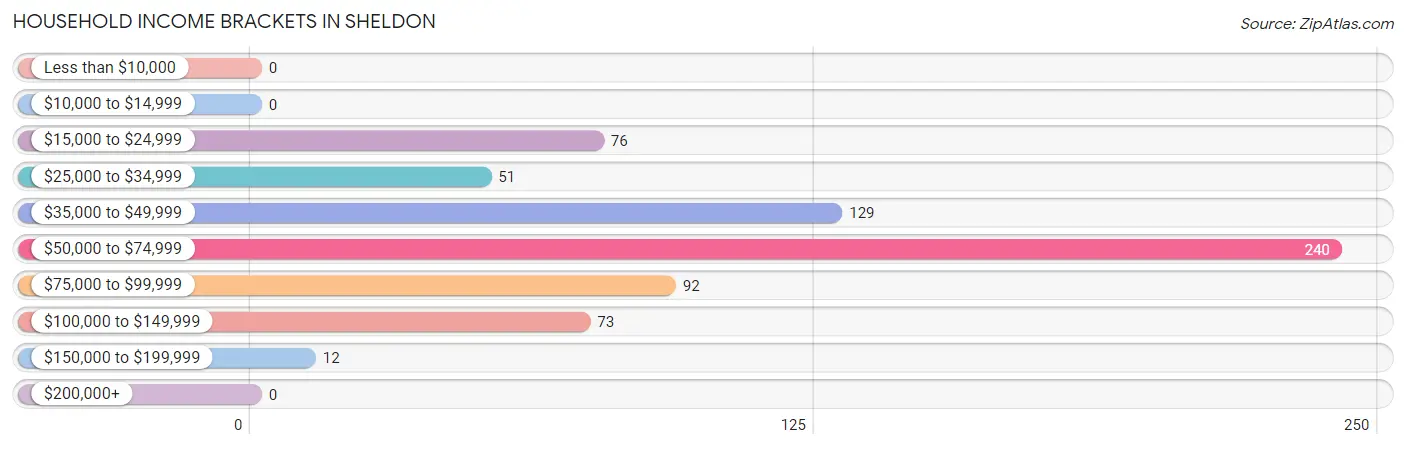
| Income Bracket | # Households | % Households |
| Less than $10,000 | 0 | 0.0% |
| $10,000 to $14,999 | 0 | 0.0% |
| $15,000 to $24,999 | 76 | 11.3% |
| $25,000 to $34,999 | 51 | 7.6% |
| $35,000 to $49,999 | 129 | 19.2% |
| $50,000 to $74,999 | 240 | 35.7% |
| $75,000 to $99,999 | 92 | 13.7% |
| $100,000 to $149,999 | 73 | 10.8% |
| $150,000 to $199,999 | 12 | 1.8% |
| $200,000+ | 0 | 0.0% |
Household Income by Householder Age in Sheldon
The median household income in Sheldon is $70,285, with the highest median household income of $70,709 found in the 25 to 44 years age bracket for the primary householder. A total of 316 households (46.9%) fall into this category. Meanwhile, the 15 to 24 years age bracket for the primary householder has the lowest median household income of $0, with 39 households (5.8%) in this group.
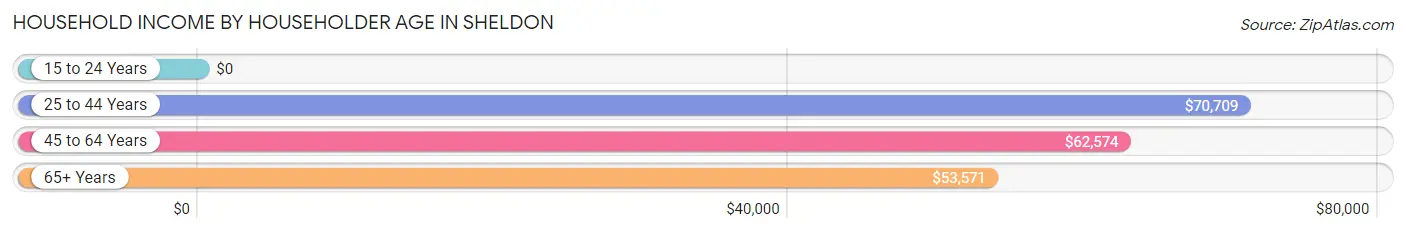
| Income Bracket | # Households | Median Income |
| 15 to 24 Years | 39 (5.8%) | $0 |
| 25 to 44 Years | 316 (46.9%) | $70,709 |
| 45 to 64 Years | 264 (39.2%) | $62,574 |
| 65+ Years | 54 (8.0%) | $53,571 |
| Total | 673 (100.0%) | $70,285 |
Poverty in Sheldon
Income Below Poverty by Sex and Age in Sheldon
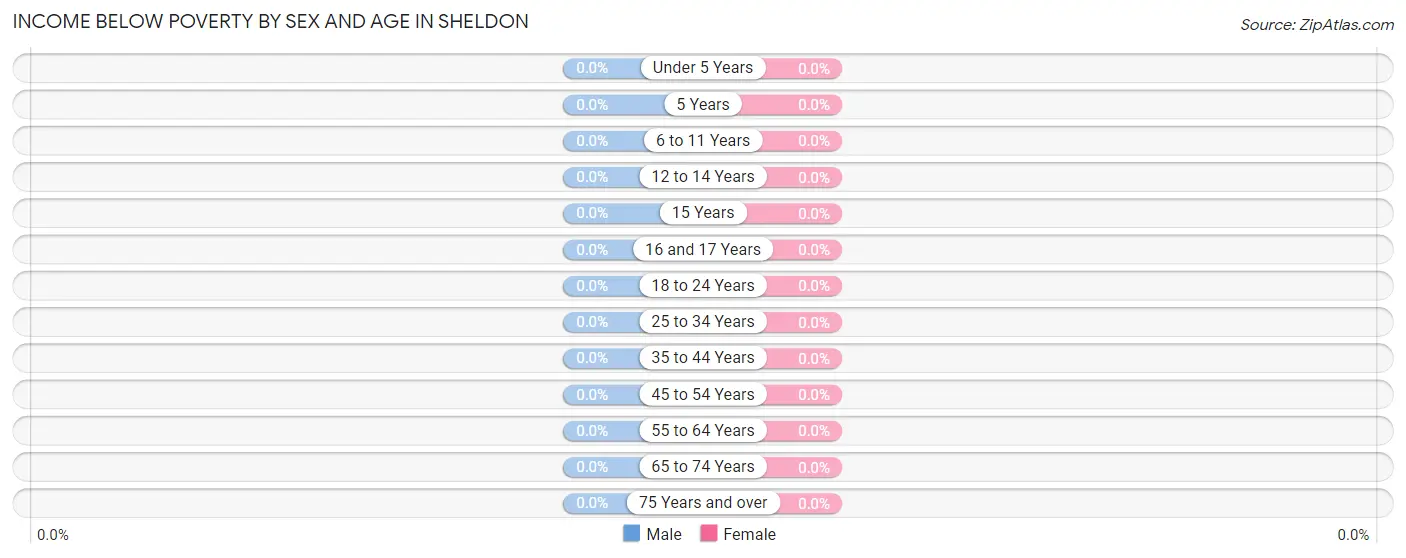
| Age Bracket | Male | Female |
| Under 5 Years | 0 (0.0%) | 0 (0.0%) |
| 5 Years | 0 (0.0%) | 0 (0.0%) |
| 6 to 11 Years | 0 (0.0%) | 0 (0.0%) |
| 12 to 14 Years | 0 (0.0%) | 0 (0.0%) |
| 15 Years | 0 (0.0%) | 0 (0.0%) |
| 16 and 17 Years | 0 (0.0%) | 0 (0.0%) |
| 18 to 24 Years | 0 (0.0%) | 0 (0.0%) |
| 25 to 34 Years | 0 (0.0%) | 0 (0.0%) |
| 35 to 44 Years | 0 (0.0%) | 0 (0.0%) |
| 45 to 54 Years | 0 (0.0%) | 0 (0.0%) |
| 55 to 64 Years | 0 (0.0%) | 0 (0.0%) |
| 65 to 74 Years | 0 (0.0%) | 0 (0.0%) |
| 75 Years and over | 0 (0.0%) | 0 (0.0%) |
| Total | 0 (0.0%) | 0 (0.0%) |
Income Above Poverty by Sex and Age in Sheldon
According to the poverty statistics in Sheldon, males aged under 5 years and females aged under 5 years are the age groups that are most secure financially, with 100.0% of males and 100.0% of females in these age groups living above the poverty line.
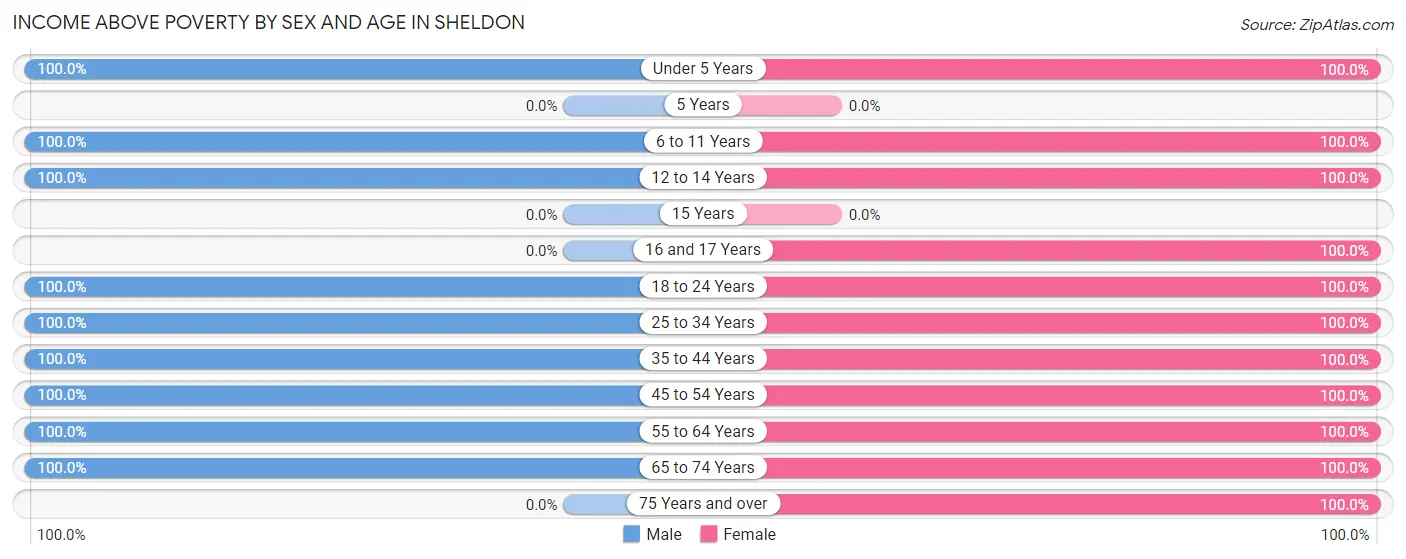
| Age Bracket | Male | Female |
| Under 5 Years | 135 (100.0%) | 71 (100.0%) |
| 5 Years | 0 (0.0%) | 0 (0.0%) |
| 6 to 11 Years | 226 (100.0%) | 255 (100.0%) |
| 12 to 14 Years | 63 (100.0%) | 61 (100.0%) |
| 15 Years | 0 (0.0%) | 0 (0.0%) |
| 16 and 17 Years | 0 (0.0%) | 84 (100.0%) |
| 18 to 24 Years | 16 (100.0%) | 158 (100.0%) |
| 25 to 34 Years | 209 (100.0%) | 295 (100.0%) |
| 35 to 44 Years | 191 (100.0%) | 33 (100.0%) |
| 45 to 54 Years | 200 (100.0%) | 183 (100.0%) |
| 55 to 64 Years | 13 (100.0%) | 132 (100.0%) |
| 65 to 74 Years | 41 (100.0%) | 36 (100.0%) |
| 75 Years and over | 0 (0.0%) | 8 (100.0%) |
| Total | 1,094 (100.0%) | 1,316 (100.0%) |
Income Below Poverty Among Married-Couple Families in Sheldon
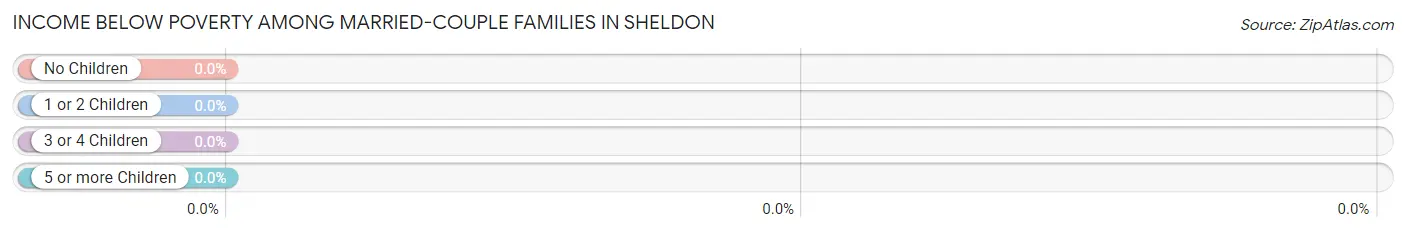
| Children | Above Poverty | Below Poverty |
| No Children | 80 (100.0%) | 0 (0.0%) |
| 1 or 2 Children | 177 (100.0%) | 0 (0.0%) |
| 3 or 4 Children | 0 (0.0%) | 0 (0.0%) |
| 5 or more Children | 47 (100.0%) | 0 (0.0%) |
| Total | 304 (100.0%) | 0 (0.0%) |
Income Below Poverty Among Single-Parent Households in Sheldon
| Children | Single Father | Single Mother |
| No Children | 0 (0.0%) | 0 (0.0%) |
| 1 or 2 Children | 0 (0.0%) | 0 (0.0%) |
| 3 or 4 Children | 0 (0.0%) | 0 (0.0%) |
| 5 or more Children | 0 (0.0%) | 0 (0.0%) |
| Total | 0 (0.0%) | 0 (0.0%) |
Income Below Poverty Among Married-Couple vs Single-Parent Households in Sheldon
| Children | Married-Couple Families | Single-Parent Households |
| No Children | 0 (0.0%) | 0 (0.0%) |
| 1 or 2 Children | 0 (0.0%) | 0 (0.0%) |
| 3 or 4 Children | 0 (0.0%) | 0 (0.0%) |
| 5 or more Children | 0 (0.0%) | 0 (0.0%) |
| Total | 0 (0.0%) | 0 (0.0%) |
Race in Sheldon
The most populous races in Sheldon are Hispanic or Latino (1,934 | 80.2%), White / Caucasian (1,303 | 54.1%), and Two or more Races (523 | 21.7%).
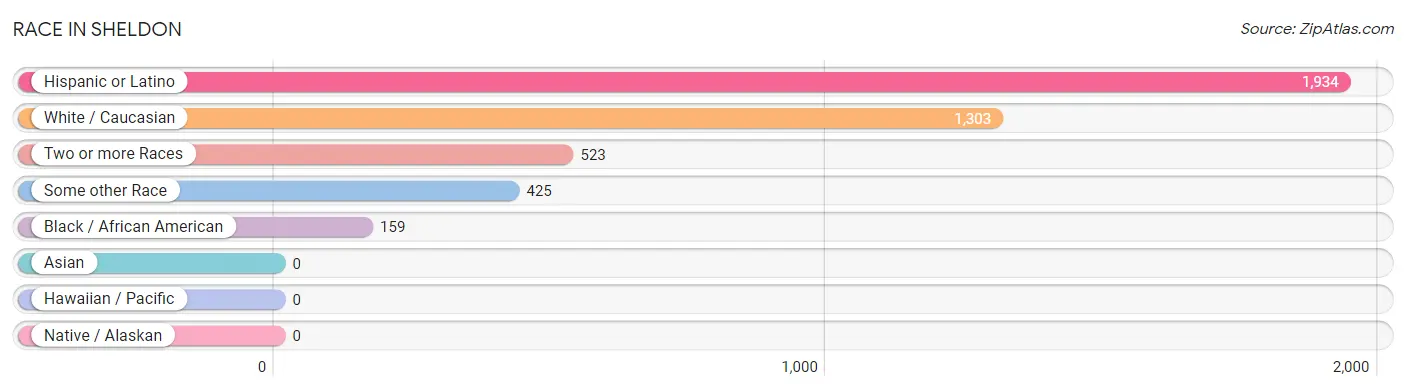
| Race | # Population | % Population |
| Asian | 0 | 0.0% |
| Black / African American | 159 | 6.6% |
| Hawaiian / Pacific | 0 | 0.0% |
| Hispanic or Latino | 1,934 | 80.2% |
| Native / Alaskan | 0 | 0.0% |
| White / Caucasian | 1,303 | 54.1% |
| Two or more Races | 523 | 21.7% |
| Some other Race | 425 | 17.6% |
| Total | 2,410 | 100.0% |
Ancestry in Sheldon
The most populous ancestries reported in Sheldon are Mexican (1,679 | 69.7%), Central American (184 | 7.6%), Honduran (184 | 7.6%), Dutch (42 | 1.7%), and Irish (42 | 1.7%), together accounting for 88.4% of all Sheldon residents.
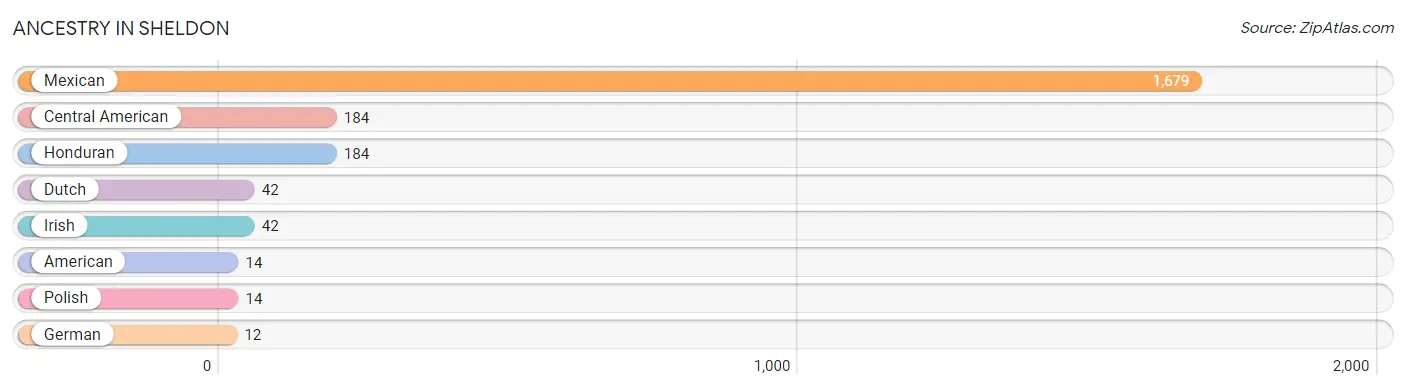
| Ancestry | # Population | % Population |
| American | 14 | 0.6% |
| Central American | 184 | 7.6% |
| Dutch | 42 | 1.7% |
| German | 12 | 0.5% |
| Honduran | 184 | 7.6% |
| Irish | 42 | 1.7% |
| Mexican | 1,679 | 69.7% |
| Polish | 14 | 0.6% | View All 8 Rows |
Immigrants in Sheldon
The most numerous immigrant groups reported in Sheldon came from Central America (605 | 25.1%), Latin America (605 | 25.1%), Mexico (421 | 17.5%), and Honduras (184 | 7.6%), together accounting for 75.3% of all Sheldon residents.
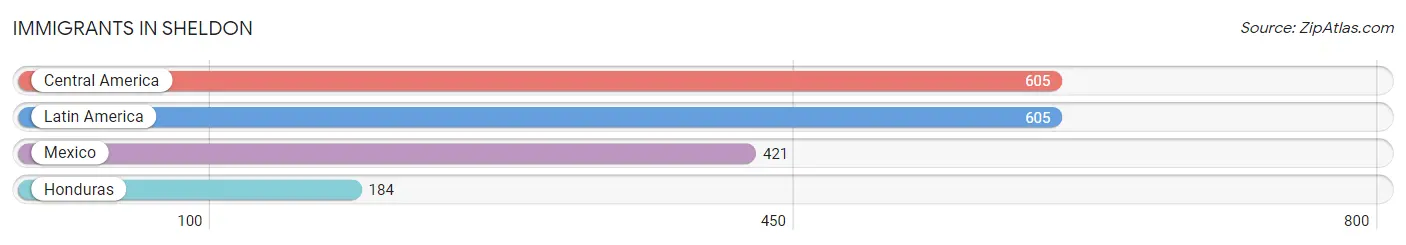
| Immigration Origin | # Population | % Population |
| Central America | 605 | 25.1% |
| Honduras | 184 | 7.6% |
| Latin America | 605 | 25.1% |
| Mexico | 421 | 17.5% | View All 4 Rows |
Sex and Age in Sheldon
Sex and Age in Sheldon
The most populous age groups in Sheldon are 10 to 14 Years (271 | 24.8%) for men and 5 to 9 Years (255 | 19.4%) for women.
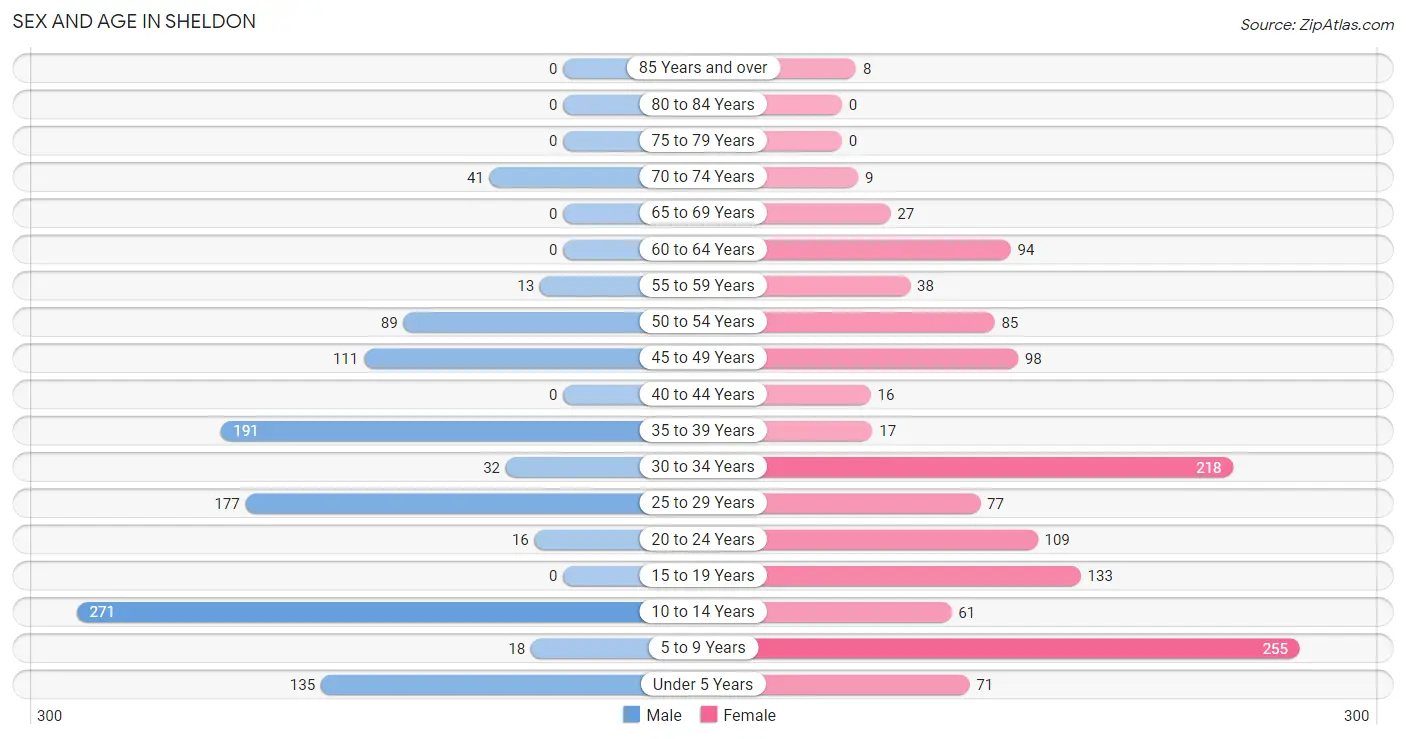
| Age Bracket | Male | Female |
| Under 5 Years | 135 (12.3%) | 71 (5.4%) |
| 5 to 9 Years | 18 (1.7%) | 255 (19.4%) |
| 10 to 14 Years | 271 (24.8%) | 61 (4.6%) |
| 15 to 19 Years | 0 (0.0%) | 133 (10.1%) |
| 20 to 24 Years | 16 (1.5%) | 109 (8.3%) |
| 25 to 29 Years | 177 (16.2%) | 77 (5.9%) |
| 30 to 34 Years | 32 (2.9%) | 218 (16.6%) |
| 35 to 39 Years | 191 (17.5%) | 17 (1.3%) |
| 40 to 44 Years | 0 (0.0%) | 16 (1.2%) |
| 45 to 49 Years | 111 (10.2%) | 98 (7.4%) |
| 50 to 54 Years | 89 (8.1%) | 85 (6.5%) |
| 55 to 59 Years | 13 (1.2%) | 38 (2.9%) |
| 60 to 64 Years | 0 (0.0%) | 94 (7.1%) |
| 65 to 69 Years | 0 (0.0%) | 27 (2.1%) |
| 70 to 74 Years | 41 (3.7%) | 9 (0.7%) |
| 75 to 79 Years | 0 (0.0%) | 0 (0.0%) |
| 80 to 84 Years | 0 (0.0%) | 0 (0.0%) |
| 85 Years and over | 0 (0.0%) | 8 (0.6%) |
| Total | 1,094 (100.0%) | 1,316 (100.0%) |
Families and Households in Sheldon
Median Family Size in Sheldon
The median family size in Sheldon is 4.12 persons per family, with married-couple families (304 | 61.5%) accounting for the largest median family size of 4.56 persons per family. On the other hand, single female/mother families (16 | 3.2%) represent the smallest median family size with 2.69 persons per family.
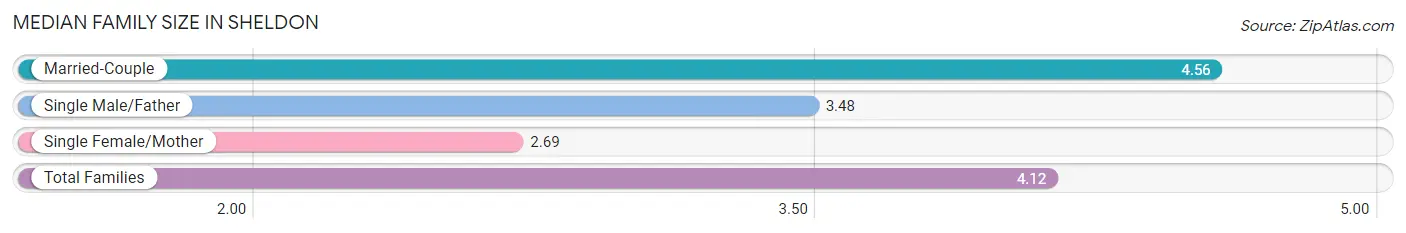
| Family Type | # Families | Family Size |
| Married-Couple | 304 (61.5%) | 4.56 |
| Single Male/Father | 174 (35.2%) | 3.48 |
| Single Female/Mother | 16 (3.2%) | 2.69 |
| Total Families | 494 (100.0%) | 4.12 |
Median Household Size in Sheldon
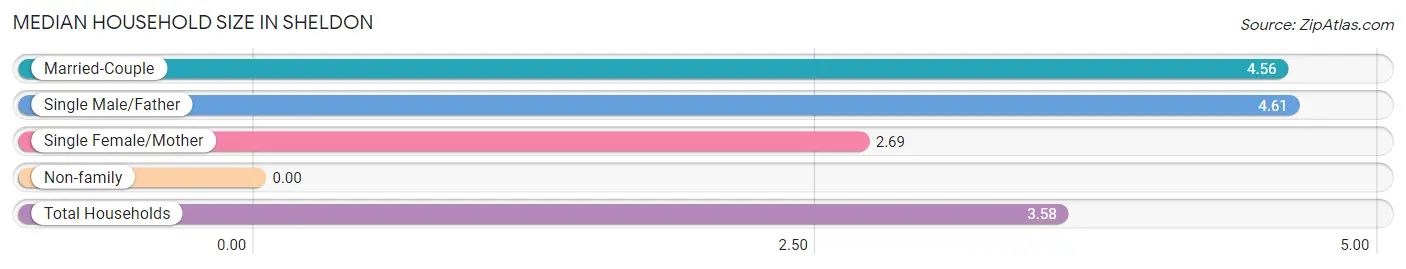
| Household Type | # Households | Household Size |
| Married-Couple | 304 (45.2%) | 4.56 |
| Single Male/Father | 174 (25.9%) | 4.61 |
| Single Female/Mother | 16 (2.4%) | 2.69 |
| Non-family | 179 (26.6%) | - |
| Total Households | 673 (100.0%) | 3.58 |
Household Size by Marriage Status in Sheldon
Out of a total of 673 households in Sheldon, 494 (73.4%) are family households, while 179 (26.6%) are nonfamily households. The most numerous type of family households are 4-person households, comprising 299, and the most common type of nonfamily households are 1-person households, comprising 179.
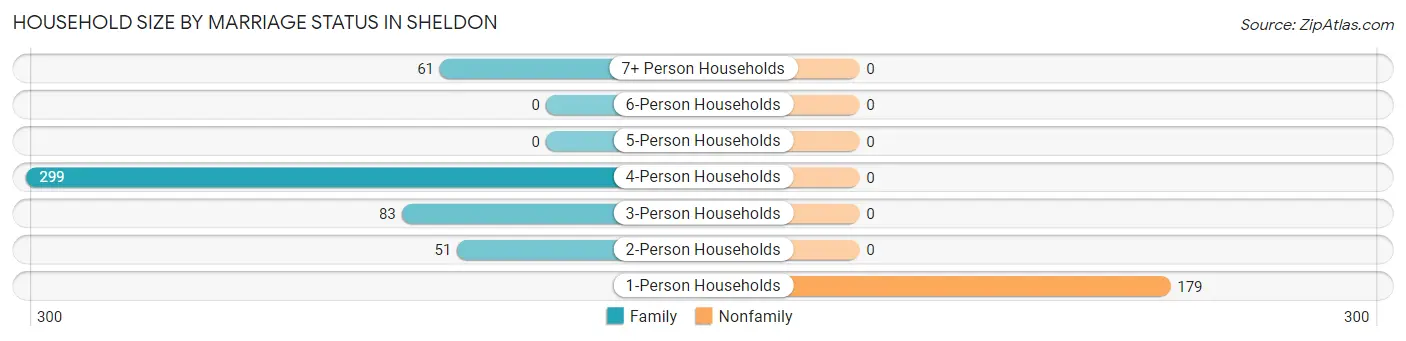
| Household Size | Family Households | Nonfamily Households |
| 1-Person Households | - | 179 (26.6%) |
| 2-Person Households | 51 (7.6%) | 0 (0.0%) |
| 3-Person Households | 83 (12.3%) | 0 (0.0%) |
| 4-Person Households | 299 (44.4%) | 0 (0.0%) |
| 5-Person Households | 0 (0.0%) | 0 (0.0%) |
| 6-Person Households | 0 (0.0%) | 0 (0.0%) |
| 7+ Person Households | 61 (9.1%) | 0 (0.0%) |
| Total | 494 (73.4%) | 179 (26.6%) |
Female Fertility in Sheldon
Fertility by Age in Sheldon
Average fertility rate in Sheldon is 226.0 births per 1,000 women. Women in the age bracket of 35 to 50 years have the highest fertility rate with 351.0 births per 1,000 women. Women in the age bracket of 20 to 34 years acount for 69.5% of all women with births.
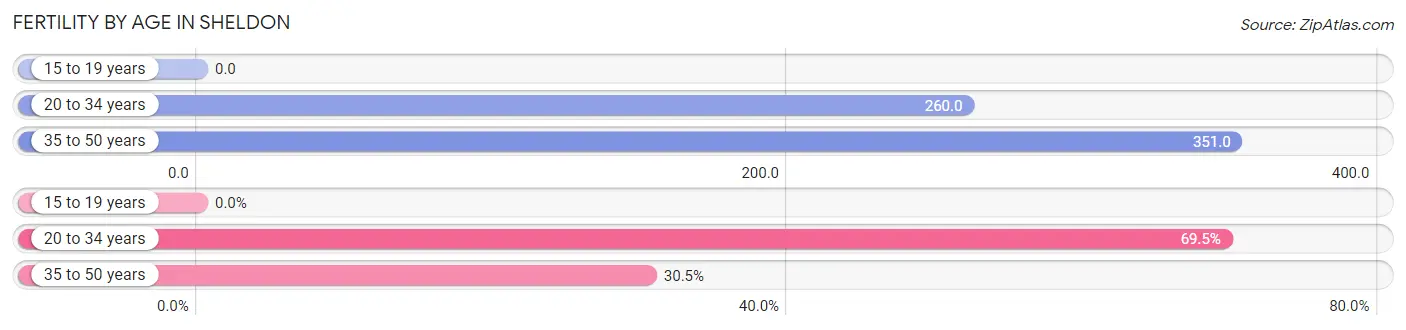
| Age Bracket | Women with Births | Births / 1,000 Women |
| 15 to 19 years | 0 (0.0%) | 0.0 |
| 20 to 34 years | 105 (69.5%) | 260.0 |
| 35 to 50 years | 46 (30.5%) | 351.0 |
| Total | 151 (100.0%) | 226.0 |
Fertility by Age by Marriage Status in Sheldon
66.9% of women with births (151) in Sheldon are married. The highest percentage of unmarried women with births falls into 20 to 34 years age bracket with 47.6% of them unmarried at the time of birth, while the lowest percentage of unmarried women with births belong to 35 to 50 years age bracket with 0.0% of them unmarried.
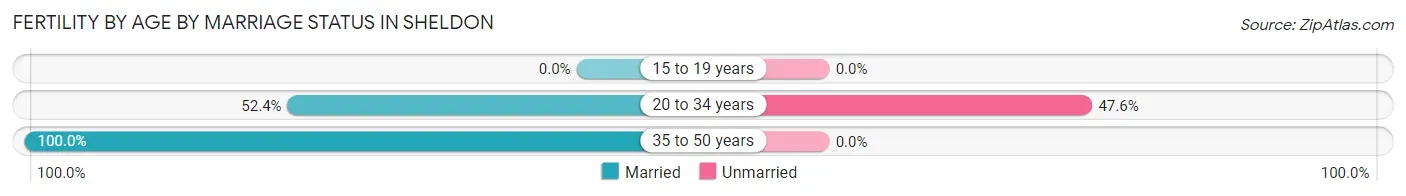
| Age Bracket | Married | Unmarried |
| 15 to 19 years | 0 (0.0%) | 0 (0.0%) |
| 20 to 34 years | 55 (52.4%) | 50 (47.6%) |
| 35 to 50 years | 46 (100.0%) | 0 (0.0%) |
| Total | 101 (66.9%) | 50 (33.1%) |
Fertility by Education in Sheldon
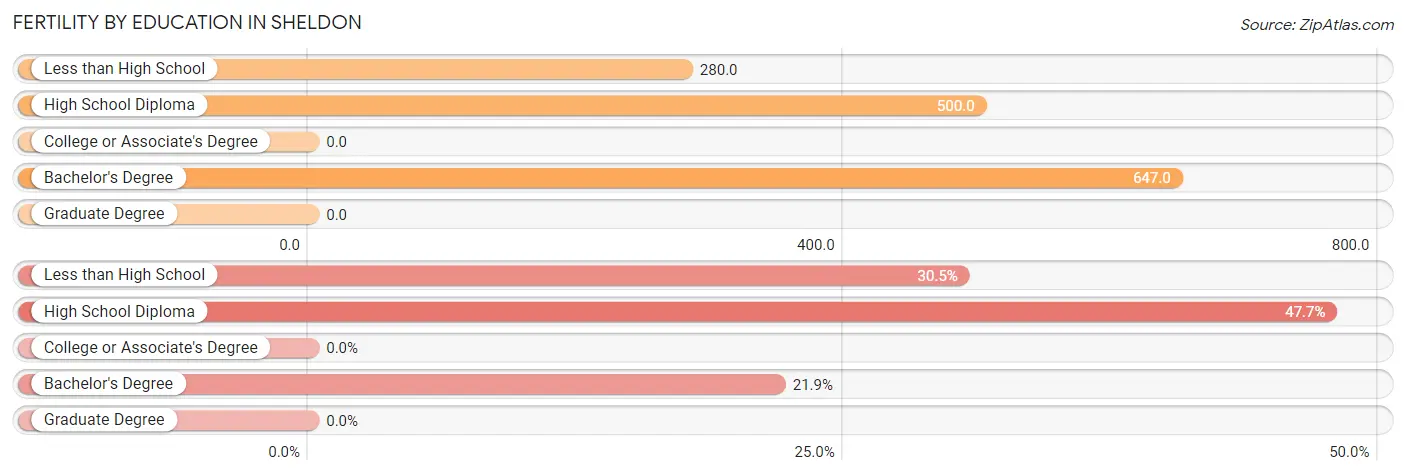
| Educational Attainment | Women with Births | Births / 1,000 Women |
| Less than High School | 46 (30.5%) | 280.0 |
| High School Diploma | 72 (47.7%) | 500.0 |
| College or Associate's Degree | 0 (0.0%) | 0.0 |
| Bachelor's Degree | 33 (21.8%) | 647.0 |
| Graduate Degree | 0 (0.0%) | 0.0 |
| Total | 151 (100.0%) | 226.0 |
Fertility by Education by Marriage Status in Sheldon
33.1% of women with births in Sheldon are unmarried. Women with the educational attainment of less than high school are most likely to be married with 100.0% of them married at childbirth, while women with the educational attainment of bachelor's degree are least likely to be married with 100.0% of them unmarried at childbirth.
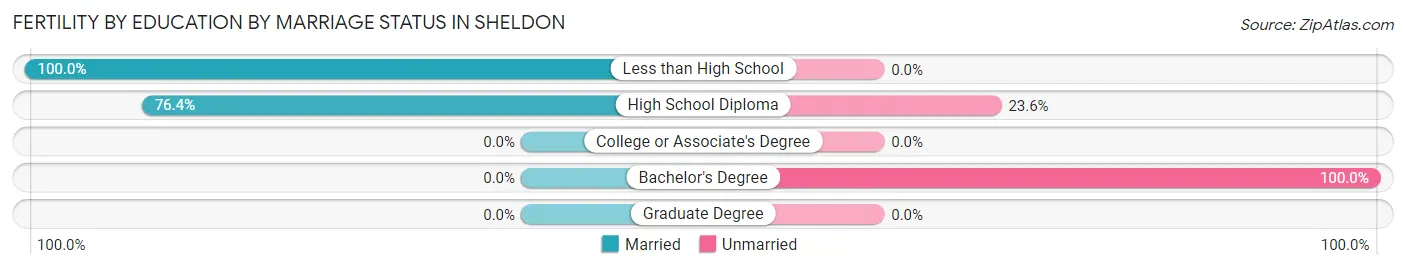
| Educational Attainment | Married | Unmarried |
| Less than High School | 46 (100.0%) | 0 (0.0%) |
| High School Diploma | 55 (76.4%) | 17 (23.6%) |
| College or Associate's Degree | 0 (0.0%) | 0 (0.0%) |
| Bachelor's Degree | 0 (0.0%) | 33 (100.0%) |
| Graduate Degree | 0 (0.0%) | 0 (0.0%) |
| Total | 101 (66.9%) | 50 (33.1%) |
Employment Characteristics in Sheldon
Employment by Class of Employer in Sheldon
Among the 1,109 employed individuals in Sheldon, private company employees (976 | 88.0%), state government employees (38 | 3.4%), and self-employed (not incorporated) (35 | 3.2%) make up the most common classes of employment.
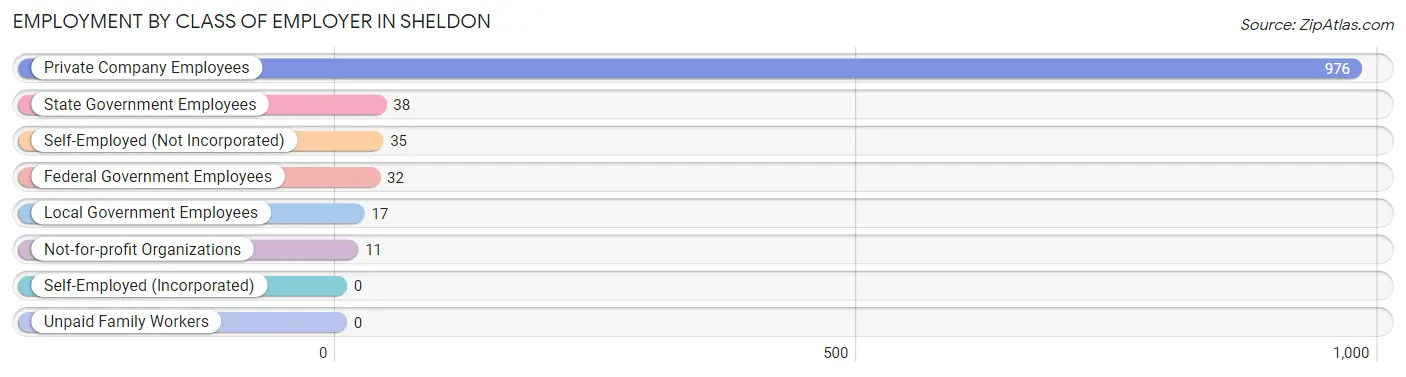
| Employer Class | # Employees | % Employees |
| Private Company Employees | 976 | 88.0% |
| Self-Employed (Incorporated) | 0 | 0.0% |
| Self-Employed (Not Incorporated) | 35 | 3.2% |
| Not-for-profit Organizations | 11 | 1.0% |
| Local Government Employees | 17 | 1.5% |
| State Government Employees | 38 | 3.4% |
| Federal Government Employees | 32 | 2.9% |
| Unpaid Family Workers | 0 | 0.0% |
| Total | 1,109 | 100.0% |
Employment Status by Age in Sheldon
According to the labor force statistics for Sheldon, out of the total population over 16 years of age (1,599), 72.7% or 1,162 individuals are in the labor force, with 3.9% or 45 of them unemployed. The age group with the highest labor force participation rate is 35 to 44 years, with 100.0% or 224 individuals in the labor force. Within the labor force, the 25 to 29 years age range has the highest percentage of unemployed individuals, with 25.4% or 45 of them being unemployed.
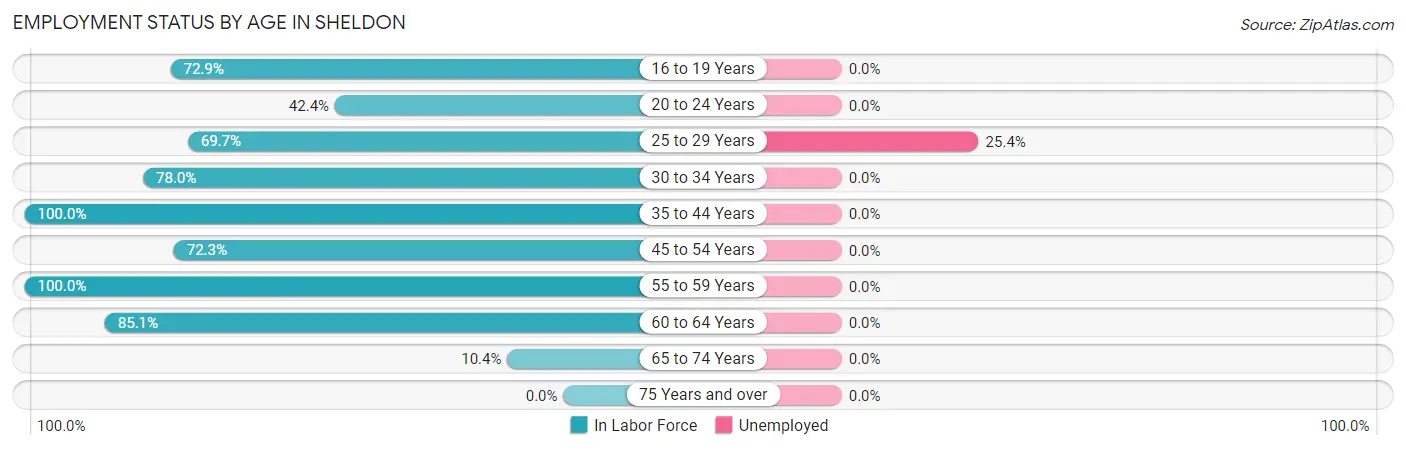
| Age Bracket | In Labor Force | Unemployed |
| 16 to 19 Years | 97 (72.9%) | 0 (0.0%) |
| 20 to 24 Years | 53 (42.4%) | 0 (0.0%) |
| 25 to 29 Years | 177 (69.7%) | 45 (25.4%) |
| 30 to 34 Years | 195 (78.0%) | 0 (0.0%) |
| 35 to 44 Years | 224 (100.0%) | 0 (0.0%) |
| 45 to 54 Years | 277 (72.3%) | 0 (0.0%) |
| 55 to 59 Years | 51 (100.0%) | 0 (0.0%) |
| 60 to 64 Years | 80 (85.1%) | 0 (0.0%) |
| 65 to 74 Years | 8 (10.4%) | 0 (0.0%) |
| 75 Years and over | 0 (0.0%) | 0 (0.0%) |
| Total | 1,162 (72.7%) | 45 (3.9%) |
Employment Status by Educational Attainment in Sheldon
According to labor force statistics for Sheldon, 79.9% of individuals (1,004) out of the total population between 25 and 64 years of age (1,256) are in the labor force, with 4.5% or 45 of them being unemployed. The group with the highest labor force participation rate are those with the educational attainment of less than high school, with 87.7% or 328 individuals in the labor force. Within the labor force, individuals with college / associate degree education have the highest percentage of unemployment, with 14.7% or 45 of them being unemployed.
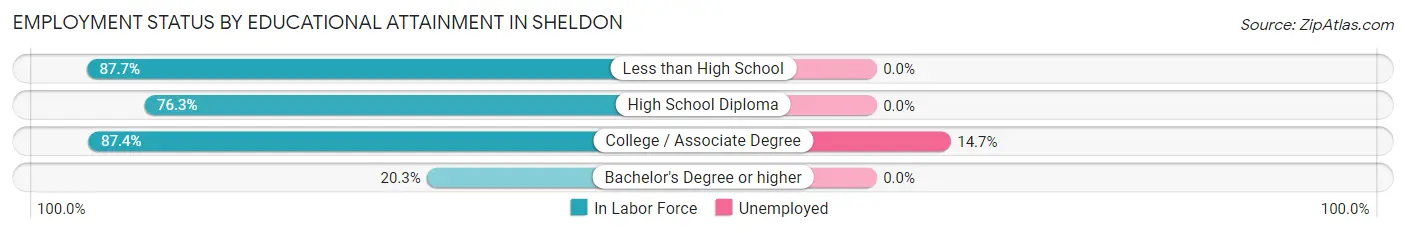
| Educational Attainment | In Labor Force | Unemployed |
| Less than High School | 328 (87.7%) | 0 (0.0%) |
| High School Diploma | 357 (76.3%) | 0 (0.0%) |
| College / Associate Degree | 306 (87.4%) | 51 (14.7%) |
| Bachelor's Degree or higher | 13 (20.3%) | 0 (0.0%) |
| Total | 1,004 (79.9%) | 57 (4.5%) |
Employment Occupations by Sex in Sheldon
Management, Business, Science and Arts Occupations
The most common Management, Business, Science and Arts occupations in Sheldon are Community & Social Service (11 | 1.0%), and Education, Arts & Media (11 | 1.0%).
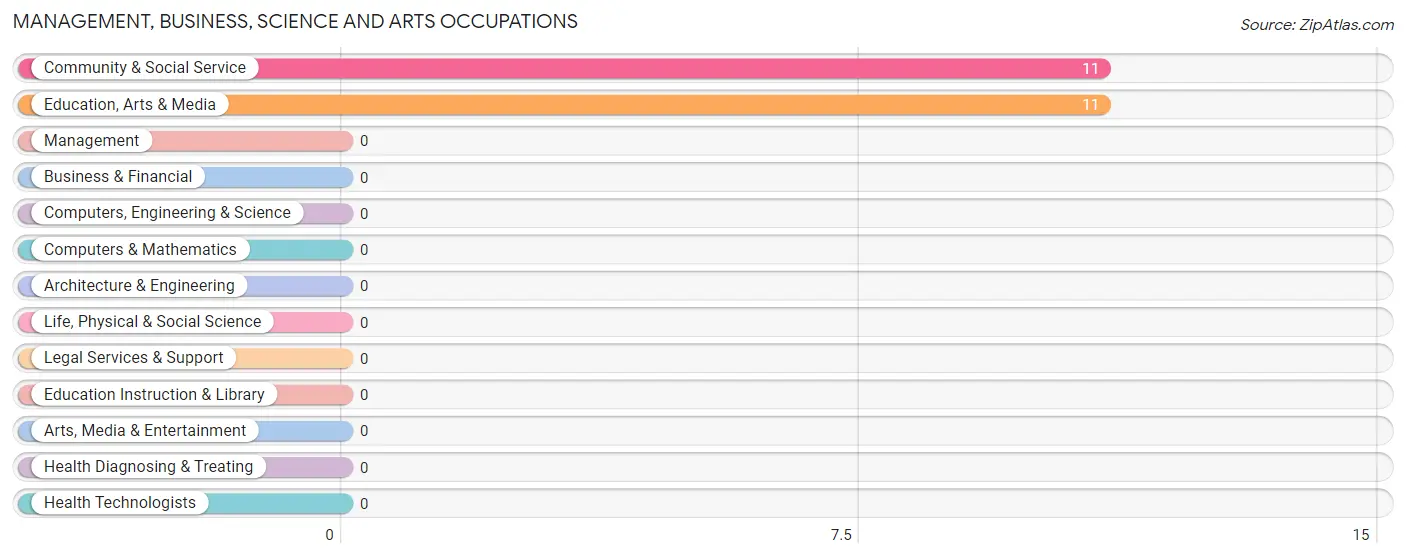
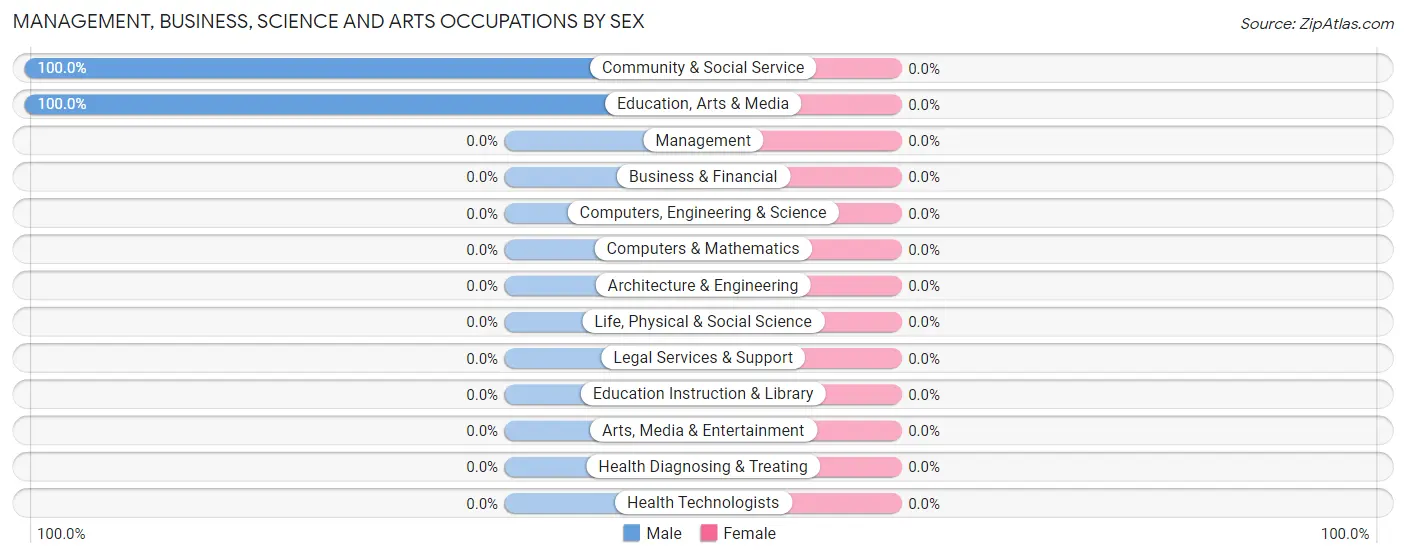
Management, Business, Science and Arts Occupations by Sex
| Occupation | Male | Female |
| Management | 0 (0.0%) | 0 (0.0%) |
| Business & Financial | 0 (0.0%) | 0 (0.0%) |
| Computers, Engineering & Science | 0 (0.0%) | 0 (0.0%) |
| Computers & Mathematics | 0 (0.0%) | 0 (0.0%) |
| Architecture & Engineering | 0 (0.0%) | 0 (0.0%) |
| Life, Physical & Social Science | 0 (0.0%) | 0 (0.0%) |
| Community & Social Service | 11 (100.0%) | 0 (0.0%) |
| Education, Arts & Media | 11 (100.0%) | 0 (0.0%) |
| Legal Services & Support | 0 (0.0%) | 0 (0.0%) |
| Education Instruction & Library | 0 (0.0%) | 0 (0.0%) |
| Arts, Media & Entertainment | 0 (0.0%) | 0 (0.0%) |
| Health Diagnosing & Treating | 0 (0.0%) | 0 (0.0%) |
| Health Technologists | 0 (0.0%) | 0 (0.0%) |
| Total (Category) | 11 (100.0%) | 0 (0.0%) |
| Total (Overall) | 526 (47.1%) | 591 (52.9%) |
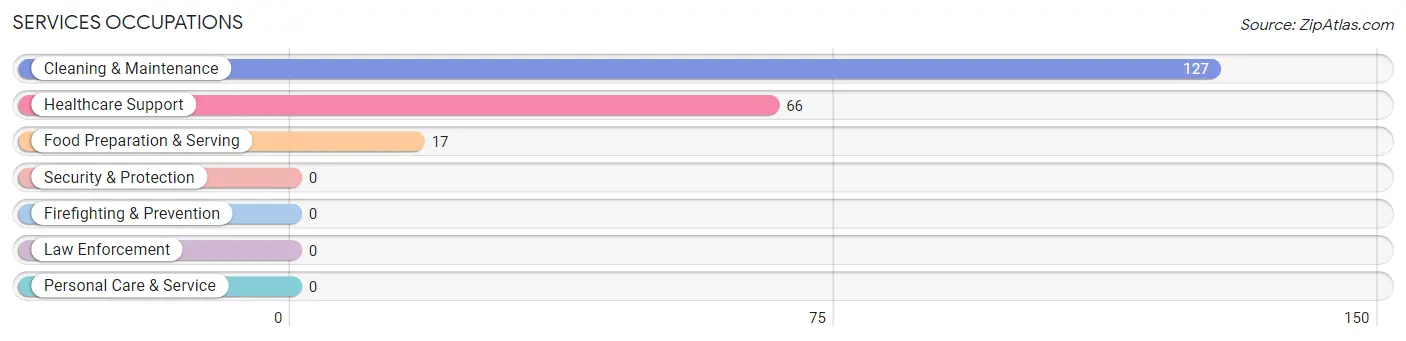
Services Occupations
The most common Services occupations in Sheldon are Cleaning & Maintenance (127 | 11.4%), Healthcare Support (66 | 5.9%), and Food Preparation & Serving (17 | 1.5%).
Services Occupations by Sex
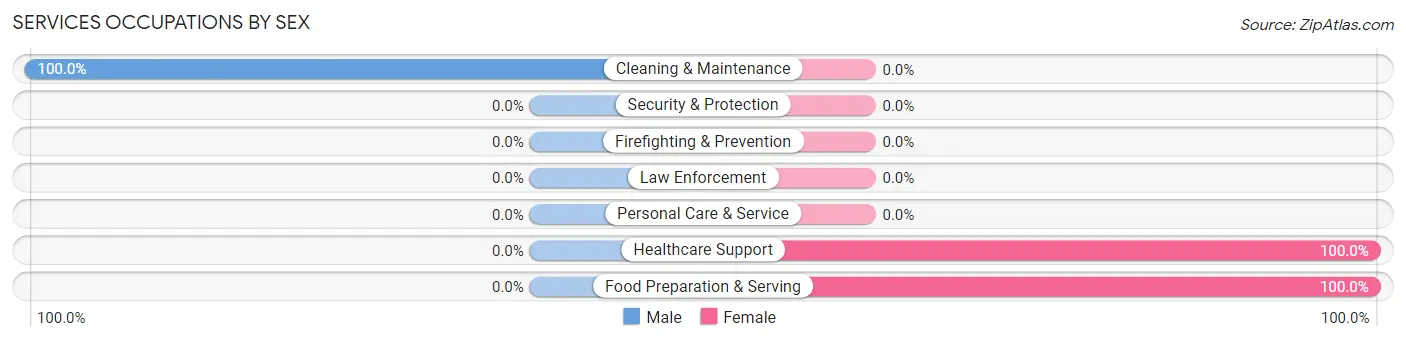
| Occupation | Male | Female |
| Healthcare Support | 0 (0.0%) | 66 (100.0%) |
| Security & Protection | 0 (0.0%) | 0 (0.0%) |
| Firefighting & Prevention | 0 (0.0%) | 0 (0.0%) |
| Law Enforcement | 0 (0.0%) | 0 (0.0%) |
| Food Preparation & Serving | 0 (0.0%) | 17 (100.0%) |
| Cleaning & Maintenance | 127 (100.0%) | 0 (0.0%) |
| Personal Care & Service | 0 (0.0%) | 0 (0.0%) |
| Total (Category) | 127 (60.5%) | 83 (39.5%) |
| Total (Overall) | 526 (47.1%) | 591 (52.9%) |
Sales and Office Occupations
The most common Sales and Office occupations in Sheldon are Office & Administration (196 | 17.5%), and Sales & Related (147 | 13.2%).
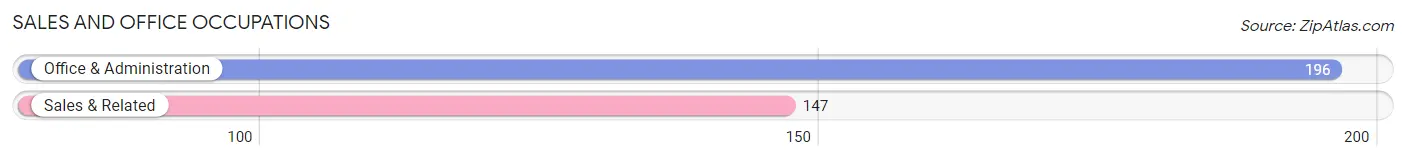
Sales and Office Occupations by Sex
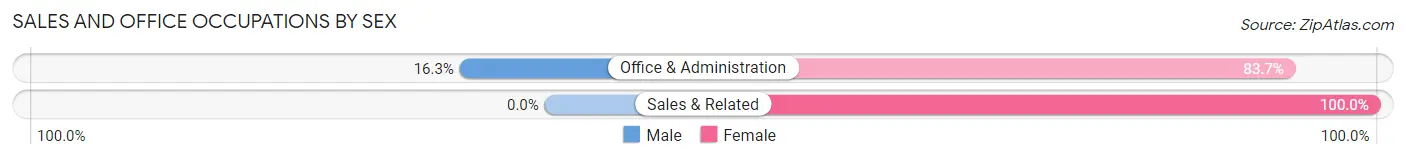
| Occupation | Male | Female |
| Sales & Related | 0 (0.0%) | 147 (100.0%) |
| Office & Administration | 32 (16.3%) | 164 (83.7%) |
| Total (Category) | 32 (9.3%) | 311 (90.7%) |
| Total (Overall) | 526 (47.1%) | 591 (52.9%) |
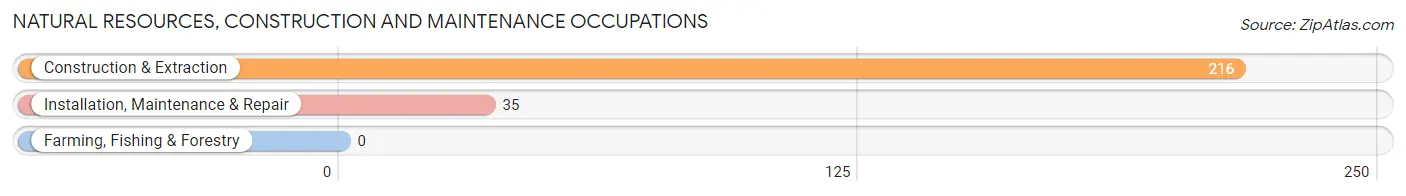
Natural Resources, Construction and Maintenance Occupations
The most common Natural Resources, Construction and Maintenance occupations in Sheldon are Construction & Extraction (216 | 19.3%), and Installation, Maintenance & Repair (35 | 3.1%).
Natural Resources, Construction and Maintenance Occupations by Sex
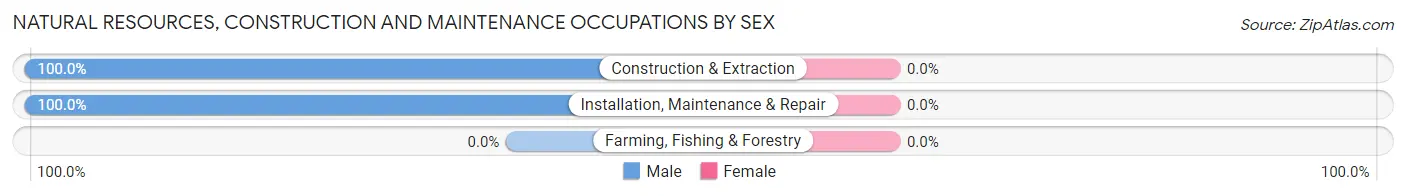
| Occupation | Male | Female |
| Farming, Fishing & Forestry | 0 (0.0%) | 0 (0.0%) |
| Construction & Extraction | 216 (100.0%) | 0 (0.0%) |
| Installation, Maintenance & Repair | 35 (100.0%) | 0 (0.0%) |
| Total (Category) | 251 (100.0%) | 0 (0.0%) |
| Total (Overall) | 526 (47.1%) | 591 (52.9%) |
Production, Transportation and Moving Occupations
The most common Production, Transportation and Moving occupations in Sheldon are Transportation (163 | 14.6%), Production (105 | 9.4%), and Material Moving (34 | 3.0%).
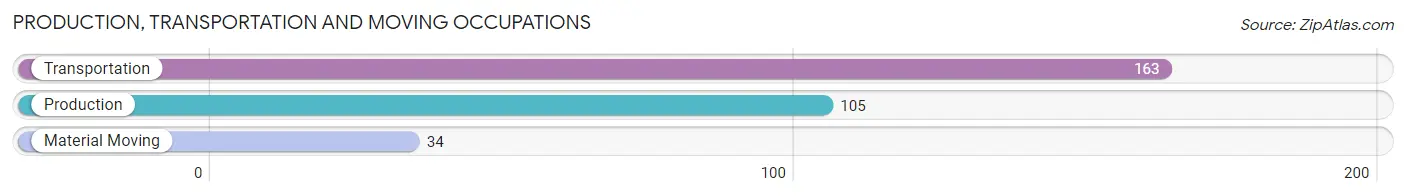
Production, Transportation and Moving Occupations by Sex
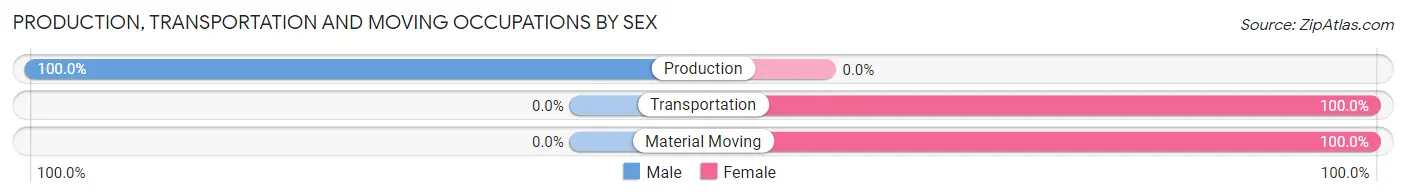
| Occupation | Male | Female |
| Production | 105 (100.0%) | 0 (0.0%) |
| Transportation | 0 (0.0%) | 163 (100.0%) |
| Material Moving | 0 (0.0%) | 34 (100.0%) |
| Total (Category) | 105 (34.8%) | 197 (65.2%) |
| Total (Overall) | 526 (47.1%) | 591 (52.9%) |
Employment Industries by Sex in Sheldon
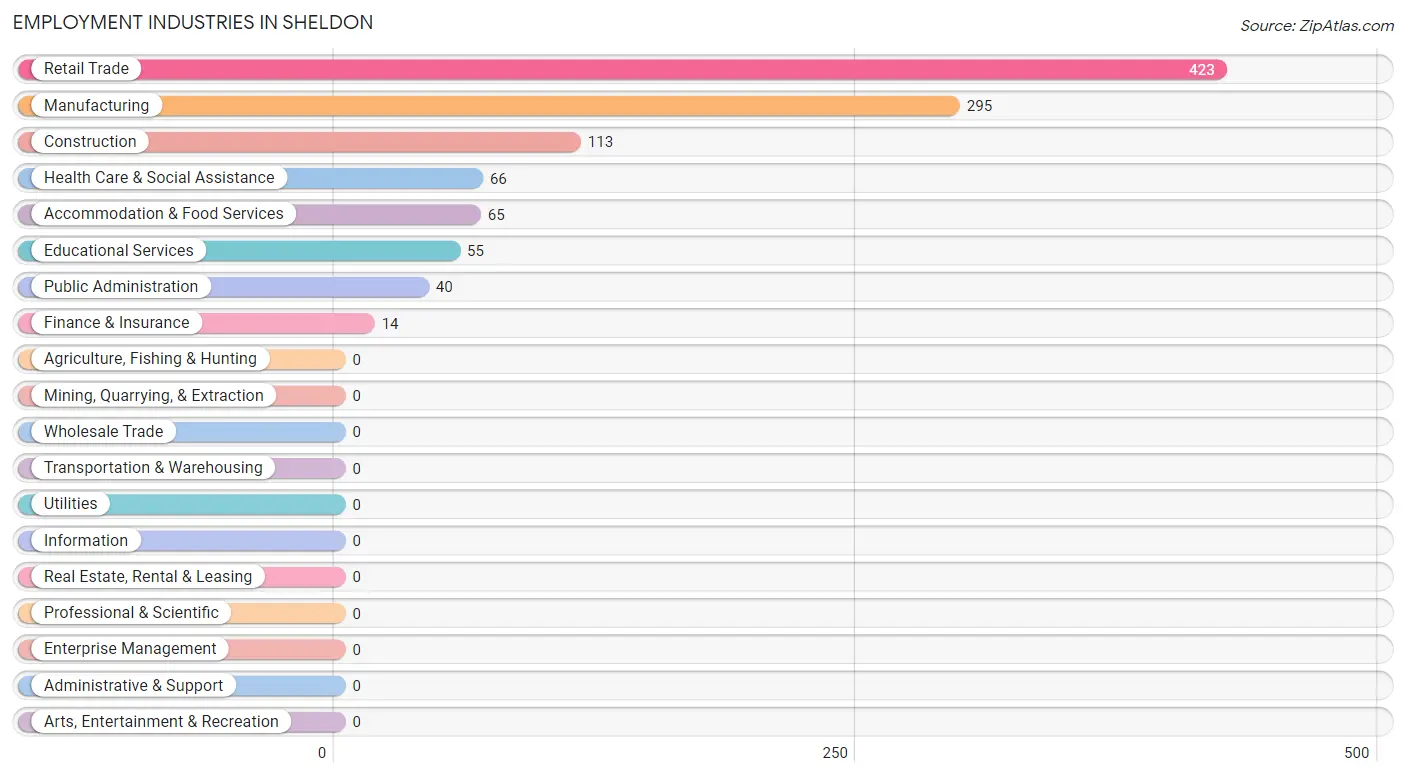
Employment Industries in Sheldon
The major employment industries in Sheldon include Retail Trade (423 | 37.9%), Manufacturing (295 | 26.4%), Construction (113 | 10.1%), Health Care & Social Assistance (66 | 5.9%), and Accommodation & Food Services (65 | 5.8%).
Employment Industries by Sex in Sheldon
The Sheldon industries that see more men than women are Construction (100.0%), Public Administration (80.0%), and Manufacturing (70.5%), whereas the industries that tend to have a higher number of women are Finance & Insurance (100.0%), Educational Services (100.0%), and Health Care & Social Assistance (100.0%).
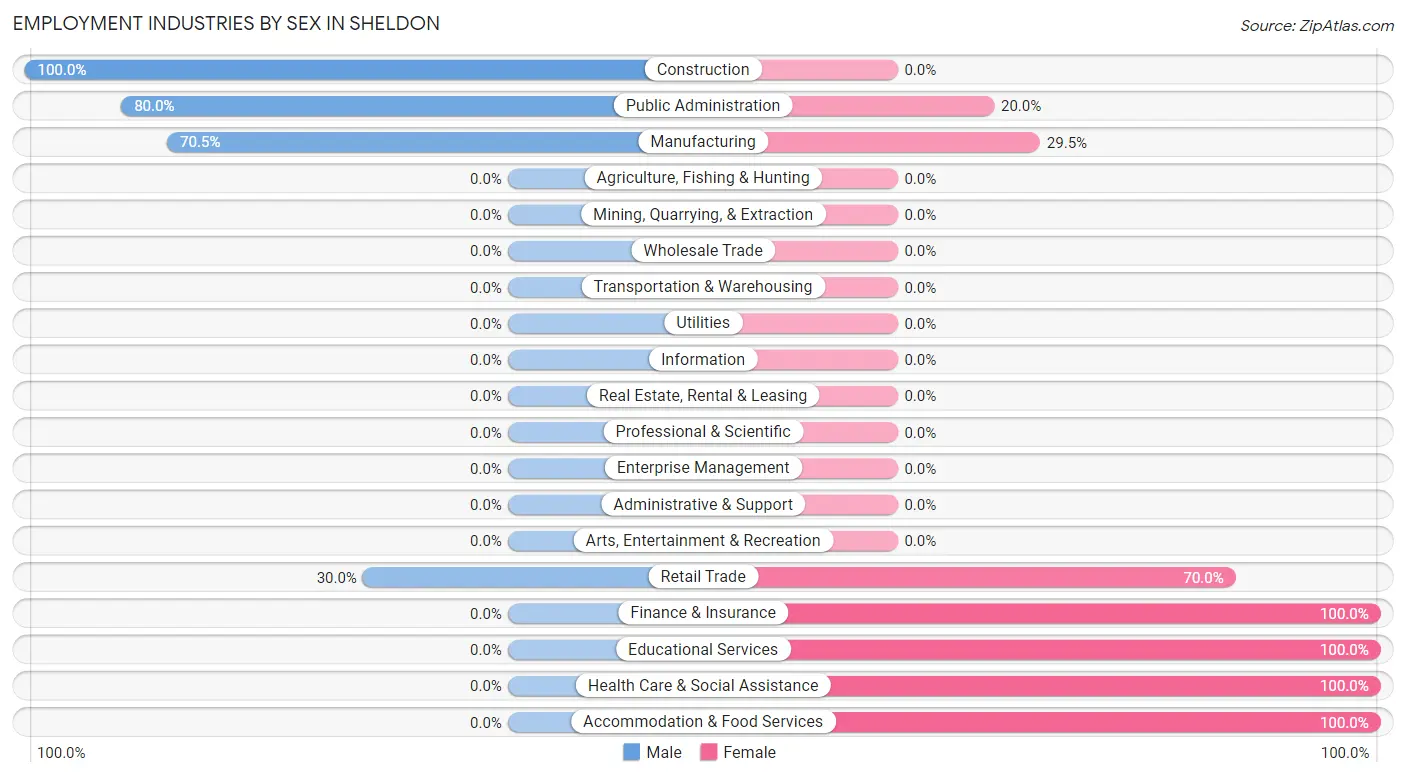
| Industry | Male | Female |
| Agriculture, Fishing & Hunting | 0 (0.0%) | 0 (0.0%) |
| Mining, Quarrying, & Extraction | 0 (0.0%) | 0 (0.0%) |
| Construction | 113 (100.0%) | 0 (0.0%) |
| Manufacturing | 208 (70.5%) | 87 (29.5%) |
| Wholesale Trade | 0 (0.0%) | 0 (0.0%) |
| Retail Trade | 127 (30.0%) | 296 (70.0%) |
| Transportation & Warehousing | 0 (0.0%) | 0 (0.0%) |
| Utilities | 0 (0.0%) | 0 (0.0%) |
| Information | 0 (0.0%) | 0 (0.0%) |
| Finance & Insurance | 0 (0.0%) | 14 (100.0%) |
| Real Estate, Rental & Leasing | 0 (0.0%) | 0 (0.0%) |
| Professional & Scientific | 0 (0.0%) | 0 (0.0%) |
| Enterprise Management | 0 (0.0%) | 0 (0.0%) |
| Administrative & Support | 0 (0.0%) | 0 (0.0%) |
| Educational Services | 0 (0.0%) | 55 (100.0%) |
| Health Care & Social Assistance | 0 (0.0%) | 66 (100.0%) |
| Arts, Entertainment & Recreation | 0 (0.0%) | 0 (0.0%) |
| Accommodation & Food Services | 0 (0.0%) | 65 (100.0%) |
| Public Administration | 32 (80.0%) | 8 (20.0%) |
| Total | 526 (47.1%) | 591 (52.9%) |
Education in Sheldon
School Enrollment in Sheldon
The most common levels of schooling among the 772 students in Sheldon are middle school (318 | 41.2%), elementary school (226 | 29.3%), and college / undergraduate (130 | 16.8%).
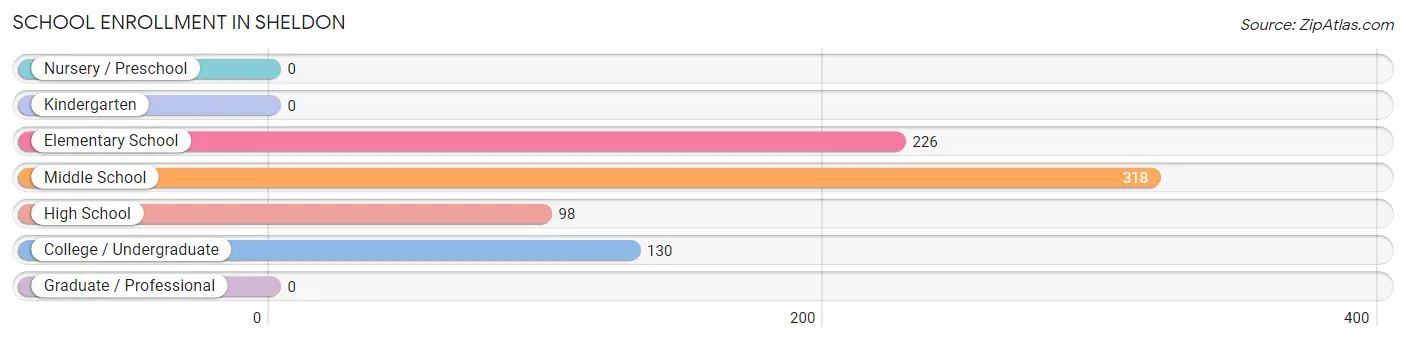
| School Level | # Students | % Students |
| Nursery / Preschool | 0 | 0.0% |
| Kindergarten | 0 | 0.0% |
| Elementary School | 226 | 29.3% |
| Middle School | 318 | 41.2% |
| High School | 98 | 12.7% |
| College / Undergraduate | 130 | 16.8% |
| Graduate / Professional | 0 | 0.0% |
| Total | 772 | 100.0% |
School Enrollment by Age by Funding Source in Sheldon
Out of a total of 772 students who are enrolled in schools in Sheldon, 313 (40.5%) attend a private institution, while the remaining 459 (59.5%) are enrolled in public schools. The age group of 5 to 9 year old has the highest likelihood of being enrolled in private schools, with 167 (73.9% in the age bracket) enrolled. Conversely, the age group of 15 to 17 year olds has the lowest likelihood of being enrolled in a private school, with 84 (100.0% in the age bracket) attending a public institution.
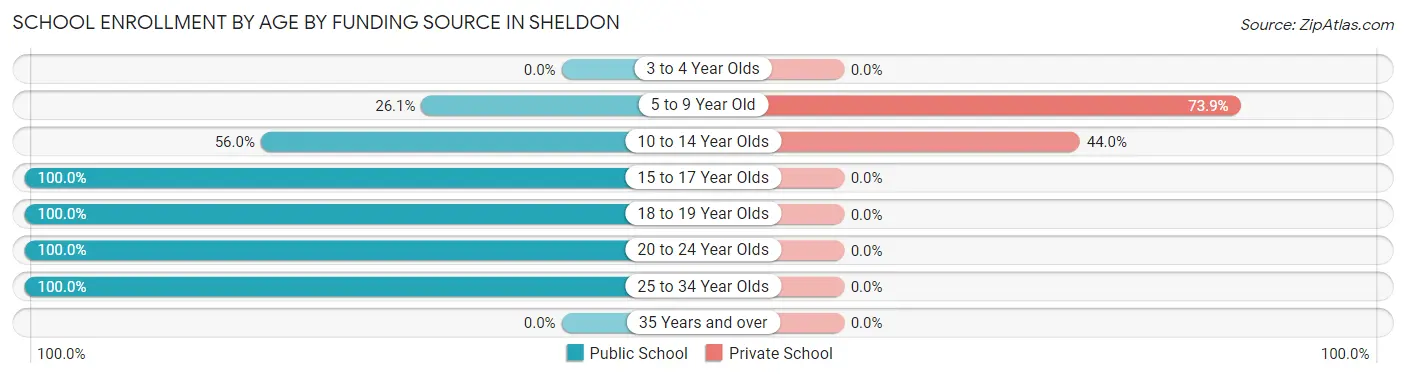
| Age Bracket | Public School | Private School |
| 3 to 4 Year Olds | 0 (0.0%) | 0 (0.0%) |
| 5 to 9 Year Old | 59 (26.1%) | 167 (73.9%) |
| 10 to 14 Year Olds | 186 (56.0%) | 146 (44.0%) |
| 15 to 17 Year Olds | 84 (100.0%) | 0 (0.0%) |
| 18 to 19 Year Olds | 49 (100.0%) | 0 (0.0%) |
| 20 to 24 Year Olds | 36 (100.0%) | 0 (0.0%) |
| 25 to 34 Year Olds | 45 (100.0%) | 0 (0.0%) |
| 35 Years and over | 0 (0.0%) | 0 (0.0%) |
| Total | 459 (59.5%) | 313 (40.5%) |
Educational Attainment by Field of Study in Sheldon
Literature & languages (33 | 51.6%), social sciences (18 | 28.1%), and engineering (13 | 20.3%) are the most common fields of study among 64 individuals in Sheldon who have obtained a bachelor's degree or higher.
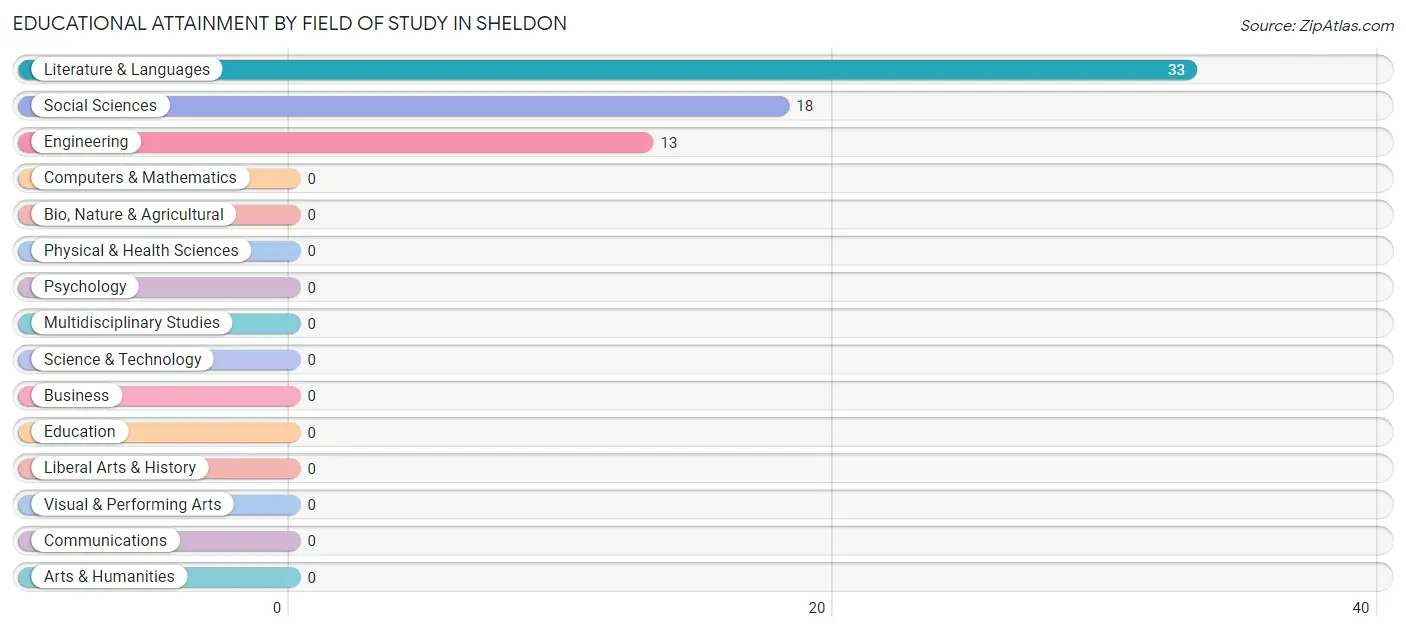
| Field of Study | # Graduates | % Graduates |
| Computers & Mathematics | 0 | 0.0% |
| Bio, Nature & Agricultural | 0 | 0.0% |
| Physical & Health Sciences | 0 | 0.0% |
| Psychology | 0 | 0.0% |
| Social Sciences | 18 | 28.1% |
| Engineering | 13 | 20.3% |
| Multidisciplinary Studies | 0 | 0.0% |
| Science & Technology | 0 | 0.0% |
| Business | 0 | 0.0% |
| Education | 0 | 0.0% |
| Literature & Languages | 33 | 51.6% |
| Liberal Arts & History | 0 | 0.0% |
| Visual & Performing Arts | 0 | 0.0% |
| Communications | 0 | 0.0% |
| Arts & Humanities | 0 | 0.0% |
| Total | 64 | 100.0% |
Transportation & Commute in Sheldon
Vehicle Availability by Sex in Sheldon
The most prevalent vehicle ownership categories in Sheldon are males with 1 vehicle (223, accounting for 42.4%) and females with 1 vehicle (234, making up 38.3%).
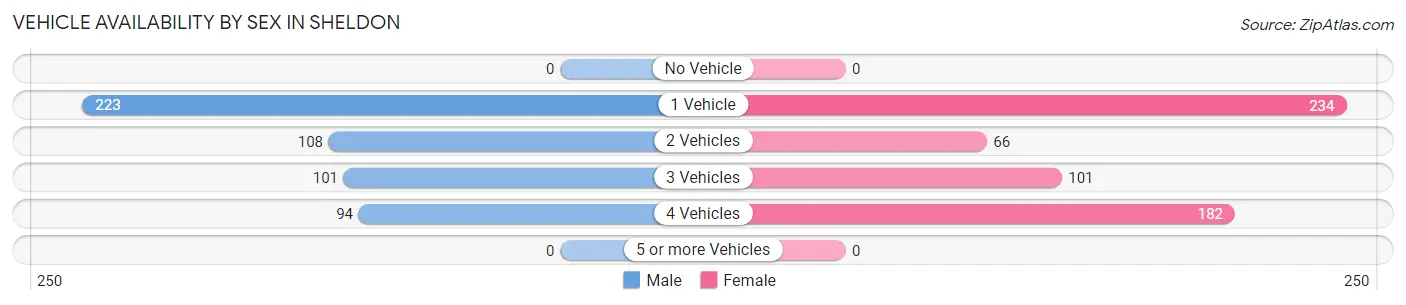
| Vehicles Available | Male | Female |
| No Vehicle | 0 (0.0%) | 0 (0.0%) |
| 1 Vehicle | 223 (42.4%) | 234 (40.1%) |
| 2 Vehicles | 108 (20.5%) | 66 (11.3%) |
| 3 Vehicles | 101 (19.2%) | 101 (17.3%) |
| 4 Vehicles | 94 (17.9%) | 182 (31.2%) |
| 5 or more Vehicles | 0 (0.0%) | 0 (0.0%) |
| Total | 526 (100.0%) | 583 (100.0%) |
Commute Time in Sheldon
The most frequently occuring commute durations in Sheldon are 20 to 24 minutes (290 commuters, 27.3%), 10 to 14 minutes (217 commuters, 20.4%), and 45 to 59 minutes (122 commuters, 11.5%).
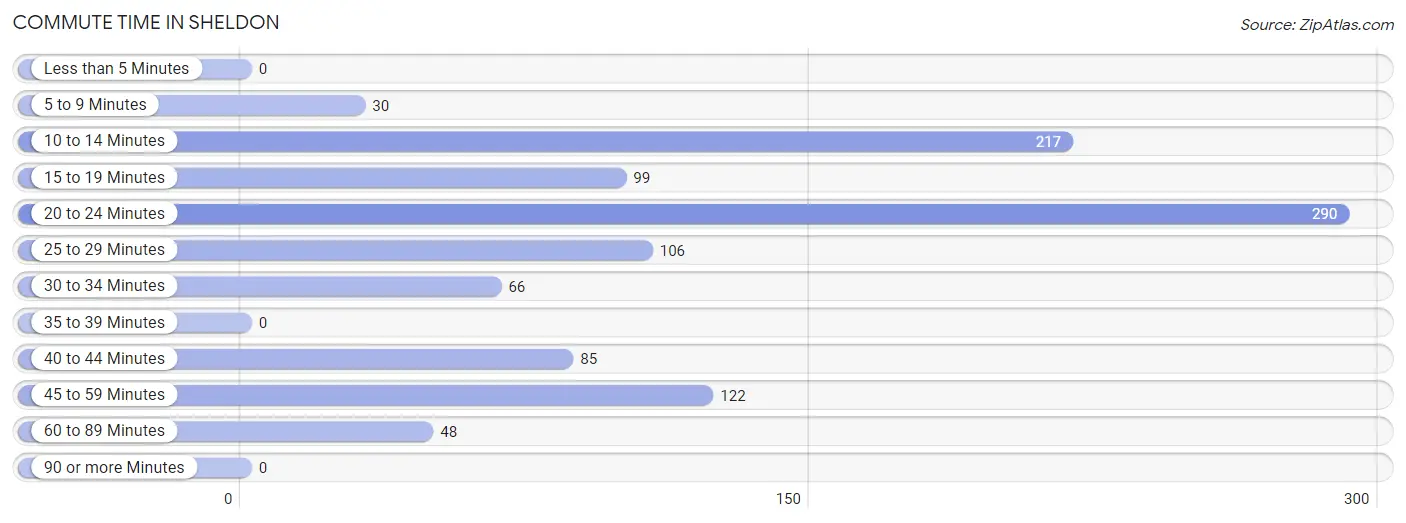
| Commute Time | # Commuters | % Commuters |
| Less than 5 Minutes | 0 | 0.0% |
| 5 to 9 Minutes | 30 | 2.8% |
| 10 to 14 Minutes | 217 | 20.4% |
| 15 to 19 Minutes | 99 | 9.3% |
| 20 to 24 Minutes | 290 | 27.3% |
| 25 to 29 Minutes | 106 | 10.0% |
| 30 to 34 Minutes | 66 | 6.2% |
| 35 to 39 Minutes | 0 | 0.0% |
| 40 to 44 Minutes | 85 | 8.0% |
| 45 to 59 Minutes | 122 | 11.5% |
| 60 to 89 Minutes | 48 | 4.5% |
| 90 or more Minutes | 0 | 0.0% |
Commute Time by Sex in Sheldon
The most common commute times in Sheldon are 20 to 24 minutes (127 commuters, 25.7%) for males and 20 to 24 minutes (163 commuters, 28.6%) for females.
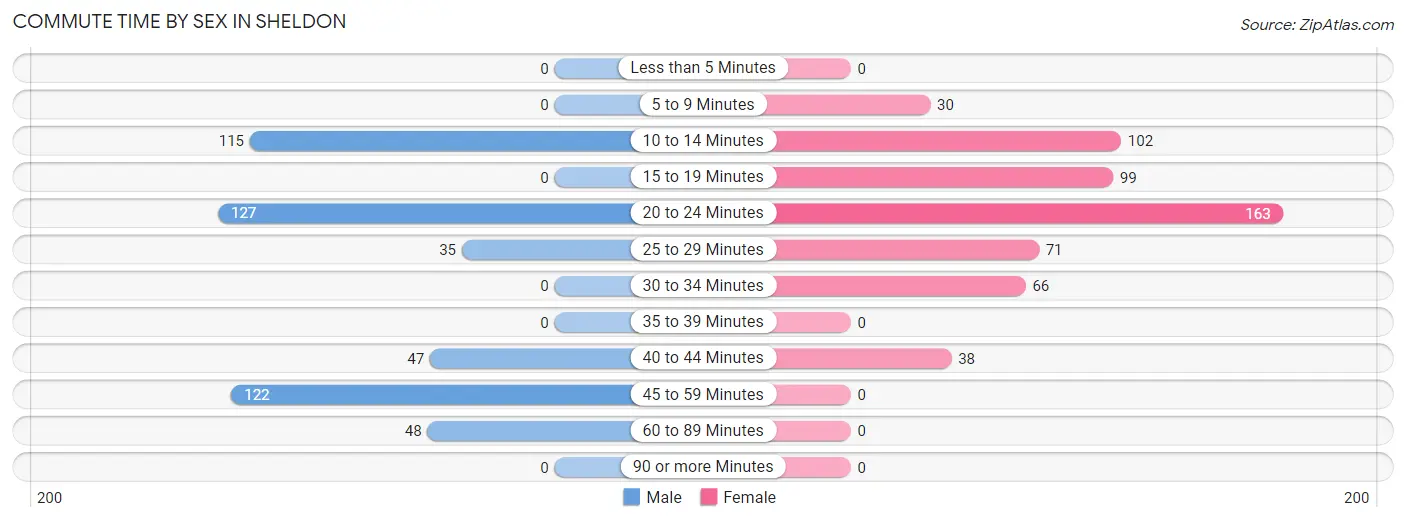
| Commute Time | Male | Female |
| Less than 5 Minutes | 0 (0.0%) | 0 (0.0%) |
| 5 to 9 Minutes | 0 (0.0%) | 30 (5.3%) |
| 10 to 14 Minutes | 115 (23.3%) | 102 (17.9%) |
| 15 to 19 Minutes | 0 (0.0%) | 99 (17.4%) |
| 20 to 24 Minutes | 127 (25.7%) | 163 (28.6%) |
| 25 to 29 Minutes | 35 (7.1%) | 71 (12.5%) |
| 30 to 34 Minutes | 0 (0.0%) | 66 (11.6%) |
| 35 to 39 Minutes | 0 (0.0%) | 0 (0.0%) |
| 40 to 44 Minutes | 47 (9.5%) | 38 (6.7%) |
| 45 to 59 Minutes | 122 (24.7%) | 0 (0.0%) |
| 60 to 89 Minutes | 48 (9.7%) | 0 (0.0%) |
| 90 or more Minutes | 0 (0.0%) | 0 (0.0%) |
Time of Departure to Work by Sex in Sheldon
The most frequent times of departure to work in Sheldon are 6:00 AM to 6:29 AM (139, 28.1%) for males and 12:00 PM to 3:59 PM (163, 28.6%) for females.
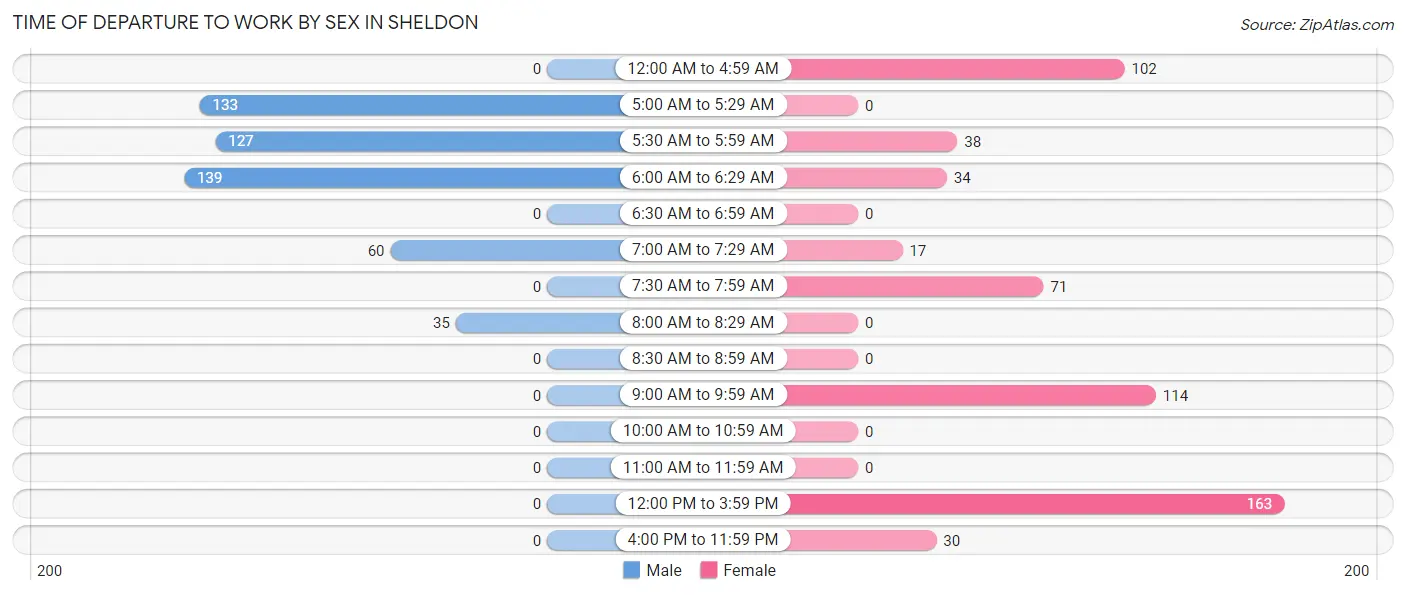
| Time of Departure | Male | Female |
| 12:00 AM to 4:59 AM | 0 (0.0%) | 102 (17.9%) |
| 5:00 AM to 5:29 AM | 133 (26.9%) | 0 (0.0%) |
| 5:30 AM to 5:59 AM | 127 (25.7%) | 38 (6.7%) |
| 6:00 AM to 6:29 AM | 139 (28.1%) | 34 (6.0%) |
| 6:30 AM to 6:59 AM | 0 (0.0%) | 0 (0.0%) |
| 7:00 AM to 7:29 AM | 60 (12.1%) | 17 (3.0%) |
| 7:30 AM to 7:59 AM | 0 (0.0%) | 71 (12.5%) |
| 8:00 AM to 8:29 AM | 35 (7.1%) | 0 (0.0%) |
| 8:30 AM to 8:59 AM | 0 (0.0%) | 0 (0.0%) |
| 9:00 AM to 9:59 AM | 0 (0.0%) | 114 (20.0%) |
| 10:00 AM to 10:59 AM | 0 (0.0%) | 0 (0.0%) |
| 11:00 AM to 11:59 AM | 0 (0.0%) | 0 (0.0%) |
| 12:00 PM to 3:59 PM | 0 (0.0%) | 163 (28.6%) |
| 4:00 PM to 11:59 PM | 0 (0.0%) | 30 (5.3%) |
| Total | 494 (100.0%) | 569 (100.0%) |
Housing Occupancy in Sheldon
Occupancy by Ownership in Sheldon
Of the total 673 dwellings in Sheldon, owner-occupied units account for 401 (59.6%), while renter-occupied units make up 272 (40.4%).
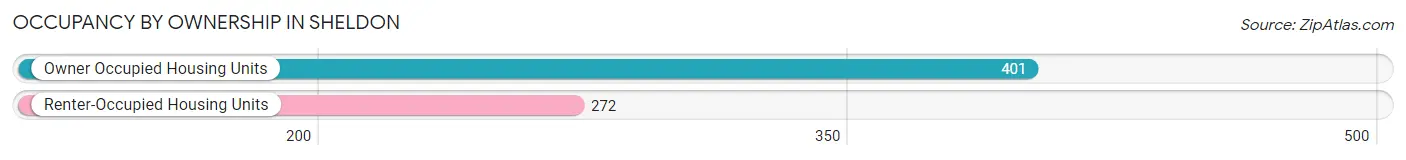
| Occupancy | # Housing Units | % Housing Units |
| Owner Occupied Housing Units | 401 | 59.6% |
| Renter-Occupied Housing Units | 272 | 40.4% |
| Total Occupied Housing Units | 673 | 100.0% |
Occupancy by Household Size in Sheldon
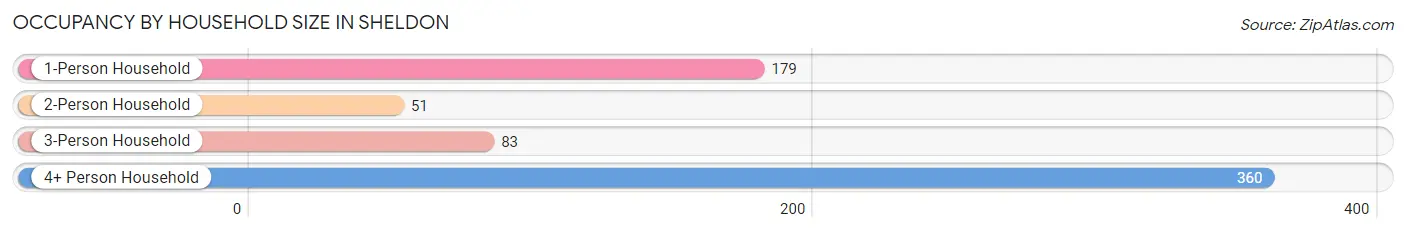
| Household Size | # Housing Units | % Housing Units |
| 1-Person Household | 179 | 26.6% |
| 2-Person Household | 51 | 7.6% |
| 3-Person Household | 83 | 12.3% |
| 4+ Person Household | 360 | 53.5% |
| Total Housing Units | 673 | 100.0% |
Occupancy by Ownership by Household Size in Sheldon
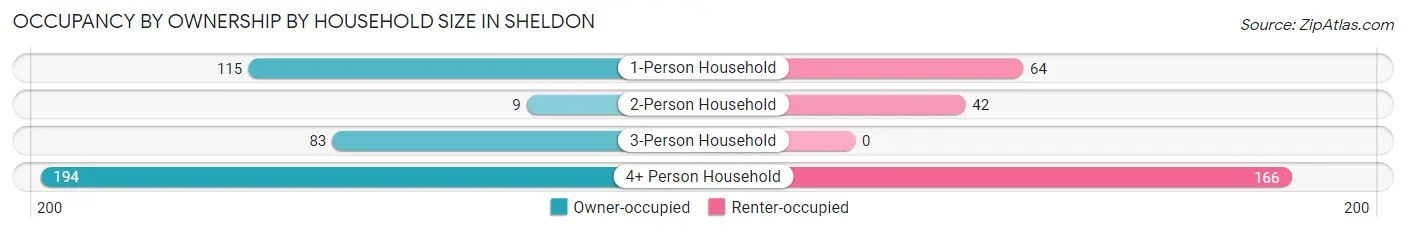
| Household Size | Owner-occupied | Renter-occupied |
| 1-Person Household | 115 (64.2%) | 64 (35.7%) |
| 2-Person Household | 9 (17.6%) | 42 (82.4%) |
| 3-Person Household | 83 (100.0%) | 0 (0.0%) |
| 4+ Person Household | 194 (53.9%) | 166 (46.1%) |
| Total Housing Units | 401 (59.6%) | 272 (40.4%) |
Occupancy by Educational Attainment in Sheldon
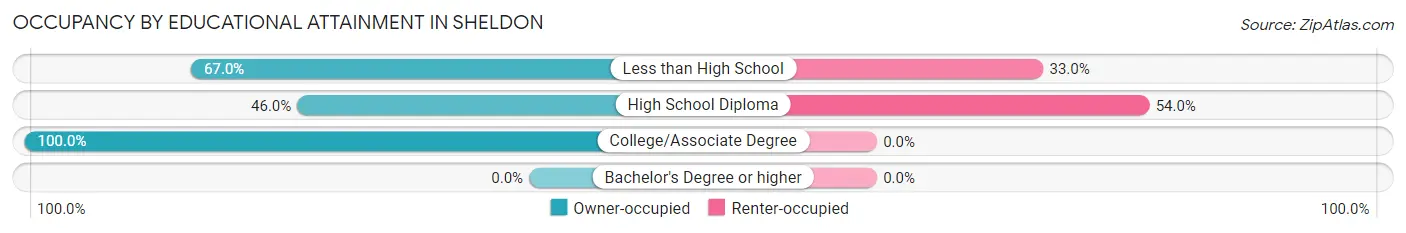
| Household Size | Owner-occupied | Renter-occupied |
| Less than High School | 130 (67.0%) | 64 (33.0%) |
| High School Diploma | 177 (46.0%) | 208 (54.0%) |
| College/Associate Degree | 94 (100.0%) | 0 (0.0%) |
| Bachelor's Degree or higher | 0 (0.0%) | 0 (0.0%) |
Occupancy by Age of Householder in Sheldon
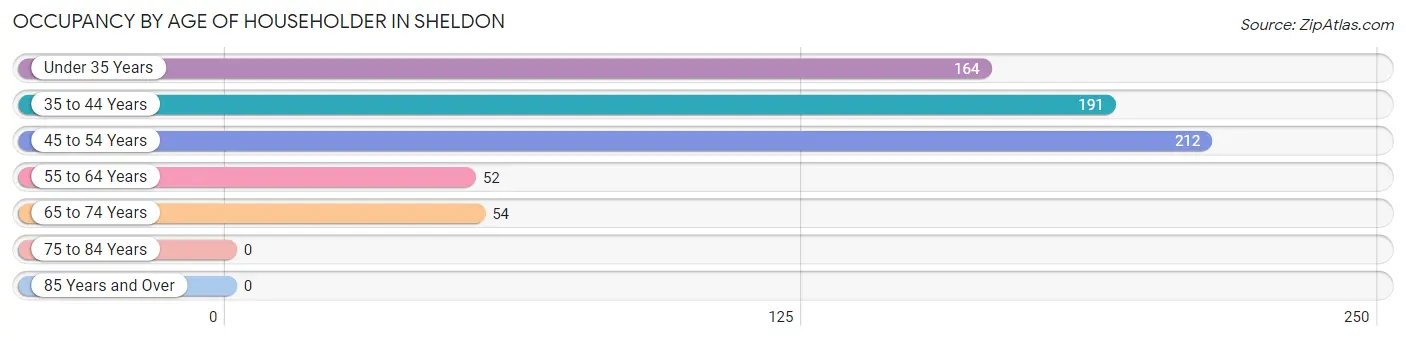
| Age Bracket | # Households | % Households |
| Under 35 Years | 164 | 24.4% |
| 35 to 44 Years | 191 | 28.4% |
| 45 to 54 Years | 212 | 31.5% |
| 55 to 64 Years | 52 | 7.7% |
| 65 to 74 Years | 54 | 8.0% |
| 75 to 84 Years | 0 | 0.0% |
| 85 Years and Over | 0 | 0.0% |
| Total | 673 | 100.0% |
Housing Finances in Sheldon
Median Income by Occupancy in Sheldon
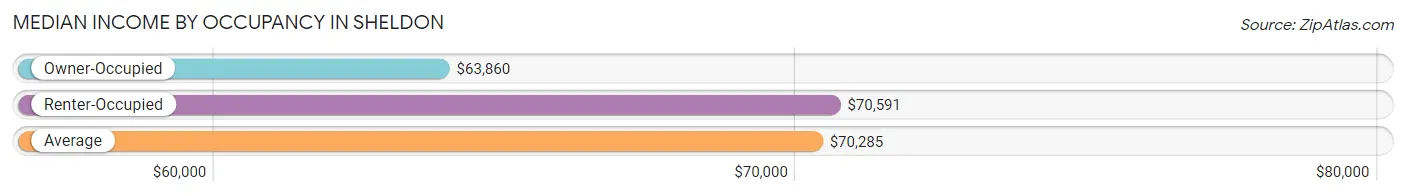
| Occupancy Type | # Households | Median Income |
| Owner-Occupied | 401 (59.6%) | $63,860 |
| Renter-Occupied | 272 (40.4%) | $70,591 |
| Average | 673 (100.0%) | $70,285 |
Occupancy by Householder Income Bracket in Sheldon
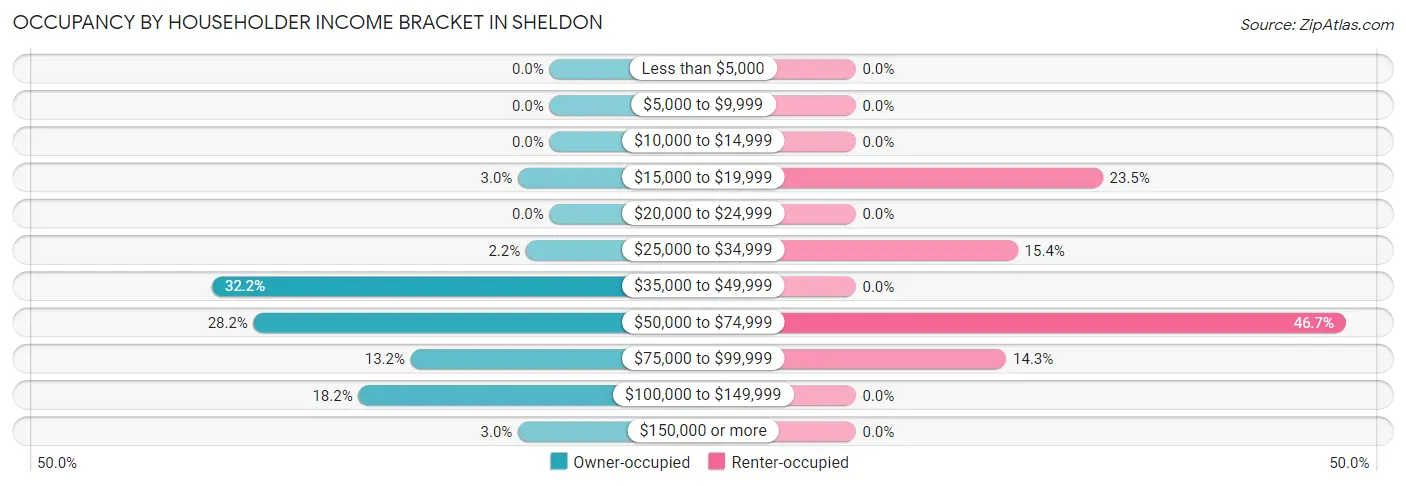
| Income Bracket | Owner-occupied | Renter-occupied |
| Less than $5,000 | 0 (0.0%) | 0 (0.0%) |
| $5,000 to $9,999 | 0 (0.0%) | 0 (0.0%) |
| $10,000 to $14,999 | 0 (0.0%) | 0 (0.0%) |
| $15,000 to $19,999 | 12 (3.0%) | 64 (23.5%) |
| $20,000 to $24,999 | 0 (0.0%) | 0 (0.0%) |
| $25,000 to $34,999 | 9 (2.2%) | 42 (15.4%) |
| $35,000 to $49,999 | 129 (32.2%) | 0 (0.0%) |
| $50,000 to $74,999 | 113 (28.2%) | 127 (46.7%) |
| $75,000 to $99,999 | 53 (13.2%) | 39 (14.3%) |
| $100,000 to $149,999 | 73 (18.2%) | 0 (0.0%) |
| $150,000 or more | 12 (3.0%) | 0 (0.0%) |
| Total | 401 (100.0%) | 272 (100.0%) |
Monthly Housing Cost Tiers in Sheldon
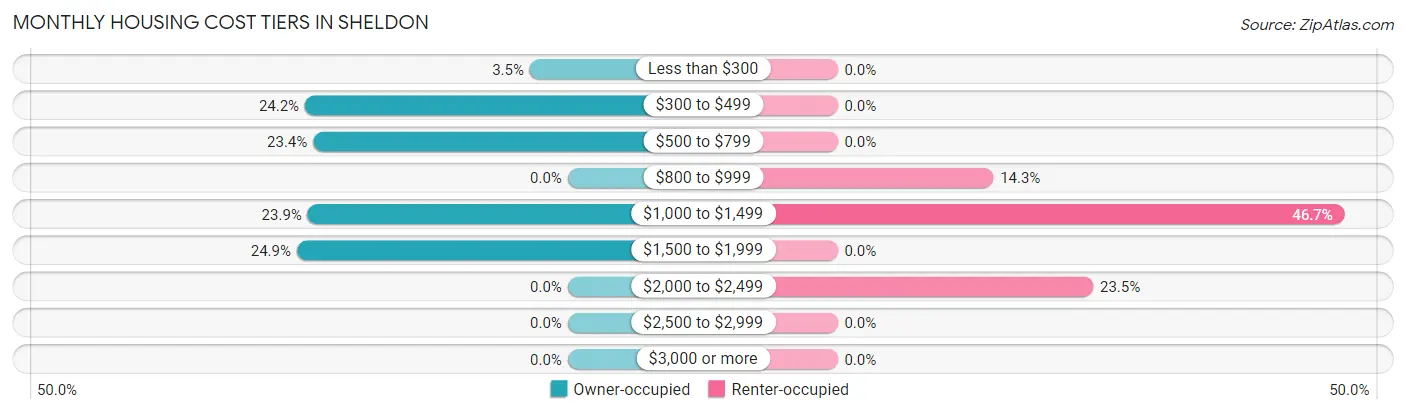
| Monthly Cost | Owner-occupied | Renter-occupied |
| Less than $300 | 14 (3.5%) | 0 (0.0%) |
| $300 to $499 | 97 (24.2%) | 0 (0.0%) |
| $500 to $799 | 94 (23.4%) | 0 (0.0%) |
| $800 to $999 | 0 (0.0%) | 39 (14.3%) |
| $1,000 to $1,499 | 96 (23.9%) | 127 (46.7%) |
| $1,500 to $1,999 | 100 (24.9%) | 0 (0.0%) |
| $2,000 to $2,499 | 0 (0.0%) | 64 (23.5%) |
| $2,500 to $2,999 | 0 (0.0%) | 0 (0.0%) |
| $3,000 or more | 0 (0.0%) | 0 (0.0%) |
| Total | 401 (100.0%) | 272 (100.0%) |
Physical Housing Characteristics in Sheldon
Housing Structures in Sheldon
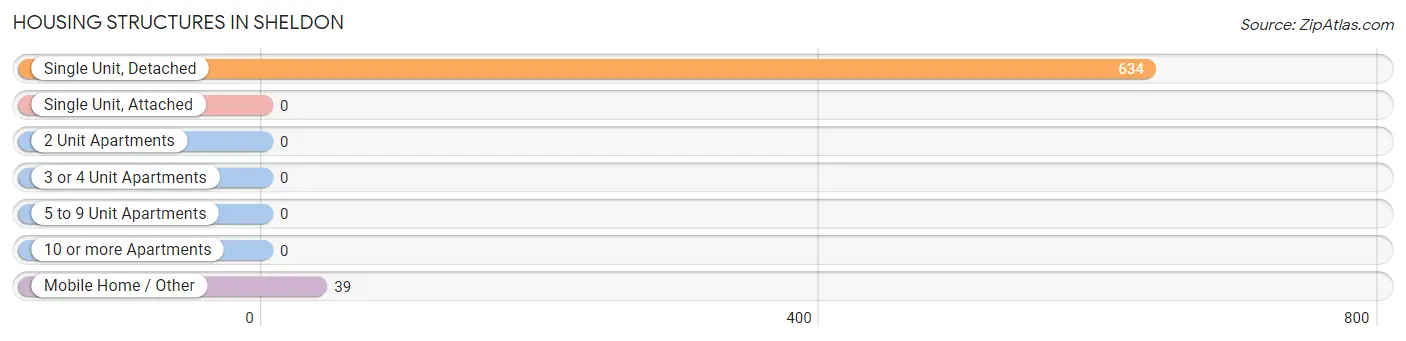
| Structure Type | # Housing Units | % Housing Units |
| Single Unit, Detached | 634 | 94.2% |
| Single Unit, Attached | 0 | 0.0% |
| 2 Unit Apartments | 0 | 0.0% |
| 3 or 4 Unit Apartments | 0 | 0.0% |
| 5 to 9 Unit Apartments | 0 | 0.0% |
| 10 or more Apartments | 0 | 0.0% |
| Mobile Home / Other | 39 | 5.8% |
| Total | 673 | 100.0% |
Housing Structures by Occupancy in Sheldon
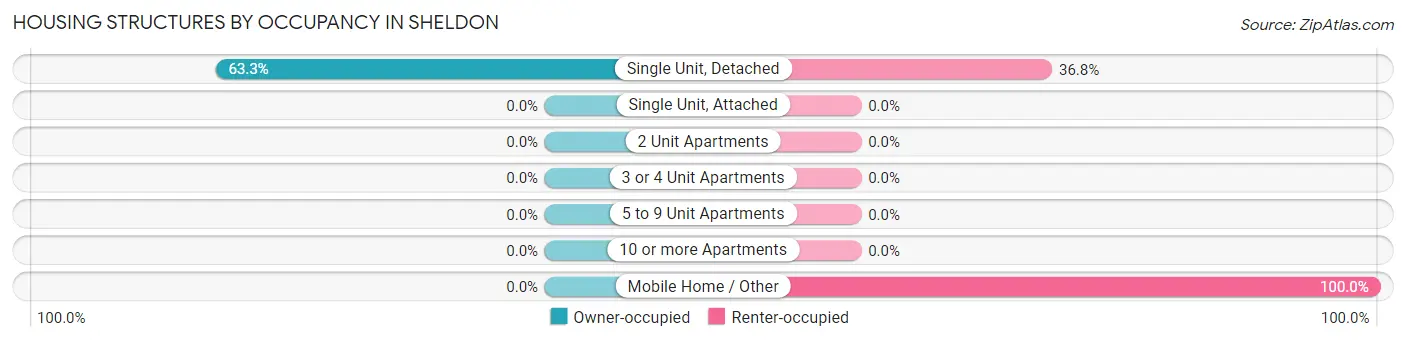
| Structure Type | Owner-occupied | Renter-occupied |
| Single Unit, Detached | 401 (63.2%) | 233 (36.7%) |
| Single Unit, Attached | 0 (0.0%) | 0 (0.0%) |
| 2 Unit Apartments | 0 (0.0%) | 0 (0.0%) |
| 3 or 4 Unit Apartments | 0 (0.0%) | 0 (0.0%) |
| 5 to 9 Unit Apartments | 0 (0.0%) | 0 (0.0%) |
| 10 or more Apartments | 0 (0.0%) | 0 (0.0%) |
| Mobile Home / Other | 0 (0.0%) | 39 (100.0%) |
| Total | 401 (59.6%) | 272 (40.4%) |
Housing Structures by Number of Rooms in Sheldon
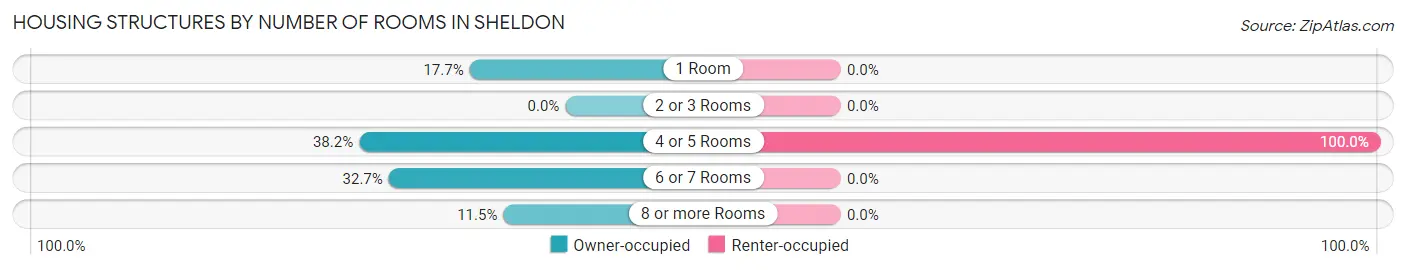
| Number of Rooms | Owner-occupied | Renter-occupied |
| 1 Room | 71 (17.7%) | 0 (0.0%) |
| 2 or 3 Rooms | 0 (0.0%) | 0 (0.0%) |
| 4 or 5 Rooms | 153 (38.2%) | 272 (100.0%) |
| 6 or 7 Rooms | 131 (32.7%) | 0 (0.0%) |
| 8 or more Rooms | 46 (11.5%) | 0 (0.0%) |
| Total | 401 (100.0%) | 272 (100.0%) |
Housing Structure by Heating Type in Sheldon
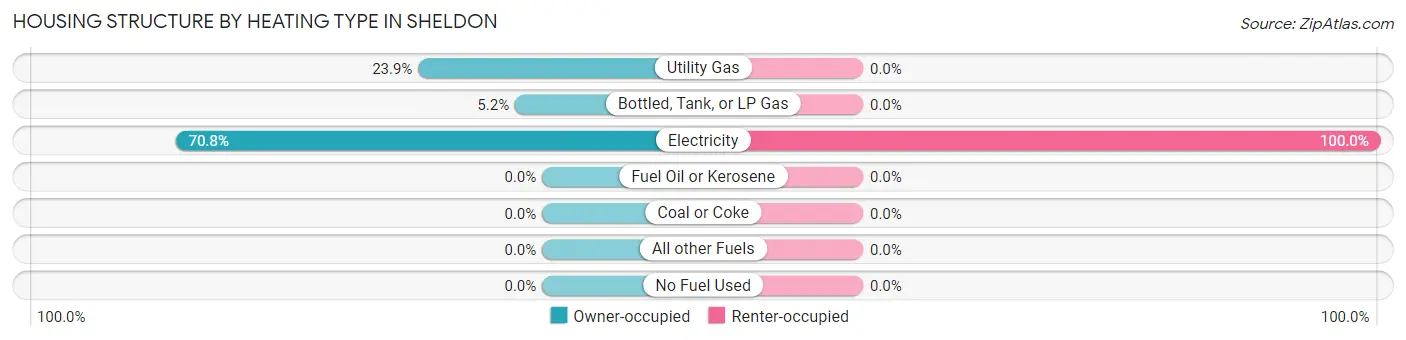
| Heating Type | Owner-occupied | Renter-occupied |
| Utility Gas | 96 (23.9%) | 0 (0.0%) |
| Bottled, Tank, or LP Gas | 21 (5.2%) | 0 (0.0%) |
| Electricity | 284 (70.8%) | 272 (100.0%) |
| Fuel Oil or Kerosene | 0 (0.0%) | 0 (0.0%) |
| Coal or Coke | 0 (0.0%) | 0 (0.0%) |
| All other Fuels | 0 (0.0%) | 0 (0.0%) |
| No Fuel Used | 0 (0.0%) | 0 (0.0%) |
| Total | 401 (100.0%) | 272 (100.0%) |
Household Vehicle Usage in Sheldon
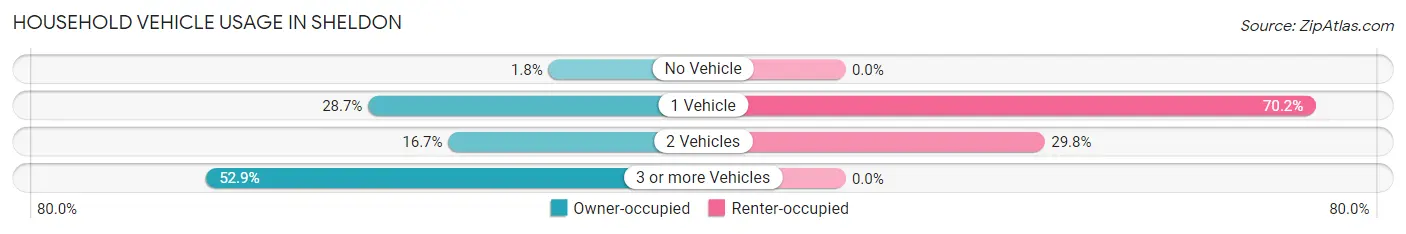
| Vehicles per Household | Owner-occupied | Renter-occupied |
| No Vehicle | 7 (1.8%) | 0 (0.0%) |
| 1 Vehicle | 115 (28.7%) | 191 (70.2%) |
| 2 Vehicles | 67 (16.7%) | 81 (29.8%) |
| 3 or more Vehicles | 212 (52.9%) | 0 (0.0%) |
| Total | 401 (100.0%) | 272 (100.0%) |
Real Estate & Mortgages in Sheldon
Real Estate and Mortgage Overview in Sheldon
| Characteristic | Without Mortgage | With Mortgage |
| Housing Units | 167 | 234 |
| Median Property Value | - | - |
| Median Household Income | - | - |
| Monthly Housing Costs | $342 | $0 |
| Real Estate Taxes | - | - |
Property Value by Mortgage Status in Sheldon
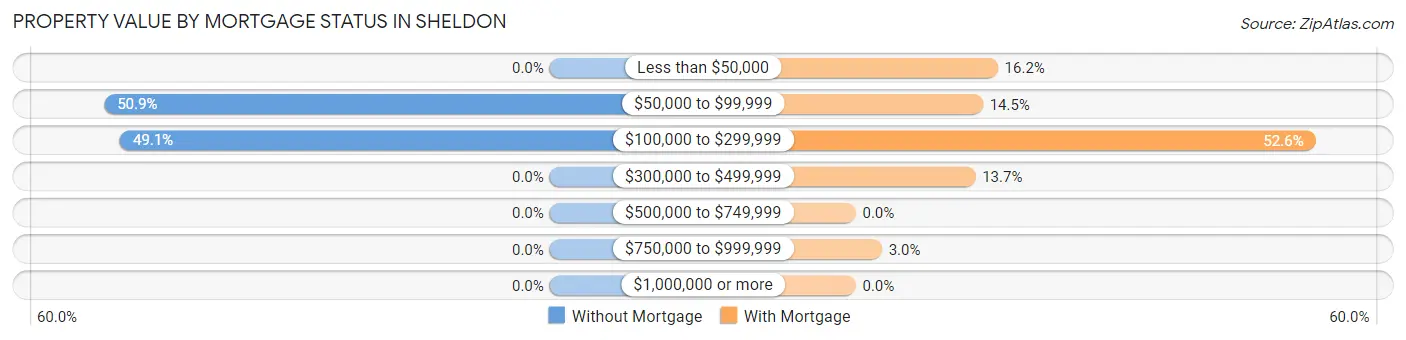
| Property Value | Without Mortgage | With Mortgage |
| Less than $50,000 | 0 (0.0%) | 38 (16.2%) |
| $50,000 to $99,999 | 85 (50.9%) | 34 (14.5%) |
| $100,000 to $299,999 | 82 (49.1%) | 123 (52.6%) |
| $300,000 to $499,999 | 0 (0.0%) | 32 (13.7%) |
| $500,000 to $749,999 | 0 (0.0%) | 0 (0.0%) |
| $750,000 to $999,999 | 0 (0.0%) | 7 (3.0%) |
| $1,000,000 or more | 0 (0.0%) | 0 (0.0%) |
| Total | 167 (100.0%) | 234 (100.0%) |
Household Income by Mortgage Status in Sheldon
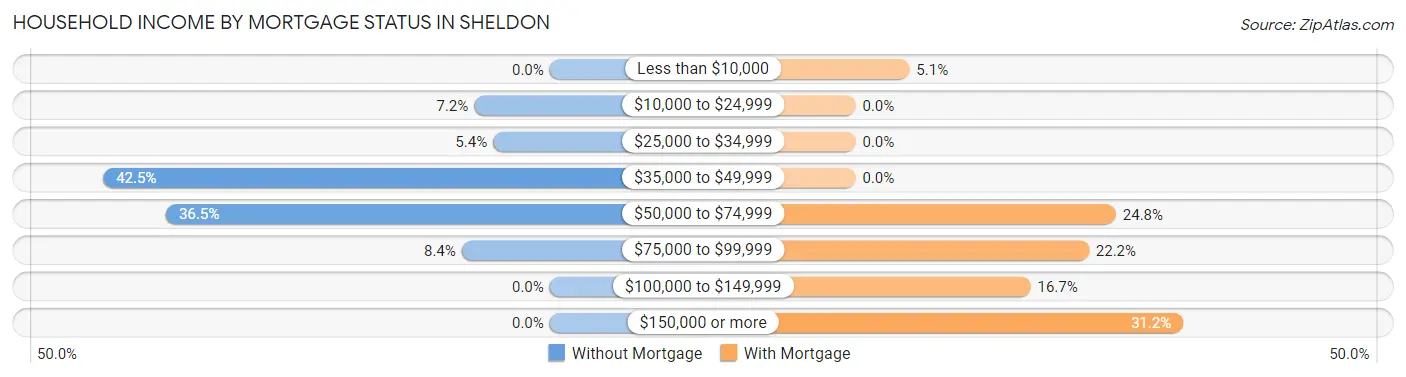
| Household Income | Without Mortgage | With Mortgage |
| Less than $10,000 | 0 (0.0%) | 12 (5.1%) |
| $10,000 to $24,999 | 12 (7.2%) | 0 (0.0%) |
| $25,000 to $34,999 | 9 (5.4%) | 0 (0.0%) |
| $35,000 to $49,999 | 71 (42.5%) | 0 (0.0%) |
| $50,000 to $74,999 | 61 (36.5%) | 58 (24.8%) |
| $75,000 to $99,999 | 14 (8.4%) | 52 (22.2%) |
| $100,000 to $149,999 | 0 (0.0%) | 39 (16.7%) |
| $150,000 or more | 0 (0.0%) | 73 (31.2%) |
| Total | 167 (100.0%) | 234 (100.0%) |
Property Value to Household Income Ratio in Sheldon
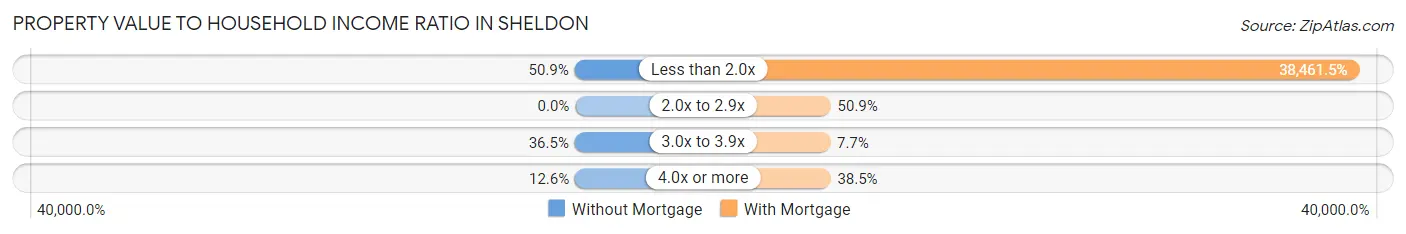
| Value-to-Income Ratio | Without Mortgage | With Mortgage |
| Less than 2.0x | 85 (50.9%) | 90,000 (38,461.5%) |
| 2.0x to 2.9x | 0 (0.0%) | 119 (50.8%) |
| 3.0x to 3.9x | 61 (36.5%) | 18 (7.7%) |
| 4.0x or more | 21 (12.6%) | 90 (38.5%) |
| Total | 167 (100.0%) | 234 (100.0%) |
Real Estate Taxes by Mortgage Status in Sheldon
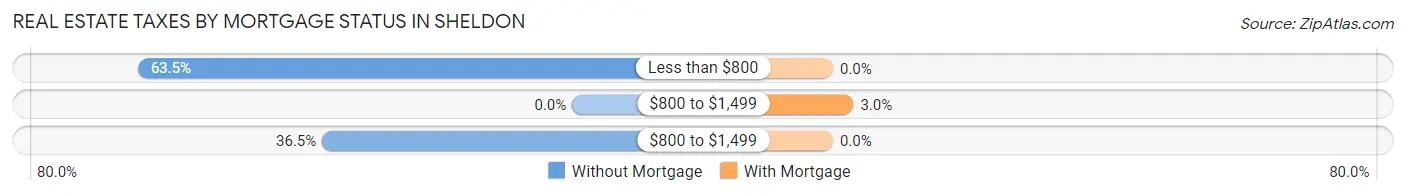
| Property Taxes | Without Mortgage | With Mortgage |
| Less than $800 | 106 (63.5%) | 0 (0.0%) |
| $800 to $1,499 | 0 (0.0%) | 7 (3.0%) |
| $800 to $1,499 | 61 (36.5%) | 0 (0.0%) |
| Total | 167 (100.0%) | 234 (100.0%) |
Health & Disability in Sheldon
Health Insurance Coverage by Age in Sheldon
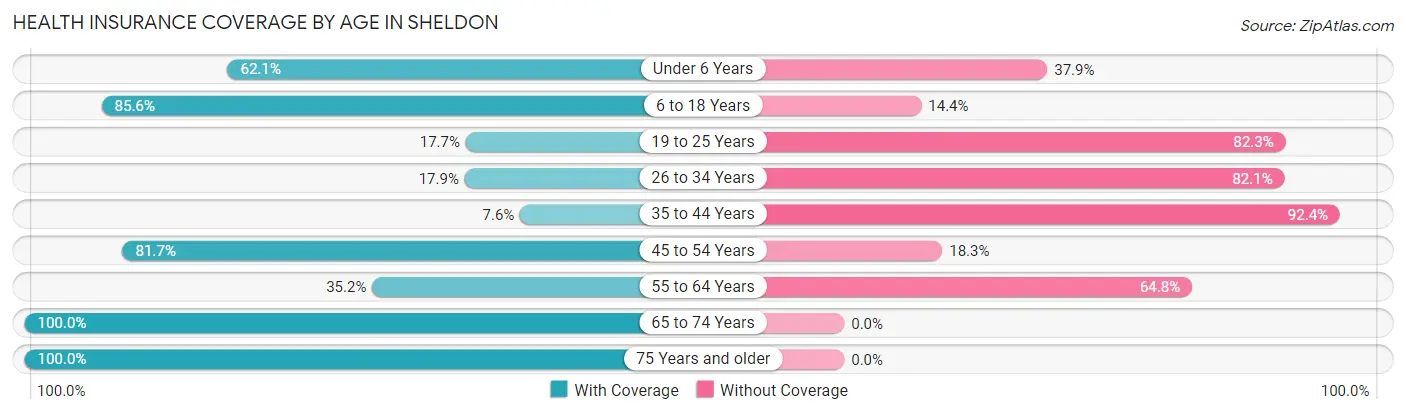
| Age Bracket | With Coverage | Without Coverage |
| Under 6 Years | 128 (62.1%) | 78 (37.9%) |
| 6 to 18 Years | 590 (85.6%) | 99 (14.4%) |
| 19 to 25 Years | 45 (17.7%) | 209 (82.3%) |
| 26 to 34 Years | 76 (17.9%) | 348 (82.1%) |
| 35 to 44 Years | 17 (7.6%) | 207 (92.4%) |
| 45 to 54 Years | 313 (81.7%) | 70 (18.3%) |
| 55 to 64 Years | 51 (35.2%) | 94 (64.8%) |
| 65 to 74 Years | 77 (100.0%) | 0 (0.0%) |
| 75 Years and older | 8 (100.0%) | 0 (0.0%) |
| Total | 1,305 (54.1%) | 1,105 (45.9%) |
Health Insurance Coverage by Citizenship Status in Sheldon
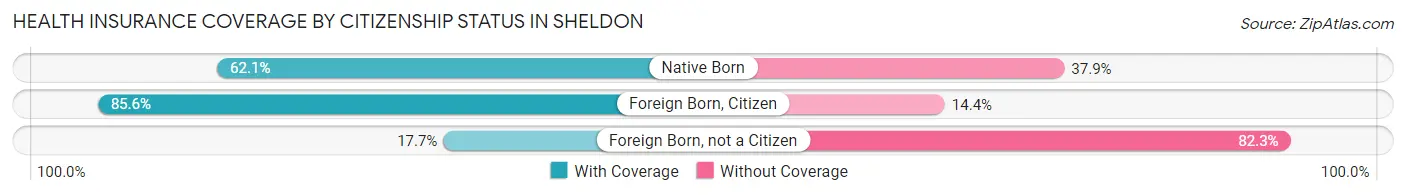
| Citizenship Status | With Coverage | Without Coverage |
| Native Born | 128 (62.1%) | 78 (37.9%) |
| Foreign Born, Citizen | 590 (85.6%) | 99 (14.4%) |
| Foreign Born, not a Citizen | 45 (17.7%) | 209 (82.3%) |
Health Insurance Coverage by Household Income in Sheldon
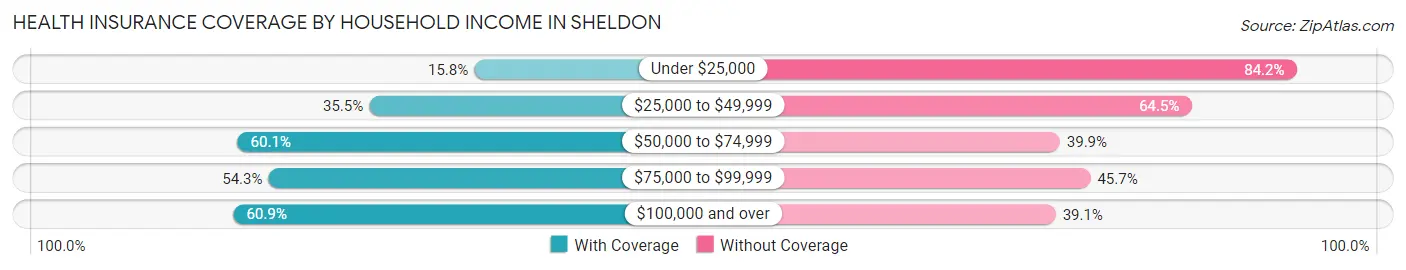
| Household Income | With Coverage | Without Coverage |
| Under $25,000 | 12 (15.8%) | 64 (84.2%) |
| $25,000 to $49,999 | 133 (35.5%) | 242 (64.5%) |
| $50,000 to $74,999 | 745 (60.1%) | 495 (39.9%) |
| $75,000 to $99,999 | 188 (54.3%) | 158 (45.7%) |
| $100,000 and over | 227 (60.9%) | 146 (39.1%) |
Public vs Private Health Insurance Coverage by Age in Sheldon

| Age Bracket | Public Insurance | Private Insurance |
| Under 6 | 128 (62.1%) | 0 (0.0%) |
| 6 to 18 Years | 512 (74.3%) | 78 (11.3%) |
| 19 to 25 Years | 0 (0.0%) | 45 (17.7%) |
| 25 to 34 Years | 76 (17.9%) | 32 (7.5%) |
| 35 to 44 Years | 0 (0.0%) | 17 (7.6%) |
| 45 to 54 Years | 42 (11.0%) | 271 (70.8%) |
| 55 to 64 Years | 0 (0.0%) | 51 (35.2%) |
| 65 to 74 Years | 69 (89.6%) | 20 (26.0%) |
| 75 Years and over | 8 (100.0%) | 0 (0.0%) |
| Total | 835 (34.6%) | 514 (21.3%) |
Disability Status by Sex by Age in Sheldon
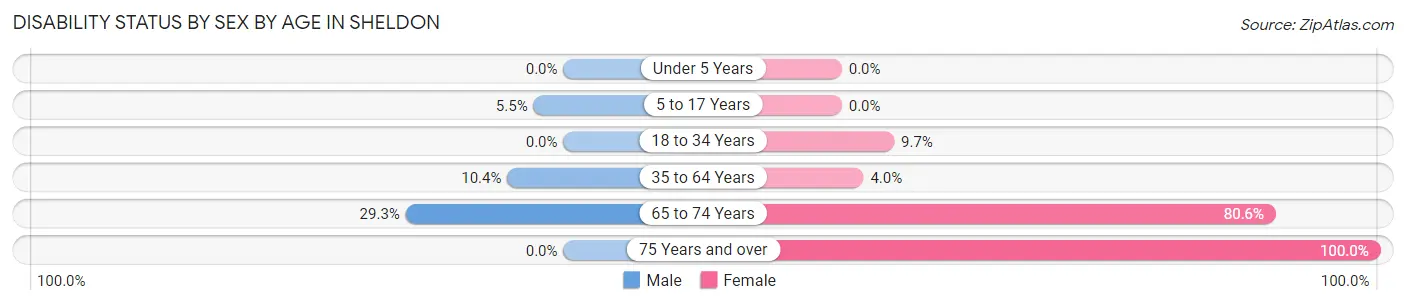
| Age Bracket | Male | Female |
| Under 5 Years | 0 (0.0%) | 0 (0.0%) |
| 5 to 17 Years | 16 (5.5%) | 0 (0.0%) |
| 18 to 34 Years | 0 (0.0%) | 44 (9.7%) |
| 35 to 64 Years | 42 (10.4%) | 14 (4.0%) |
| 65 to 74 Years | 12 (29.3%) | 29 (80.6%) |
| 75 Years and over | 0 (0.0%) | 8 (100.0%) |
Disability Class by Sex by Age in Sheldon
Disability Class: Hearing Difficulty
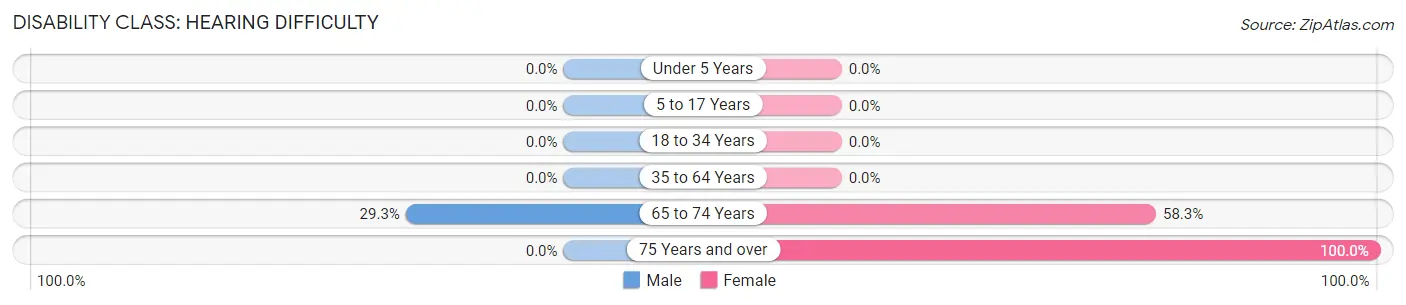
| Age Bracket | Male | Female |
| Under 5 Years | 0 (0.0%) | 0 (0.0%) |
| 5 to 17 Years | 0 (0.0%) | 0 (0.0%) |
| 18 to 34 Years | 0 (0.0%) | 0 (0.0%) |
| 35 to 64 Years | 0 (0.0%) | 0 (0.0%) |
| 65 to 74 Years | 12 (29.3%) | 21 (58.3%) |
| 75 Years and over | 0 (0.0%) | 8 (100.0%) |
Disability Class: Vision Difficulty
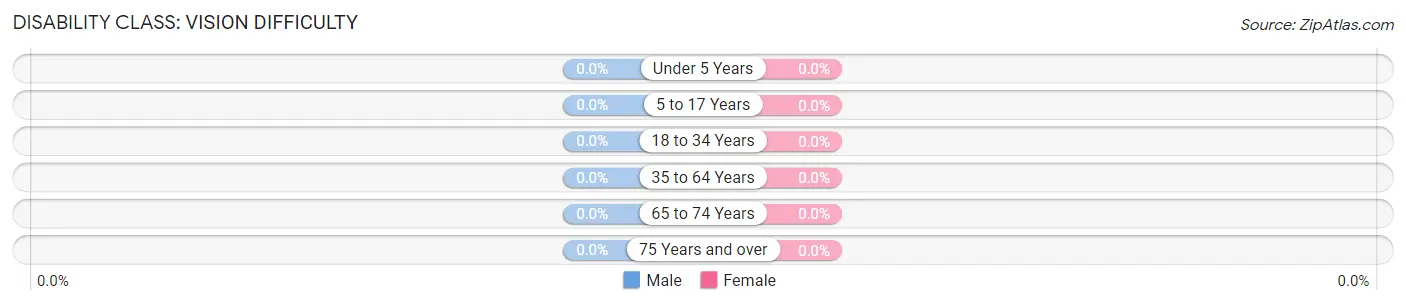
| Age Bracket | Male | Female |
| Under 5 Years | 0 (0.0%) | 0 (0.0%) |
| 5 to 17 Years | 0 (0.0%) | 0 (0.0%) |
| 18 to 34 Years | 0 (0.0%) | 0 (0.0%) |
| 35 to 64 Years | 0 (0.0%) | 0 (0.0%) |
| 65 to 74 Years | 0 (0.0%) | 0 (0.0%) |
| 75 Years and over | 0 (0.0%) | 0 (0.0%) |
Disability Class: Cognitive Difficulty
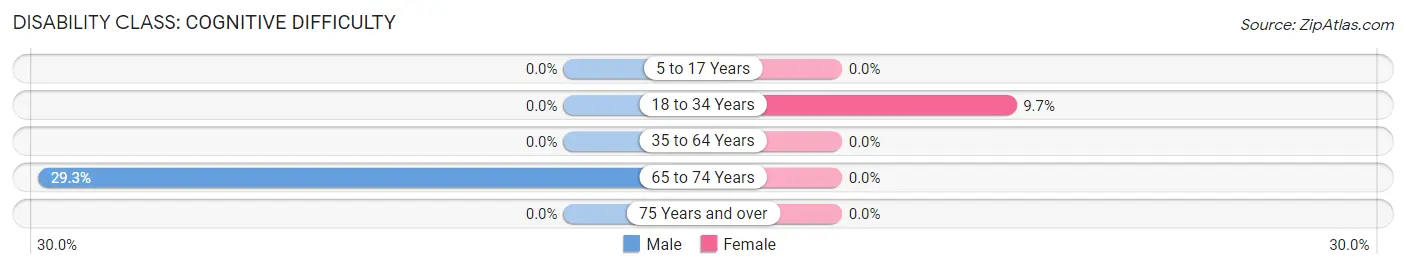
| Age Bracket | Male | Female |
| 5 to 17 Years | 0 (0.0%) | 0 (0.0%) |
| 18 to 34 Years | 0 (0.0%) | 44 (9.7%) |
| 35 to 64 Years | 0 (0.0%) | 0 (0.0%) |
| 65 to 74 Years | 12 (29.3%) | 0 (0.0%) |
| 75 Years and over | 0 (0.0%) | 0 (0.0%) |
Disability Class: Ambulatory Difficulty
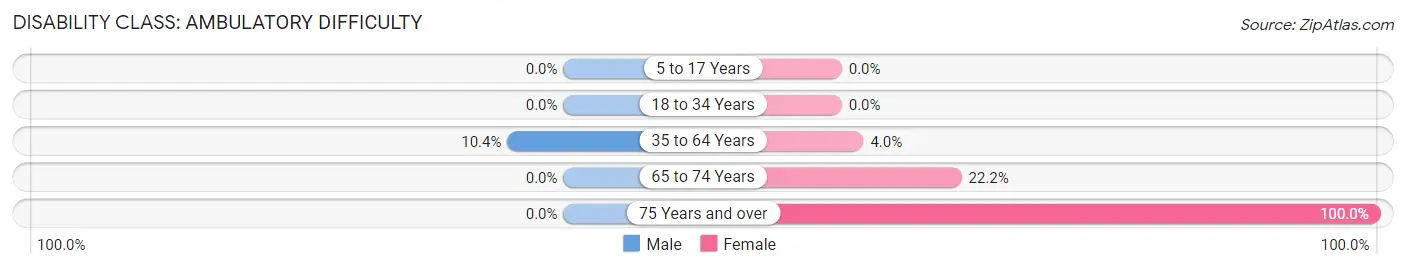
| Age Bracket | Male | Female |
| 5 to 17 Years | 0 (0.0%) | 0 (0.0%) |
| 18 to 34 Years | 0 (0.0%) | 0 (0.0%) |
| 35 to 64 Years | 42 (10.4%) | 14 (4.0%) |
| 65 to 74 Years | 0 (0.0%) | 8 (22.2%) |
| 75 Years and over | 0 (0.0%) | 8 (100.0%) |
Disability Class: Self-Care Difficulty
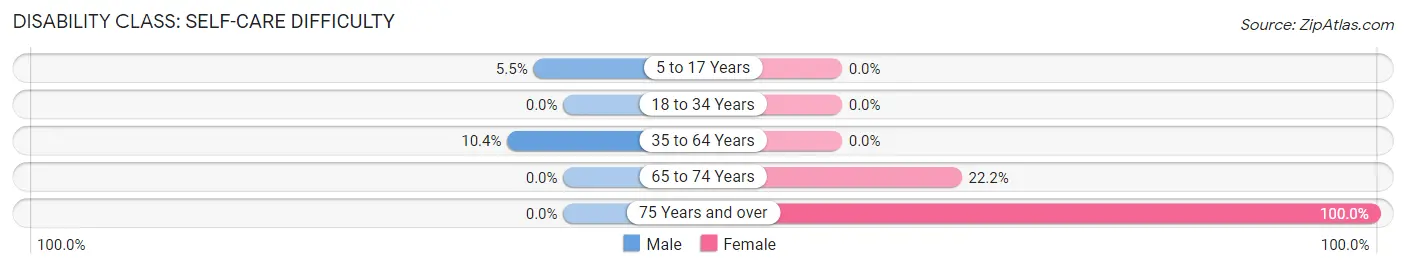
| Age Bracket | Male | Female |
| 5 to 17 Years | 16 (5.5%) | 0 (0.0%) |
| 18 to 34 Years | 0 (0.0%) | 0 (0.0%) |
| 35 to 64 Years | 42 (10.4%) | 0 (0.0%) |
| 65 to 74 Years | 0 (0.0%) | 8 (22.2%) |
| 75 Years and over | 0 (0.0%) | 8 (100.0%) |
Technology Access in Sheldon
Computing Device Access in Sheldon
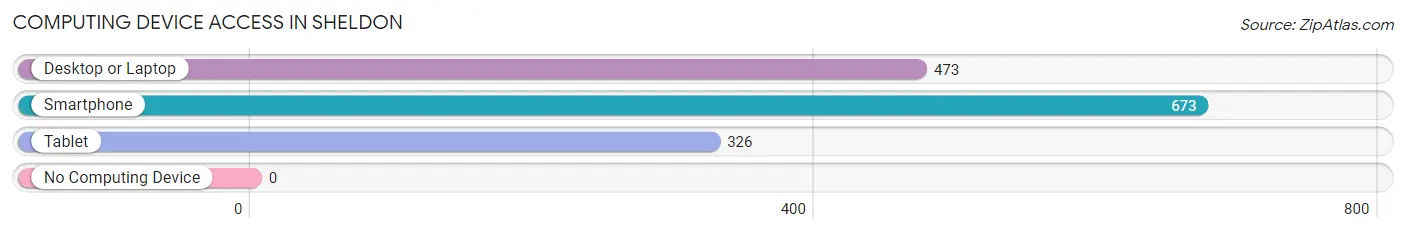
| Device Type | # Households | % Households |
| Desktop or Laptop | 473 | 70.3% |
| Smartphone | 673 | 100.0% |
| Tablet | 326 | 48.4% |
| No Computing Device | 0 | 0.0% |
| Total | 673 | 100.0% |
Internet Access in Sheldon
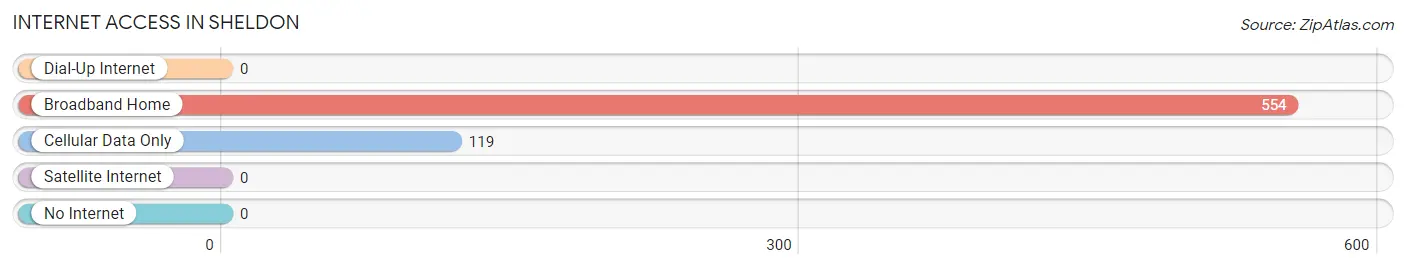
| Internet Type | # Households | % Households |
| Dial-Up Internet | 0 | 0.0% |
| Broadband Home | 554 | 82.3% |
| Cellular Data Only | 119 | 17.7% |
| Satellite Internet | 0 | 0.0% |
| No Internet | 0 | 0.0% |
| Total | 673 | 100.0% |
Sheldon Summary
Sheldon, Texas is a small town located in the eastern part of Harris County, Texas. It is situated about 20 miles northeast of downtown Houston and is part of the Houston–The Woodlands–Sugar Land metropolitan area. The town was founded in 1873 and has a population of approximately 5,000 people.
History
The area that is now Sheldon was originally inhabited by the Atakapan Indians. The first settlers in the area were German immigrants who arrived in the late 1840s. The town was named after the first postmaster, William Sheldon, who was appointed in 1873.
In the early 1900s, Sheldon was a thriving agricultural community. Cotton, corn, and sugar cane were the main crops grown in the area. The town also had a sawmill, a gristmill, and a cotton gin.
In the 1950s, Sheldon began to experience rapid growth due to the development of the Houston Ship Channel and the construction of the Houston Intercontinental Airport. This growth led to the construction of new homes and businesses in the area.
Geography
Sheldon is located in the eastern part of Harris County, Texas. It is situated about 20 miles northeast of downtown Houston and is part of the Houston–The Woodlands–Sugar Land metropolitan area. The town is bordered by the San Jacinto River to the east and the Houston Ship Channel to the west.
The town has a total area of 4.2 square miles, all of which is land. The terrain is mostly flat with some rolling hills. The climate is humid subtropical with hot summers and mild winters.
Economy
The economy of Sheldon is largely based on the oil and gas industry. The town is home to several oil and gas companies, including Shell Oil Company, Chevron Corporation, and ExxonMobil.
The town also has a thriving agricultural sector. Cotton, corn, and sugar cane are the main crops grown in the area. The town also has a sawmill, a gristmill, and a cotton gin.
In addition, Sheldon has a growing retail sector. The town is home to several restaurants, shops, and other businesses.
Demographics
As of the 2010 census, Sheldon had a population of 5,000 people. The racial makeup of the town was 75.3% White, 11.2% African American, 0.7% Native American, 0.7% Asian, 0.2% Pacific Islander, 9.7% from other races, and 2.1% from two or more races. Hispanic or Latino of any race were 18.2% of the population.
The median household income in Sheldon was $45,000, and the median family income was $50,000. The per capita income was $20,000. About 11.2% of families and 13.2% of the population were below the poverty line.
Sheldon is served by the Sheldon Independent School District. The town is also home to several churches, including the First Baptist Church of Sheldon, the Church of Christ of Sheldon, and the Sheldon United Methodist Church.
Common Questions
What is Per Capita Income in Sheldon?
Per Capita income in Sheldon is $18,824.
What is the Median Family Income in Sheldon?
Median Family Income in Sheldon is $54,464.
What is the Median Household income in Sheldon?
Median Household Income in Sheldon is $70,285.
What is Inequality or Gini Index in Sheldon?
Inequality or Gini Index in Sheldon is 0.27.
What is the Total Population of Sheldon?
Total Population of Sheldon is 2,410.
What is the Total Male Population of Sheldon?
Total Male Population of Sheldon is 1,094.
What is the Total Female Population of Sheldon?
Total Female Population of Sheldon is 1,316.
What is the Ratio of Males per 100 Females in Sheldon?
There are 83.13 Males per 100 Females in Sheldon.
What is the Ratio of Females per 100 Males in Sheldon?
There are 120.29 Females per 100 Males in Sheldon.
What is the Median Population Age in Sheldon?
Median Population Age in Sheldon is 26.4 Years.
What is the Average Family Size in Sheldon
Average Family Size in Sheldon is 4.1 People.
What is the Average Household Size in Sheldon
Average Household Size in Sheldon is 3.6 People.
How Large is the Labor Force in Sheldon?
There are 1,162 People in the Labor Forcein in Sheldon.
What is the Percentage of People in the Labor Force in Sheldon?
72.7% of People are in the Labor Force in Sheldon.
What is the Unemployment Rate in Sheldon?
Unemployment Rate in Sheldon is 3.9%.