Premont, TX Map & Demographics
Premont Map
Premont Overview
$21,167
PER CAPITA INCOME
$47,119
AVG FAMILY INCOME
$46,245
AVG HOUSEHOLD INCOME
54.2%
WAGE / INCOME GAP [ % ]
45.8¢/ $1
WAGE / INCOME GAP [ $ ]
$2,988
FAMILY INCOME DEFICIT
0.30
INEQUALITY / GINI INDEX
2,810
TOTAL POPULATION
1,629
MALE POPULATION
1,181
FEMALE POPULATION
137.93
MALES / 100 FEMALES
72.50
FEMALES / 100 MALES
27.1
MEDIAN AGE
3.0
AVG FAMILY SIZE
2.6
AVG HOUSEHOLD SIZE
1,362
LABOR FORCE [ PEOPLE ]
58.6%
PERCENT IN LABOR FORCE
15.7%
UNEMPLOYMENT RATE
Premont Zip Codes
Premont Area Codes
Income in Premont
Income Overview in Premont
Per Capita Income in Premont is $21,167, while median incomes of families and households are $47,119 and $46,245 respectively.
| Characteristic | Number | Measure |
| Per Capita Income | 2,810 | $21,167 |
| Median Family Income | 806 | $47,119 |
| Mean Family Income | 806 | $56,612 |
| Median Household Income | 1,086 | $46,245 |
| Mean Household Income | 1,086 | $50,766 |
| Income Deficit | 806 | $2,988 |
| Wage / Income Gap (%) | 2,810 | 54.24% |
| Wage / Income Gap ($) | 2,810 | 45.76¢ per $1 |
| Gini / Inequality Index | 2,810 | 0.30 |
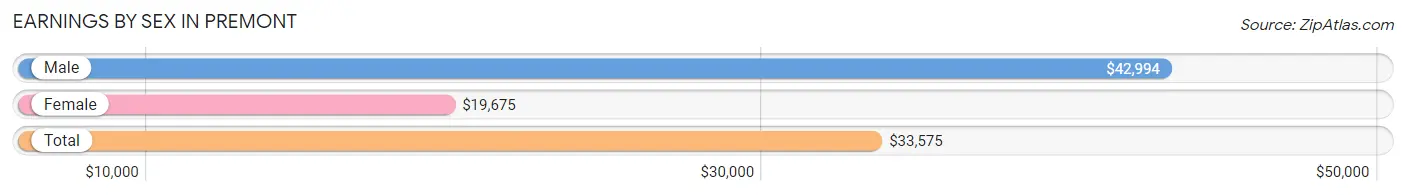
Earnings by Sex in Premont
Average Earnings in Premont are $33,575, $42,994 for men and $19,675 for women, a difference of 54.2%.
| Sex | Number | Average Earnings |
| Male | 790 (61.8%) | $42,994 |
| Female | 488 (38.2%) | $19,675 |
| Total | 1,278 (100.0%) | $33,575 |
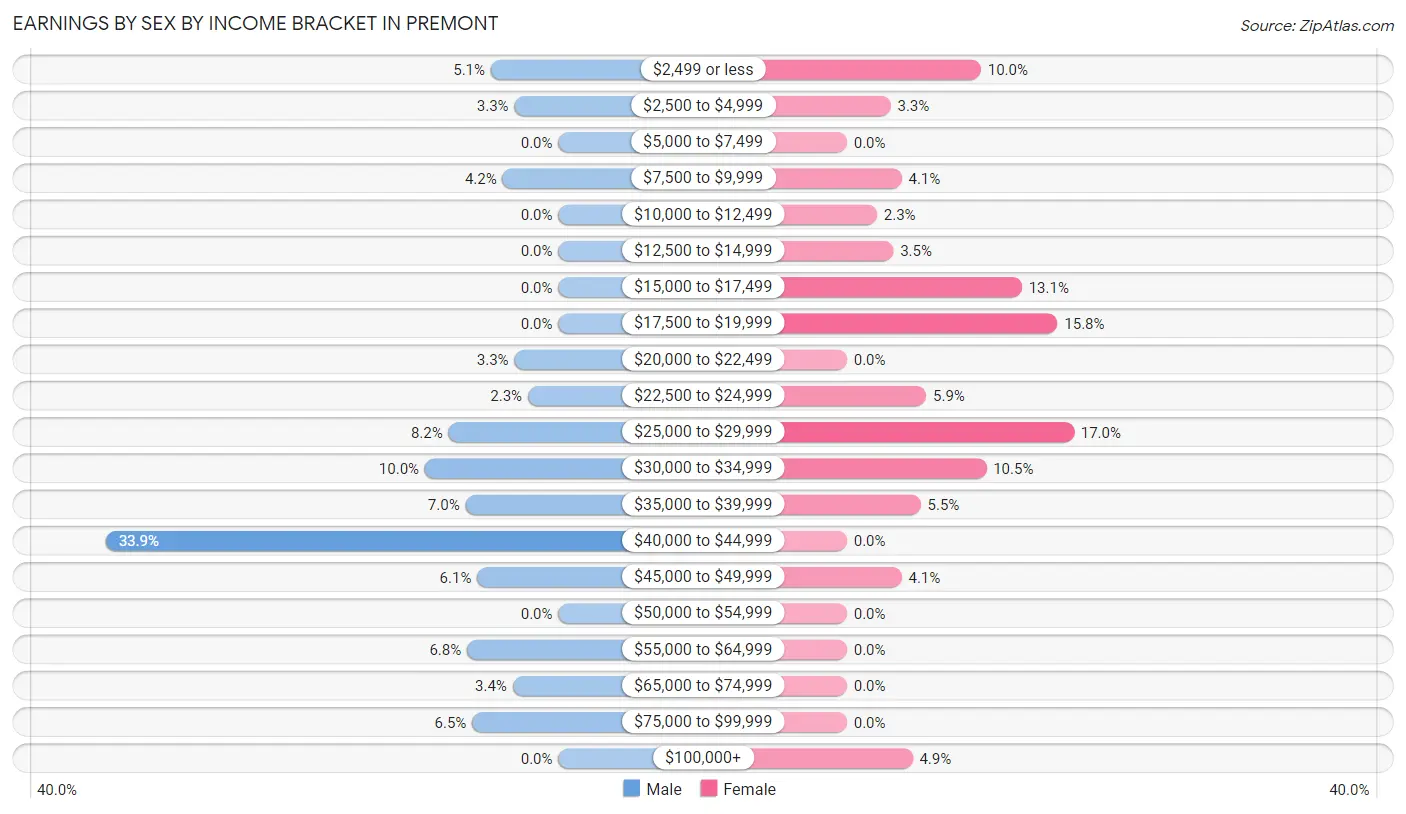
Earnings by Sex by Income Bracket in Premont
The most common earnings brackets in Premont are $40,000 to $44,999 for men (268 | 33.9%) and $25,000 to $29,999 for women (83 | 17.0%).
| Income | Male | Female |
| $2,499 or less | 40 (5.1%) | 49 (10.0%) |
| $2,500 to $4,999 | 26 (3.3%) | 16 (3.3%) |
| $5,000 to $7,499 | 0 (0.0%) | 0 (0.0%) |
| $7,500 to $9,999 | 33 (4.2%) | 20 (4.1%) |
| $10,000 to $12,499 | 0 (0.0%) | 11 (2.2%) |
| $12,500 to $14,999 | 0 (0.0%) | 17 (3.5%) |
| $15,000 to $17,499 | 0 (0.0%) | 64 (13.1%) |
| $17,500 to $19,999 | 0 (0.0%) | 77 (15.8%) |
| $20,000 to $22,499 | 26 (3.3%) | 0 (0.0%) |
| $22,500 to $24,999 | 18 (2.3%) | 29 (5.9%) |
| $25,000 to $29,999 | 65 (8.2%) | 83 (17.0%) |
| $30,000 to $34,999 | 79 (10.0%) | 51 (10.4%) |
| $35,000 to $39,999 | 55 (7.0%) | 27 (5.5%) |
| $40,000 to $44,999 | 268 (33.9%) | 0 (0.0%) |
| $45,000 to $49,999 | 48 (6.1%) | 20 (4.1%) |
| $50,000 to $54,999 | 0 (0.0%) | 0 (0.0%) |
| $55,000 to $64,999 | 54 (6.8%) | 0 (0.0%) |
| $65,000 to $74,999 | 27 (3.4%) | 0 (0.0%) |
| $75,000 to $99,999 | 51 (6.5%) | 0 (0.0%) |
| $100,000+ | 0 (0.0%) | 24 (4.9%) |
| Total | 790 (100.0%) | 488 (100.0%) |
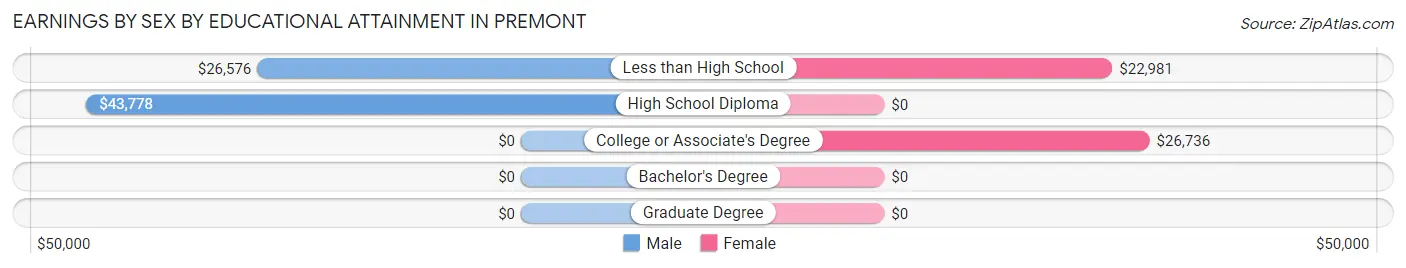
Earnings by Sex by Educational Attainment in Premont
Average earnings in Premont are $43,438 for men and $23,103 for women, a difference of 46.8%. Men with an educational attainment of high school diploma enjoy the highest average annual earnings of $43,778, while those with less than high school education earn the least with $26,576. Women with an educational attainment of college or associate's degree earn the most with the average annual earnings of $26,736, while those with less than high school education have the smallest earnings of $22,981.
| Educational Attainment | Male Income | Female Income |
| Less than High School | $26,576 | $22,981 |
| High School Diploma | $43,778 | $0 |
| College or Associate's Degree | - | - |
| Bachelor's Degree | - | - |
| Graduate Degree | - | - |
| Total | $43,438 | $23,103 |
Family Income in Premont
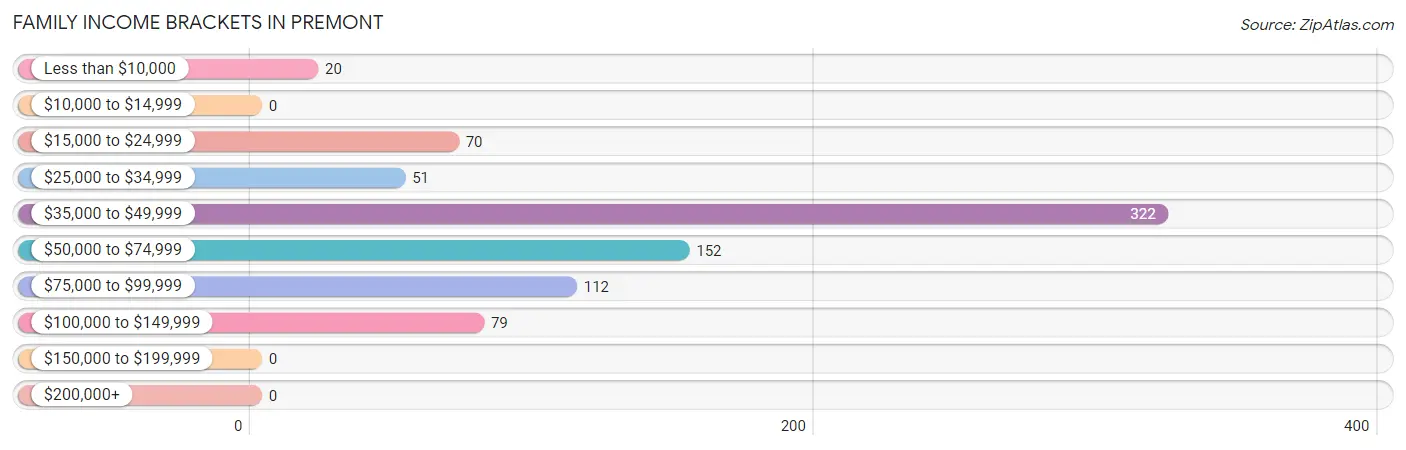
Family Income Brackets in Premont
According to the Premont family income data, there are 322 families falling into the $35,000 to $49,999 income range, which is the most common income bracket and makes up 40.0% of all families.
| Income Bracket | # Families | % Families |
| Less than $10,000 | 20 | 2.5% |
| $10,000 to $14,999 | 0 | 0.0% |
| $15,000 to $24,999 | 70 | 8.7% |
| $25,000 to $34,999 | 51 | 6.3% |
| $35,000 to $49,999 | 322 | 40.0% |
| $50,000 to $74,999 | 152 | 18.9% |
| $75,000 to $99,999 | 112 | 13.9% |
| $100,000 to $149,999 | 79 | 9.8% |
| $150,000 to $199,999 | 0 | 0.0% |
| $200,000+ | 0 | 0.0% |
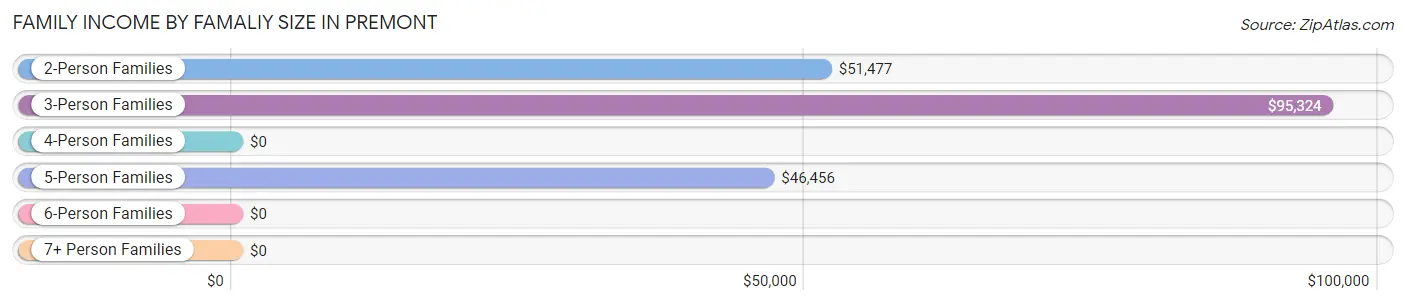
Family Income by Famaliy Size in Premont
3-person families (79 | 9.8%) account for the highest median family income in Premont with $95,324 per family, while 3-person families (79 | 9.8%) have the highest median income of $31,775 per family member.
| Income Bracket | # Families | Median Income |
| 2-Person Families | 295 (36.6%) | $51,477 |
| 3-Person Families | 79 (9.8%) | $95,324 |
| 4-Person Families | 72 (8.9%) | $0 |
| 5-Person Families | 290 (36.0%) | $46,456 |
| 6-Person Families | 20 (2.5%) | $0 |
| 7+ Person Families | 50 (6.2%) | $0 |
| Total | 806 (100.0%) | $47,119 |
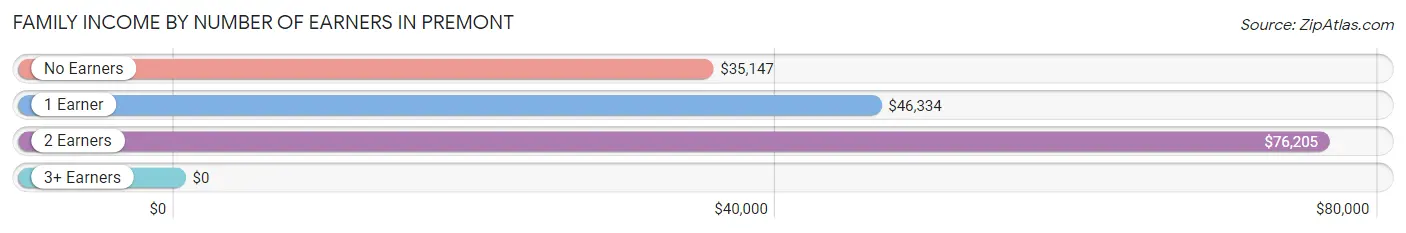
Family Income by Number of Earners in Premont
| Number of Earners | # Families | Median Income |
| No Earners | 68 (8.4%) | $35,147 |
| 1 Earner | 503 (62.4%) | $46,334 |
| 2 Earners | 185 (23.0%) | $76,205 |
| 3+ Earners | 50 (6.2%) | $0 |
| Total | 806 (100.0%) | $47,119 |
Household Income in Premont
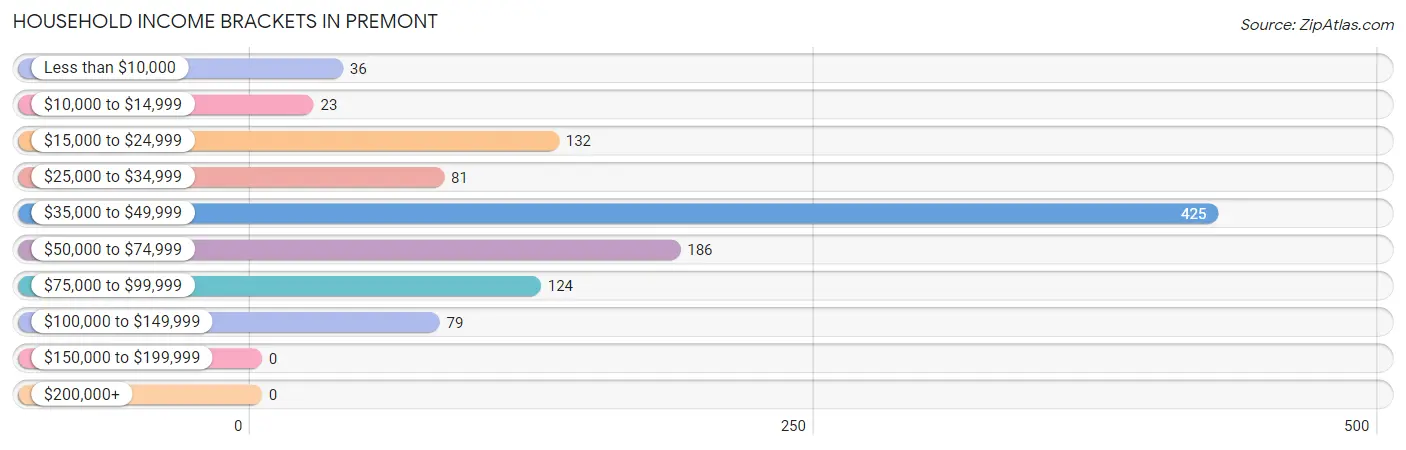
Household Income Brackets in Premont
With 425 households falling in the category, the $35,000 to $49,999 income range is the most frequent in Premont, accounting for 39.1% of all households.
| Income Bracket | # Households | % Households |
| Less than $10,000 | 36 | 3.3% |
| $10,000 to $14,999 | 23 | 2.1% |
| $15,000 to $24,999 | 132 | 12.2% |
| $25,000 to $34,999 | 81 | 7.5% |
| $35,000 to $49,999 | 425 | 39.1% |
| $50,000 to $74,999 | 186 | 17.1% |
| $75,000 to $99,999 | 124 | 11.4% |
| $100,000 to $149,999 | 79 | 7.3% |
| $150,000 to $199,999 | 0 | 0.0% |
| $200,000+ | 0 | 0.0% |
Household Income by Householder Age in Premont
The median household income in Premont is $46,245, with the highest median household income of $55,933 found in the 45 to 64 years age bracket for the primary householder. A total of 334 households (30.8%) fall into this category. Meanwhile, the 15 to 24 years age bracket for the primary householder has the lowest median household income of $0, with 55 households (5.1%) in this group.
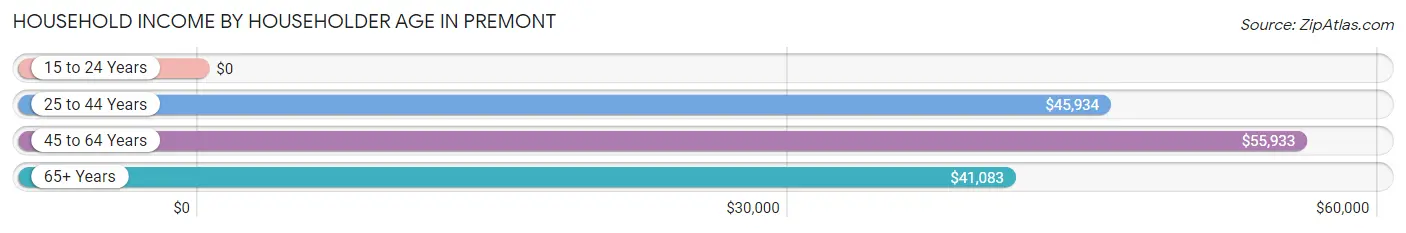
| Income Bracket | # Households | Median Income |
| 15 to 24 Years | 55 (5.1%) | $0 |
| 25 to 44 Years | 405 (37.3%) | $45,934 |
| 45 to 64 Years | 334 (30.8%) | $55,933 |
| 65+ Years | 292 (26.9%) | $41,083 |
| Total | 1,086 (100.0%) | $46,245 |
Poverty in Premont
Income Below Poverty by Sex and Age in Premont
With 8.8% poverty level for males and 16.9% for females among the residents of Premont, 12 to 14 year old males and 25 to 34 year old females are the most vulnerable to poverty, with 27 males (28.4%) and 92 females (66.2%) in their respective age groups living below the poverty level.
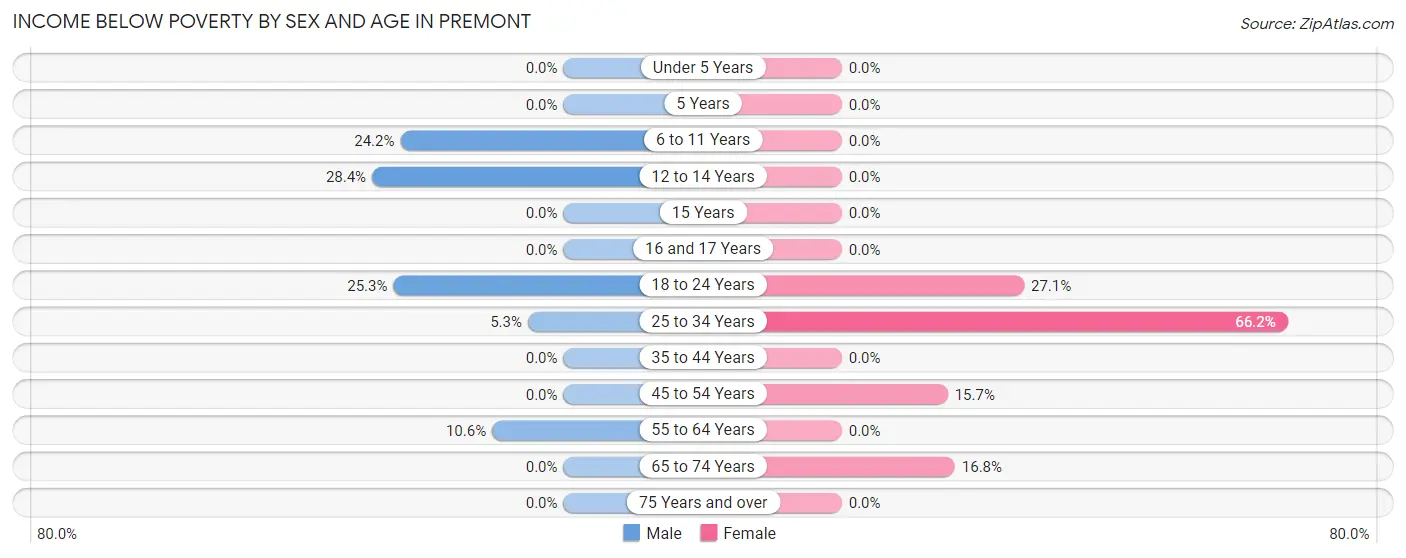
| Age Bracket | Male | Female |
| Under 5 Years | 0 (0.0%) | 0 (0.0%) |
| 5 Years | 0 (0.0%) | 0 (0.0%) |
| 6 to 11 Years | 23 (24.2%) | 0 (0.0%) |
| 12 to 14 Years | 27 (28.4%) | 0 (0.0%) |
| 15 Years | 0 (0.0%) | 0 (0.0%) |
| 16 and 17 Years | 0 (0.0%) | 0 (0.0%) |
| 18 to 24 Years | 50 (25.3%) | 69 (27.1%) |
| 25 to 34 Years | 26 (5.3%) | 92 (66.2%) |
| 35 to 44 Years | 0 (0.0%) | 0 (0.0%) |
| 45 to 54 Years | 0 (0.0%) | 14 (15.7%) |
| 55 to 64 Years | 16 (10.6%) | 0 (0.0%) |
| 65 to 74 Years | 0 (0.0%) | 23 (16.8%) |
| 75 Years and over | 0 (0.0%) | 0 (0.0%) |
| Total | 142 (8.8%) | 198 (16.9%) |
Income Above Poverty by Sex and Age in Premont
According to the poverty statistics in Premont, males aged under 5 years and females aged under 5 years are the age groups that are most secure financially, with 100.0% of males and 100.0% of females in these age groups living above the poverty line.
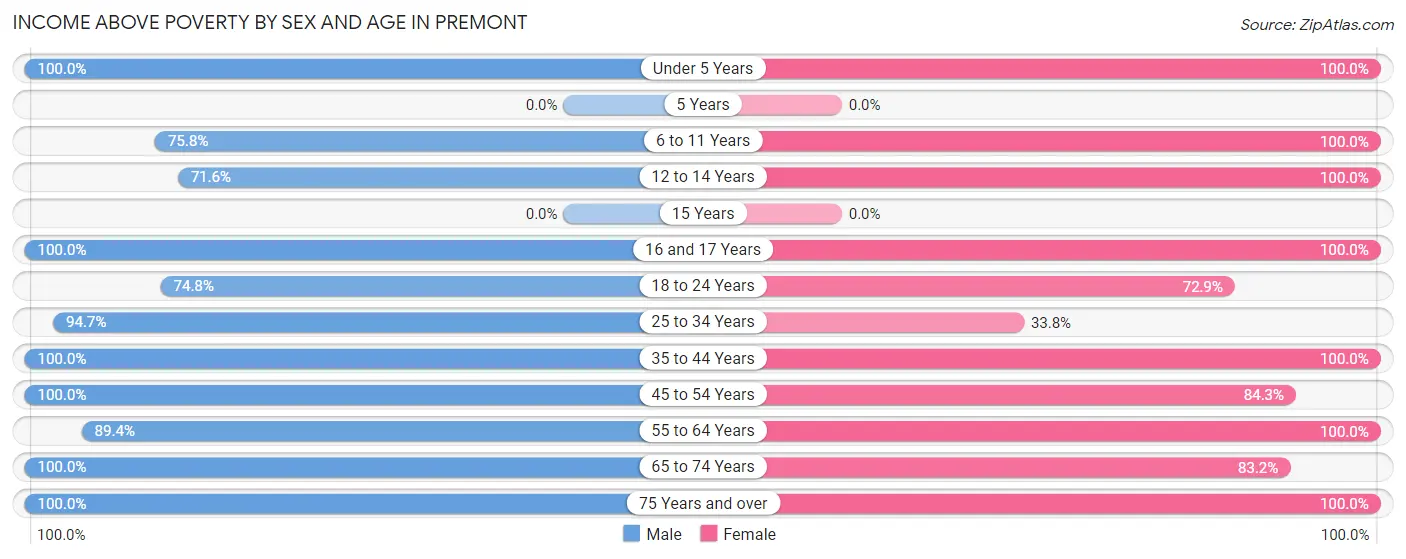
| Age Bracket | Male | Female |
| Under 5 Years | 191 (100.0%) | 39 (100.0%) |
| 5 Years | 0 (0.0%) | 0 (0.0%) |
| 6 to 11 Years | 72 (75.8%) | 47 (100.0%) |
| 12 to 14 Years | 68 (71.6%) | 19 (100.0%) |
| 15 Years | 0 (0.0%) | 0 (0.0%) |
| 16 and 17 Years | 25 (100.0%) | 74 (100.0%) |
| 18 to 24 Years | 148 (74.8%) | 186 (72.9%) |
| 25 to 34 Years | 466 (94.7%) | 47 (33.8%) |
| 35 to 44 Years | 48 (100.0%) | 55 (100.0%) |
| 45 to 54 Years | 177 (100.0%) | 75 (84.3%) |
| 55 to 64 Years | 135 (89.4%) | 176 (100.0%) |
| 65 to 74 Years | 101 (100.0%) | 114 (83.2%) |
| 75 Years and over | 35 (100.0%) | 141 (100.0%) |
| Total | 1,466 (91.2%) | 973 (83.1%) |
Income Below Poverty Among Married-Couple Families in Premont
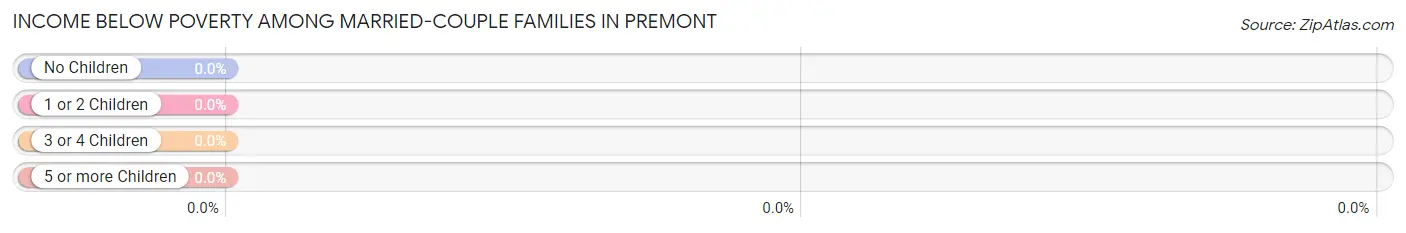
| Children | Above Poverty | Below Poverty |
| No Children | 208 (100.0%) | 0 (0.0%) |
| 1 or 2 Children | 105 (100.0%) | 0 (0.0%) |
| 3 or 4 Children | 286 (100.0%) | 0 (0.0%) |
| 5 or more Children | 0 (0.0%) | 0 (0.0%) |
| Total | 599 (100.0%) | 0 (0.0%) |
Income Below Poverty Among Single-Parent Households in Premont
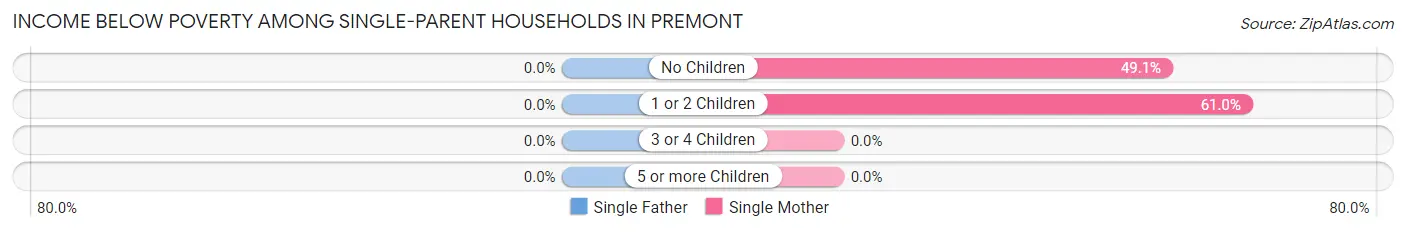
| Children | Single Father | Single Mother |
| No Children | 0 (0.0%) | 26 (49.1%) |
| 1 or 2 Children | 0 (0.0%) | 64 (61.0%) |
| 3 or 4 Children | 0 (0.0%) | 0 (0.0%) |
| 5 or more Children | 0 (0.0%) | 0 (0.0%) |
| Total | 0 (0.0%) | 90 (57.0%) |
Income Below Poverty Among Married-Couple vs Single-Parent Households in Premont
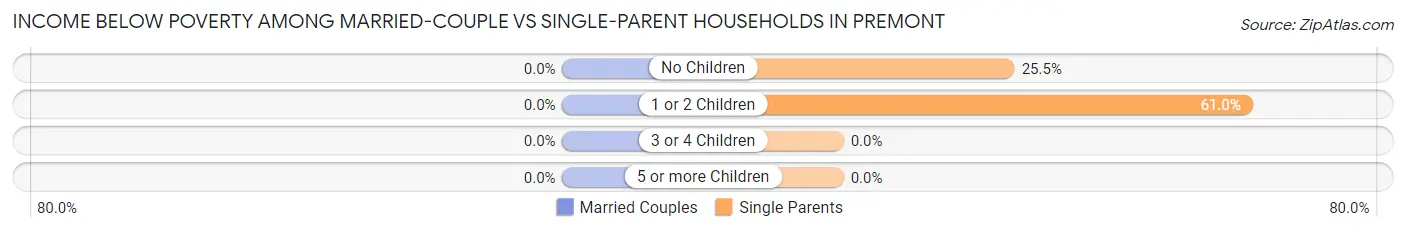
| Children | Married-Couple Families | Single-Parent Households |
| No Children | 0 (0.0%) | 26 (25.5%) |
| 1 or 2 Children | 0 (0.0%) | 64 (61.0%) |
| 3 or 4 Children | 0 (0.0%) | 0 (0.0%) |
| 5 or more Children | 0 (0.0%) | 0 (0.0%) |
| Total | 0 (0.0%) | 90 (43.5%) |
Race in Premont
The most populous races in Premont are Hispanic or Latino (2,670 | 95.0%), White / Caucasian (2,251 | 80.1%), and Two or more Races (522 | 18.6%).
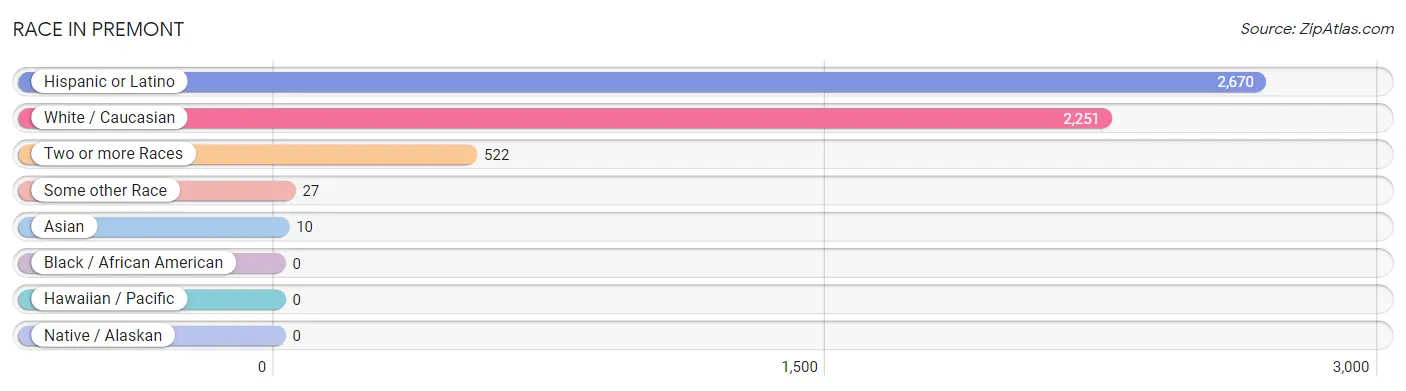
| Race | # Population | % Population |
| Asian | 10 | 0.4% |
| Black / African American | 0 | 0.0% |
| Hawaiian / Pacific | 0 | 0.0% |
| Hispanic or Latino | 2,670 | 95.0% |
| Native / Alaskan | 0 | 0.0% |
| White / Caucasian | 2,251 | 80.1% |
| Two or more Races | 522 | 18.6% |
| Some other Race | 27 | 1.0% |
| Total | 2,810 | 100.0% |
Ancestry in Premont
The most populous ancestries reported in Premont are Mexican (2,315 | 82.4%), English (30 | 1.1%), Irish (30 | 1.1%), American (27 | 1.0%), and Spaniard (16 | 0.6%), together accounting for 86.1% of all Premont residents.
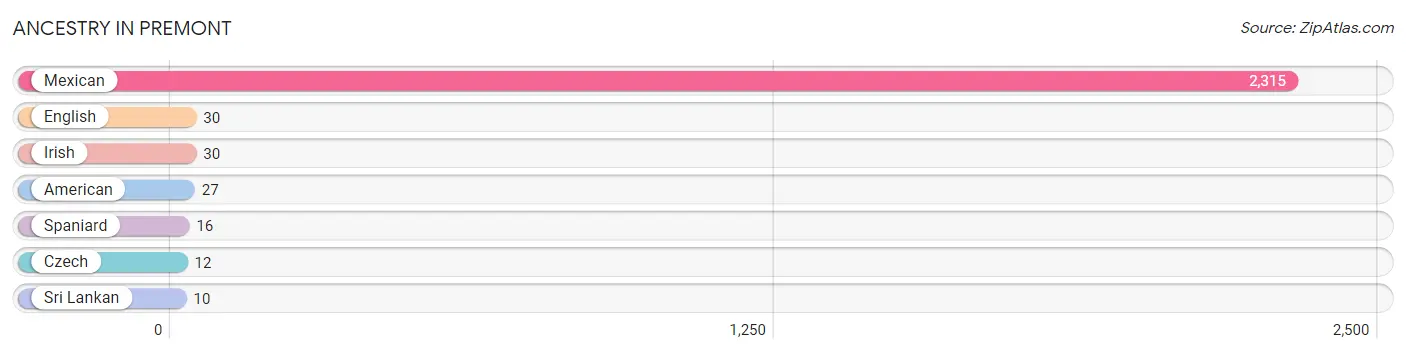
| Ancestry | # Population | % Population |
| American | 27 | 1.0% |
| Czech | 12 | 0.4% |
| English | 30 | 1.1% |
| Irish | 30 | 1.1% |
| Mexican | 2,315 | 82.4% |
| Spaniard | 16 | 0.6% |
| Sri Lankan | 10 | 0.4% | View All 7 Rows |
Immigrants in Premont
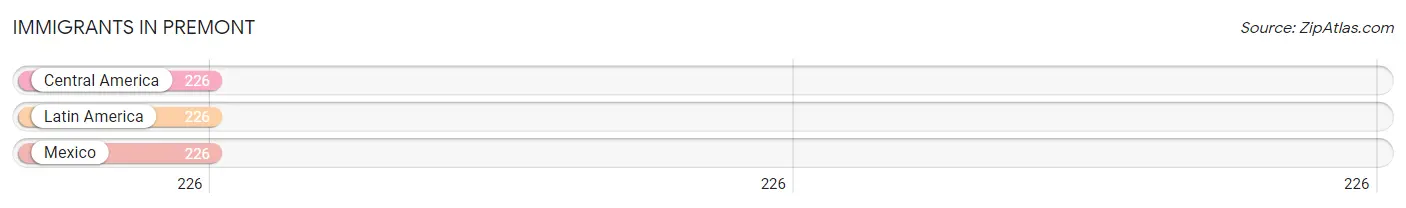
The most numerous immigrant groups reported in Premont came from Central America (226 | 8.0%), Latin America (226 | 8.0%), and Mexico (226 | 8.0%), together accounting for 24.1% of all Premont residents.
| Immigration Origin | # Population | % Population |
| Central America | 226 | 8.0% |
| Latin America | 226 | 8.0% |
| Mexico | 226 | 8.0% | View All 3 Rows |
Sex and Age in Premont
Sex and Age in Premont
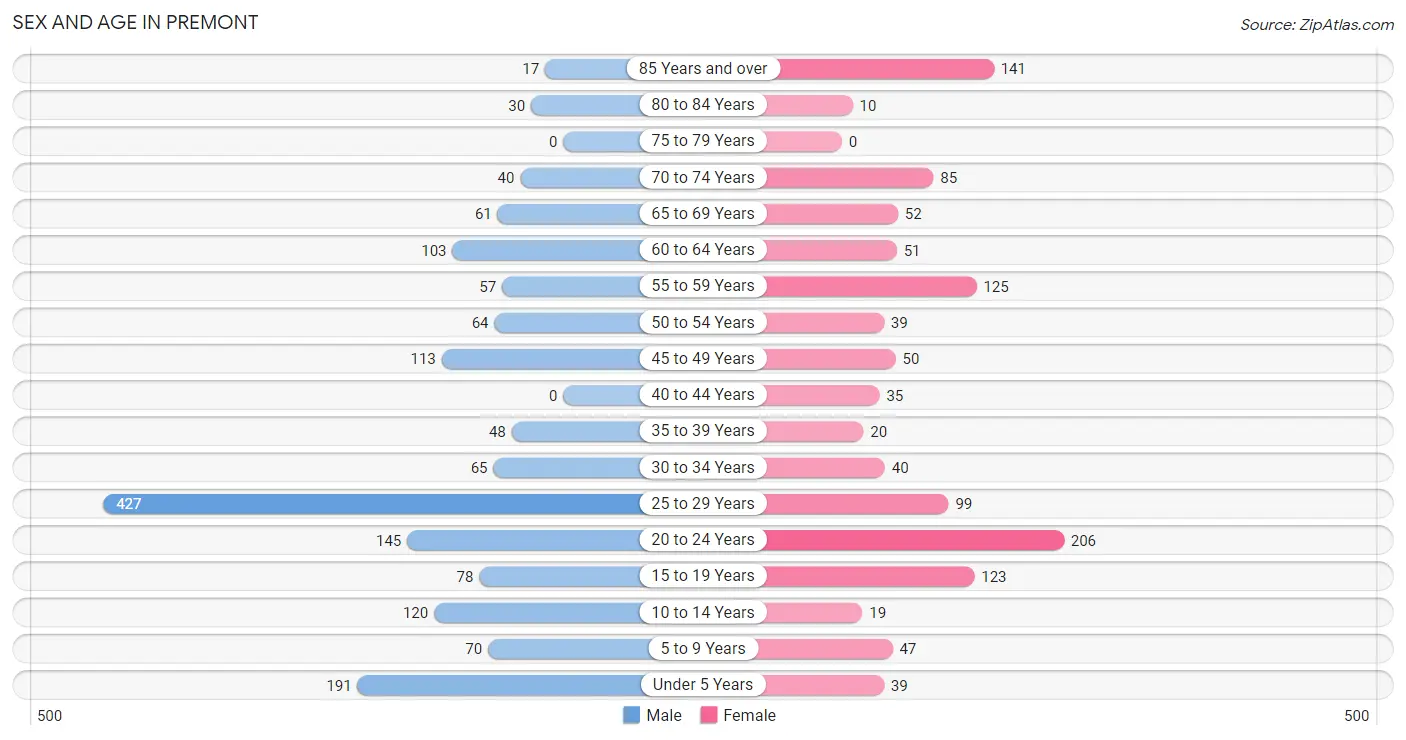
The most populous age groups in Premont are 25 to 29 Years (427 | 26.2%) for men and 20 to 24 Years (206 | 17.4%) for women.
| Age Bracket | Male | Female |
| Under 5 Years | 191 (11.7%) | 39 (3.3%) |
| 5 to 9 Years | 70 (4.3%) | 47 (4.0%) |
| 10 to 14 Years | 120 (7.4%) | 19 (1.6%) |
| 15 to 19 Years | 78 (4.8%) | 123 (10.4%) |
| 20 to 24 Years | 145 (8.9%) | 206 (17.4%) |
| 25 to 29 Years | 427 (26.2%) | 99 (8.4%) |
| 30 to 34 Years | 65 (4.0%) | 40 (3.4%) |
| 35 to 39 Years | 48 (2.9%) | 20 (1.7%) |
| 40 to 44 Years | 0 (0.0%) | 35 (3.0%) |
| 45 to 49 Years | 113 (6.9%) | 50 (4.2%) |
| 50 to 54 Years | 64 (3.9%) | 39 (3.3%) |
| 55 to 59 Years | 57 (3.5%) | 125 (10.6%) |
| 60 to 64 Years | 103 (6.3%) | 51 (4.3%) |
| 65 to 69 Years | 61 (3.7%) | 52 (4.4%) |
| 70 to 74 Years | 40 (2.5%) | 85 (7.2%) |
| 75 to 79 Years | 0 (0.0%) | 0 (0.0%) |
| 80 to 84 Years | 30 (1.8%) | 10 (0.9%) |
| 85 Years and over | 17 (1.0%) | 141 (11.9%) |
| Total | 1,629 (100.0%) | 1,181 (100.0%) |
Families and Households in Premont
Median Family Size in Premont
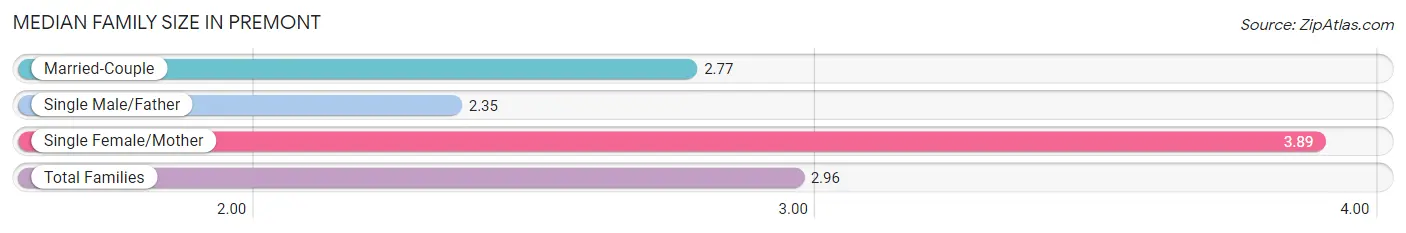
The median family size in Premont is 2.96 persons per family, with single female/mother families (158 | 19.6%) accounting for the largest median family size of 3.89 persons per family. On the other hand, single male/father families (49 | 6.1%) represent the smallest median family size with 2.35 persons per family.
| Family Type | # Families | Family Size |
| Married-Couple | 599 (74.3%) | 2.77 |
| Single Male/Father | 49 (6.1%) | 2.35 |
| Single Female/Mother | 158 (19.6%) | 3.89 |
| Total Families | 806 (100.0%) | 2.96 |
Median Household Size in Premont
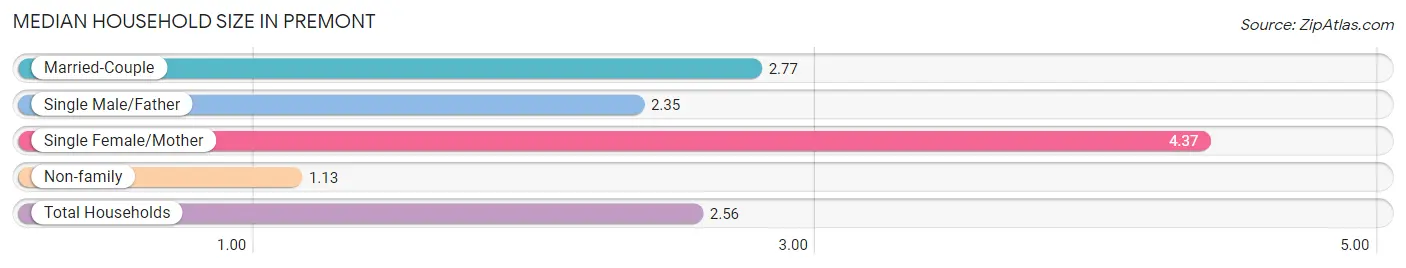
The median household size in Premont is 2.56 persons per household, with single female/mother households (158 | 14.5%) accounting for the largest median household size of 4.37 persons per household. non-family households (280 | 25.8%) represent the smallest median household size with 1.13 persons per household.
| Household Type | # Households | Household Size |
| Married-Couple | 599 (55.2%) | 2.77 |
| Single Male/Father | 49 (4.5%) | 2.35 |
| Single Female/Mother | 158 (14.5%) | 4.37 |
| Non-family | 280 (25.8%) | 1.13 |
| Total Households | 1,086 (100.0%) | 2.56 |
Household Size by Marriage Status in Premont
Out of a total of 1,086 households in Premont, 806 (74.2%) are family households, while 280 (25.8%) are nonfamily households. The most numerous type of family households are 2-person households, comprising 295, and the most common type of nonfamily households are 1-person households, comprising 237.
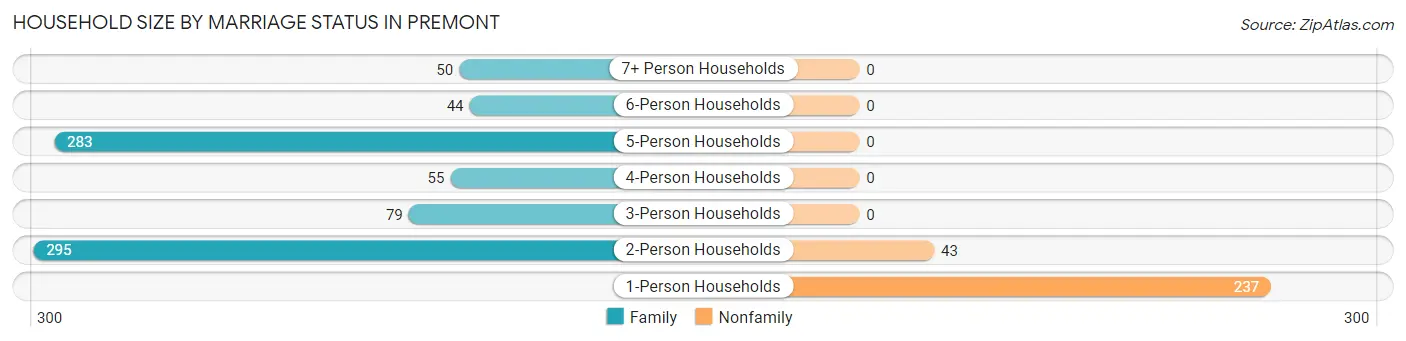
| Household Size | Family Households | Nonfamily Households |
| 1-Person Households | - | 237 (21.8%) |
| 2-Person Households | 295 (27.2%) | 43 (4.0%) |
| 3-Person Households | 79 (7.3%) | 0 (0.0%) |
| 4-Person Households | 55 (5.1%) | 0 (0.0%) |
| 5-Person Households | 283 (26.1%) | 0 (0.0%) |
| 6-Person Households | 44 (4.1%) | 0 (0.0%) |
| 7+ Person Households | 50 (4.6%) | 0 (0.0%) |
| Total | 806 (74.2%) | 280 (25.8%) |
Female Fertility in Premont
Fertility by Age in Premont
Average fertility rate in Premont is 122.0 births per 1,000 women. Women in the age bracket of 20 to 34 years have the highest fertility rate with 203.0 births per 1,000 women. Women in the age bracket of 20 to 34 years acount for 100.0% of all women with births.
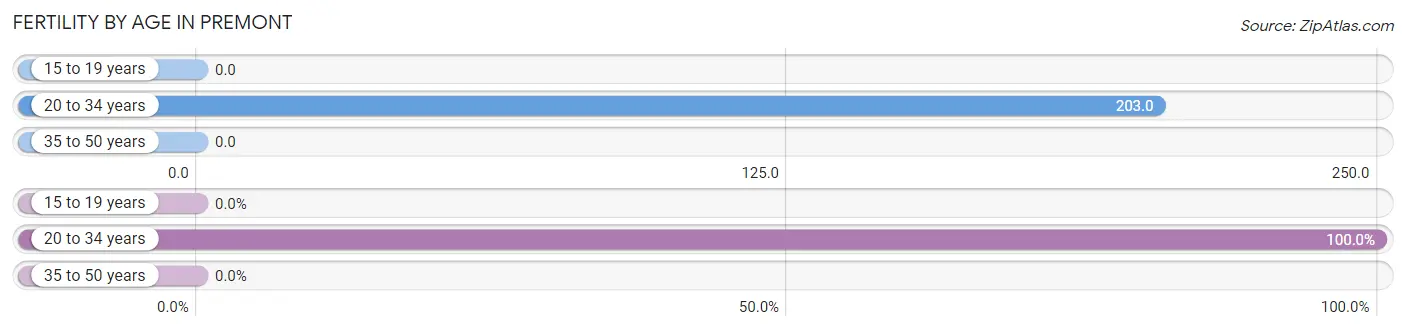
| Age Bracket | Women with Births | Births / 1,000 Women |
| 15 to 19 years | 0 (0.0%) | 0.0 |
| 20 to 34 years | 70 (100.0%) | 203.0 |
| 35 to 50 years | 0 (0.0%) | 0.0 |
| Total | 70 (100.0%) | 122.0 |
Fertility by Age by Marriage Status in Premont
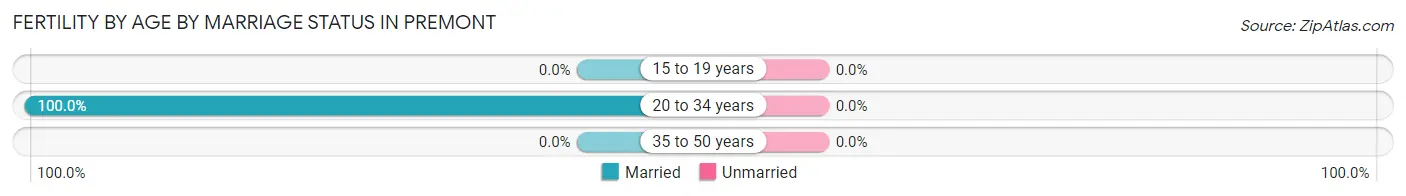
| Age Bracket | Married | Unmarried |
| 15 to 19 years | 0 (0.0%) | 0 (0.0%) |
| 20 to 34 years | 70 (100.0%) | 0 (0.0%) |
| 35 to 50 years | 0 (0.0%) | 0 (0.0%) |
| Total | 70 (100.0%) | 0 (0.0%) |
Fertility by Education in Premont
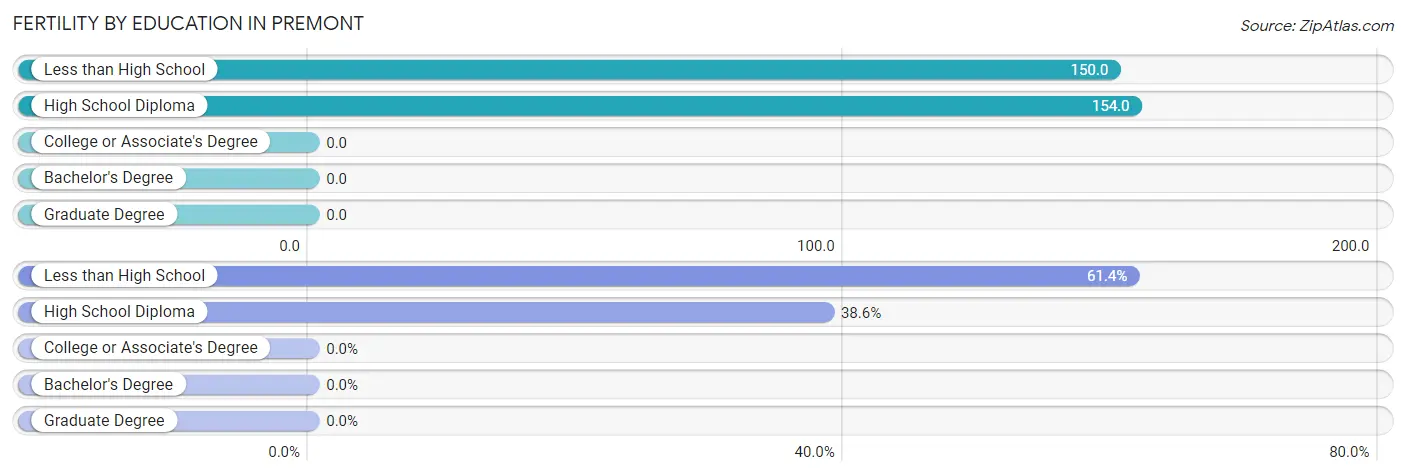
| Educational Attainment | Women with Births | Births / 1,000 Women |
| Less than High School | 43 (61.4%) | 150.0 |
| High School Diploma | 27 (38.6%) | 154.0 |
| College or Associate's Degree | 0 (0.0%) | 0.0 |
| Bachelor's Degree | 0 (0.0%) | 0.0 |
| Graduate Degree | 0 (0.0%) | 0.0 |
| Total | 70 (100.0%) | 122.0 |
Fertility by Education by Marriage Status in Premont
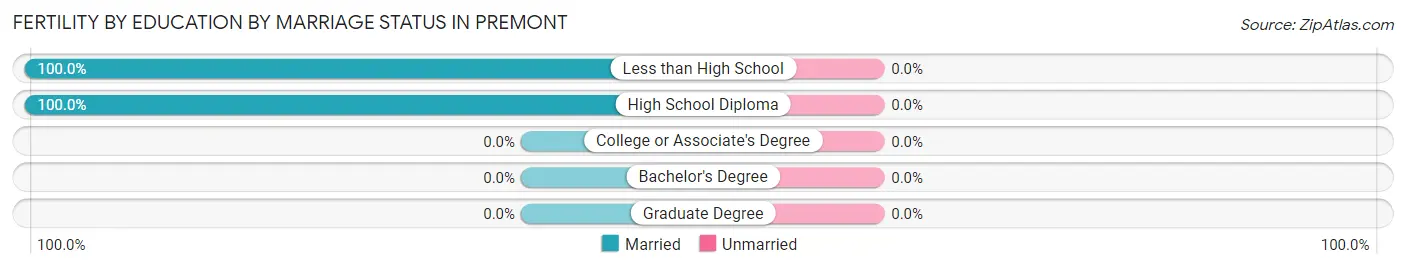
| Educational Attainment | Married | Unmarried |
| Less than High School | 43 (100.0%) | 0 (0.0%) |
| High School Diploma | 27 (100.0%) | 0 (0.0%) |
| College or Associate's Degree | 0 (0.0%) | 0 (0.0%) |
| Bachelor's Degree | 0 (0.0%) | 0 (0.0%) |
| Graduate Degree | 0 (0.0%) | 0 (0.0%) |
| Total | 70 (100.0%) | 0 (0.0%) |
Employment Characteristics in Premont
Employment by Class of Employer in Premont
Among the 1,148 employed individuals in Premont, private company employees (848 | 73.9%), federal government employees (114 | 9.9%), and state government employees (69 | 6.0%) make up the most common classes of employment.
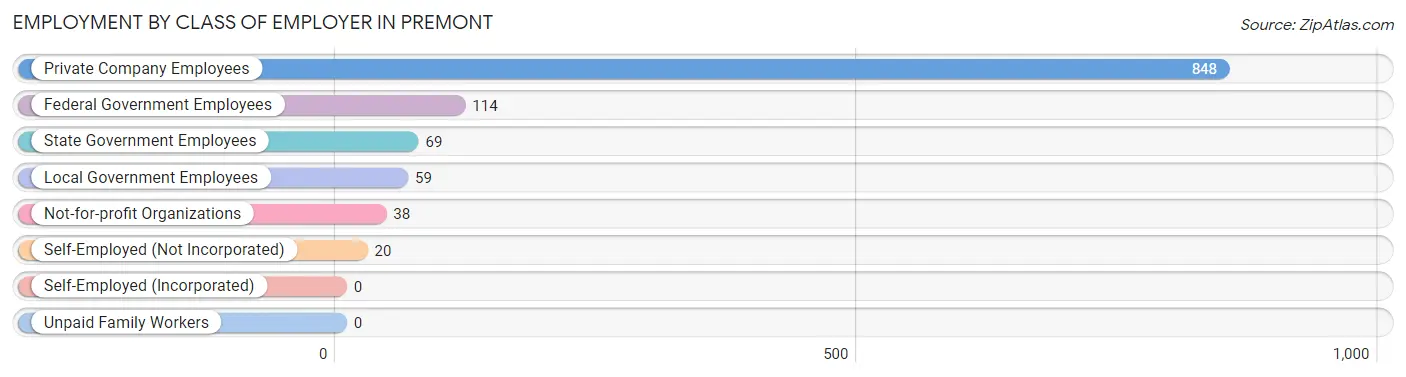
| Employer Class | # Employees | % Employees |
| Private Company Employees | 848 | 73.9% |
| Self-Employed (Incorporated) | 0 | 0.0% |
| Self-Employed (Not Incorporated) | 20 | 1.7% |
| Not-for-profit Organizations | 38 | 3.3% |
| Local Government Employees | 59 | 5.1% |
| State Government Employees | 69 | 6.0% |
| Federal Government Employees | 114 | 9.9% |
| Unpaid Family Workers | 0 | 0.0% |
| Total | 1,148 | 100.0% |
Employment Status by Age in Premont
According to the labor force statistics for Premont, out of the total population over 16 years of age (2,324), 58.6% or 1,362 individuals are in the labor force, with 15.7% or 214 of them unemployed. The age group with the highest labor force participation rate is 35 to 44 years, with 100.0% or 103 individuals in the labor force. Within the labor force, the 60 to 64 years age range has the highest percentage of unemployed individuals, with 33.3% or 19 of them being unemployed.
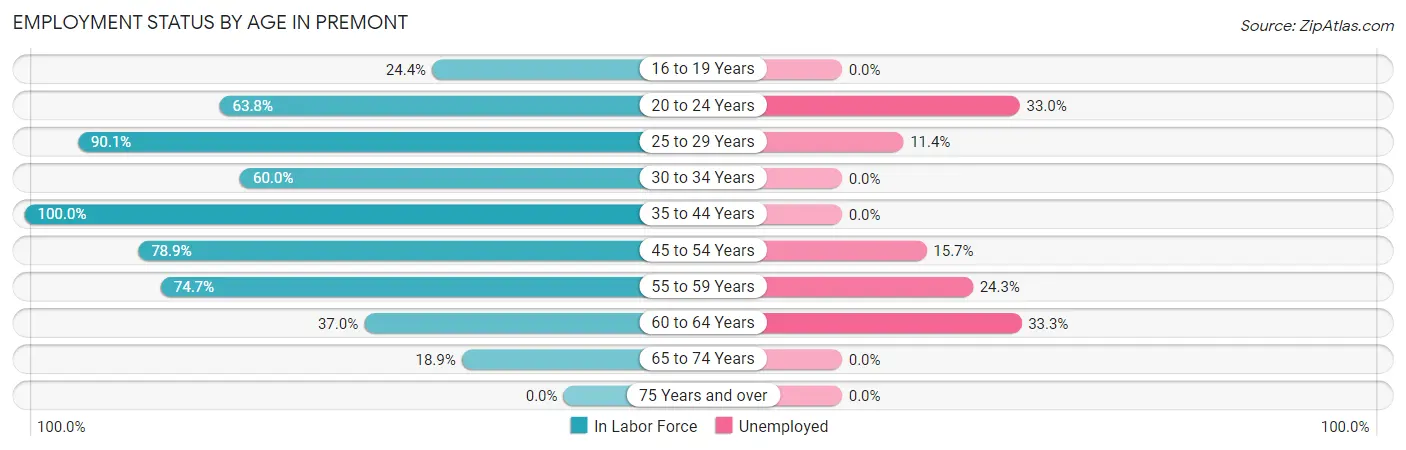
| Age Bracket | In Labor Force | Unemployed |
| 16 to 19 Years | 49 (24.4%) | 0 (0.0%) |
| 20 to 24 Years | 224 (63.8%) | 74 (33.0%) |
| 25 to 29 Years | 474 (90.1%) | 54 (11.4%) |
| 30 to 34 Years | 63 (60.0%) | 0 (0.0%) |
| 35 to 44 Years | 103 (100.0%) | 0 (0.0%) |
| 45 to 54 Years | 210 (78.9%) | 33 (15.7%) |
| 55 to 59 Years | 136 (74.7%) | 33 (24.3%) |
| 60 to 64 Years | 57 (37.0%) | 19 (33.3%) |
| 65 to 74 Years | 45 (18.9%) | 0 (0.0%) |
| 75 Years and over | 0 (0.0%) | 0 (0.0%) |
| Total | 1,362 (58.6%) | 214 (15.7%) |
Employment Status by Educational Attainment in Premont
According to labor force statistics for Premont, 78.1% of individuals (1,043) out of the total population between 25 and 64 years of age (1,336) are in the labor force, with 13.3% or 139 of them being unemployed. The group with the highest labor force participation rate are those with the educational attainment of college / associate degree, with 93.4% or 213 individuals in the labor force. Within the labor force, individuals with college / associate degree education have the highest percentage of unemployment, with 33.3% or 71 of them being unemployed.
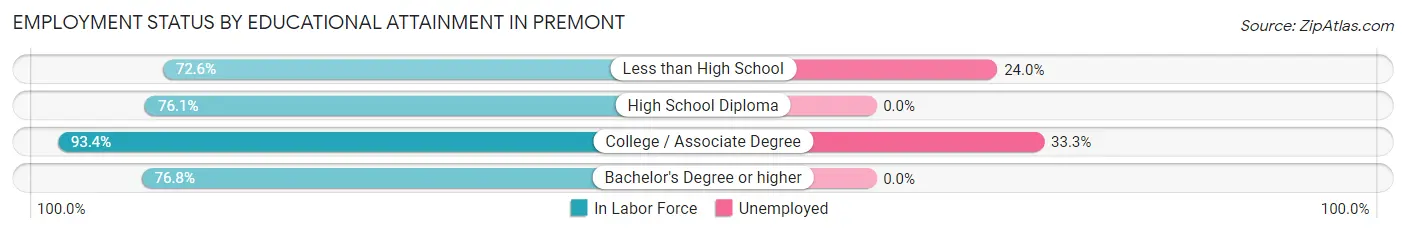
| Educational Attainment | In Labor Force | Unemployed |
| Less than High School | 283 (72.6%) | 94 (24.0%) |
| High School Diploma | 484 (76.1%) | 0 (0.0%) |
| College / Associate Degree | 213 (93.4%) | 76 (33.3%) |
| Bachelor's Degree or higher | 63 (76.8%) | 0 (0.0%) |
| Total | 1,043 (78.1%) | 178 (13.3%) |
Employment Occupations by Sex in Premont
Management, Business, Science and Arts Occupations
The most common Management, Business, Science and Arts occupations in Premont are Health Diagnosing & Treating (44 | 3.8%), Health Technologists (44 | 3.8%), Community & Social Service (12 | 1.1%), and Education Instruction & Library (12 | 1.1%).
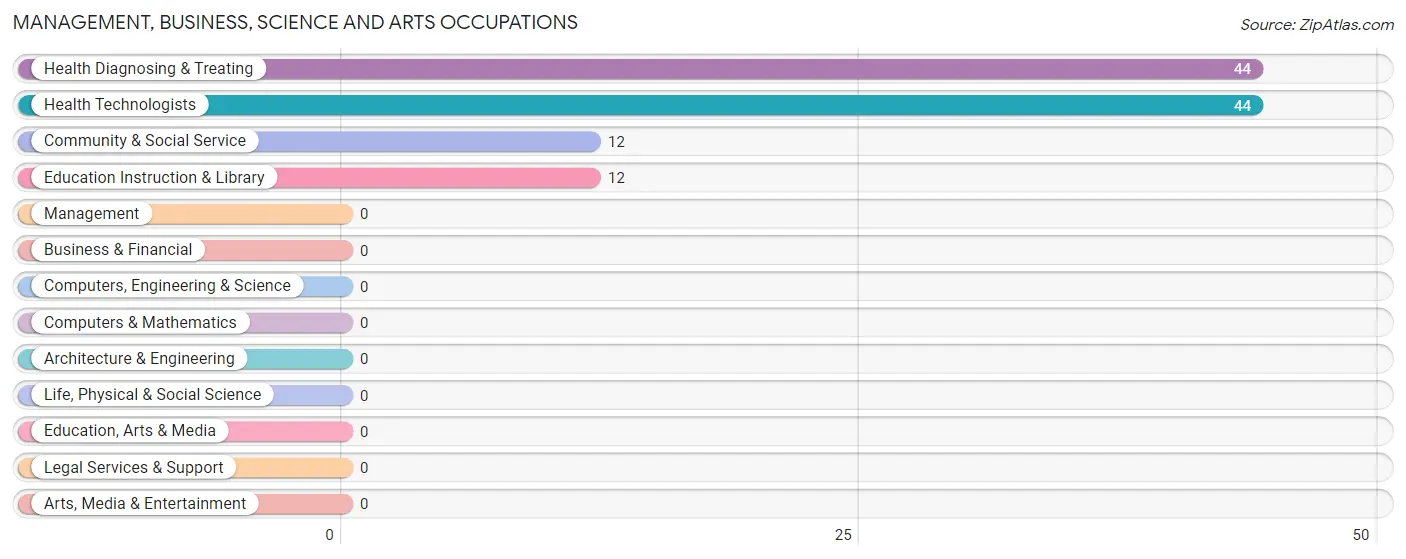
Management, Business, Science and Arts Occupations by Sex
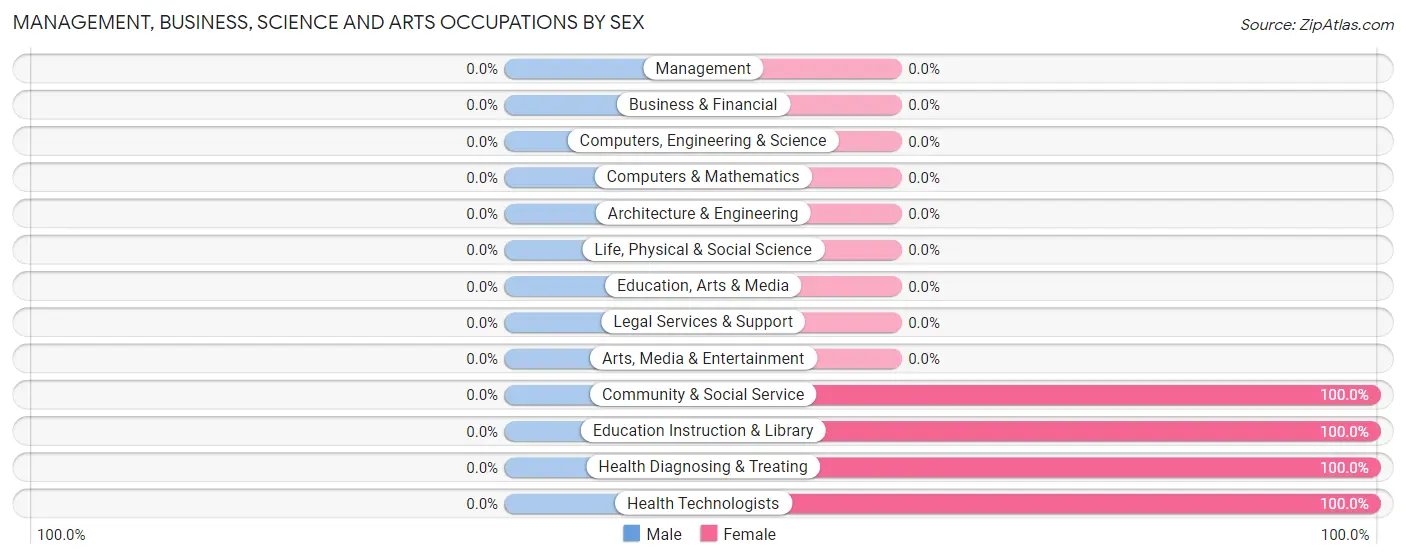
| Occupation | Male | Female |
| Management | 0 (0.0%) | 0 (0.0%) |
| Business & Financial | 0 (0.0%) | 0 (0.0%) |
| Computers, Engineering & Science | 0 (0.0%) | 0 (0.0%) |
| Computers & Mathematics | 0 (0.0%) | 0 (0.0%) |
| Architecture & Engineering | 0 (0.0%) | 0 (0.0%) |
| Life, Physical & Social Science | 0 (0.0%) | 0 (0.0%) |
| Community & Social Service | 0 (0.0%) | 12 (100.0%) |
| Education, Arts & Media | 0 (0.0%) | 0 (0.0%) |
| Legal Services & Support | 0 (0.0%) | 0 (0.0%) |
| Education Instruction & Library | 0 (0.0%) | 12 (100.0%) |
| Arts, Media & Entertainment | 0 (0.0%) | 0 (0.0%) |
| Health Diagnosing & Treating | 0 (0.0%) | 44 (100.0%) |
| Health Technologists | 0 (0.0%) | 44 (100.0%) |
| Total (Category) | 0 (0.0%) | 56 (100.0%) |
| Total (Overall) | 693 (60.4%) | 455 (39.6%) |
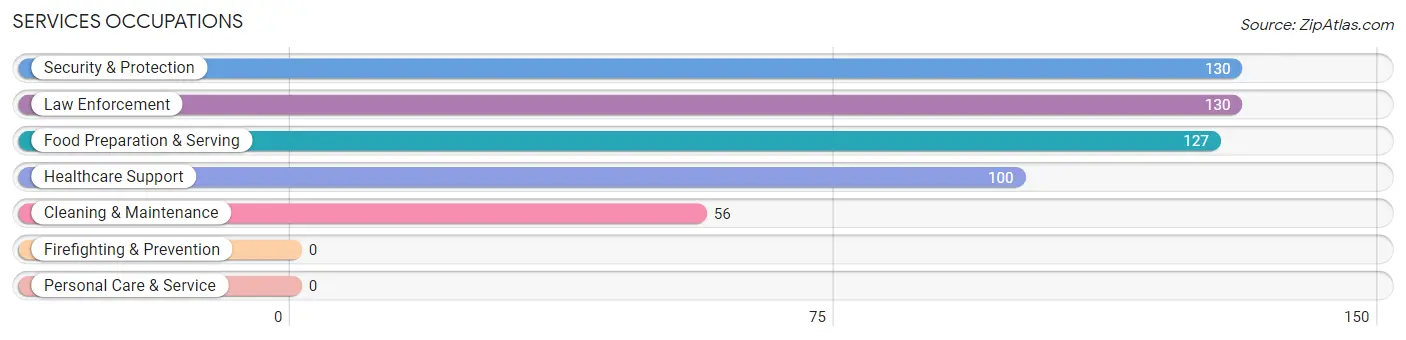
Services Occupations
The most common Services occupations in Premont are Security & Protection (130 | 11.3%), Law Enforcement (130 | 11.3%), Food Preparation & Serving (127 | 11.1%), Healthcare Support (100 | 8.7%), and Cleaning & Maintenance (56 | 4.9%).
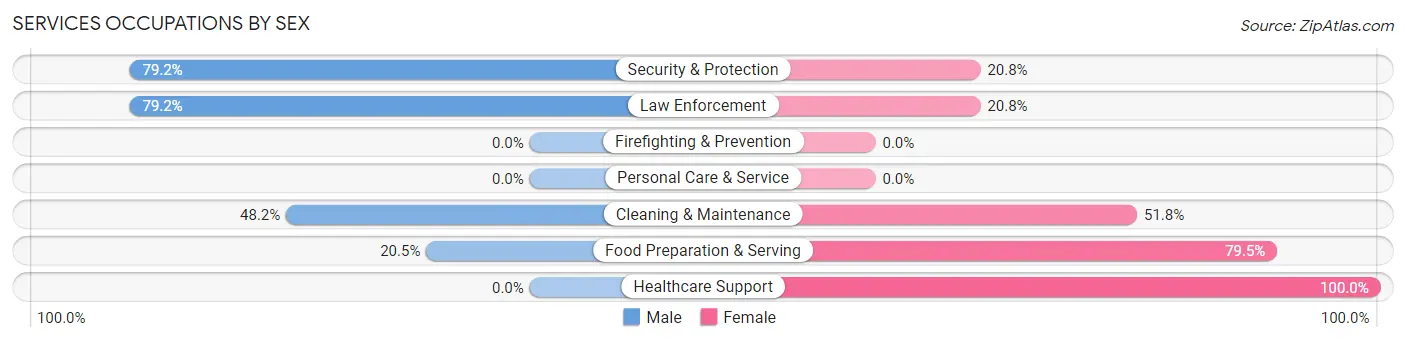
Services Occupations by Sex
Within the Services occupations in Premont, the most male-oriented occupations are Security & Protection (79.2%), Law Enforcement (79.2%), and Cleaning & Maintenance (48.2%), while the most female-oriented occupations are Healthcare Support (100.0%), Food Preparation & Serving (79.5%), and Cleaning & Maintenance (51.8%).
| Occupation | Male | Female |
| Healthcare Support | 0 (0.0%) | 100 (100.0%) |
| Security & Protection | 103 (79.2%) | 27 (20.8%) |
| Firefighting & Prevention | 0 (0.0%) | 0 (0.0%) |
| Law Enforcement | 103 (79.2%) | 27 (20.8%) |
| Food Preparation & Serving | 26 (20.5%) | 101 (79.5%) |
| Cleaning & Maintenance | 27 (48.2%) | 29 (51.8%) |
| Personal Care & Service | 0 (0.0%) | 0 (0.0%) |
| Total (Category) | 156 (37.8%) | 257 (62.2%) |
| Total (Overall) | 693 (60.4%) | 455 (39.6%) |
Sales and Office Occupations
The most common Sales and Office occupations in Premont are Office & Administration (106 | 9.2%), and Sales & Related (73 | 6.4%).
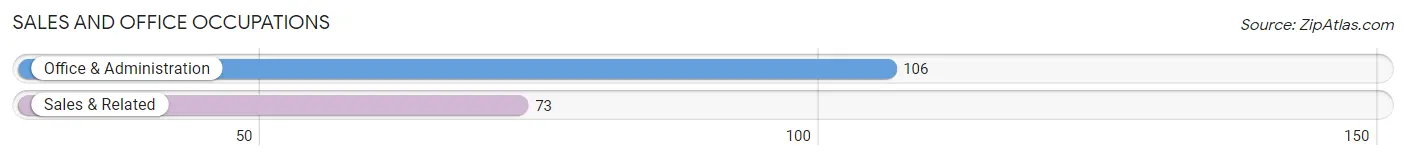
Sales and Office Occupations by Sex
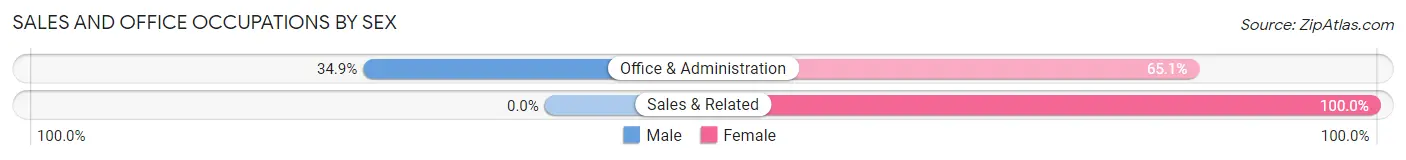
| Occupation | Male | Female |
| Sales & Related | 0 (0.0%) | 73 (100.0%) |
| Office & Administration | 37 (34.9%) | 69 (65.1%) |
| Total (Category) | 37 (20.7%) | 142 (79.3%) |
| Total (Overall) | 693 (60.4%) | 455 (39.6%) |
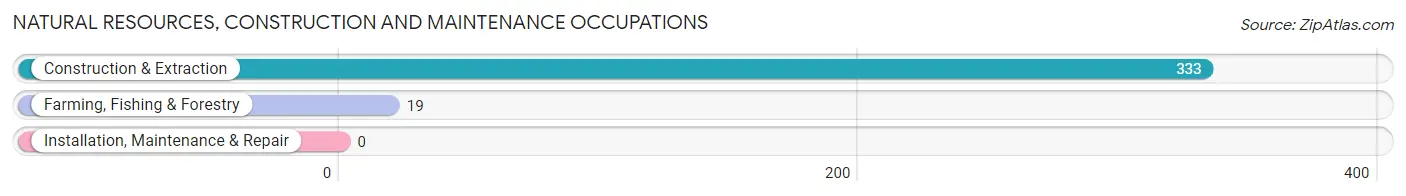
Natural Resources, Construction and Maintenance Occupations
The most common Natural Resources, Construction and Maintenance occupations in Premont are Construction & Extraction (333 | 29.0%), and Farming, Fishing & Forestry (19 | 1.7%).
Natural Resources, Construction and Maintenance Occupations by Sex
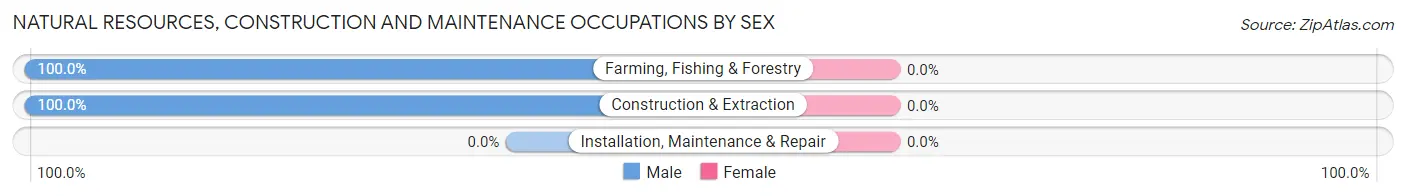
| Occupation | Male | Female |
| Farming, Fishing & Forestry | 19 (100.0%) | 0 (0.0%) |
| Construction & Extraction | 333 (100.0%) | 0 (0.0%) |
| Installation, Maintenance & Repair | 0 (0.0%) | 0 (0.0%) |
| Total (Category) | 352 (100.0%) | 0 (0.0%) |
| Total (Overall) | 693 (60.4%) | 455 (39.6%) |
Production, Transportation and Moving Occupations
The most common Production, Transportation and Moving occupations in Premont are Production (112 | 9.8%), and Transportation (36 | 3.1%).
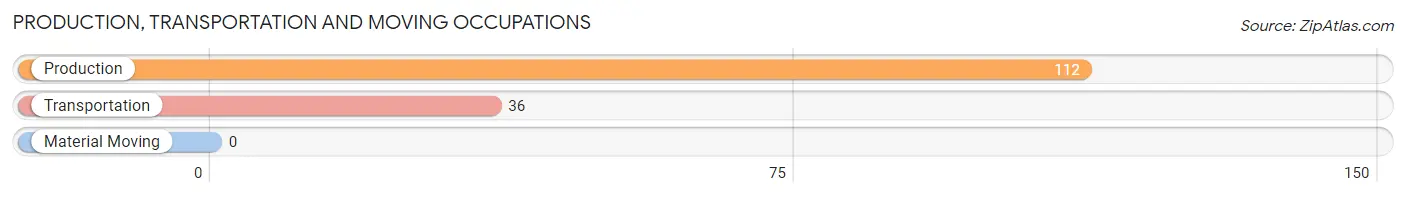
Production, Transportation and Moving Occupations by Sex
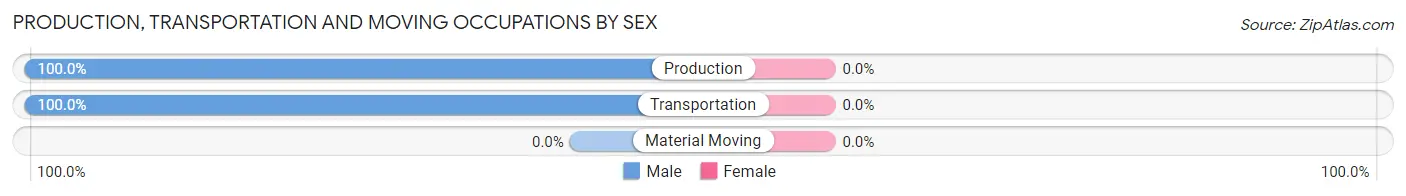
| Occupation | Male | Female |
| Production | 112 (100.0%) | 0 (0.0%) |
| Transportation | 36 (100.0%) | 0 (0.0%) |
| Material Moving | 0 (0.0%) | 0 (0.0%) |
| Total (Category) | 148 (100.0%) | 0 (0.0%) |
| Total (Overall) | 693 (60.4%) | 455 (39.6%) |
Employment Industries by Sex in Premont
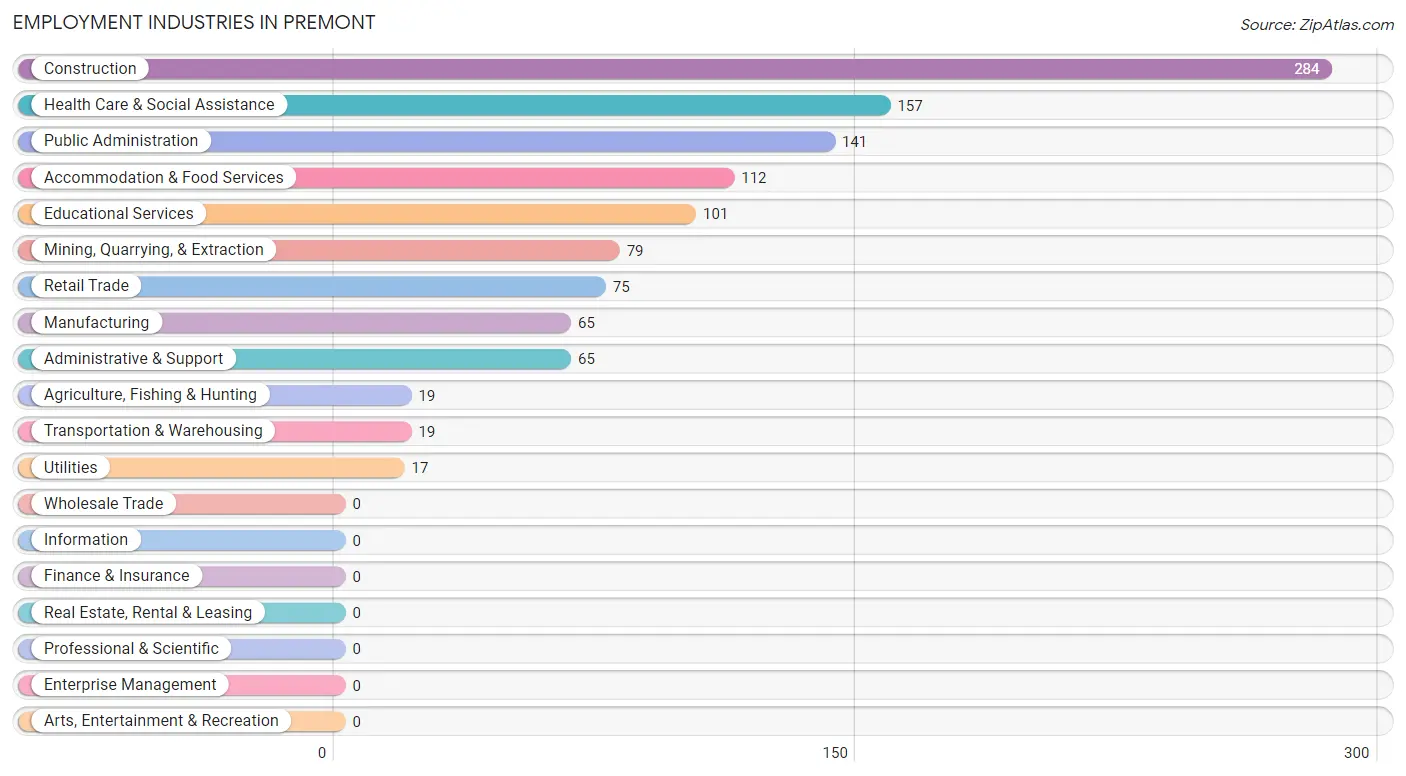
Employment Industries in Premont
The major employment industries in Premont include Construction (284 | 24.7%), Health Care & Social Assistance (157 | 13.7%), Public Administration (141 | 12.3%), Accommodation & Food Services (112 | 9.8%), and Educational Services (101 | 8.8%).
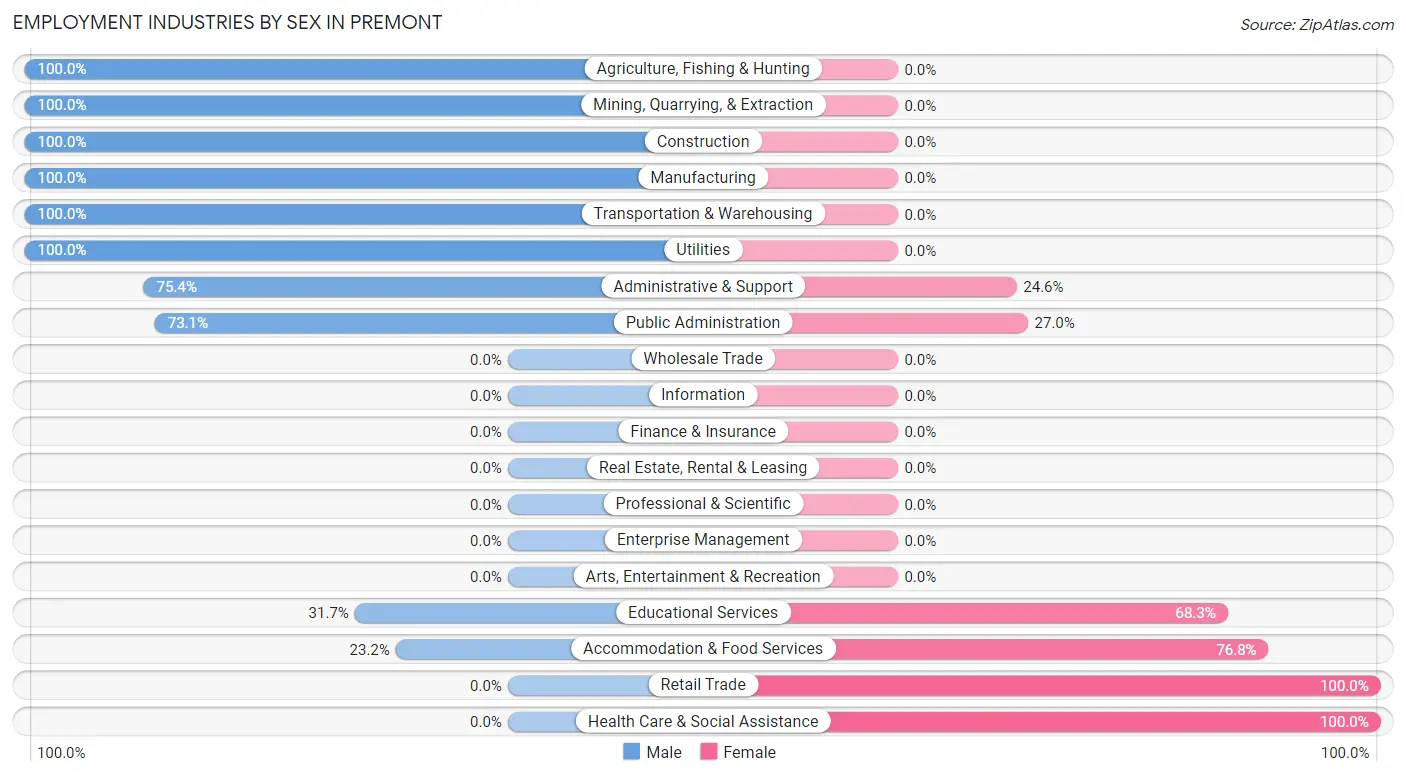
Employment Industries by Sex in Premont
The Premont industries that see more men than women are Agriculture, Fishing & Hunting (100.0%), Mining, Quarrying, & Extraction (100.0%), and Construction (100.0%), whereas the industries that tend to have a higher number of women are Retail Trade (100.0%), Health Care & Social Assistance (100.0%), and Accommodation & Food Services (76.8%).
| Industry | Male | Female |
| Agriculture, Fishing & Hunting | 19 (100.0%) | 0 (0.0%) |
| Mining, Quarrying, & Extraction | 79 (100.0%) | 0 (0.0%) |
| Construction | 284 (100.0%) | 0 (0.0%) |
| Manufacturing | 65 (100.0%) | 0 (0.0%) |
| Wholesale Trade | 0 (0.0%) | 0 (0.0%) |
| Retail Trade | 0 (0.0%) | 75 (100.0%) |
| Transportation & Warehousing | 19 (100.0%) | 0 (0.0%) |
| Utilities | 17 (100.0%) | 0 (0.0%) |
| Information | 0 (0.0%) | 0 (0.0%) |
| Finance & Insurance | 0 (0.0%) | 0 (0.0%) |
| Real Estate, Rental & Leasing | 0 (0.0%) | 0 (0.0%) |
| Professional & Scientific | 0 (0.0%) | 0 (0.0%) |
| Enterprise Management | 0 (0.0%) | 0 (0.0%) |
| Administrative & Support | 49 (75.4%) | 16 (24.6%) |
| Educational Services | 32 (31.7%) | 69 (68.3%) |
| Health Care & Social Assistance | 0 (0.0%) | 157 (100.0%) |
| Arts, Entertainment & Recreation | 0 (0.0%) | 0 (0.0%) |
| Accommodation & Food Services | 26 (23.2%) | 86 (76.8%) |
| Public Administration | 103 (73.1%) | 38 (27.0%) |
| Total | 693 (60.4%) | 455 (39.6%) |
Education in Premont
School Enrollment in Premont
The most common levels of schooling among the 538 students in Premont are college / undergraduate (149 | 27.7%), high school (133 | 24.7%), and elementary school (119 | 22.1%).
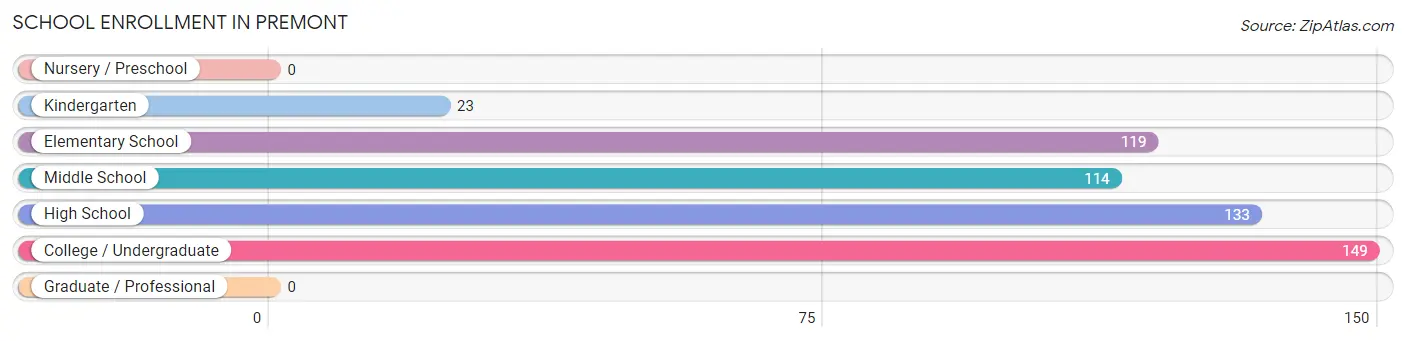
| School Level | # Students | % Students |
| Nursery / Preschool | 0 | 0.0% |
| Kindergarten | 23 | 4.3% |
| Elementary School | 119 | 22.1% |
| Middle School | 114 | 21.2% |
| High School | 133 | 24.7% |
| College / Undergraduate | 149 | 27.7% |
| Graduate / Professional | 0 | 0.0% |
| Total | 538 | 100.0% |
School Enrollment by Age by Funding Source in Premont
Out of a total of 538 students who are enrolled in schools in Premont, 50 (9.3%) attend a private institution, while the remaining 488 (90.7%) are enrolled in public schools. The age group of 20 to 24 year olds has the highest likelihood of being enrolled in private schools, with 50 (100.0% in the age bracket) enrolled. Conversely, the age group of 5 to 9 year old has the lowest likelihood of being enrolled in a private school, with 117 (100.0% in the age bracket) attending a public institution.
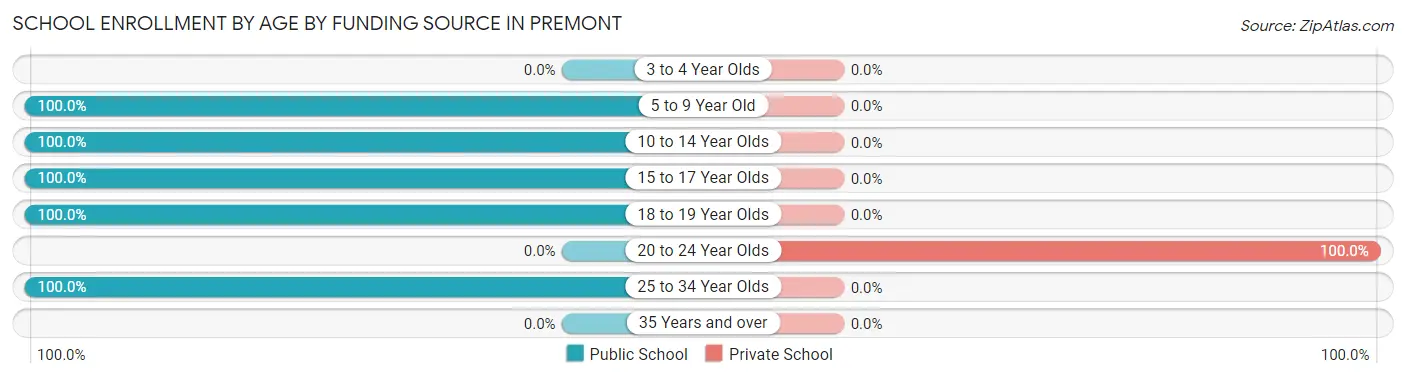
| Age Bracket | Public School | Private School |
| 3 to 4 Year Olds | 0 (0.0%) | 0 (0.0%) |
| 5 to 9 Year Old | 117 (100.0%) | 0 (0.0%) |
| 10 to 14 Year Olds | 139 (100.0%) | 0 (0.0%) |
| 15 to 17 Year Olds | 99 (100.0%) | 0 (0.0%) |
| 18 to 19 Year Olds | 34 (100.0%) | 0 (0.0%) |
| 20 to 24 Year Olds | 0 (0.0%) | 50 (100.0%) |
| 25 to 34 Year Olds | 99 (100.0%) | 0 (0.0%) |
| 35 Years and over | 0 (0.0%) | 0 (0.0%) |
| Total | 488 (90.7%) | 50 (9.3%) |
Educational Attainment by Field of Study in Premont
Education (81 | 35.2%), business (64 | 27.8%), literature & languages (64 | 27.8%), communications (11 | 4.8%), and liberal arts & history (10 | 4.3%) are the most common fields of study among 230 individuals in Premont who have obtained a bachelor's degree or higher.
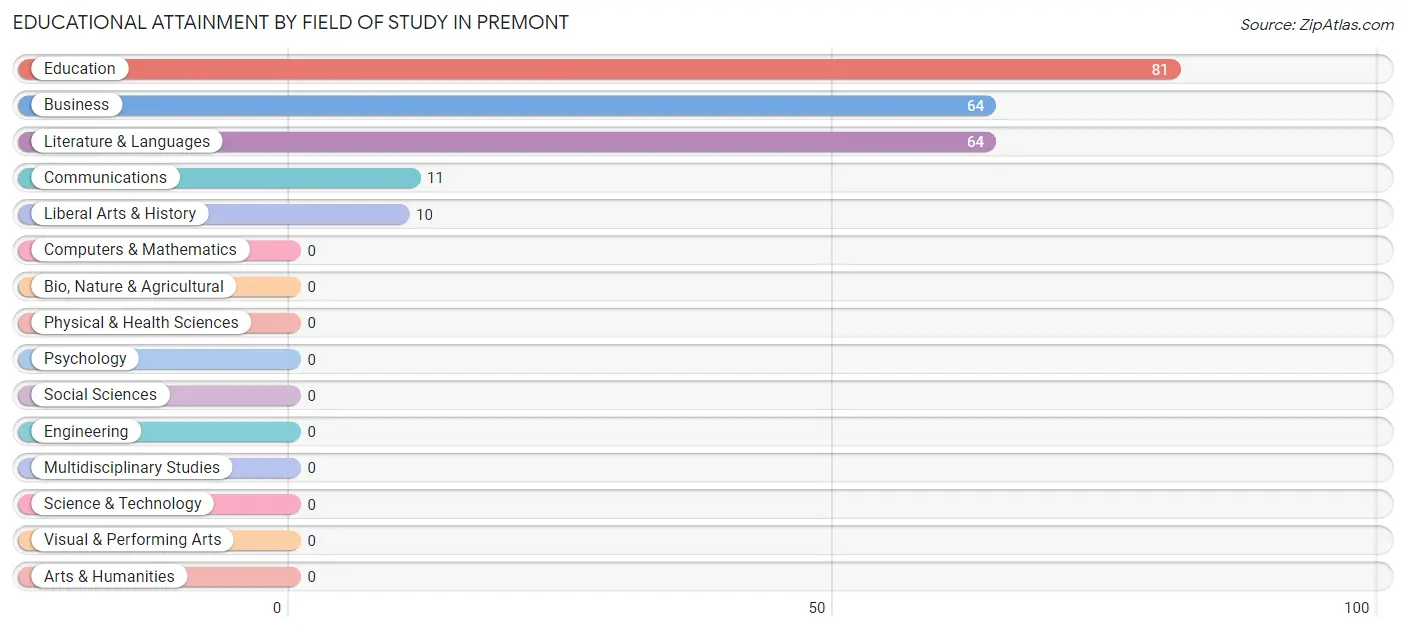
| Field of Study | # Graduates | % Graduates |
| Computers & Mathematics | 0 | 0.0% |
| Bio, Nature & Agricultural | 0 | 0.0% |
| Physical & Health Sciences | 0 | 0.0% |
| Psychology | 0 | 0.0% |
| Social Sciences | 0 | 0.0% |
| Engineering | 0 | 0.0% |
| Multidisciplinary Studies | 0 | 0.0% |
| Science & Technology | 0 | 0.0% |
| Business | 64 | 27.8% |
| Education | 81 | 35.2% |
| Literature & Languages | 64 | 27.8% |
| Liberal Arts & History | 10 | 4.3% |
| Visual & Performing Arts | 0 | 0.0% |
| Communications | 11 | 4.8% |
| Arts & Humanities | 0 | 0.0% |
| Total | 230 | 100.0% |
Transportation & Commute in Premont
Vehicle Availability by Sex in Premont
The most prevalent vehicle ownership categories in Premont are males with 1 vehicle (362, accounting for 52.2%) and females with 1 vehicle (153, making up 79.6%).
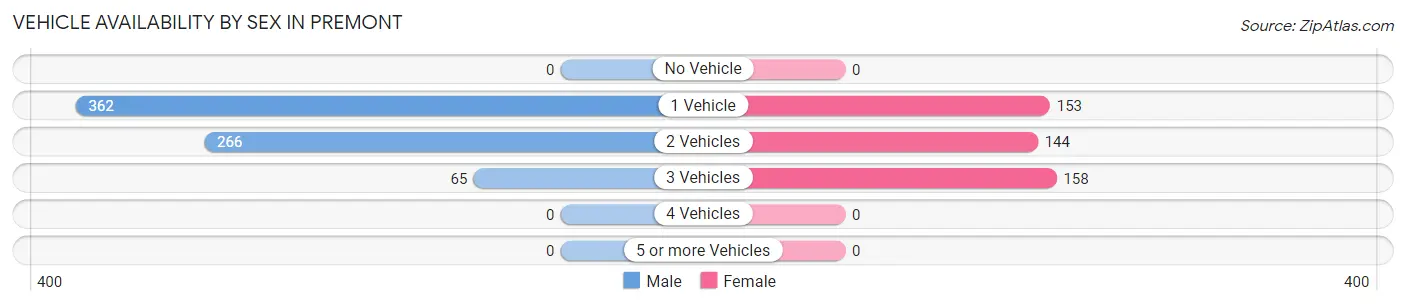
| Vehicles Available | Male | Female |
| No Vehicle | 0 (0.0%) | 0 (0.0%) |
| 1 Vehicle | 362 (52.2%) | 153 (33.6%) |
| 2 Vehicles | 266 (38.4%) | 144 (31.7%) |
| 3 Vehicles | 65 (9.4%) | 158 (34.7%) |
| 4 Vehicles | 0 (0.0%) | 0 (0.0%) |
| 5 or more Vehicles | 0 (0.0%) | 0 (0.0%) |
| Total | 693 (100.0%) | 455 (100.0%) |
Commute Time in Premont
The most frequently occuring commute durations in Premont are 5 to 9 minutes (349 commuters, 30.9%), 15 to 19 minutes (309 commuters, 27.4%), and 10 to 14 minutes (165 commuters, 14.6%).
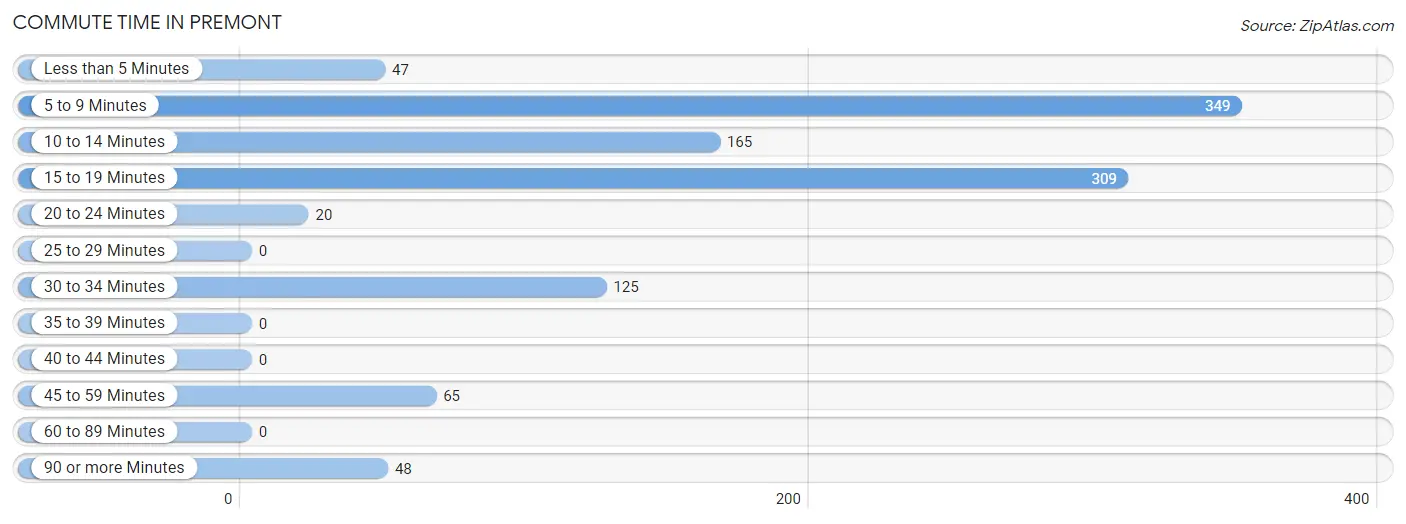
| Commute Time | # Commuters | % Commuters |
| Less than 5 Minutes | 47 | 4.2% |
| 5 to 9 Minutes | 349 | 30.9% |
| 10 to 14 Minutes | 165 | 14.6% |
| 15 to 19 Minutes | 309 | 27.4% |
| 20 to 24 Minutes | 20 | 1.8% |
| 25 to 29 Minutes | 0 | 0.0% |
| 30 to 34 Minutes | 125 | 11.1% |
| 35 to 39 Minutes | 0 | 0.0% |
| 40 to 44 Minutes | 0 | 0.0% |
| 45 to 59 Minutes | 65 | 5.8% |
| 60 to 89 Minutes | 0 | 0.0% |
| 90 or more Minutes | 48 | 4.3% |
Commute Time by Sex in Premont
The most common commute times in Premont are 15 to 19 minutes (289 commuters, 41.7%) for males and 5 to 9 minutes (171 commuters, 39.3%) for females.
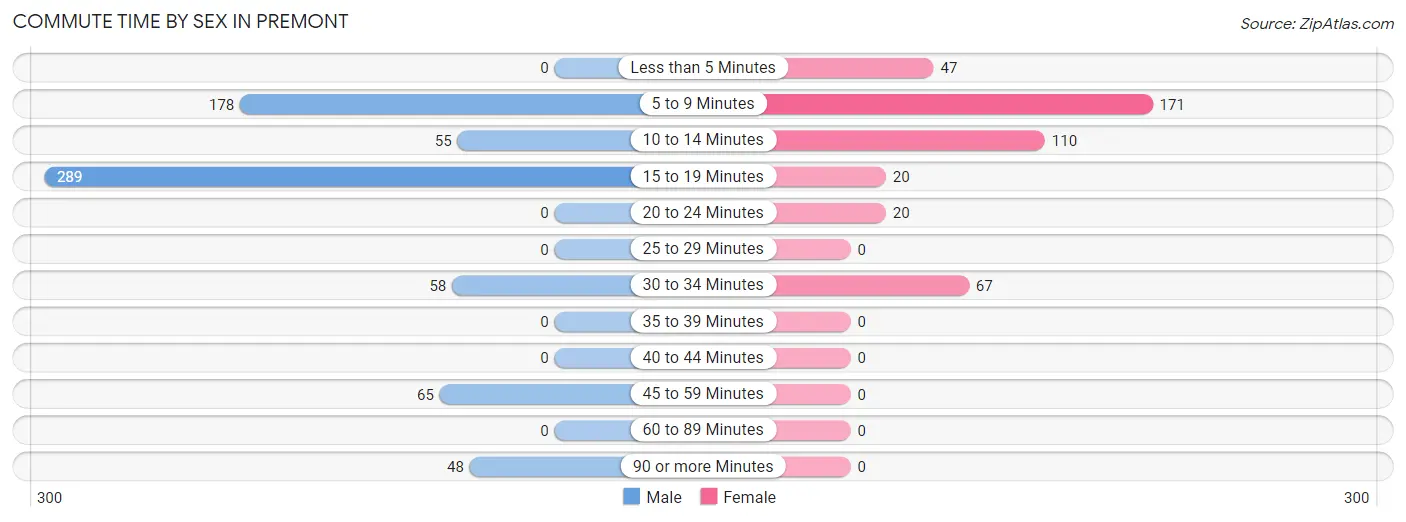
| Commute Time | Male | Female |
| Less than 5 Minutes | 0 (0.0%) | 47 (10.8%) |
| 5 to 9 Minutes | 178 (25.7%) | 171 (39.3%) |
| 10 to 14 Minutes | 55 (7.9%) | 110 (25.3%) |
| 15 to 19 Minutes | 289 (41.7%) | 20 (4.6%) |
| 20 to 24 Minutes | 0 (0.0%) | 20 (4.6%) |
| 25 to 29 Minutes | 0 (0.0%) | 0 (0.0%) |
| 30 to 34 Minutes | 58 (8.4%) | 67 (15.4%) |
| 35 to 39 Minutes | 0 (0.0%) | 0 (0.0%) |
| 40 to 44 Minutes | 0 (0.0%) | 0 (0.0%) |
| 45 to 59 Minutes | 65 (9.4%) | 0 (0.0%) |
| 60 to 89 Minutes | 0 (0.0%) | 0 (0.0%) |
| 90 or more Minutes | 48 (6.9%) | 0 (0.0%) |
Time of Departure to Work by Sex in Premont
The most frequent times of departure to work in Premont are 7:30 AM to 7:59 AM (284, 41.0%) for males and 7:00 AM to 7:29 AM (102, 23.4%) for females.
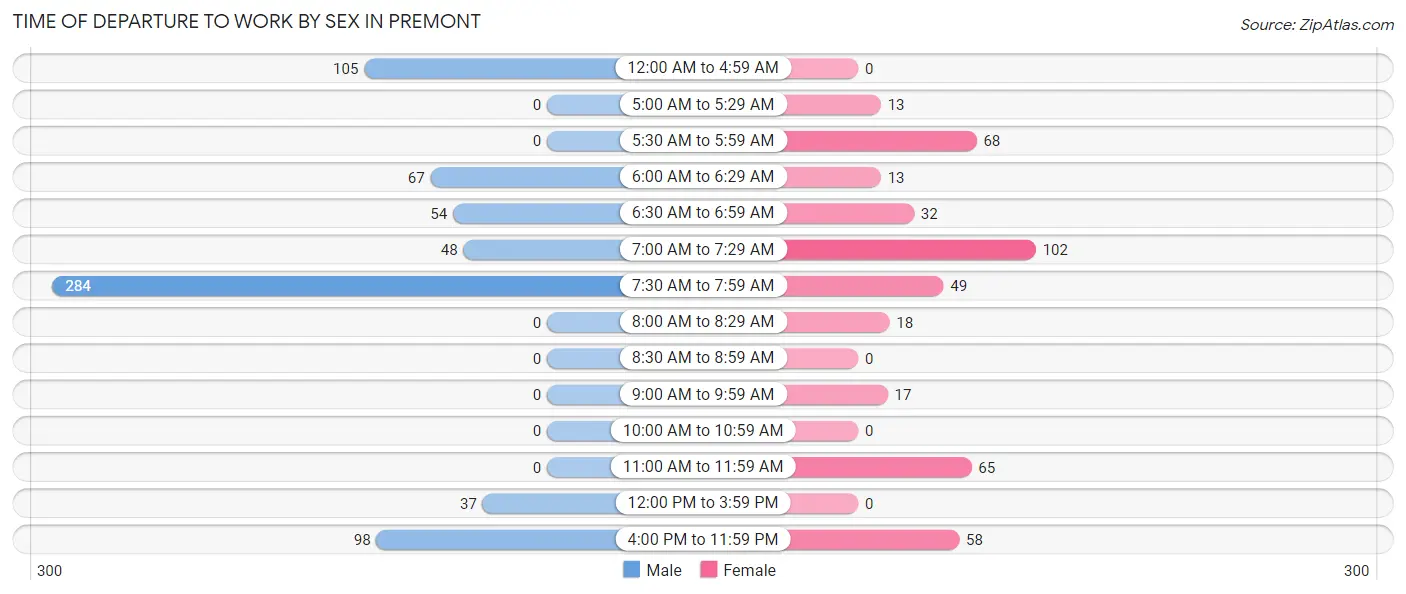
| Time of Departure | Male | Female |
| 12:00 AM to 4:59 AM | 105 (15.1%) | 0 (0.0%) |
| 5:00 AM to 5:29 AM | 0 (0.0%) | 13 (3.0%) |
| 5:30 AM to 5:59 AM | 0 (0.0%) | 68 (15.6%) |
| 6:00 AM to 6:29 AM | 67 (9.7%) | 13 (3.0%) |
| 6:30 AM to 6:59 AM | 54 (7.8%) | 32 (7.4%) |
| 7:00 AM to 7:29 AM | 48 (6.9%) | 102 (23.4%) |
| 7:30 AM to 7:59 AM | 284 (41.0%) | 49 (11.3%) |
| 8:00 AM to 8:29 AM | 0 (0.0%) | 18 (4.1%) |
| 8:30 AM to 8:59 AM | 0 (0.0%) | 0 (0.0%) |
| 9:00 AM to 9:59 AM | 0 (0.0%) | 17 (3.9%) |
| 10:00 AM to 10:59 AM | 0 (0.0%) | 0 (0.0%) |
| 11:00 AM to 11:59 AM | 0 (0.0%) | 65 (14.9%) |
| 12:00 PM to 3:59 PM | 37 (5.3%) | 0 (0.0%) |
| 4:00 PM to 11:59 PM | 98 (14.1%) | 58 (13.3%) |
| Total | 693 (100.0%) | 435 (100.0%) |
Housing Occupancy in Premont
Occupancy by Ownership in Premont
Of the total 1,086 dwellings in Premont, owner-occupied units account for 656 (60.4%), while renter-occupied units make up 430 (39.6%).
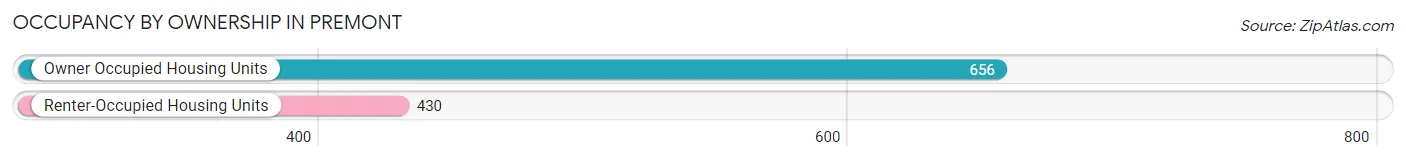
| Occupancy | # Housing Units | % Housing Units |
| Owner Occupied Housing Units | 656 | 60.4% |
| Renter-Occupied Housing Units | 430 | 39.6% |
| Total Occupied Housing Units | 1,086 | 100.0% |
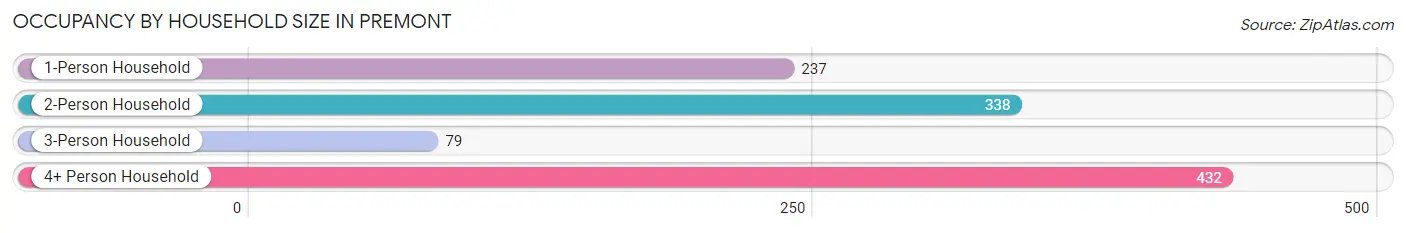
Occupancy by Household Size in Premont
| Household Size | # Housing Units | % Housing Units |
| 1-Person Household | 237 | 21.8% |
| 2-Person Household | 338 | 31.1% |
| 3-Person Household | 79 | 7.3% |
| 4+ Person Household | 432 | 39.8% |
| Total Housing Units | 1,086 | 100.0% |
Occupancy by Ownership by Household Size in Premont
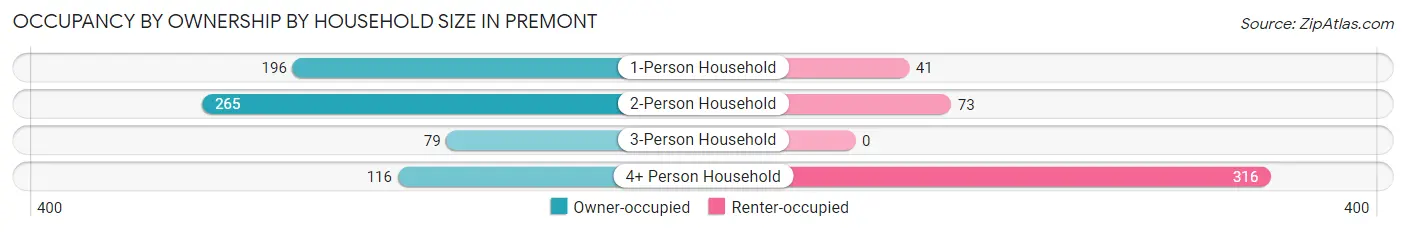
| Household Size | Owner-occupied | Renter-occupied |
| 1-Person Household | 196 (82.7%) | 41 (17.3%) |
| 2-Person Household | 265 (78.4%) | 73 (21.6%) |
| 3-Person Household | 79 (100.0%) | 0 (0.0%) |
| 4+ Person Household | 116 (26.9%) | 316 (73.2%) |
| Total Housing Units | 656 (60.4%) | 430 (39.6%) |
Occupancy by Educational Attainment in Premont
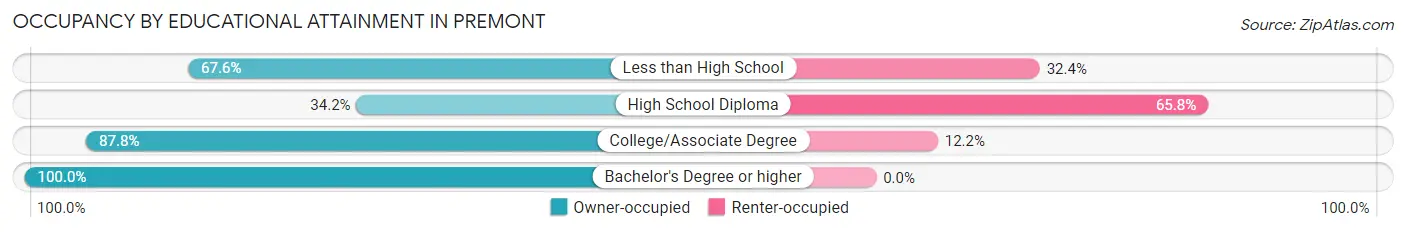
| Household Size | Owner-occupied | Renter-occupied |
| Less than High School | 225 (67.6%) | 108 (32.4%) |
| High School Diploma | 154 (34.2%) | 296 (65.8%) |
| College/Associate Degree | 187 (87.8%) | 26 (12.2%) |
| Bachelor's Degree or higher | 90 (100.0%) | 0 (0.0%) |
Occupancy by Age of Householder in Premont
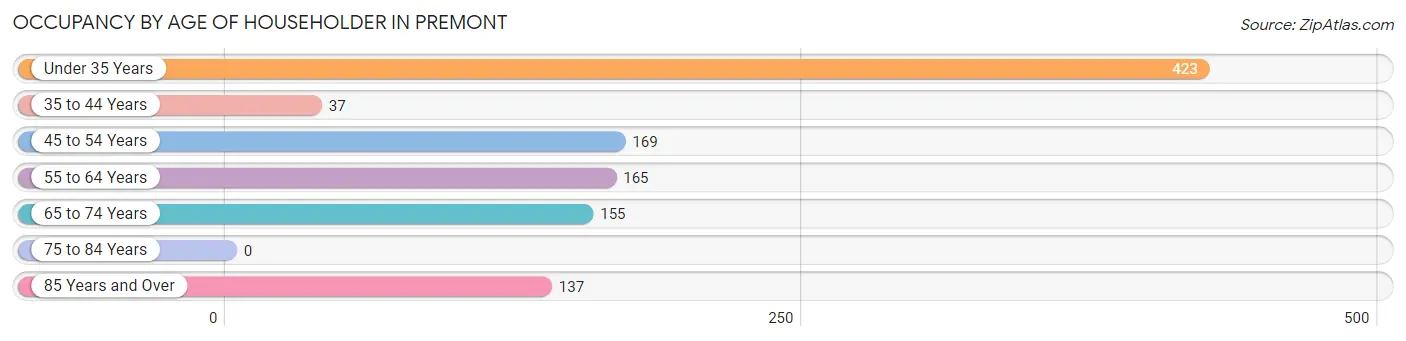
| Age Bracket | # Households | % Households |
| Under 35 Years | 423 | 39.0% |
| 35 to 44 Years | 37 | 3.4% |
| 45 to 54 Years | 169 | 15.6% |
| 55 to 64 Years | 165 | 15.2% |
| 65 to 74 Years | 155 | 14.3% |
| 75 to 84 Years | 0 | 0.0% |
| 85 Years and Over | 137 | 12.6% |
| Total | 1,086 | 100.0% |
Housing Finances in Premont
Median Income by Occupancy in Premont
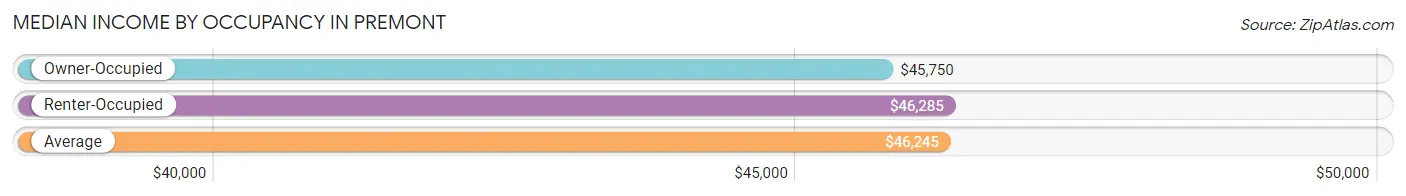
| Occupancy Type | # Households | Median Income |
| Owner-Occupied | 656 (60.4%) | $45,750 |
| Renter-Occupied | 430 (39.6%) | $46,285 |
| Average | 1,086 (100.0%) | $46,245 |
Occupancy by Householder Income Bracket in Premont
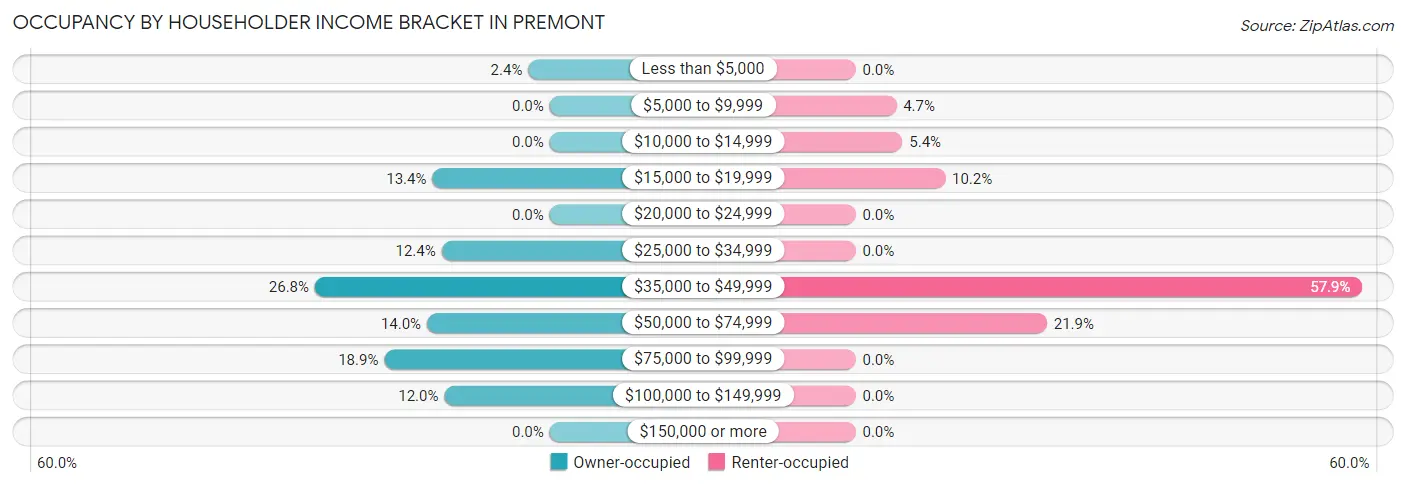
| Income Bracket | Owner-occupied | Renter-occupied |
| Less than $5,000 | 16 (2.4%) | 0 (0.0%) |
| $5,000 to $9,999 | 0 (0.0%) | 20 (4.6%) |
| $10,000 to $14,999 | 0 (0.0%) | 23 (5.3%) |
| $15,000 to $19,999 | 88 (13.4%) | 44 (10.2%) |
| $20,000 to $24,999 | 0 (0.0%) | 0 (0.0%) |
| $25,000 to $34,999 | 81 (12.3%) | 0 (0.0%) |
| $35,000 to $49,999 | 176 (26.8%) | 249 (57.9%) |
| $50,000 to $74,999 | 92 (14.0%) | 94 (21.9%) |
| $75,000 to $99,999 | 124 (18.9%) | 0 (0.0%) |
| $100,000 to $149,999 | 79 (12.0%) | 0 (0.0%) |
| $150,000 or more | 0 (0.0%) | 0 (0.0%) |
| Total | 656 (100.0%) | 430 (100.0%) |
Monthly Housing Cost Tiers in Premont
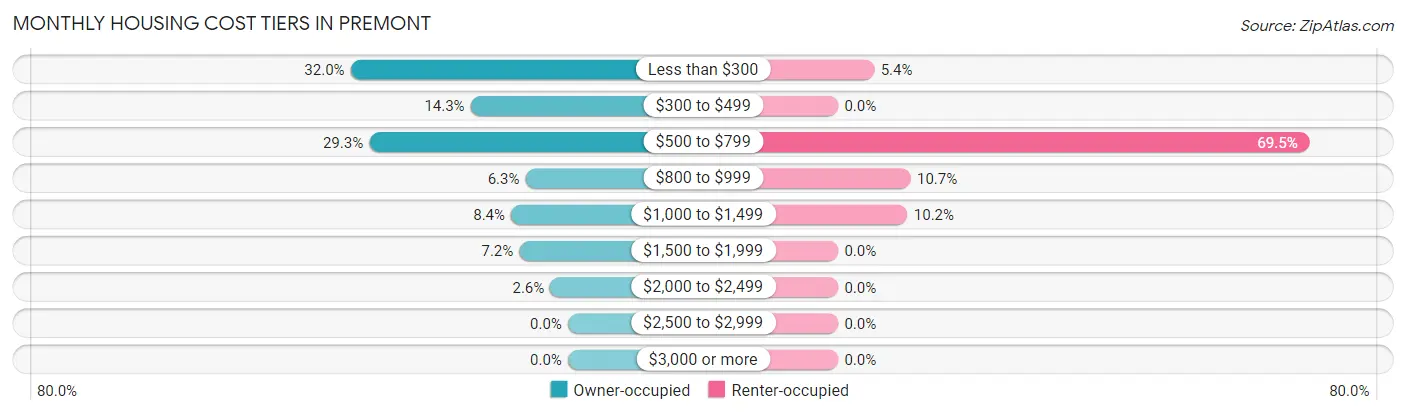
| Monthly Cost | Owner-occupied | Renter-occupied |
| Less than $300 | 210 (32.0%) | 23 (5.3%) |
| $300 to $499 | 94 (14.3%) | 0 (0.0%) |
| $500 to $799 | 192 (29.3%) | 299 (69.5%) |
| $800 to $999 | 41 (6.2%) | 46 (10.7%) |
| $1,000 to $1,499 | 55 (8.4%) | 44 (10.2%) |
| $1,500 to $1,999 | 47 (7.2%) | 0 (0.0%) |
| $2,000 to $2,499 | 17 (2.6%) | 0 (0.0%) |
| $2,500 to $2,999 | 0 (0.0%) | 0 (0.0%) |
| $3,000 or more | 0 (0.0%) | 0 (0.0%) |
| Total | 656 (100.0%) | 430 (100.0%) |
Physical Housing Characteristics in Premont
Housing Structures in Premont
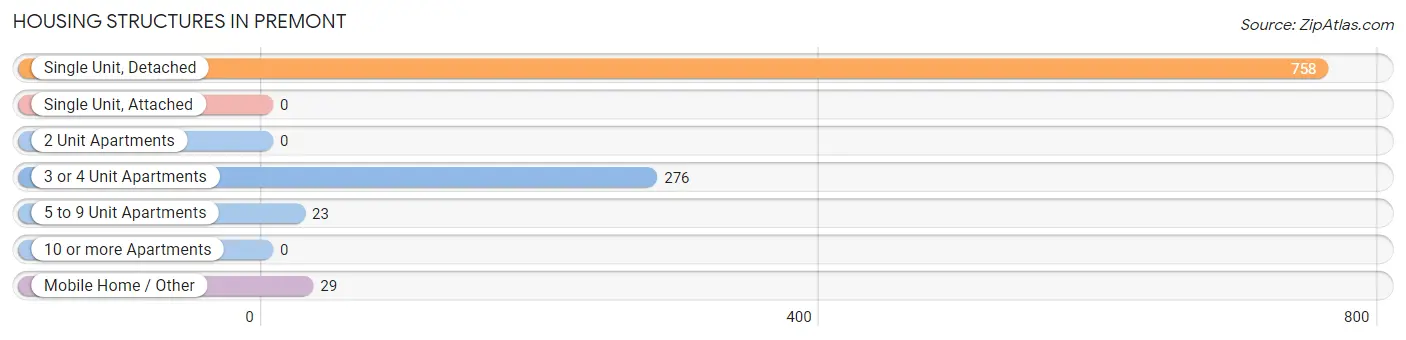
| Structure Type | # Housing Units | % Housing Units |
| Single Unit, Detached | 758 | 69.8% |
| Single Unit, Attached | 0 | 0.0% |
| 2 Unit Apartments | 0 | 0.0% |
| 3 or 4 Unit Apartments | 276 | 25.4% |
| 5 to 9 Unit Apartments | 23 | 2.1% |
| 10 or more Apartments | 0 | 0.0% |
| Mobile Home / Other | 29 | 2.7% |
| Total | 1,086 | 100.0% |
Housing Structures by Occupancy in Premont
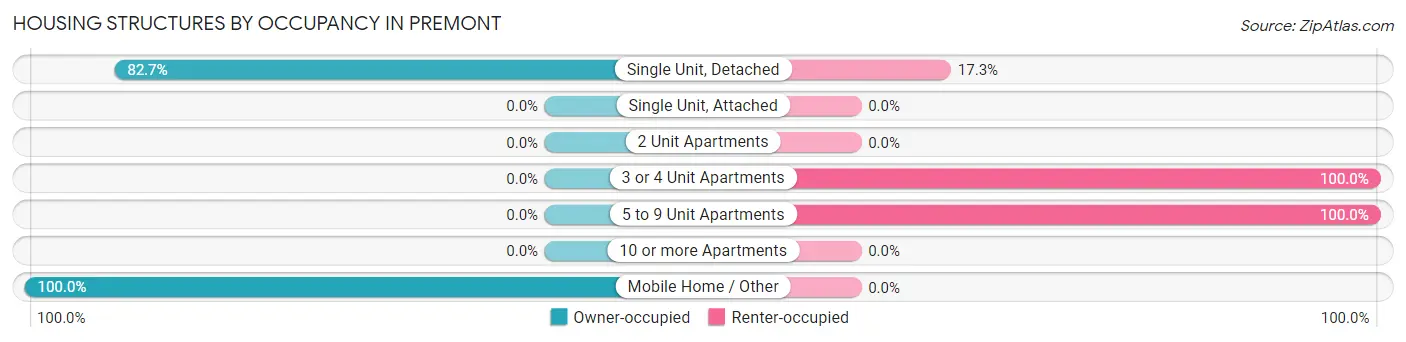
| Structure Type | Owner-occupied | Renter-occupied |
| Single Unit, Detached | 627 (82.7%) | 131 (17.3%) |
| Single Unit, Attached | 0 (0.0%) | 0 (0.0%) |
| 2 Unit Apartments | 0 (0.0%) | 0 (0.0%) |
| 3 or 4 Unit Apartments | 0 (0.0%) | 276 (100.0%) |
| 5 to 9 Unit Apartments | 0 (0.0%) | 23 (100.0%) |
| 10 or more Apartments | 0 (0.0%) | 0 (0.0%) |
| Mobile Home / Other | 29 (100.0%) | 0 (0.0%) |
| Total | 656 (60.4%) | 430 (39.6%) |
Housing Structures by Number of Rooms in Premont
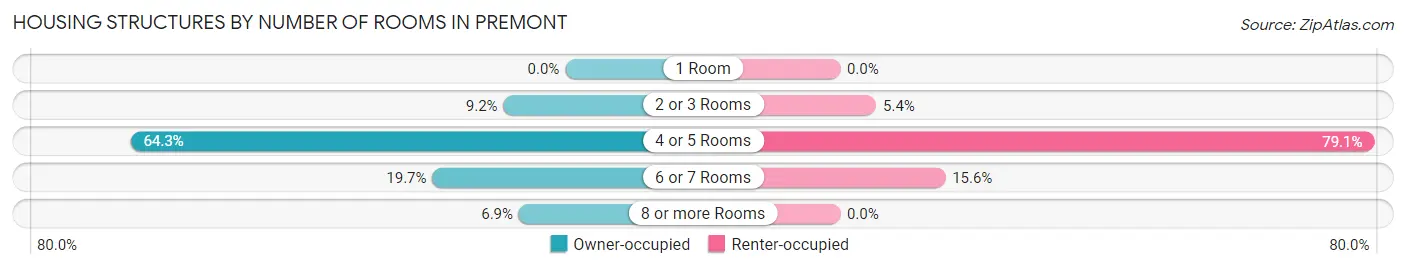
| Number of Rooms | Owner-occupied | Renter-occupied |
| 1 Room | 0 (0.0%) | 0 (0.0%) |
| 2 or 3 Rooms | 60 (9.1%) | 23 (5.3%) |
| 4 or 5 Rooms | 422 (64.3%) | 340 (79.1%) |
| 6 or 7 Rooms | 129 (19.7%) | 67 (15.6%) |
| 8 or more Rooms | 45 (6.9%) | 0 (0.0%) |
| Total | 656 (100.0%) | 430 (100.0%) |
Housing Structure by Heating Type in Premont

| Heating Type | Owner-occupied | Renter-occupied |
| Utility Gas | 243 (37.0%) | 0 (0.0%) |
| Bottled, Tank, or LP Gas | 0 (0.0%) | 0 (0.0%) |
| Electricity | 413 (63.0%) | 430 (100.0%) |
| Fuel Oil or Kerosene | 0 (0.0%) | 0 (0.0%) |
| Coal or Coke | 0 (0.0%) | 0 (0.0%) |
| All other Fuels | 0 (0.0%) | 0 (0.0%) |
| No Fuel Used | 0 (0.0%) | 0 (0.0%) |
| Total | 656 (100.0%) | 430 (100.0%) |
Household Vehicle Usage in Premont
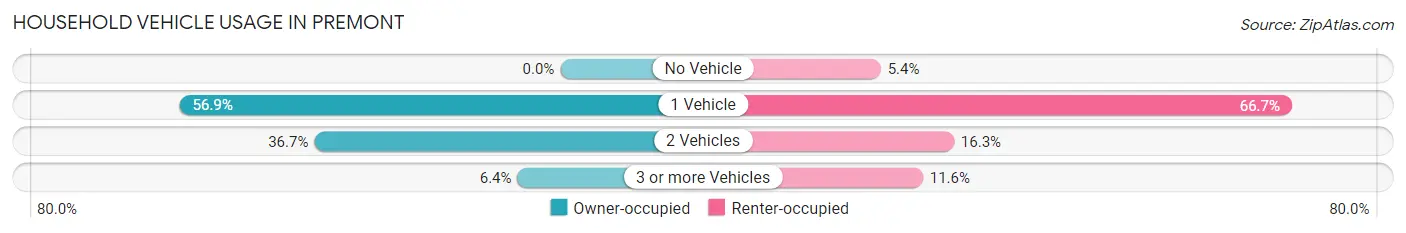
| Vehicles per Household | Owner-occupied | Renter-occupied |
| No Vehicle | 0 (0.0%) | 23 (5.3%) |
| 1 Vehicle | 373 (56.9%) | 287 (66.7%) |
| 2 Vehicles | 241 (36.7%) | 70 (16.3%) |
| 3 or more Vehicles | 42 (6.4%) | 50 (11.6%) |
| Total | 656 (100.0%) | 430 (100.0%) |
Real Estate & Mortgages in Premont
Real Estate and Mortgage Overview in Premont
| Characteristic | Without Mortgage | With Mortgage |
| Housing Units | 441 | 215 |
| Median Property Value | $81,500 | $0 |
| Median Household Income | $41,135 | $0 |
| Monthly Housing Costs | $338 | $0 |
| Real Estate Taxes | - | - |
Property Value by Mortgage Status in Premont
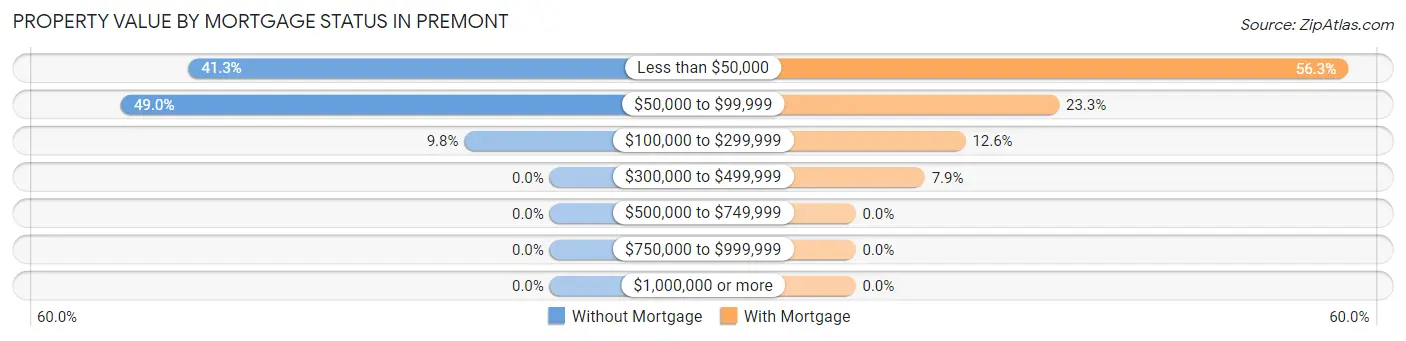
| Property Value | Without Mortgage | With Mortgage |
| Less than $50,000 | 182 (41.3%) | 121 (56.3%) |
| $50,000 to $99,999 | 216 (49.0%) | 50 (23.3%) |
| $100,000 to $299,999 | 43 (9.8%) | 27 (12.6%) |
| $300,000 to $499,999 | 0 (0.0%) | 17 (7.9%) |
| $500,000 to $749,999 | 0 (0.0%) | 0 (0.0%) |
| $750,000 to $999,999 | 0 (0.0%) | 0 (0.0%) |
| $1,000,000 or more | 0 (0.0%) | 0 (0.0%) |
| Total | 441 (100.0%) | 215 (100.0%) |
Household Income by Mortgage Status in Premont
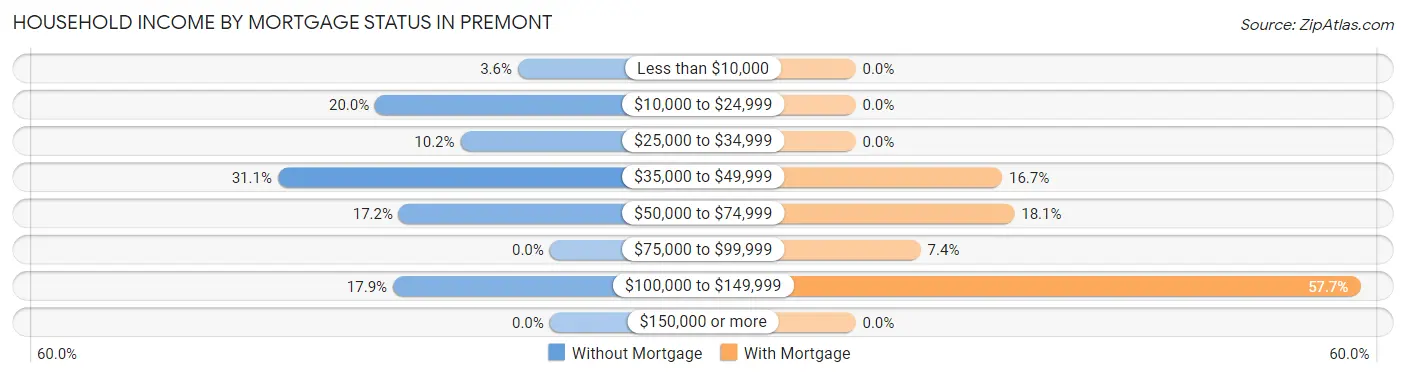
| Household Income | Without Mortgage | With Mortgage |
| Less than $10,000 | 16 (3.6%) | 0 (0.0%) |
| $10,000 to $24,999 | 88 (20.0%) | 0 (0.0%) |
| $25,000 to $34,999 | 45 (10.2%) | 0 (0.0%) |
| $35,000 to $49,999 | 137 (31.1%) | 36 (16.7%) |
| $50,000 to $74,999 | 76 (17.2%) | 39 (18.1%) |
| $75,000 to $99,999 | 0 (0.0%) | 16 (7.4%) |
| $100,000 to $149,999 | 79 (17.9%) | 124 (57.7%) |
| $150,000 or more | 0 (0.0%) | 0 (0.0%) |
| Total | 441 (100.0%) | 215 (100.0%) |
Property Value to Household Income Ratio in Premont
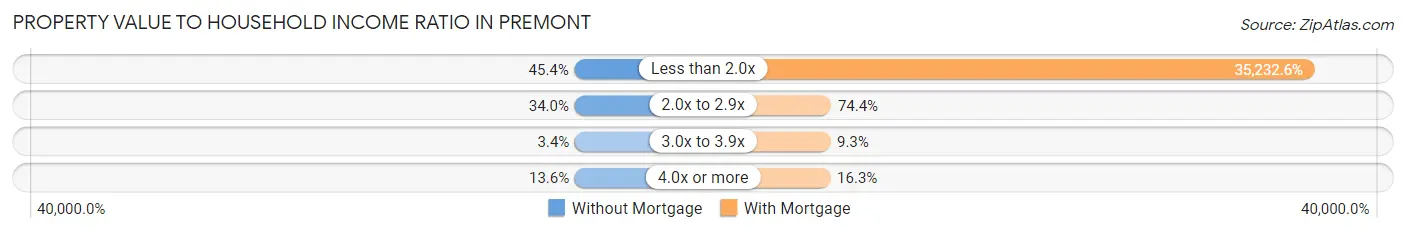
| Value-to-Income Ratio | Without Mortgage | With Mortgage |
| Less than 2.0x | 200 (45.4%) | 75,750 (35,232.6%) |
| 2.0x to 2.9x | 150 (34.0%) | 160 (74.4%) |
| 3.0x to 3.9x | 15 (3.4%) | 20 (9.3%) |
| 4.0x or more | 60 (13.6%) | 35 (16.3%) |
| Total | 441 (100.0%) | 215 (100.0%) |
Real Estate Taxes by Mortgage Status in Premont
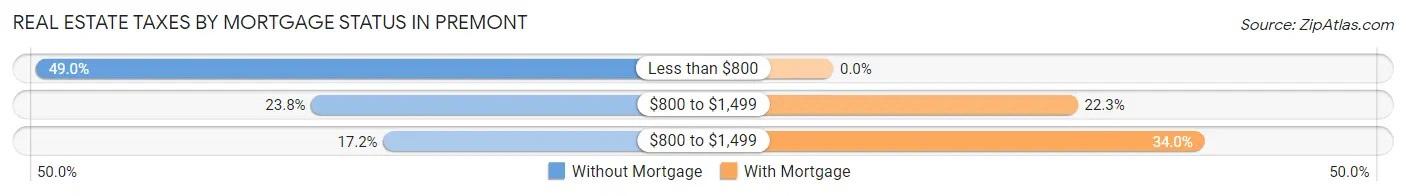
| Property Taxes | Without Mortgage | With Mortgage |
| Less than $800 | 216 (49.0%) | 0 (0.0%) |
| $800 to $1,499 | 105 (23.8%) | 48 (22.3%) |
| $800 to $1,499 | 76 (17.2%) | 73 (34.0%) |
| Total | 441 (100.0%) | 215 (100.0%) |
Health & Disability in Premont
Health Insurance Coverage by Age in Premont
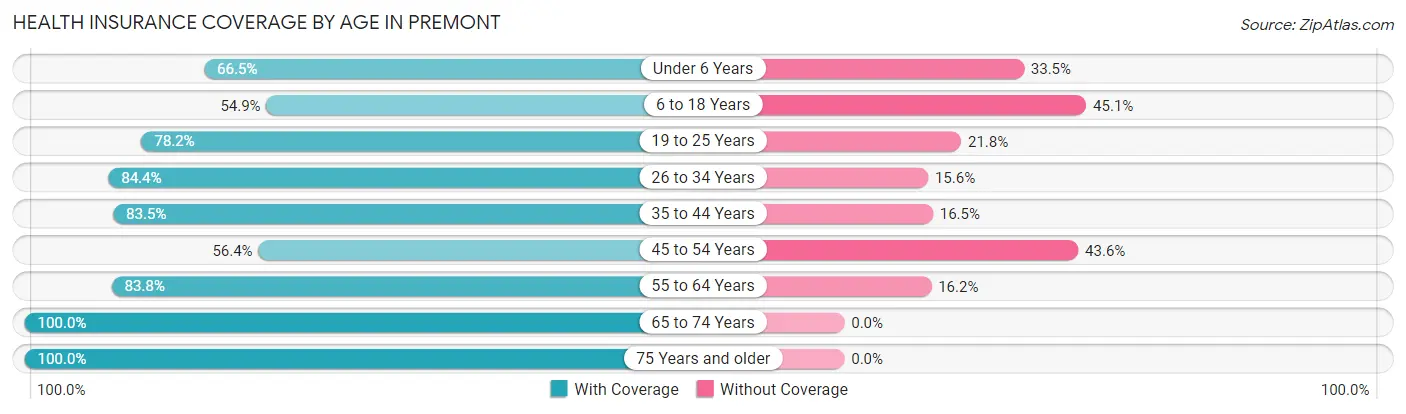
| Age Bracket | With Coverage | Without Coverage |
| Under 6 Years | 153 (66.5%) | 77 (33.5%) |
| 6 to 18 Years | 224 (54.9%) | 184 (45.1%) |
| 19 to 25 Years | 596 (78.2%) | 166 (21.8%) |
| 26 to 34 Years | 227 (84.4%) | 42 (15.6%) |
| 35 to 44 Years | 86 (83.5%) | 17 (16.5%) |
| 45 to 54 Years | 150 (56.4%) | 116 (43.6%) |
| 55 to 64 Years | 274 (83.8%) | 53 (16.2%) |
| 65 to 74 Years | 238 (100.0%) | 0 (0.0%) |
| 75 Years and older | 176 (100.0%) | 0 (0.0%) |
| Total | 2,124 (76.4%) | 655 (23.6%) |
Health Insurance Coverage by Citizenship Status in Premont
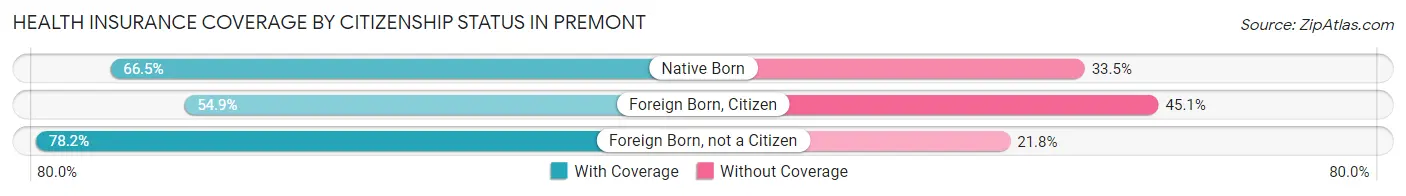
| Citizenship Status | With Coverage | Without Coverage |
| Native Born | 153 (66.5%) | 77 (33.5%) |
| Foreign Born, Citizen | 224 (54.9%) | 184 (45.1%) |
| Foreign Born, not a Citizen | 596 (78.2%) | 166 (21.8%) |
Health Insurance Coverage by Household Income in Premont
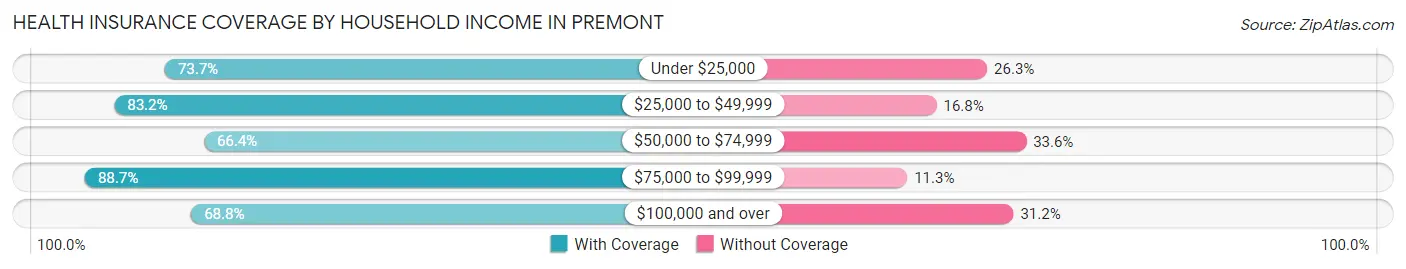
| Household Income | With Coverage | Without Coverage |
| Under $25,000 | 241 (73.7%) | 86 (26.3%) |
| $25,000 to $49,999 | 797 (83.2%) | 161 (16.8%) |
| $50,000 to $74,999 | 476 (66.4%) | 241 (33.6%) |
| $75,000 to $99,999 | 337 (88.7%) | 43 (11.3%) |
| $100,000 and over | 273 (68.8%) | 124 (31.2%) |
Public vs Private Health Insurance Coverage by Age in Premont
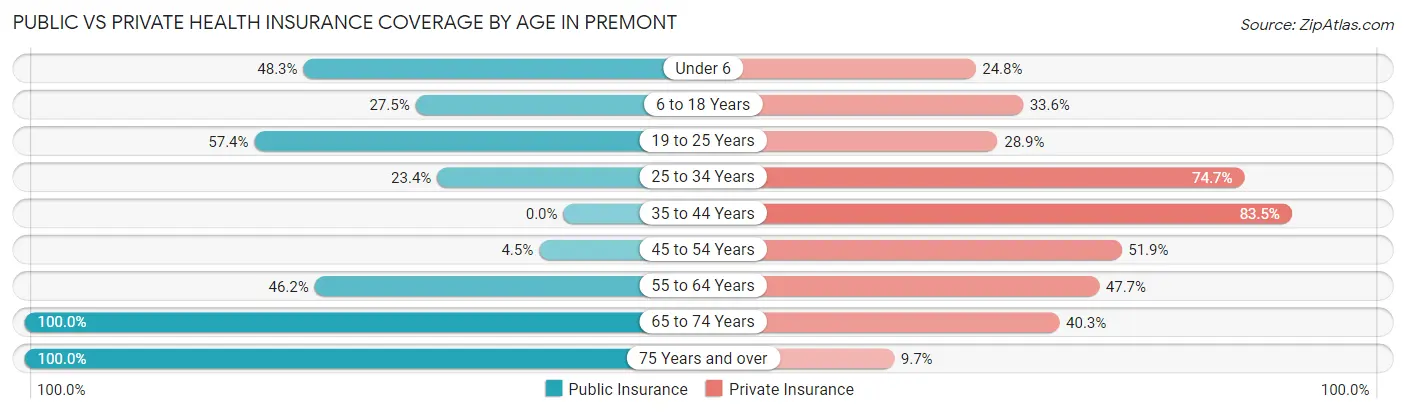
| Age Bracket | Public Insurance | Private Insurance |
| Under 6 | 111 (48.3%) | 57 (24.8%) |
| 6 to 18 Years | 112 (27.5%) | 137 (33.6%) |
| 19 to 25 Years | 437 (57.4%) | 220 (28.9%) |
| 25 to 34 Years | 63 (23.4%) | 201 (74.7%) |
| 35 to 44 Years | 0 (0.0%) | 86 (83.5%) |
| 45 to 54 Years | 12 (4.5%) | 138 (51.9%) |
| 55 to 64 Years | 151 (46.2%) | 156 (47.7%) |
| 65 to 74 Years | 238 (100.0%) | 96 (40.3%) |
| 75 Years and over | 176 (100.0%) | 17 (9.7%) |
| Total | 1,300 (46.8%) | 1,108 (39.9%) |
Disability Status by Sex by Age in Premont
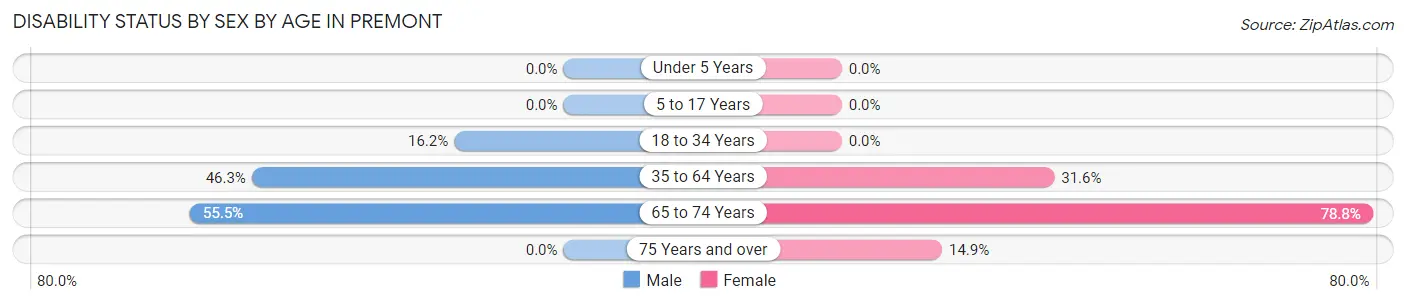
| Age Bracket | Male | Female |
| Under 5 Years | 0 (0.0%) | 0 (0.0%) |
| 5 to 17 Years | 0 (0.0%) | 0 (0.0%) |
| 18 to 34 Years | 112 (16.2%) | 0 (0.0%) |
| 35 to 64 Years | 174 (46.3%) | 101 (31.6%) |
| 65 to 74 Years | 56 (55.4%) | 108 (78.8%) |
| 75 Years and over | 0 (0.0%) | 21 (14.9%) |
Disability Class by Sex by Age in Premont
Disability Class: Hearing Difficulty
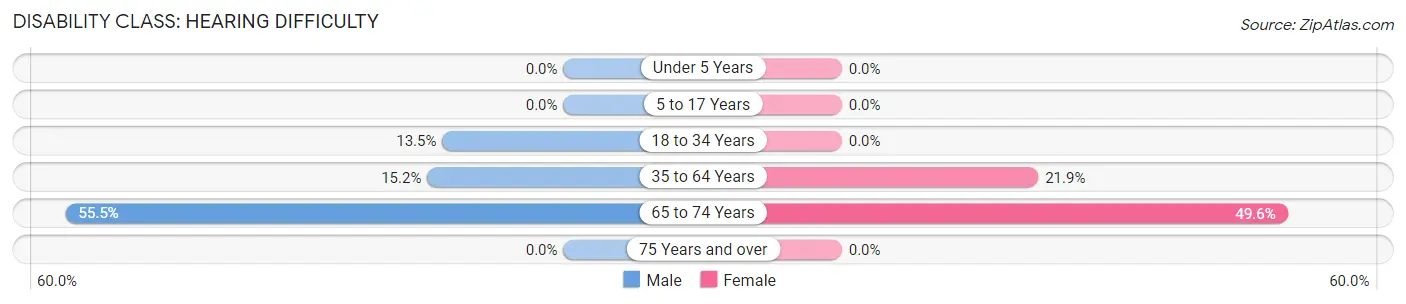
| Age Bracket | Male | Female |
| Under 5 Years | 0 (0.0%) | 0 (0.0%) |
| 5 to 17 Years | 0 (0.0%) | 0 (0.0%) |
| 18 to 34 Years | 93 (13.5%) | 0 (0.0%) |
| 35 to 64 Years | 57 (15.2%) | 70 (21.9%) |
| 65 to 74 Years | 56 (55.4%) | 68 (49.6%) |
| 75 Years and over | 0 (0.0%) | 0 (0.0%) |
Disability Class: Vision Difficulty
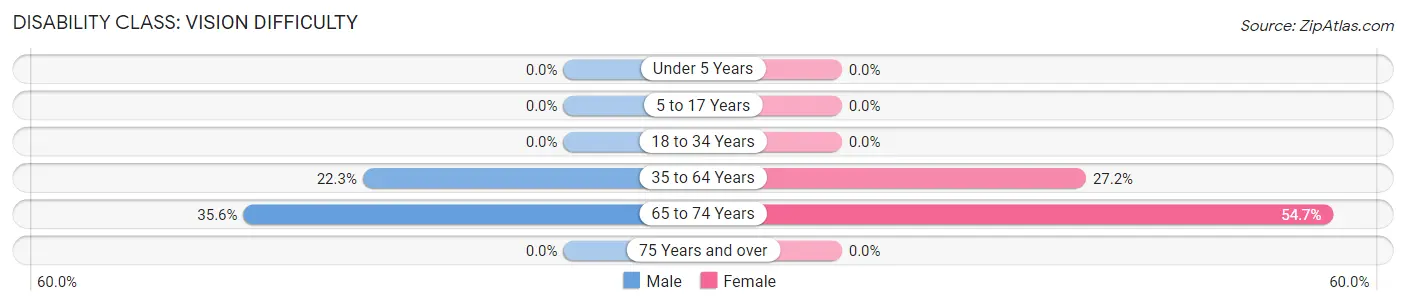
| Age Bracket | Male | Female |
| Under 5 Years | 0 (0.0%) | 0 (0.0%) |
| 5 to 17 Years | 0 (0.0%) | 0 (0.0%) |
| 18 to 34 Years | 0 (0.0%) | 0 (0.0%) |
| 35 to 64 Years | 84 (22.3%) | 87 (27.2%) |
| 65 to 74 Years | 36 (35.6%) | 75 (54.7%) |
| 75 Years and over | 0 (0.0%) | 0 (0.0%) |
Disability Class: Cognitive Difficulty
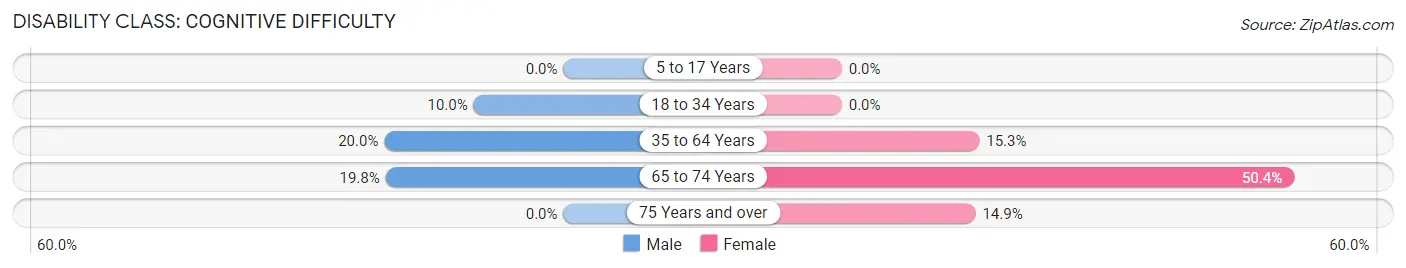
| Age Bracket | Male | Female |
| 5 to 17 Years | 0 (0.0%) | 0 (0.0%) |
| 18 to 34 Years | 69 (10.0%) | 0 (0.0%) |
| 35 to 64 Years | 75 (20.0%) | 49 (15.3%) |
| 65 to 74 Years | 20 (19.8%) | 69 (50.4%) |
| 75 Years and over | 0 (0.0%) | 21 (14.9%) |
Disability Class: Ambulatory Difficulty
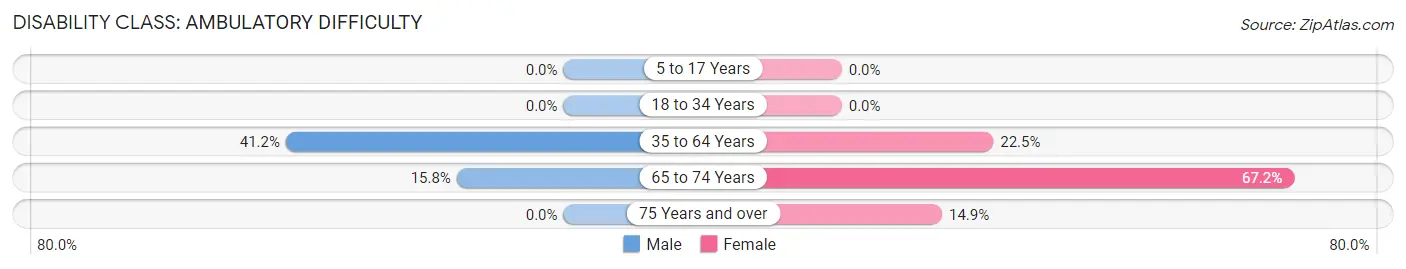
| Age Bracket | Male | Female |
| 5 to 17 Years | 0 (0.0%) | 0 (0.0%) |
| 18 to 34 Years | 0 (0.0%) | 0 (0.0%) |
| 35 to 64 Years | 155 (41.2%) | 72 (22.5%) |
| 65 to 74 Years | 16 (15.8%) | 92 (67.1%) |
| 75 Years and over | 0 (0.0%) | 21 (14.9%) |
Disability Class: Self-Care Difficulty
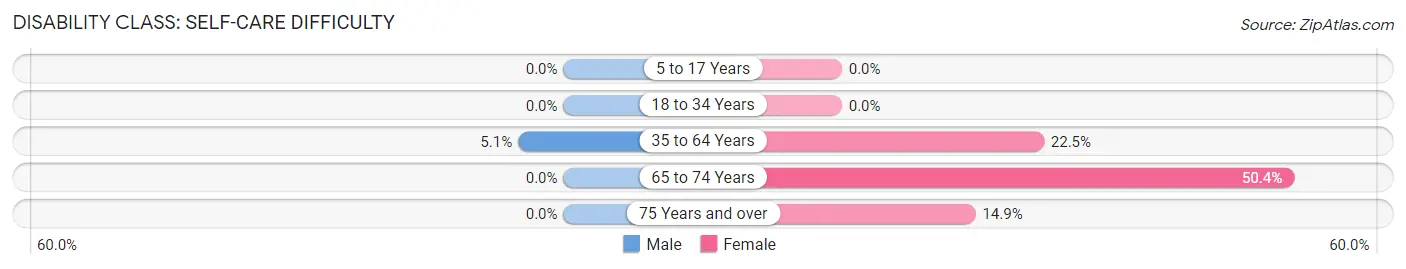
| Age Bracket | Male | Female |
| 5 to 17 Years | 0 (0.0%) | 0 (0.0%) |
| 18 to 34 Years | 0 (0.0%) | 0 (0.0%) |
| 35 to 64 Years | 19 (5.1%) | 72 (22.5%) |
| 65 to 74 Years | 0 (0.0%) | 69 (50.4%) |
| 75 Years and over | 0 (0.0%) | 21 (14.9%) |
Technology Access in Premont
Computing Device Access in Premont
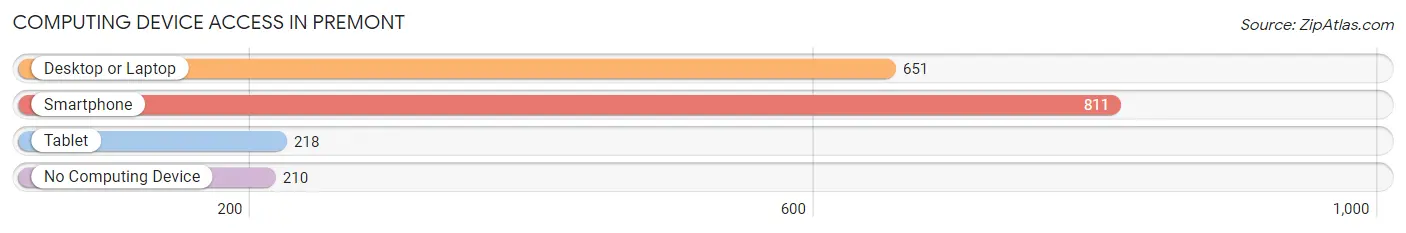
| Device Type | # Households | % Households |
| Desktop or Laptop | 651 | 59.9% |
| Smartphone | 811 | 74.7% |
| Tablet | 218 | 20.1% |
| No Computing Device | 210 | 19.3% |
| Total | 1,086 | 100.0% |
Internet Access in Premont
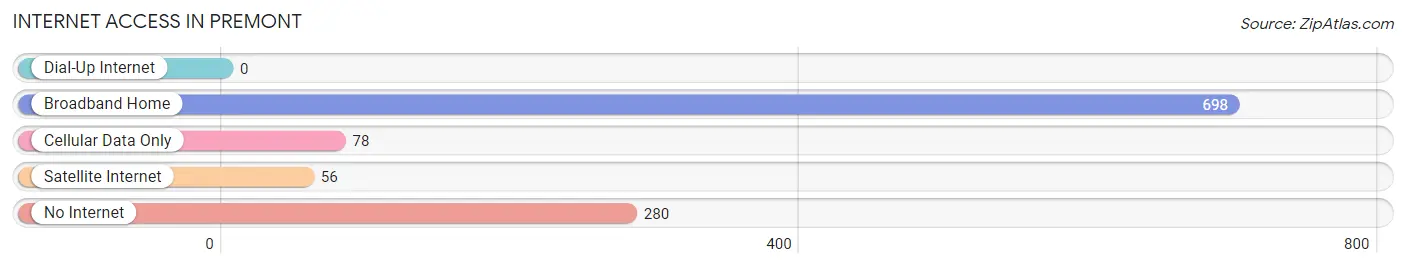
| Internet Type | # Households | % Households |
| Dial-Up Internet | 0 | 0.0% |
| Broadband Home | 698 | 64.3% |
| Cellular Data Only | 78 | 7.2% |
| Satellite Internet | 56 | 5.2% |
| No Internet | 280 | 25.8% |
| Total | 1,086 | 100.0% |
Premont Summary
PreMont, Texas is a small city located in Jim Wells County, Texas. It is situated about 20 miles south of Alice, Texas and about 30 miles north of Corpus Christi, Texas. The population of PreMont was estimated to be 2,845 in 2019.
History
PreMont was founded in 1891 by the Southern Pacific Railroad. The town was named after the railroad's president, William PreMont. The town was originally a stop on the railroad line, but it quickly grew into a small farming community. The town was incorporated in 1909.
In the early 1900s, PreMont was a thriving agricultural community. Cotton, corn, and sorghum were the main crops grown in the area. The town also had a number of businesses, including a bank, a hotel, a general store, and a blacksmith shop.
In the 1950s, PreMont began to experience a decline in population as many of its residents moved away to larger cities. The town's population dropped from a peak of 3,000 in 1950 to just over 2,000 in 2000.
Geography
PreMont is located in the Coastal Plains region of Texas. The town is situated on the banks of the Nueces River, which flows through the area. The terrain is mostly flat, with some rolling hills in the area. The climate is subtropical, with hot summers and mild winters.
Economy
The economy of PreMont is largely based on agriculture. Cotton, corn, and sorghum are still grown in the area, as well as other crops such as watermelons and cantaloupes. The town also has a number of businesses, including a grocery store, a hardware store, and a few restaurants.
Demographics
As of the 2019 census, the population of PreMont was 2,845. The racial makeup of the town was 79.3% White, 0.7% African American, 0.2% Native American, 0.2% Asian, 0.1% Pacific Islander, 17.7% from other races, and 1.9% from two or more races. Hispanic or Latino of any race were 33.2% of the population.
The median household income in PreMont was $30,938, and the median family income was $35,938. The per capita income was $14,938. About 20.3% of the population was below the poverty line.
Conclusion
PreMont, Texas is a small city located in Jim Wells County, Texas. It was founded in 1891 by the Southern Pacific Railroad and has a population of 2,845 as of 2019. The economy of PreMont is largely based on agriculture, with cotton, corn, and sorghum being the main crops grown in the area. The town also has a number of businesses, including a grocery store, a hardware store, and a few restaurants. The racial makeup of the town is 79.3% White, 0.7% African American, 0.2% Native American, 0.2% Asian, 0.1% Pacific Islander, 17.7% from other races, and 1.9% from two or more races. The median household income in PreMont was $30,938, and the median family income was $35,938. About 20.3% of the population was below the poverty line.
Common Questions
What is Per Capita Income in Premont?
Per Capita income in Premont is $21,167.
What is the Median Family Income in Premont?
Median Family Income in Premont is $47,119.
What is the Median Household income in Premont?
Median Household Income in Premont is $46,245.
What is Income or Wage Gap in Premont?
Income or Wage Gap in Premont is 54.2%.
Women in Premont earn 45.8 cents for every dollar earned by a man.
What is Family Income Deficit in Premont?
Family Income Deficit in Premont is $2,988.
Families that are below poverty line in Premont earn $2,988 less on average than the poverty threshold level.
What is Inequality or Gini Index in Premont?
Inequality or Gini Index in Premont is 0.30.
What is the Total Population of Premont?
Total Population of Premont is 2,810.
What is the Total Male Population of Premont?
Total Male Population of Premont is 1,629.
What is the Total Female Population of Premont?
Total Female Population of Premont is 1,181.
What is the Ratio of Males per 100 Females in Premont?
There are 137.93 Males per 100 Females in Premont.
What is the Ratio of Females per 100 Males in Premont?
There are 72.50 Females per 100 Males in Premont.
What is the Median Population Age in Premont?
Median Population Age in Premont is 27.1 Years.
What is the Average Family Size in Premont
Average Family Size in Premont is 3.0 People.
What is the Average Household Size in Premont
Average Household Size in Premont is 2.6 People.
How Large is the Labor Force in Premont?
There are 1,362 People in the Labor Forcein in Premont.
What is the Percentage of People in the Labor Force in Premont?
58.6% of People are in the Labor Force in Premont.
What is the Unemployment Rate in Premont?
Unemployment Rate in Premont is 15.7%.