Zip Codes with the Highest Percentage of Population with a Degree in Literature and Languages in Texas
RELATED REPORTS & OPTIONS
Literature and Languages
Texas
Compare Zip Codes
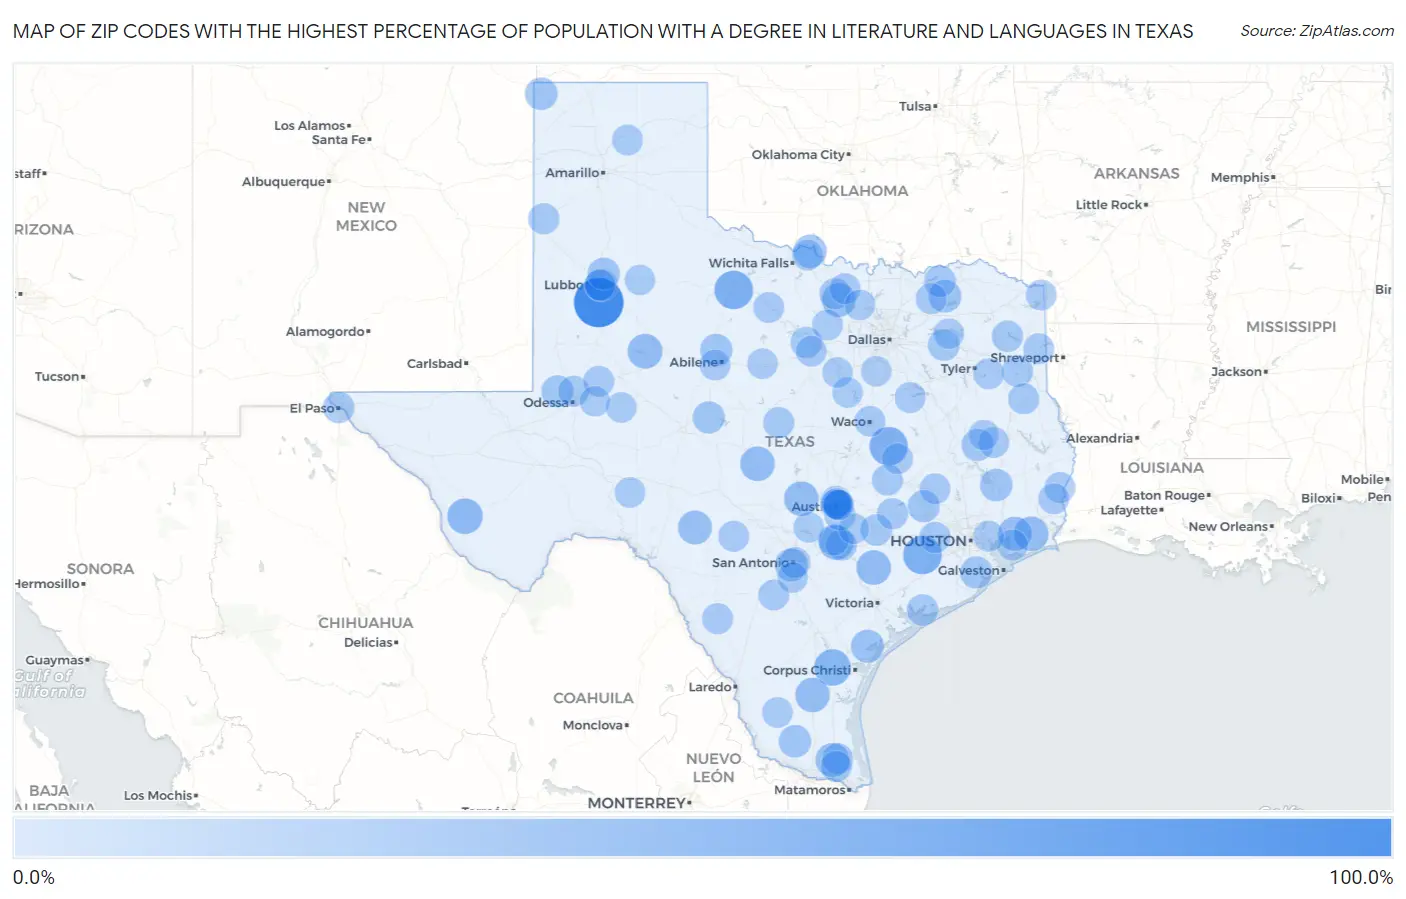
Map of Zip Codes with the Highest Percentage of Population with a Degree in Literature and Languages in Texas
0.0%
100.0%
Zip Codes with the Highest Percentage of Population with a Degree in Literature and Languages in Texas
| Zip Code | % Graduates | vs State | vs National | |
| 1. | 79383 | 100.0% | 3.4%(+96.6)#1 | 4.4%(+95.6)#15 |
| 2. | 77454 | 47.5% | 3.4%(+44.0)#2 | 4.4%(+43.0)#82 |
| 3. | 76363 | 47.4% | 3.4%(+43.9)#3 | 4.4%(+43.0)#84 |
| 4. | 76680 | 46.2% | 3.4%(+42.7)#4 | 4.4%(+41.7)#89 |
| 5. | 78339 | 37.1% | 3.4%(+33.7)#5 | 4.4%(+32.7)#135 |
| 6. | 79843 | 32.6% | 3.4%(+29.2)#6 | 4.4%(+28.2)#175 |
| 7. | 78661 | 28.8% | 3.4%(+25.4)#7 | 4.4%(+24.4)#215 |
| 8. | 79527 | 28.6% | 3.4%(+25.1)#8 | 4.4%(+24.2)#222 |
| 9. | 77987 | 28.6% | 3.4%(+25.1)#9 | 4.4%(+24.2)#223 |
| 10. | 76842 | 28.0% | 3.4%(+24.6)#10 | 4.4%(+23.6)#232 |
| 11. | 77622 | 28.0% | 3.4%(+24.5)#11 | 4.4%(+23.6)#233 |
| 12. | 78663 | 27.5% | 3.4%(+24.0)#12 | 4.4%(+23.1)#243 |
| 13. | 78375 | 27.4% | 3.4%(+24.0)#13 | 4.4%(+23.0)#246 |
| 14. | 77560 | 25.5% | 3.4%(+22.0)#14 | 4.4%(+21.1)#293 |
| 15. | 78594 | 25.4% | 3.4%(+22.0)#15 | 4.4%(+21.0)#296 |
| 16. | 78880 | 25.2% | 3.4%(+21.8)#16 | 4.4%(+20.8)#298 |
| 17. | 76225 | 25.1% | 3.4%(+21.7)#17 | 4.4%(+20.7)#300 |
| 18. | 76357 | 21.8% | 3.4%(+18.4)#18 | 4.4%(+17.4)#403 |
| 19. | 78340 | 21.4% | 3.4%(+18.0)#19 | 4.4%(+17.0)#419 |
| 20. | 79411 | 19.7% | 3.4%(+16.3)#20 | 4.4%(+15.3)#491 |
| 21. | 75469 | 19.5% | 3.4%(+16.1)#21 | 4.4%(+15.1)#501 |
| 22. | 78225 | 19.5% | 3.4%(+16.1)#22 | 4.4%(+15.1)#502 |
| 23. | 77335 | 18.7% | 3.4%(+15.3)#23 | 4.4%(+14.3)#538 |
| 24. | 79087 | 18.6% | 3.4%(+15.2)#24 | 4.4%(+14.2)#541 |
| 25. | 78536 | 18.5% | 3.4%(+15.1)#25 | 4.4%(+14.1)#547 |
| 26. | 79525 | 17.9% | 3.4%(+14.4)#26 | 4.4%(+13.5)#581 |
| 27. | 79350 | 17.6% | 3.4%(+14.2)#27 | 4.4%(+13.2)#591 |
| 28. | 76875 | 16.9% | 3.4%(+13.5)#28 | 4.4%(+12.5)#638 |
| 29. | 75856 | 16.9% | 3.4%(+13.4)#29 | 4.4%(+12.5)#643 |
| 30. | 77577 | 16.5% | 3.4%(+13.0)#30 | 4.4%(+12.1)#670 |
| 31. | 77880 | 16.4% | 3.4%(+13.0)#31 | 4.4%(+12.0)#676 |
| 32. | 79741 | 15.9% | 3.4%(+12.5)#32 | 4.4%(+11.5)#732 |
| 33. | 75446 | 15.0% | 3.4%(+11.5)#33 | 4.4%(+10.6)#819 |
| 34. | 75117 | 14.6% | 3.4%(+11.2)#34 | 4.4%(+10.2)#856 |
| 35. | 78963 | 13.6% | 3.4%(+10.1)#35 | 4.4%(+9.15)#971 |
| 36. | 79901 | 13.5% | 3.4%(+10.1)#36 | 4.4%(+9.11)#975 |
| 37. | 77465 | 13.3% | 3.4%(+9.90)#37 | 4.4%(+8.93)#1,001 |
| 38. | 75683 | 13.3% | 3.4%(+9.88)#38 | 4.4%(+8.91)#1,010 |
| 39. | 76484 | 13.3% | 3.4%(+9.84)#39 | 4.4%(+8.86)#1,015 |
| 40. | 75691 | 13.1% | 3.4%(+9.69)#40 | 4.4%(+8.72)#1,034 |
| 41. | 76270 | 12.7% | 3.4%(+9.24)#41 | 4.4%(+8.27)#1,104 |
| 42. | 79009 | 12.6% | 3.4%(+9.18)#42 | 4.4%(+8.20)#1,118 |
| 43. | 78569 | 12.2% | 3.4%(+8.75)#43 | 4.4%(+7.78)#1,192 |
| 44. | 78648 | 12.0% | 3.4%(+8.56)#44 | 4.4%(+7.59)#1,223 |
| 45. | 77466 | 12.0% | 3.4%(+8.56)#45 | 4.4%(+7.59)#1,225 |
| 46. | 78946 | 11.8% | 3.4%(+8.33)#46 | 4.4%(+7.36)#1,261 |
| 47. | 78535 | 11.8% | 3.4%(+8.33)#47 | 4.4%(+7.36)#1,263 |
| 48. | 78622 | 11.7% | 3.4%(+8.27)#48 | 4.4%(+7.29)#1,283 |
| 49. | 76556 | 11.7% | 3.4%(+8.26)#49 | 4.4%(+7.28)#1,287 |
| 50. | 76864 | 11.7% | 3.4%(+8.24)#50 | 4.4%(+7.27)#1,292 |
| 51. | 79758 | 11.7% | 3.4%(+8.24)#51 | 4.4%(+7.27)#1,293 |
| 52. | 78719 | 11.7% | 3.4%(+8.23)#52 | 4.4%(+7.26)#1,296 |
| 53. | 75975 | 11.6% | 3.4%(+8.17)#53 | 4.4%(+7.20)#1,311 |
| 54. | 75496 | 11.4% | 3.4%(+8.01)#54 | 4.4%(+7.03)#1,342 |
| 55. | 78834 | 11.4% | 3.4%(+7.98)#55 | 4.4%(+7.01)#1,358 |
| 56. | 77514 | 11.2% | 3.4%(+7.72)#56 | 4.4%(+6.74)#1,416 |
| 57. | 76239 | 11.1% | 3.4%(+7.67)#57 | 4.4%(+6.70)#1,426 |
| 58. | 78885 | 11.1% | 3.4%(+7.67)#58 | 4.4%(+6.70)#1,451 |
| 59. | 76487 | 11.1% | 3.4%(+7.64)#59 | 4.4%(+6.67)#1,455 |
| 60. | 79410 | 11.0% | 3.4%(+7.57)#60 | 4.4%(+6.59)#1,469 |
| 61. | 78203 | 11.0% | 3.4%(+7.54)#61 | 4.4%(+6.57)#1,482 |
| 62. | 75933 | 10.9% | 3.4%(+7.49)#62 | 4.4%(+6.51)#1,498 |
| 63. | 78705 | 10.9% | 3.4%(+7.47)#63 | 4.4%(+6.49)#1,501 |
| 64. | 77612 | 10.9% | 3.4%(+7.46)#64 | 4.4%(+6.49)#1,502 |
| 65. | 76681 | 10.9% | 3.4%(+7.43)#65 | 4.4%(+6.46)#1,511 |
| 66. | 75661 | 10.8% | 3.4%(+7.39)#66 | 4.4%(+6.42)#1,521 |
| 67. | 75750 | 10.8% | 3.4%(+7.33)#67 | 4.4%(+6.35)#1,535 |
| 68. | 79782 | 10.7% | 3.4%(+7.31)#68 | 4.4%(+6.33)#1,542 |
| 69. | 77562 | 10.7% | 3.4%(+7.22)#69 | 4.4%(+6.25)#1,573 |
| 70. | 79007 | 10.6% | 3.4%(+7.21)#70 | 4.4%(+6.23)#1,577 |
| 71. | 76377 | 10.6% | 3.4%(+7.17)#71 | 4.4%(+6.20)#1,595 |
| 72. | 79603 | 10.5% | 3.4%(+7.09)#72 | 4.4%(+6.12)#1,619 |
| 73. | 76472 | 10.5% | 3.4%(+7.06)#73 | 4.4%(+6.08)#1,641 |
| 74. | 78757 | 10.5% | 3.4%(+7.04)#74 | 4.4%(+6.07)#1,649 |
| 75. | 75926 | 10.4% | 3.4%(+7.00)#75 | 4.4%(+6.03)#1,658 |
| 76. | 78751 | 10.4% | 3.4%(+6.99)#76 | 4.4%(+6.01)#1,661 |
| 77. | 77830 | 10.4% | 3.4%(+6.97)#77 | 4.4%(+6.00)#1,667 |
| 78. | 76372 | 10.4% | 3.4%(+6.96)#78 | 4.4%(+5.99)#1,671 |
| 79. | 77837 | 10.4% | 3.4%(+6.94)#79 | 4.4%(+5.97)#1,680 |
| 80. | 78005 | 10.4% | 3.4%(+6.94)#80 | 4.4%(+5.97)#1,685 |
| 81. | 75569 | 10.1% | 3.4%(+6.66)#81 | 4.4%(+5.69)#1,778 |
| 82. | 76701 | 9.9% | 3.4%(+6.50)#82 | 4.4%(+5.53)#1,858 |
| 83. | 78722 | 9.9% | 3.4%(+6.50)#83 | 4.4%(+5.53)#1,859 |
| 84. | 78756 | 9.9% | 3.4%(+6.46)#84 | 4.4%(+5.49)#1,872 |
| 85. | 78662 | 9.7% | 3.4%(+6.29)#85 | 4.4%(+5.31)#1,946 |
| 86. | 76437 | 9.6% | 3.4%(+6.21)#86 | 4.4%(+5.24)#1,982 |
| 87. | 78361 | 9.6% | 3.4%(+6.18)#87 | 4.4%(+5.21)#1,991 |
| 88. | 79739 | 9.6% | 3.4%(+6.18)#88 | 4.4%(+5.21)#1,992 |
| 89. | 76249 | 9.6% | 3.4%(+6.17)#89 | 4.4%(+5.20)#1,995 |
| 90. | 78264 | 9.6% | 3.4%(+6.15)#90 | 4.4%(+5.18)#2,001 |
| 91. | 76671 | 9.6% | 3.4%(+6.14)#91 | 4.4%(+5.17)#2,008 |
| 92. | 75440 | 9.5% | 3.4%(+6.05)#92 | 4.4%(+5.08)#2,048 |
| 93. | 76943 | 9.5% | 3.4%(+6.03)#93 | 4.4%(+5.06)#2,060 |
| 94. | 76064 | 9.4% | 3.4%(+5.98)#94 | 4.4%(+5.01)#2,080 |
| 95. | 76077 | 9.4% | 3.4%(+5.96)#95 | 4.4%(+4.99)#2,088 |
| 96. | 78723 | 9.3% | 3.4%(+5.90)#96 | 4.4%(+4.93)#2,129 |
| 97. | 79706 | 9.0% | 3.4%(+5.53)#97 | 4.4%(+4.56)#2,334 |
| 98. | 79322 | 9.0% | 3.4%(+5.53)#98 | 4.4%(+4.55)#2,336 |
| 99. | 75847 | 8.9% | 3.4%(+5.42)#99 | 4.4%(+4.45)#2,394 |
| 100. | 78623 | 8.8% | 3.4%(+5.40)#100 | 4.4%(+4.43)#2,403 |
Common Questions
What are the Top 10 Zip Codes with the Highest Percentage of Population with a Degree in Literature and Languages in Texas?
Top 10 Zip Codes with the Highest Percentage of Population with a Degree in Literature and Languages in Texas are:
What zip code has the Highest Percentage of Population with a Degree in Literature and Languages in Texas?
79383 has the Highest Percentage of Population with a Degree in Literature and Languages in Texas with 100.0%.
What is the Percentage of Population with a Degree in Literature and Languages in the State of Texas?
Percentage of Population with a Degree in Literature and Languages in Texas is 3.4%.
What is the Percentage of Population with a Degree in Literature and Languages in the United States?
Percentage of Population with a Degree in Literature and Languages in the United States is 4.4%.