Zip Codes with the Highest Percentage of Population with a Degree in Literature and Languages in El Paso, TX
RELATED REPORTS & OPTIONS
Literature and Languages
El Paso
Compare Zip Codes
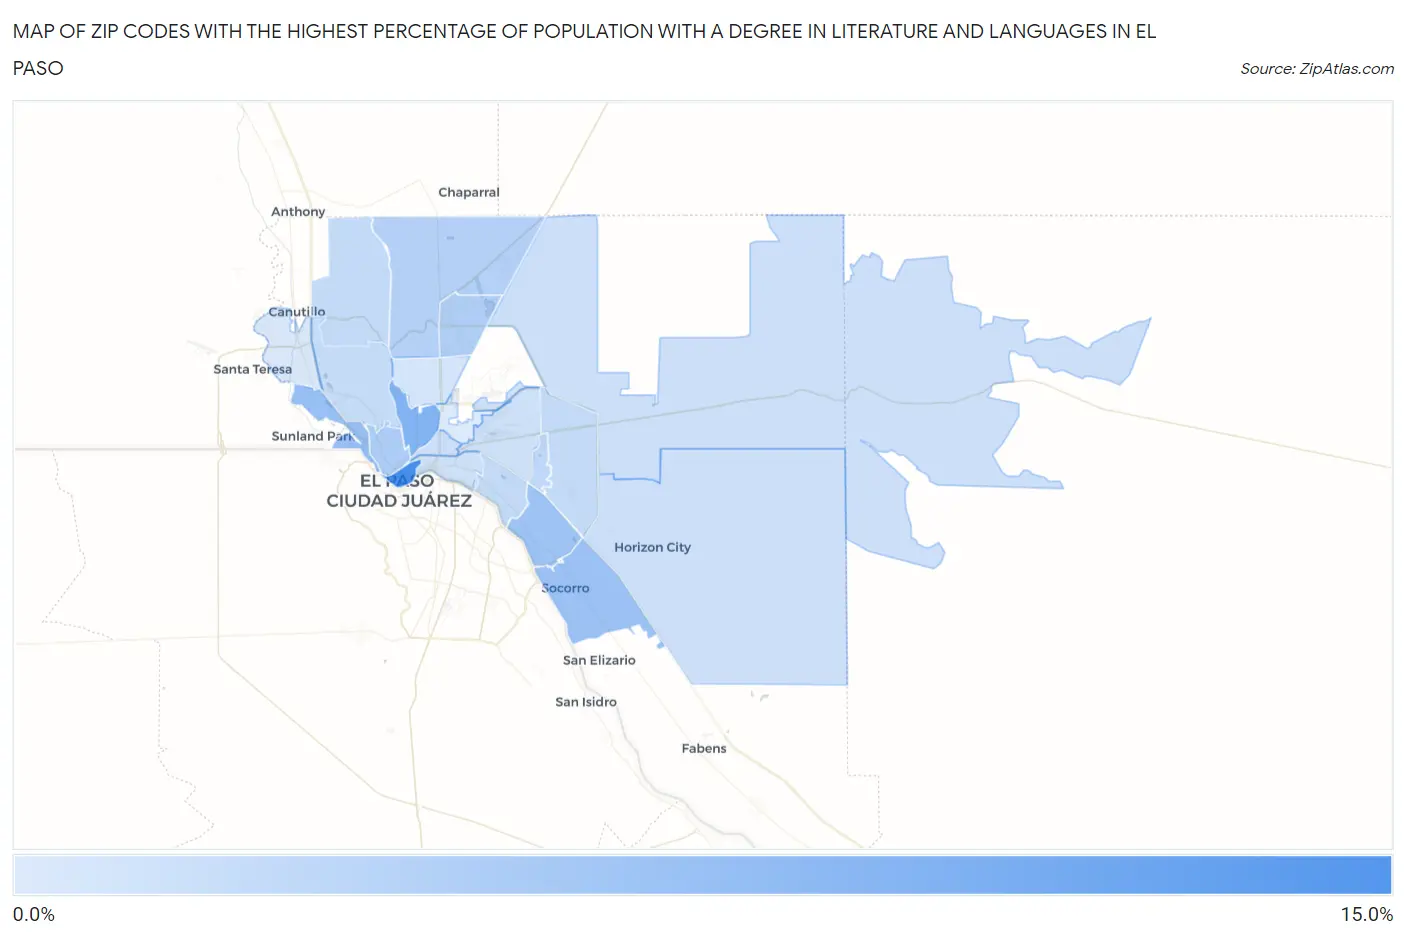
Map of Zip Codes with the Highest Percentage of Population with a Degree in Literature and Languages in El Paso
1.0%
13.5%
Zip Codes with the Highest Percentage of Population with a Degree in Literature and Languages in El Paso, TX
| Zip Code | % Graduates | vs State | vs National | |
| 1. | 79901 | 13.5% | 3.4%(+10.1)#36 | 4.4%(+9.11)#975 |
| 2. | 79930 | 8.5% | 3.4%(+5.09)#114 | 4.4%(+4.11)#2,597 |
| 3. | 79922 | 6.5% | 3.4%(+3.10)#190 | 4.4%(+2.13)#4,591 |
| 4. | 79927 | 6.2% | 3.4%(+2.75)#213 | 4.4%(+1.78)#5,106 |
| 5. | 79907 | 5.9% | 3.4%(+2.51)#226 | 4.4%(+1.54)#5,507 |
| 6. | 79902 | 4.8% | 3.4%(+1.38)#326 | 4.4%(+0.407)#7,850 |
| 7. | 79924 | 4.6% | 3.4%(+1.12)#362 | 4.4%(+0.149)#8,549 |
| 8. | 79934 | 4.3% | 3.4%(+0.886)#405 | 4.4%(-0.087)#9,230 |
| 9. | 79935 | 3.4% | 3.4%(-0.017)#596 | 4.4%(-0.990)#12,115 |
| 10. | 79915 | 3.1% | 3.4%(-0.335)#676 | 4.4%(-1.31)#13,211 |
| 11. | 79936 | 3.1% | 3.4%(-0.360)#682 | 4.4%(-1.33)#13,300 |
| 12. | 79911 | 3.0% | 3.4%(-0.411)#693 | 4.4%(-1.38)#13,494 |
| 13. | 79912 | 2.8% | 3.4%(-0.592)#735 | 4.4%(-1.56)#14,093 |
| 14. | 79903 | 2.5% | 3.4%(-0.953)#833 | 4.4%(-1.93)#15,362 |
| 15. | 79938 | 2.3% | 3.4%(-1.11)#883 | 4.4%(-2.08)#15,960 |
| 16. | 79928 | 2.3% | 3.4%(-1.16)#897 | 4.4%(-2.13)#16,114 |
| 17. | 79905 | 2.2% | 3.4%(-1.25)#919 | 4.4%(-2.22)#16,445 |
| 18. | 79908 | 2.1% | 3.4%(-1.33)#942 | 4.4%(-2.30)#16,702 |
| 19. | 79925 | 2.1% | 3.4%(-1.37)#956 | 4.4%(-2.34)#16,836 |
| 20. | 79904 | 1.7% | 3.4%(-1.73)#1,033 | 4.4%(-2.70)#17,995 |
| 21. | 79932 | 1.4% | 3.4%(-2.03)#1,111 | 4.4%(-3.01)#18,986 |
| 22. | 79906 | 1.0% | 3.4%(-2.42)#1,184 | 4.4%(-3.39)#20,079 |
1
Common Questions
What are the Top 10 Zip Codes with the Highest Percentage of Population with a Degree in Literature and Languages in El Paso, TX?
Top 10 Zip Codes with the Highest Percentage of Population with a Degree in Literature and Languages in El Paso, TX are:
What zip code has the Highest Percentage of Population with a Degree in Literature and Languages in El Paso, TX?
79901 has the Highest Percentage of Population with a Degree in Literature and Languages in El Paso, TX with 13.5%.
What is the Percentage of Population with a Degree in Literature and Languages in El Paso, TX?
Percentage of Population with a Degree in Literature and Languages in El Paso is 3.4%.
What is the Percentage of Population with a Degree in Literature and Languages in Texas?
Percentage of Population with a Degree in Literature and Languages in Texas is 3.4%.
What is the Percentage of Population with a Degree in Literature and Languages in the United States?
Percentage of Population with a Degree in Literature and Languages in the United States is 4.4%.