Bonham, TX Map & Demographics
Bonham Map
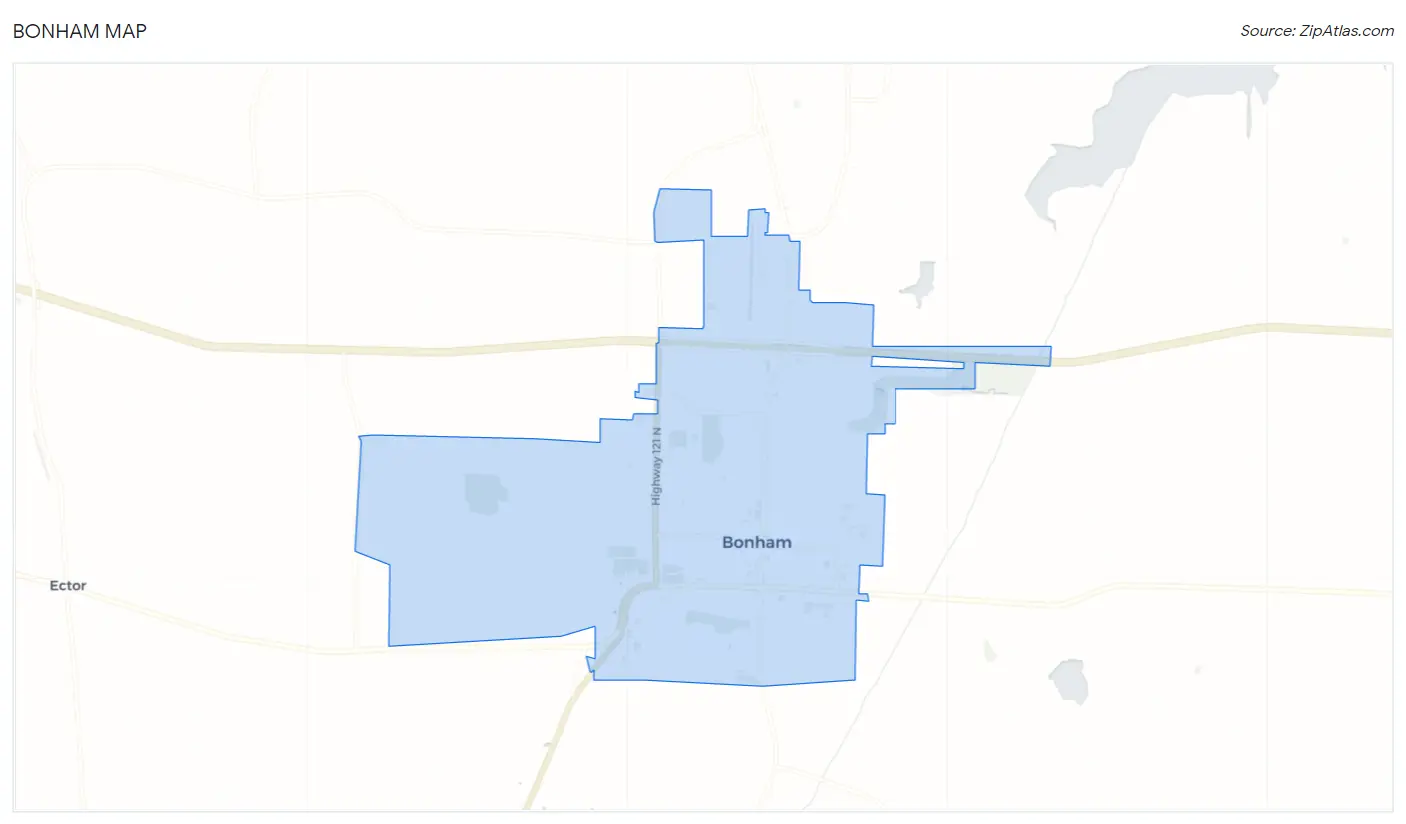
Bonham Overview
$25,520
PER CAPITA INCOME
$59,524
AVG FAMILY INCOME
$53,899
AVG HOUSEHOLD INCOME
5.2%
WAGE / INCOME GAP [ % ]
94.8¢/ $1
WAGE / INCOME GAP [ $ ]
0.52
INEQUALITY / GINI INDEX
10,485
TOTAL POPULATION
6,386
MALE POPULATION
4,099
FEMALE POPULATION
155.79
MALES / 100 FEMALES
64.19
FEMALES / 100 MALES
36.4
MEDIAN AGE
3.2
AVG FAMILY SIZE
2.5
AVG HOUSEHOLD SIZE
3,614
LABOR FORCE [ PEOPLE ]
40.9%
PERCENT IN LABOR FORCE
6.3%
UNEMPLOYMENT RATE
Bonham Zip Codes
Bonham Area Codes
Income in Bonham
Income Overview in Bonham
Per Capita Income in Bonham is $25,520, while median incomes of families and households are $59,524 and $53,899 respectively.
| Characteristic | Number | Measure |
| Per Capita Income | 10,485 | $25,520 |
| Median Family Income | 1,908 | $59,524 |
| Mean Family Income | 1,908 | $100,714 |
| Median Household Income | 3,073 | $53,899 |
| Mean Household Income | 3,073 | $80,451 |
| Income Deficit | 1,908 | $0 |
| Wage / Income Gap (%) | 10,485 | 5.17% |
| Wage / Income Gap ($) | 10,485 | 94.83¢ per $1 |
| Gini / Inequality Index | 10,485 | 0.52 |
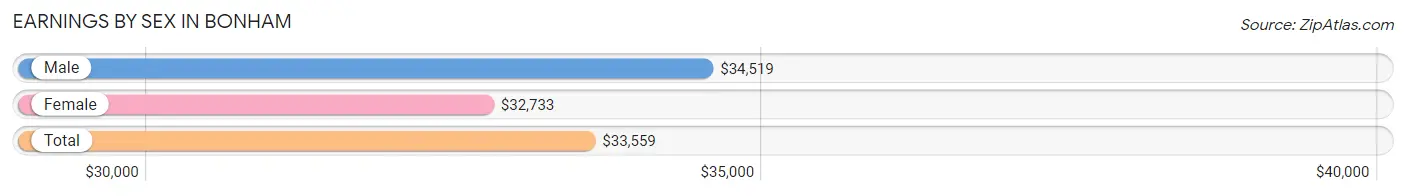
Earnings by Sex in Bonham
Average Earnings in Bonham are $33,559, $34,519 for men and $32,733 for women, a difference of 5.2%.
| Sex | Number | Average Earnings |
| Male | 2,501 (60.4%) | $34,519 |
| Female | 1,638 (39.6%) | $32,733 |
| Total | 4,139 (100.0%) | $33,559 |
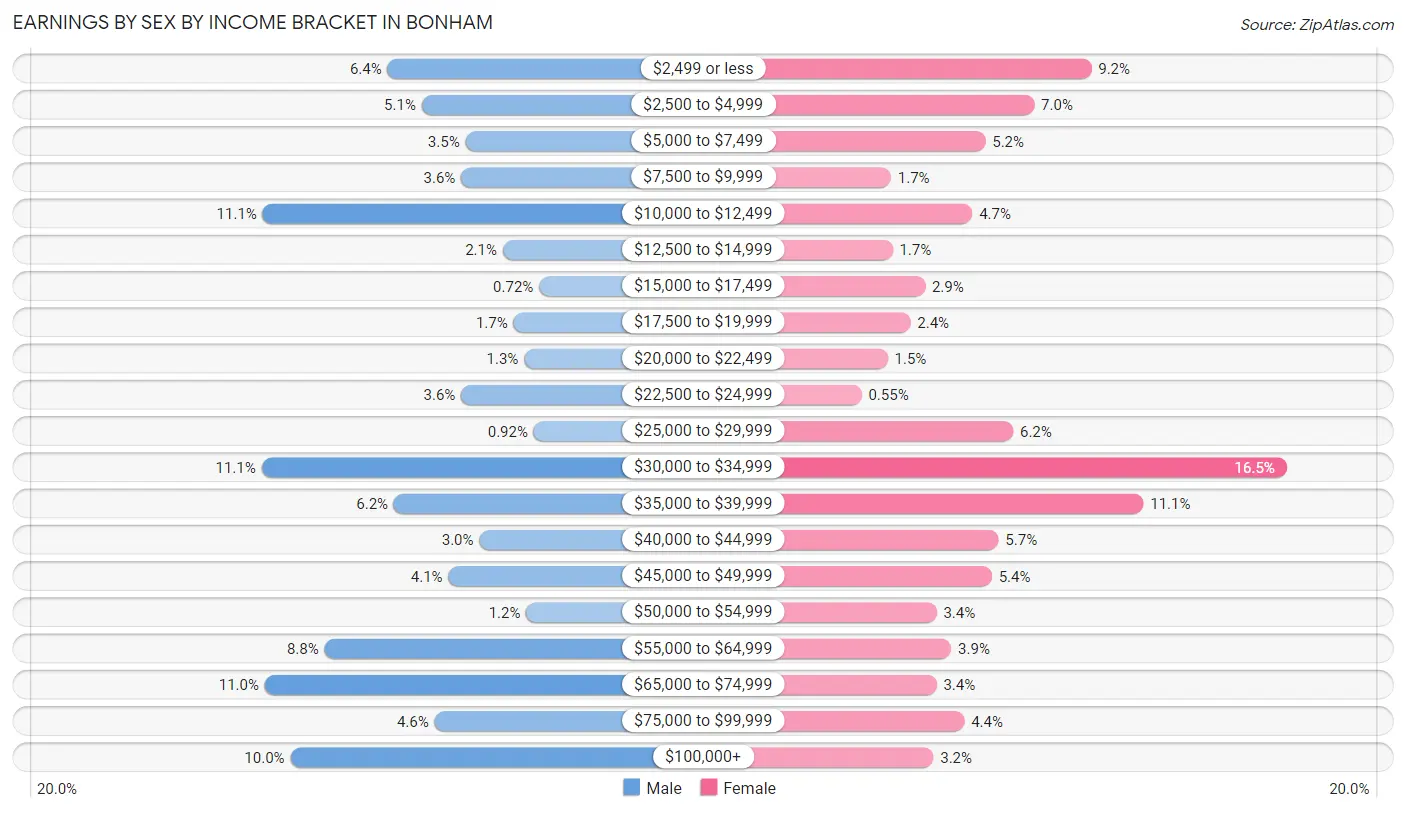
Earnings by Sex by Income Bracket in Bonham
The most common earnings brackets in Bonham are $30,000 to $34,999 for men (278 | 11.1%) and $30,000 to $34,999 for women (270 | 16.5%).
| Income | Male | Female |
| $2,499 or less | 160 (6.4%) | 150 (9.2%) |
| $2,500 to $4,999 | 128 (5.1%) | 115 (7.0%) |
| $5,000 to $7,499 | 87 (3.5%) | 85 (5.2%) |
| $7,500 to $9,999 | 91 (3.6%) | 27 (1.7%) |
| $10,000 to $12,499 | 277 (11.1%) | 77 (4.7%) |
| $12,500 to $14,999 | 52 (2.1%) | 28 (1.7%) |
| $15,000 to $17,499 | 18 (0.7%) | 48 (2.9%) |
| $17,500 to $19,999 | 42 (1.7%) | 39 (2.4%) |
| $20,000 to $22,499 | 32 (1.3%) | 25 (1.5%) |
| $22,500 to $24,999 | 91 (3.6%) | 9 (0.5%) |
| $25,000 to $29,999 | 23 (0.9%) | 102 (6.2%) |
| $30,000 to $34,999 | 278 (11.1%) | 270 (16.5%) |
| $35,000 to $39,999 | 154 (6.2%) | 182 (11.1%) |
| $40,000 to $44,999 | 74 (3.0%) | 93 (5.7%) |
| $45,000 to $49,999 | 103 (4.1%) | 89 (5.4%) |
| $50,000 to $54,999 | 30 (1.2%) | 55 (3.4%) |
| $55,000 to $64,999 | 219 (8.8%) | 64 (3.9%) |
| $65,000 to $74,999 | 275 (11.0%) | 55 (3.4%) |
| $75,000 to $99,999 | 116 (4.6%) | 72 (4.4%) |
| $100,000+ | 251 (10.0%) | 53 (3.2%) |
| Total | 2,501 (100.0%) | 1,638 (100.0%) |
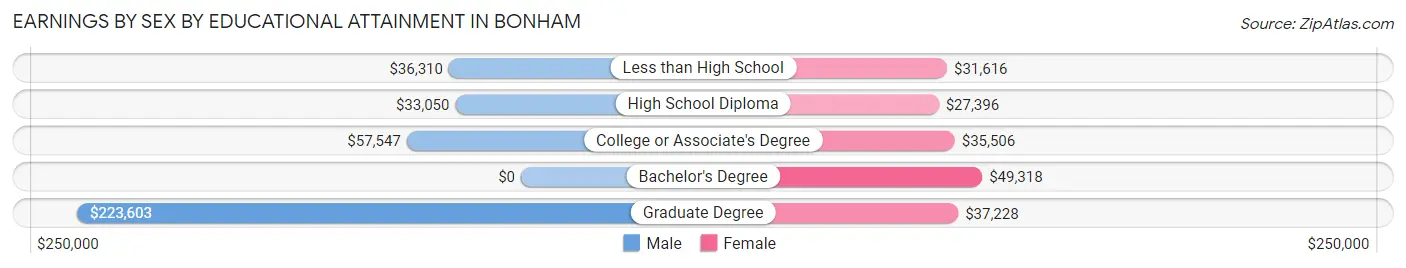
Earnings by Sex by Educational Attainment in Bonham
Average earnings in Bonham are $39,313 for men and $34,433 for women, a difference of 12.4%. Men with an educational attainment of graduate degree enjoy the highest average annual earnings of $223,603, while those with high school diploma education earn the least with $33,050. Women with an educational attainment of bachelor's degree earn the most with the average annual earnings of $49,318, while those with high school diploma education have the smallest earnings of $27,396.
| Educational Attainment | Male Income | Female Income |
| Less than High School | $36,310 | $31,616 |
| High School Diploma | $33,050 | $27,396 |
| College or Associate's Degree | $57,547 | $35,506 |
| Bachelor's Degree | - | - |
| Graduate Degree | $223,603 | $37,228 |
| Total | $39,313 | $34,433 |
Family Income in Bonham
Family Income Brackets in Bonham
According to the Bonham family income data, there are 488 families falling into the $50,000 to $74,999 income range, which is the most common income bracket and makes up 25.6% of all families. Conversely, the $10,000 to $14,999 income bracket is the least frequent group with only 19 families (1.0%) belonging to this category.
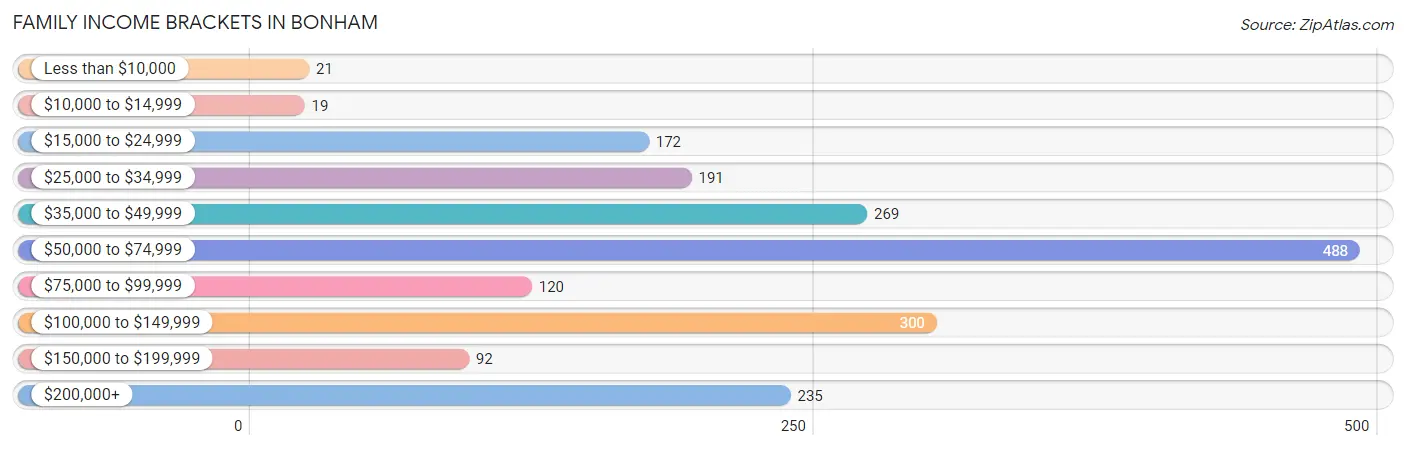
| Income Bracket | # Families | % Families |
| Less than $10,000 | 21 | 1.1% |
| $10,000 to $14,999 | 19 | 1.0% |
| $15,000 to $24,999 | 172 | 9.0% |
| $25,000 to $34,999 | 191 | 10.0% |
| $35,000 to $49,999 | 269 | 14.1% |
| $50,000 to $74,999 | 488 | 25.6% |
| $75,000 to $99,999 | 120 | 6.3% |
| $100,000 to $149,999 | 300 | 15.7% |
| $150,000 to $199,999 | 92 | 4.8% |
| $200,000+ | 235 | 12.3% |
Family Income by Famaliy Size in Bonham
3-person families (439 | 23.0%) account for the highest median family income in Bonham with $98,250 per family, while 3-person families (439 | 23.0%) have the highest median income of $32,750 per family member.
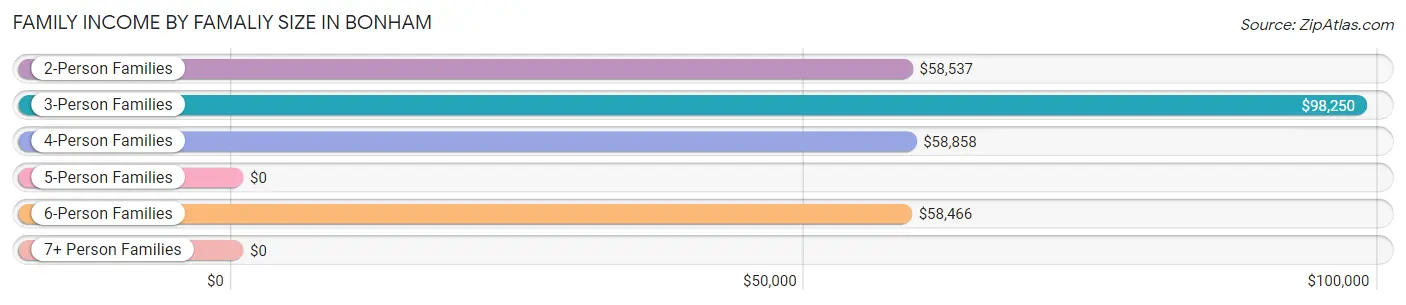
| Income Bracket | # Families | Median Income |
| 2-Person Families | 634 (33.2%) | $58,537 |
| 3-Person Families | 439 (23.0%) | $98,250 |
| 4-Person Families | 641 (33.6%) | $58,858 |
| 5-Person Families | 61 (3.2%) | $0 |
| 6-Person Families | 126 (6.6%) | $58,466 |
| 7+ Person Families | 7 (0.4%) | $0 |
| Total | 1,908 (100.0%) | $59,524 |
Family Income by Number of Earners in Bonham
The median family income in Bonham is $59,524, with families comprising 3+ earners (180) having the highest median family income of $250,001, while families with 1 earner (697) have the lowest median family income of $49,688, accounting for 9.4% and 36.5% of families, respectively.
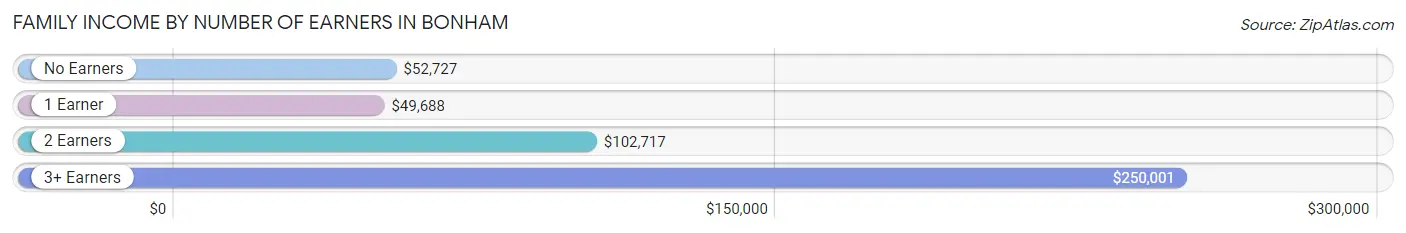
| Number of Earners | # Families | Median Income |
| No Earners | 278 (14.6%) | $52,727 |
| 1 Earner | 697 (36.5%) | $49,688 |
| 2 Earners | 753 (39.5%) | $102,717 |
| 3+ Earners | 180 (9.4%) | $250,001 |
| Total | 1,908 (100.0%) | $59,524 |
Household Income in Bonham
Household Income Brackets in Bonham
With 734 households falling in the category, the $50,000 to $74,999 income range is the most frequent in Bonham, accounting for 23.9% of all households. In contrast, only 108 households (3.5%) fall into the $150,000 to $199,999 income bracket, making it the least populous group.
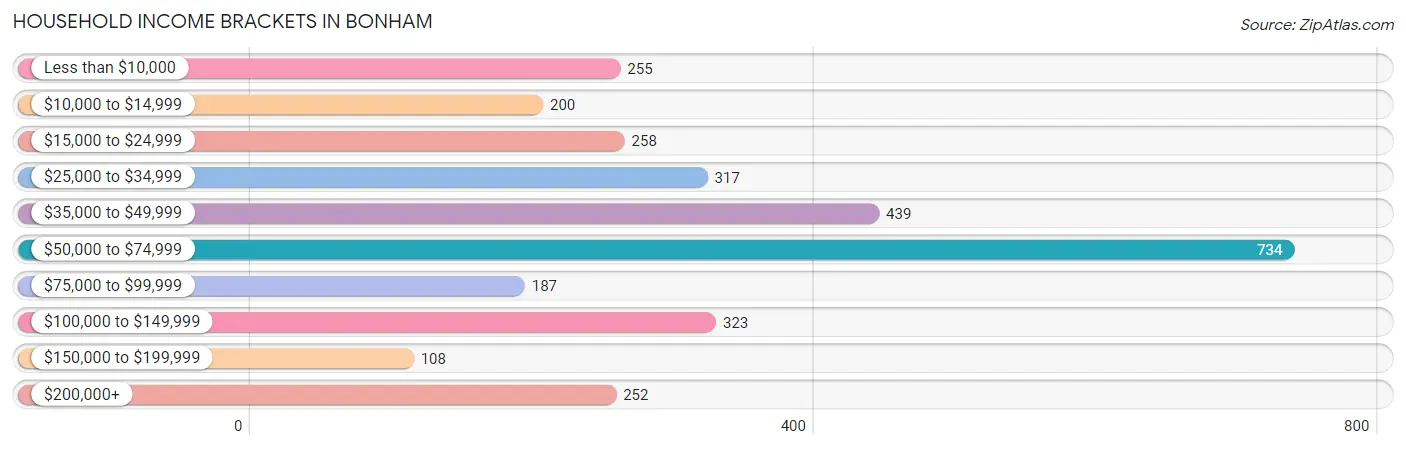
| Income Bracket | # Households | % Households |
| Less than $10,000 | 255 | 8.3% |
| $10,000 to $14,999 | 200 | 6.5% |
| $15,000 to $24,999 | 258 | 8.4% |
| $25,000 to $34,999 | 317 | 10.3% |
| $35,000 to $49,999 | 439 | 14.3% |
| $50,000 to $74,999 | 734 | 23.9% |
| $75,000 to $99,999 | 187 | 6.1% |
| $100,000 to $149,999 | 323 | 10.5% |
| $150,000 to $199,999 | 108 | 3.5% |
| $200,000+ | 252 | 8.2% |
Household Income by Householder Age in Bonham
The median household income in Bonham is $53,899, with the highest median household income of $58,992 found in the 25 to 44 years age bracket for the primary householder. A total of 1,076 households (35.0%) fall into this category. Meanwhile, the 15 to 24 years age bracket for the primary householder has the lowest median household income of $38,652, with 196 households (6.4%) in this group.
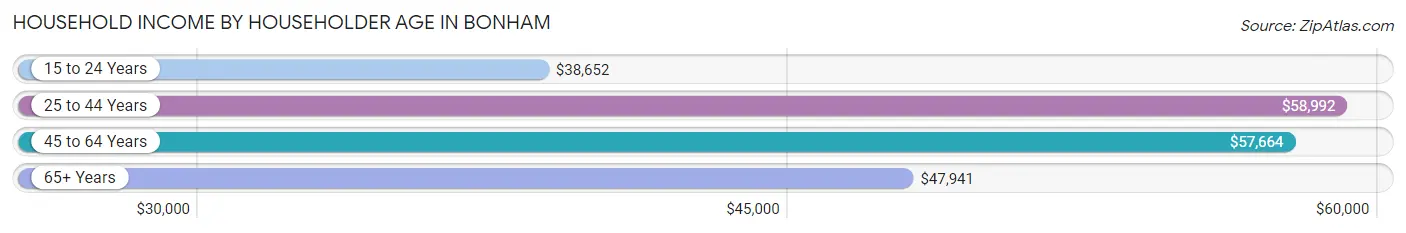
| Income Bracket | # Households | Median Income |
| 15 to 24 Years | 196 (6.4%) | $38,652 |
| 25 to 44 Years | 1,076 (35.0%) | $58,992 |
| 45 to 64 Years | 1,047 (34.1%) | $57,664 |
| 65+ Years | 754 (24.5%) | $47,941 |
| Total | 3,073 (100.0%) | $53,899 |
Poverty in Bonham
Income Below Poverty by Sex and Age in Bonham
With 18.8% poverty level for males and 14.0% for females among the residents of Bonham, 55 to 64 year old males and 35 to 44 year old females are the most vulnerable to poverty, with 129 males (37.2%) and 185 females (30.8%) in their respective age groups living below the poverty level.
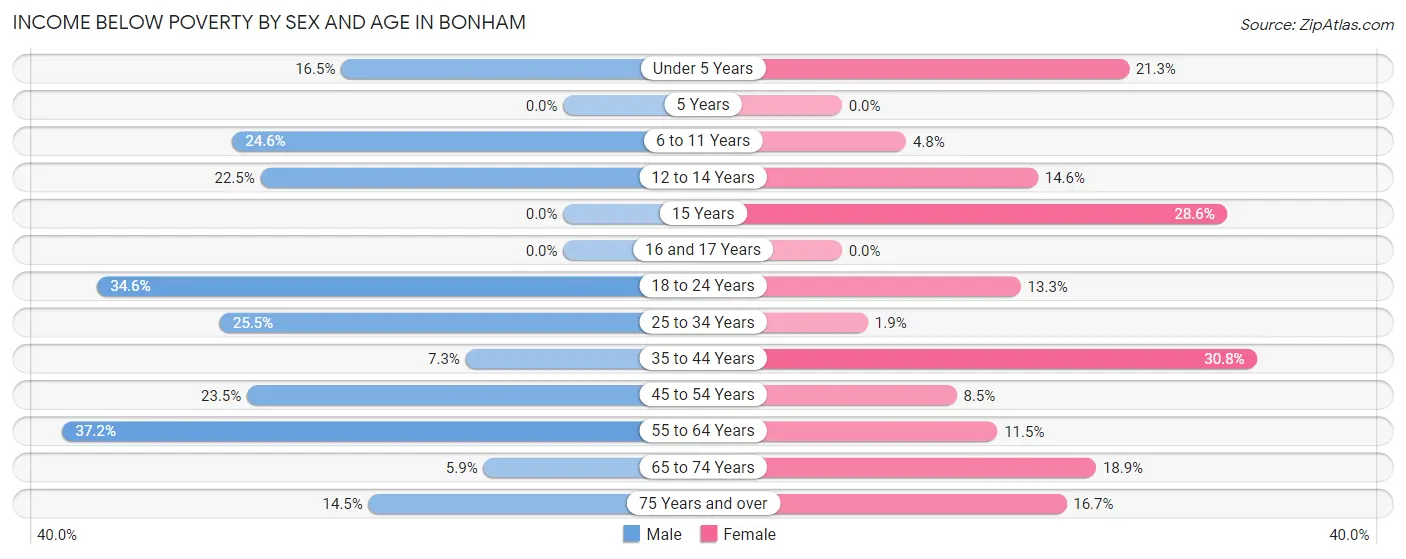
| Age Bracket | Male | Female |
| Under 5 Years | 48 (16.5%) | 46 (21.3%) |
| 5 Years | 0 (0.0%) | 0 (0.0%) |
| 6 to 11 Years | 57 (24.6%) | 18 (4.8%) |
| 12 to 14 Years | 29 (22.5%) | 24 (14.5%) |
| 15 Years | 0 (0.0%) | 16 (28.6%) |
| 16 and 17 Years | 0 (0.0%) | 0 (0.0%) |
| 18 to 24 Years | 73 (34.6%) | 51 (13.3%) |
| 25 to 34 Years | 167 (25.5%) | 8 (1.9%) |
| 35 to 44 Years | 48 (7.2%) | 185 (30.8%) |
| 45 to 54 Years | 116 (23.5%) | 42 (8.5%) |
| 55 to 64 Years | 129 (37.2%) | 45 (11.5%) |
| 65 to 74 Years | 21 (5.9%) | 67 (18.9%) |
| 75 Years and over | 36 (14.5%) | 43 (16.7%) |
| Total | 724 (18.8%) | 545 (14.0%) |
Income Above Poverty by Sex and Age in Bonham
According to the poverty statistics in Bonham, males aged 5 years and females aged 5 years are the age groups that are most secure financially, with 100.0% of males and 100.0% of females in these age groups living above the poverty line.
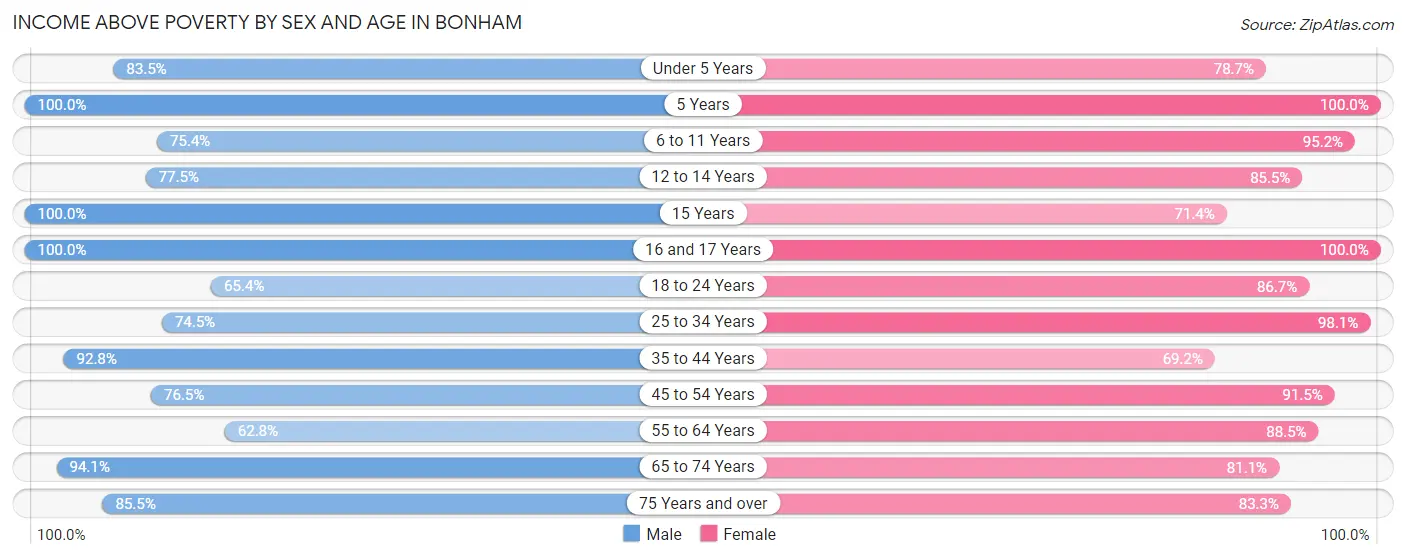
| Age Bracket | Male | Female |
| Under 5 Years | 243 (83.5%) | 170 (78.7%) |
| 5 Years | 21 (100.0%) | 134 (100.0%) |
| 6 to 11 Years | 175 (75.4%) | 359 (95.2%) |
| 12 to 14 Years | 100 (77.5%) | 141 (85.5%) |
| 15 Years | 6 (100.0%) | 40 (71.4%) |
| 16 and 17 Years | 206 (100.0%) | 52 (100.0%) |
| 18 to 24 Years | 138 (65.4%) | 333 (86.7%) |
| 25 to 34 Years | 488 (74.5%) | 405 (98.1%) |
| 35 to 44 Years | 614 (92.7%) | 416 (69.2%) |
| 45 to 54 Years | 378 (76.5%) | 451 (91.5%) |
| 55 to 64 Years | 218 (62.8%) | 345 (88.5%) |
| 65 to 74 Years | 333 (94.1%) | 288 (81.1%) |
| 75 Years and over | 213 (85.5%) | 215 (83.3%) |
| Total | 3,133 (81.2%) | 3,349 (86.0%) |
Income Below Poverty Among Married-Couple Families in Bonham
The poverty statistics for married-couple families in Bonham show that 5.1% or 69 of the total 1,351 families live below the poverty line. Families with 3 or 4 children have the highest poverty rate of 19.1%, comprising of 21 families. On the other hand, families with 1 or 2 children have the lowest poverty rate of 0.0%, which includes 0 families.
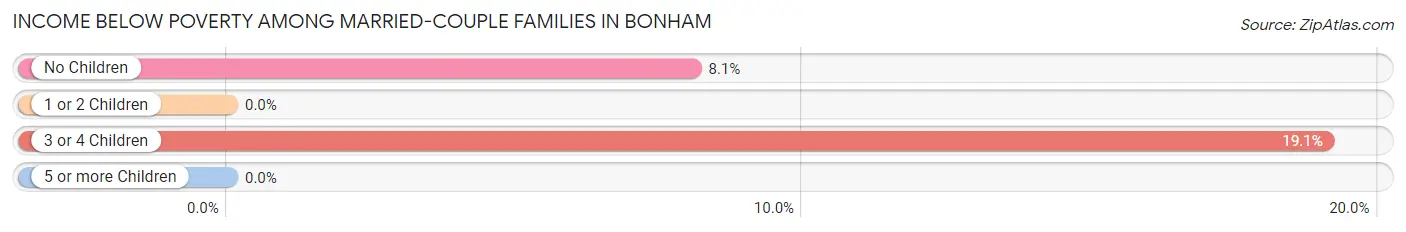
| Children | Above Poverty | Below Poverty |
| No Children | 547 (91.9%) | 48 (8.1%) |
| 1 or 2 Children | 639 (100.0%) | 0 (0.0%) |
| 3 or 4 Children | 89 (80.9%) | 21 (19.1%) |
| 5 or more Children | 7 (100.0%) | 0 (0.0%) |
| Total | 1,282 (94.9%) | 69 (5.1%) |
Income Below Poverty Among Single-Parent Households in Bonham
According to the poverty data in Bonham, 12.7% or 30 single-father households and 26.9% or 86 single-mother households are living below the poverty line. Among single-father households, those with no children have the highest poverty rate, with 30 households (33.0%) experiencing poverty. Likewise, among single-mother households, those with 3 or 4 children have the highest poverty rate, with 27 households (100.0%) falling below the poverty line.
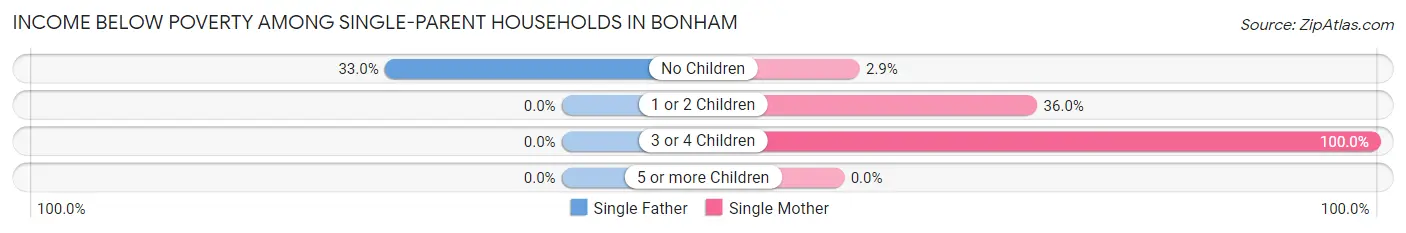
| Children | Single Father | Single Mother |
| No Children | 30 (33.0%) | 4 (2.9%) |
| 1 or 2 Children | 0 (0.0%) | 55 (35.9%) |
| 3 or 4 Children | 0 (0.0%) | 27 (100.0%) |
| 5 or more Children | 0 (0.0%) | 0 (0.0%) |
| Total | 30 (12.7%) | 86 (26.9%) |
Income Below Poverty Among Married-Couple vs Single-Parent Households in Bonham
The poverty data for Bonham shows that 69 of the married-couple family households (5.1%) and 116 of the single-parent households (20.8%) are living below the poverty level. Within the married-couple family households, those with 3 or 4 children have the highest poverty rate, with 21 households (19.1%) falling below the poverty line. Among the single-parent households, those with 3 or 4 children have the highest poverty rate, with 27 household (100.0%) living below poverty.
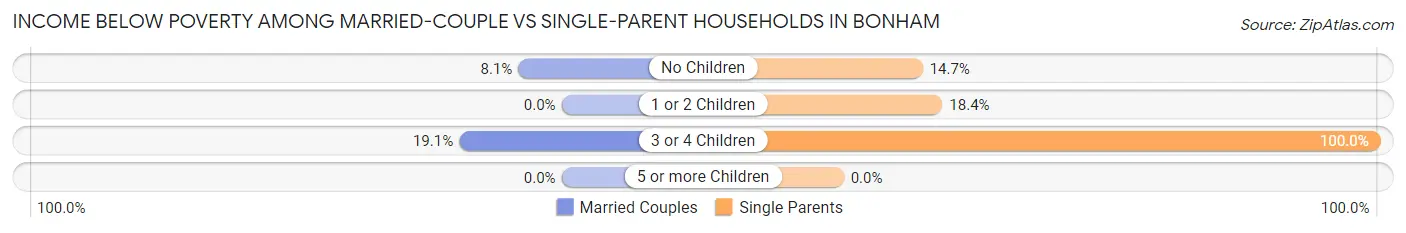
| Children | Married-Couple Families | Single-Parent Households |
| No Children | 48 (8.1%) | 34 (14.7%) |
| 1 or 2 Children | 0 (0.0%) | 55 (18.4%) |
| 3 or 4 Children | 21 (19.1%) | 27 (100.0%) |
| 5 or more Children | 0 (0.0%) | 0 (0.0%) |
| Total | 69 (5.1%) | 116 (20.8%) |
Race in Bonham
The most populous races in Bonham are White / Caucasian (8,228 | 78.5%), Hispanic or Latino (2,369 | 22.6%), and Black / African American (1,346 | 12.8%).
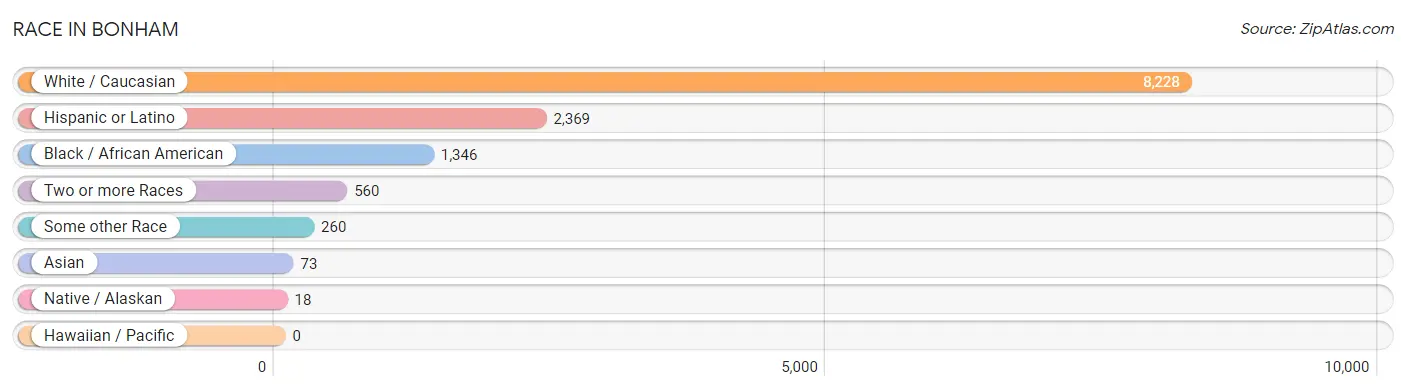
| Race | # Population | % Population |
| Asian | 73 | 0.7% |
| Black / African American | 1,346 | 12.8% |
| Hawaiian / Pacific | 0 | 0.0% |
| Hispanic or Latino | 2,369 | 22.6% |
| Native / Alaskan | 18 | 0.2% |
| White / Caucasian | 8,228 | 78.5% |
| Two or more Races | 560 | 5.3% |
| Some other Race | 260 | 2.5% |
| Total | 10,485 | 100.0% |
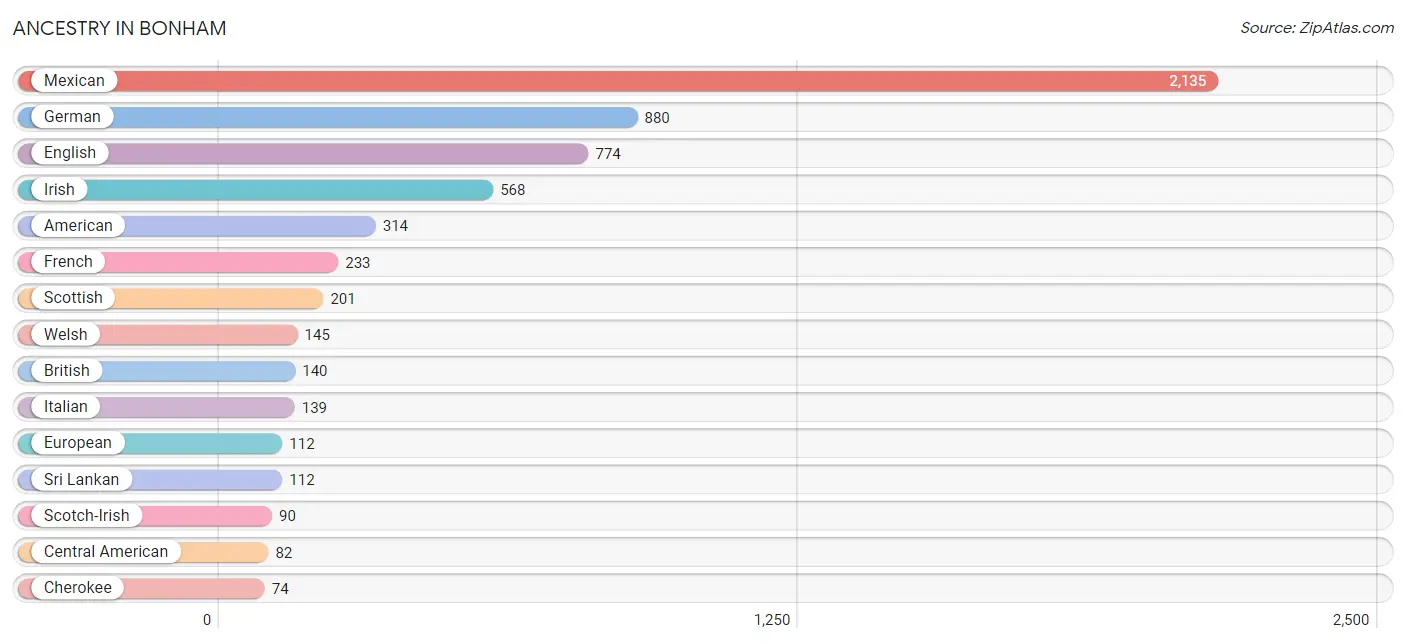
Ancestry in Bonham
The most populous ancestries reported in Bonham are Mexican (2,135 | 20.4%), German (880 | 8.4%), English (774 | 7.4%), Irish (568 | 5.4%), and American (314 | 3.0%), together accounting for 44.5% of all Bonham residents.
| Ancestry | # Population | % Population |
| African | 36 | 0.3% |
| American | 314 | 3.0% |
| Apache | 4 | 0.0% |
| Arab | 43 | 0.4% |
| Armenian | 17 | 0.2% |
| Bhutanese | 5 | 0.1% |
| Brazilian | 37 | 0.4% |
| British | 140 | 1.3% |
| Burmese | 43 | 0.4% |
| Cajun | 22 | 0.2% |
| Central American | 82 | 0.8% |
| Cherokee | 74 | 0.7% |
| Choctaw | 40 | 0.4% |
| Colombian | 26 | 0.3% |
| Croatian | 11 | 0.1% |
| Cuban | 26 | 0.3% |
| Danish | 30 | 0.3% |
| Dutch | 32 | 0.3% |
| English | 774 | 7.4% |
| European | 112 | 1.1% |
| French | 233 | 2.2% |
| French Canadian | 1 | 0.0% |
| German | 880 | 8.4% |
| Greek | 8 | 0.1% |
| Guamanian / Chamorro | 13 | 0.1% |
| Honduran | 70 | 0.7% |
| Hungarian | 21 | 0.2% |
| Indian (Asian) | 40 | 0.4% |
| Indonesian | 54 | 0.5% |
| Iranian | 23 | 0.2% |
| Irish | 568 | 5.4% |
| Italian | 139 | 1.3% |
| Korean | 44 | 0.4% |
| Maltese | 17 | 0.2% |
| Mexican | 2,135 | 20.4% |
| Polish | 30 | 0.3% |
| Portuguese | 67 | 0.6% |
| Puerto Rican | 11 | 0.1% |
| Romanian | 13 | 0.1% |
| Salvadoran | 12 | 0.1% |
| Scandinavian | 11 | 0.1% |
| Scotch-Irish | 90 | 0.9% |
| Scottish | 201 | 1.9% |
| South American | 26 | 0.3% |
| Spaniard | 25 | 0.2% |
| Spanish | 27 | 0.3% |
| Sri Lankan | 112 | 1.1% |
| Subsaharan African | 36 | 0.3% |
| Swedish | 20 | 0.2% |
| Swiss | 6 | 0.1% |
| Ukrainian | 10 | 0.1% |
| Welsh | 145 | 1.4% | View All 52 Rows |
Immigrants in Bonham
The most numerous immigrant groups reported in Bonham came from Latin America (794 | 7.6%), Central America (747 | 7.1%), Mexico (709 | 6.8%), Asia (60 | 0.6%), and Brazil (37 | 0.4%), together accounting for 22.4% of all Bonham residents.
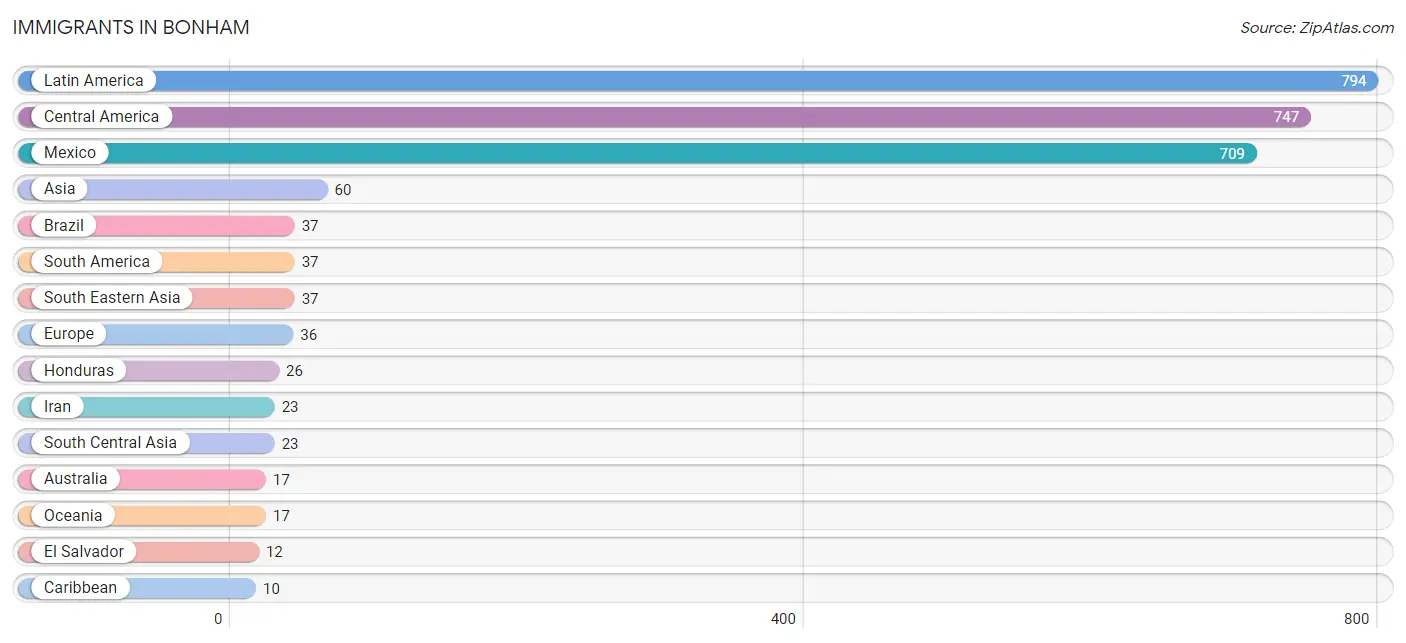
| Immigration Origin | # Population | % Population |
| Asia | 60 | 0.6% |
| Australia | 17 | 0.2% |
| Brazil | 37 | 0.4% |
| Caribbean | 10 | 0.1% |
| Central America | 747 | 7.1% |
| Cuba | 10 | 0.1% |
| Eastern Europe | 9 | 0.1% |
| El Salvador | 12 | 0.1% |
| Europe | 36 | 0.3% |
| Germany | 9 | 0.1% |
| Honduras | 26 | 0.3% |
| Iran | 23 | 0.2% |
| Ireland | 9 | 0.1% |
| Latin America | 794 | 7.6% |
| Mexico | 709 | 6.8% |
| Northern Europe | 9 | 0.1% |
| Oceania | 17 | 0.2% |
| Poland | 9 | 0.1% |
| South America | 37 | 0.4% |
| South Central Asia | 23 | 0.2% |
| South Eastern Asia | 37 | 0.4% |
| Southern Europe | 9 | 0.1% |
| Spain | 9 | 0.1% |
| Western Europe | 9 | 0.1% | View All 24 Rows |
Sex and Age in Bonham
Sex and Age in Bonham
The most populous age groups in Bonham are 25 to 29 Years (991 | 15.5%) for men and 5 to 9 Years (476 | 11.6%) for women.
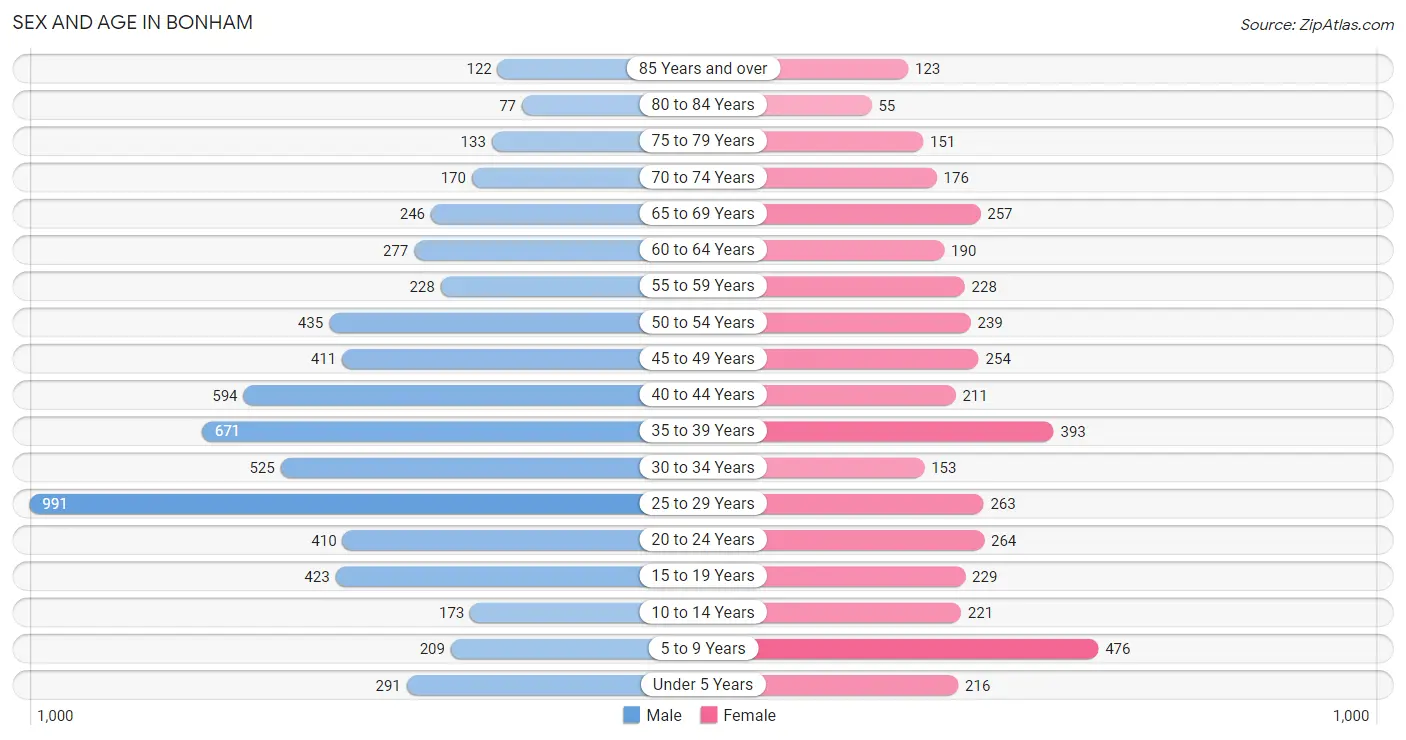
| Age Bracket | Male | Female |
| Under 5 Years | 291 (4.6%) | 216 (5.3%) |
| 5 to 9 Years | 209 (3.3%) | 476 (11.6%) |
| 10 to 14 Years | 173 (2.7%) | 221 (5.4%) |
| 15 to 19 Years | 423 (6.6%) | 229 (5.6%) |
| 20 to 24 Years | 410 (6.4%) | 264 (6.4%) |
| 25 to 29 Years | 991 (15.5%) | 263 (6.4%) |
| 30 to 34 Years | 525 (8.2%) | 153 (3.7%) |
| 35 to 39 Years | 671 (10.5%) | 393 (9.6%) |
| 40 to 44 Years | 594 (9.3%) | 211 (5.1%) |
| 45 to 49 Years | 411 (6.4%) | 254 (6.2%) |
| 50 to 54 Years | 435 (6.8%) | 239 (5.8%) |
| 55 to 59 Years | 228 (3.6%) | 228 (5.6%) |
| 60 to 64 Years | 277 (4.3%) | 190 (4.6%) |
| 65 to 69 Years | 246 (3.8%) | 257 (6.3%) |
| 70 to 74 Years | 170 (2.7%) | 176 (4.3%) |
| 75 to 79 Years | 133 (2.1%) | 151 (3.7%) |
| 80 to 84 Years | 77 (1.2%) | 55 (1.3%) |
| 85 Years and over | 122 (1.9%) | 123 (3.0%) |
| Total | 6,386 (100.0%) | 4,099 (100.0%) |
Families and Households in Bonham
Median Family Size in Bonham
The median family size in Bonham is 3.24 persons per family, with married-couple families (1,351 | 70.8%) accounting for the largest median family size of 3.44 persons per family. On the other hand, single female/mother families (320 | 16.8%) represent the smallest median family size with 2.64 persons per family.
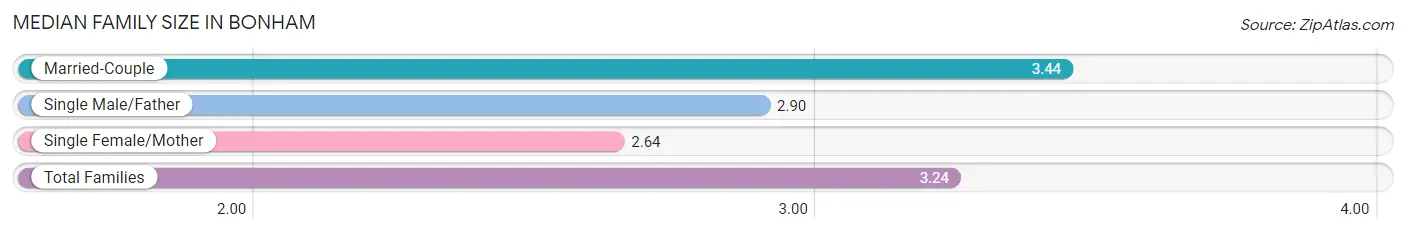
| Family Type | # Families | Family Size |
| Married-Couple | 1,351 (70.8%) | 3.44 |
| Single Male/Father | 237 (12.4%) | 2.90 |
| Single Female/Mother | 320 (16.8%) | 2.64 |
| Total Families | 1,908 (100.0%) | 3.24 |
Median Household Size in Bonham
The median household size in Bonham is 2.46 persons per household, with married-couple households (1,351 | 44.0%) accounting for the largest median household size of 3.47 persons per household. non-family households (1,165 | 37.9%) represent the smallest median household size with 1.04 persons per household.
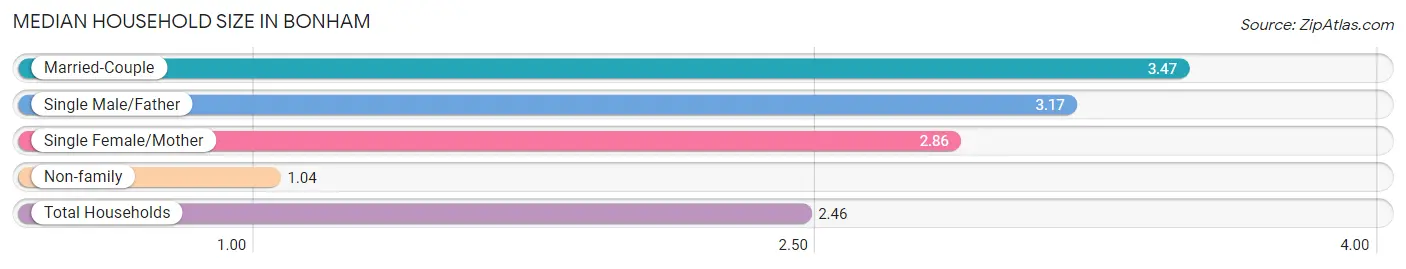
| Household Type | # Households | Household Size |
| Married-Couple | 1,351 (44.0%) | 3.47 |
| Single Male/Father | 237 (7.7%) | 3.17 |
| Single Female/Mother | 320 (10.4%) | 2.86 |
| Non-family | 1,165 (37.9%) | 1.04 |
| Total Households | 3,073 (100.0%) | 2.46 |
Household Size by Marriage Status in Bonham
Out of a total of 3,073 households in Bonham, 1,908 (62.1%) are family households, while 1,165 (37.9%) are nonfamily households. The most numerous type of family households are 4-person households, comprising 761, and the most common type of nonfamily households are 1-person households, comprising 1,126.
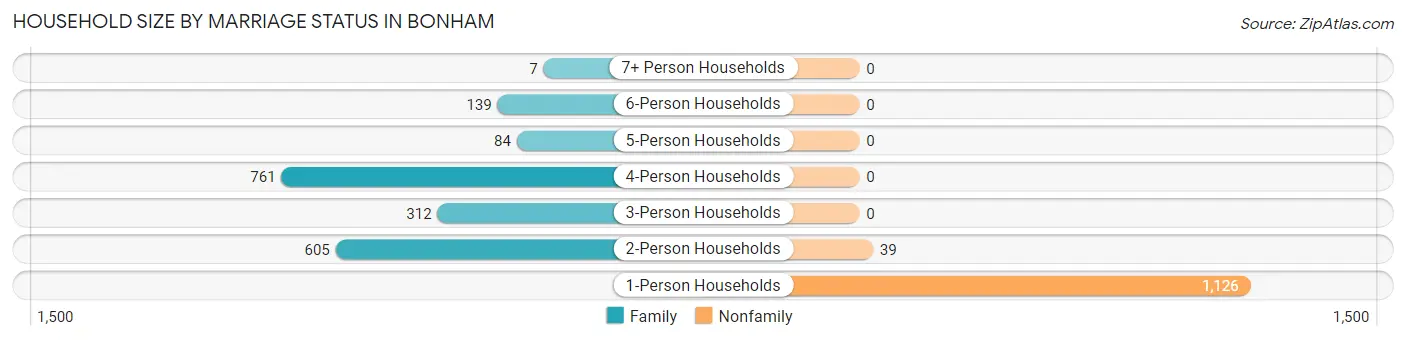
| Household Size | Family Households | Nonfamily Households |
| 1-Person Households | - | 1,126 (36.6%) |
| 2-Person Households | 605 (19.7%) | 39 (1.3%) |
| 3-Person Households | 312 (10.2%) | 0 (0.0%) |
| 4-Person Households | 761 (24.8%) | 0 (0.0%) |
| 5-Person Households | 84 (2.7%) | 0 (0.0%) |
| 6-Person Households | 139 (4.5%) | 0 (0.0%) |
| 7+ Person Households | 7 (0.2%) | 0 (0.0%) |
| Total | 1,908 (62.1%) | 1,165 (37.9%) |
Female Fertility in Bonham
Fertility by Age in Bonham
Average fertility rate in Bonham is 53.0 births per 1,000 women. Women in the age bracket of 20 to 34 years have the highest fertility rate with 112.0 births per 1,000 women. Women in the age bracket of 20 to 34 years acount for 81.7% of all women with births.
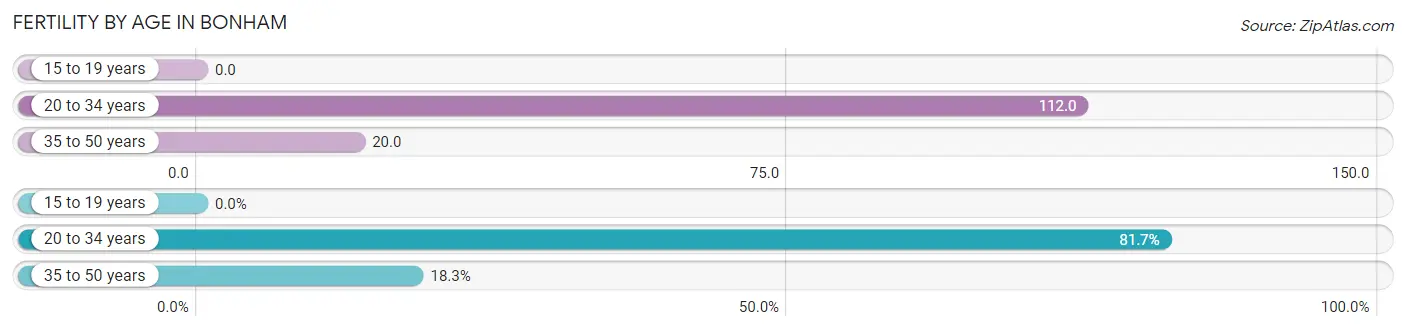
| Age Bracket | Women with Births | Births / 1,000 Women |
| 15 to 19 years | 0 (0.0%) | 0.0 |
| 20 to 34 years | 76 (81.7%) | 112.0 |
| 35 to 50 years | 17 (18.3%) | 20.0 |
| Total | 93 (100.0%) | 53.0 |
Fertility by Age by Marriage Status in Bonham
63.4% of women with births (93) in Bonham are married. The highest percentage of unmarried women with births falls into 20 to 34 years age bracket with 44.7% of them unmarried at the time of birth, while the lowest percentage of unmarried women with births belong to 35 to 50 years age bracket with 0.0% of them unmarried.
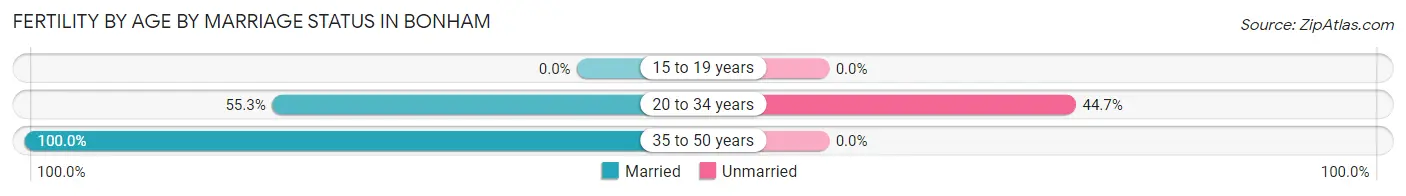
| Age Bracket | Married | Unmarried |
| 15 to 19 years | 0 (0.0%) | 0 (0.0%) |
| 20 to 34 years | 42 (55.3%) | 34 (44.7%) |
| 35 to 50 years | 17 (100.0%) | 0 (0.0%) |
| Total | 59 (63.4%) | 34 (36.6%) |
Fertility by Education in Bonham
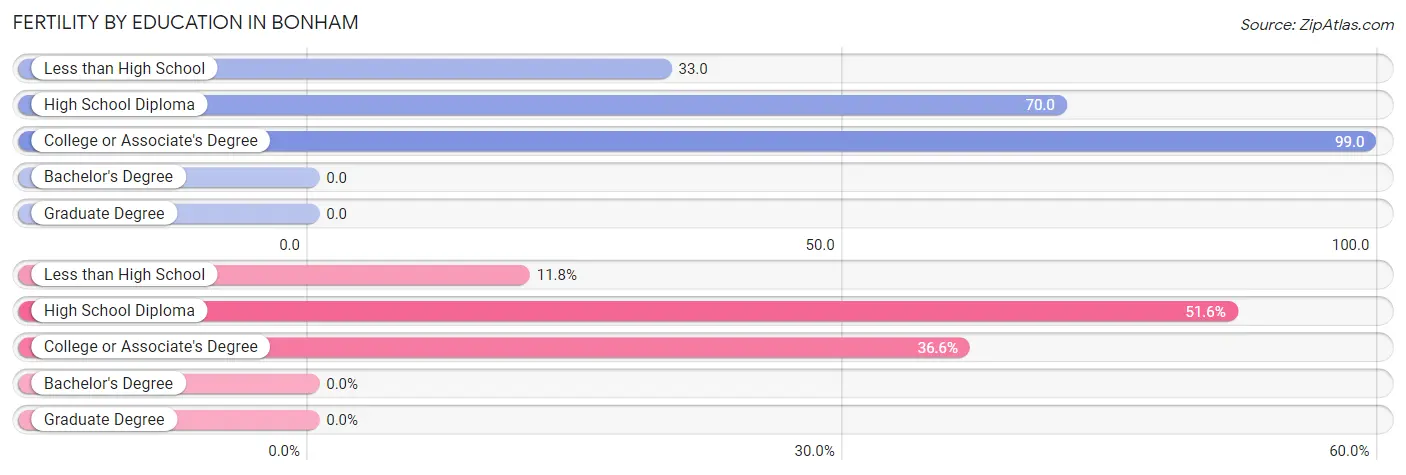
| Educational Attainment | Women with Births | Births / 1,000 Women |
| Less than High School | 11 (11.8%) | 33.0 |
| High School Diploma | 48 (51.6%) | 70.0 |
| College or Associate's Degree | 34 (36.6%) | 99.0 |
| Bachelor's Degree | 0 (0.0%) | 0.0 |
| Graduate Degree | 0 (0.0%) | 0.0 |
| Total | 93 (100.0%) | 53.0 |
Fertility by Education by Marriage Status in Bonham
36.6% of women with births in Bonham are unmarried. Women with the educational attainment of less than high school are most likely to be married with 100.0% of them married at childbirth, while women with the educational attainment of college or associate's degree are least likely to be married with 100.0% of them unmarried at childbirth.
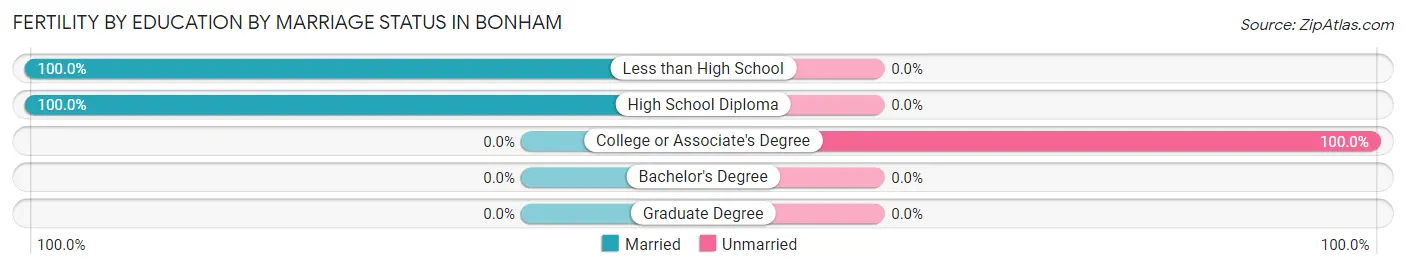
| Educational Attainment | Married | Unmarried |
| Less than High School | 11 (100.0%) | 0 (0.0%) |
| High School Diploma | 48 (100.0%) | 0 (0.0%) |
| College or Associate's Degree | 0 (0.0%) | 34 (100.0%) |
| Bachelor's Degree | 0 (0.0%) | 0 (0.0%) |
| Graduate Degree | 0 (0.0%) | 0 (0.0%) |
| Total | 59 (63.4%) | 34 (36.6%) |
Employment Characteristics in Bonham
Employment by Class of Employer in Bonham
Among the 3,278 employed individuals in Bonham, private company employees (2,055 | 62.7%), self-employed (not incorporated) (430 | 13.1%), and local government employees (266 | 8.1%) make up the most common classes of employment.
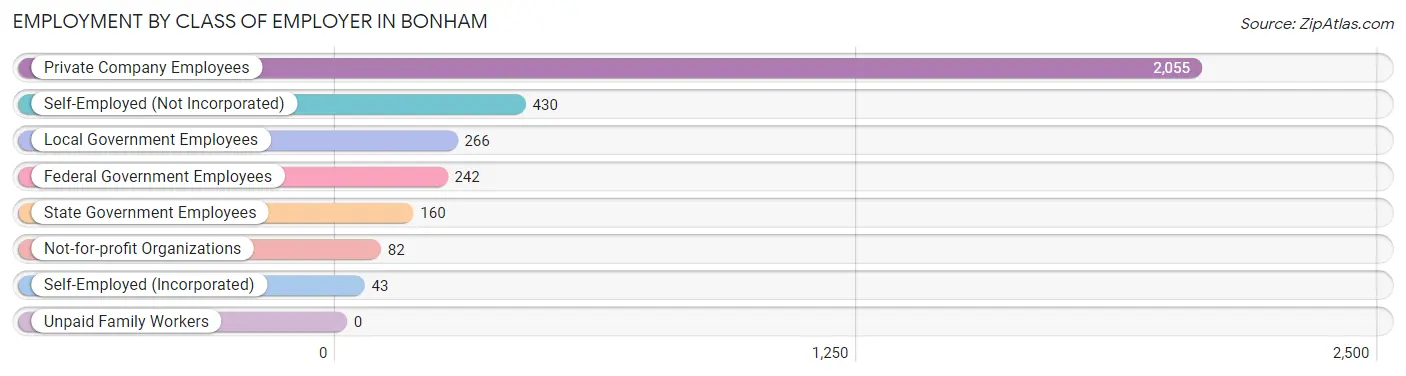
| Employer Class | # Employees | % Employees |
| Private Company Employees | 2,055 | 62.7% |
| Self-Employed (Incorporated) | 43 | 1.3% |
| Self-Employed (Not Incorporated) | 430 | 13.1% |
| Not-for-profit Organizations | 82 | 2.5% |
| Local Government Employees | 266 | 8.1% |
| State Government Employees | 160 | 4.9% |
| Federal Government Employees | 242 | 7.4% |
| Unpaid Family Workers | 0 | 0.0% |
| Total | 3,278 | 100.0% |
Employment Status by Age in Bonham
According to the labor force statistics for Bonham, out of the total population over 16 years of age (8,837), 40.9% or 3,614 individuals are in the labor force, with 6.3% or 228 of them unemployed. The age group with the highest labor force participation rate is 35 to 44 years, with 57.1% or 1,067 individuals in the labor force. Within the labor force, the 25 to 29 years age range has the highest percentage of unemployed individuals, with 15.4% or 67 of them being unemployed.
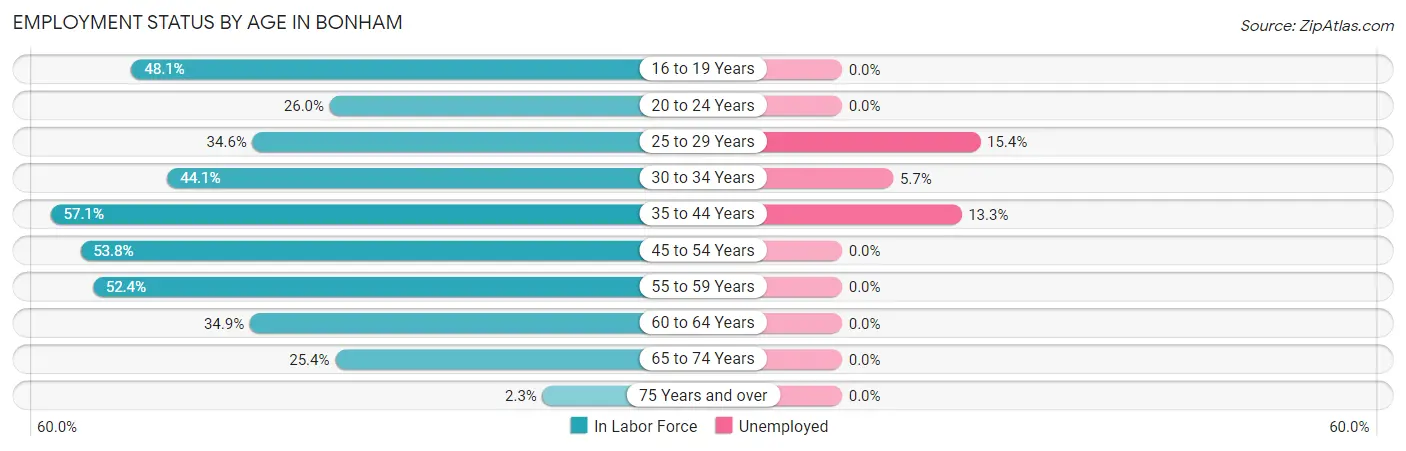
| Age Bracket | In Labor Force | Unemployed |
| 16 to 19 Years | 284 (48.1%) | 0 (0.0%) |
| 20 to 24 Years | 175 (26.0%) | 0 (0.0%) |
| 25 to 29 Years | 434 (34.6%) | 67 (15.4%) |
| 30 to 34 Years | 299 (44.1%) | 17 (5.7%) |
| 35 to 44 Years | 1,067 (57.1%) | 142 (13.3%) |
| 45 to 54 Years | 720 (53.8%) | 0 (0.0%) |
| 55 to 59 Years | 239 (52.4%) | 0 (0.0%) |
| 60 to 64 Years | 163 (34.9%) | 0 (0.0%) |
| 65 to 74 Years | 216 (25.4%) | 0 (0.0%) |
| 75 Years and over | 15 (2.3%) | 0 (0.0%) |
| Total | 3,614 (40.9%) | 228 (6.3%) |
Employment Status by Educational Attainment in Bonham
According to labor force statistics for Bonham, 48.2% of individuals (2,922) out of the total population between 25 and 64 years of age (6,063) are in the labor force, with 7.7% or 225 of them being unemployed. The group with the highest labor force participation rate are those with the educational attainment of bachelor's degree or higher, with 82.4% or 802 individuals in the labor force. Within the labor force, individuals with high school diploma education have the highest percentage of unemployment, with 12.9% or 126 of them being unemployed.
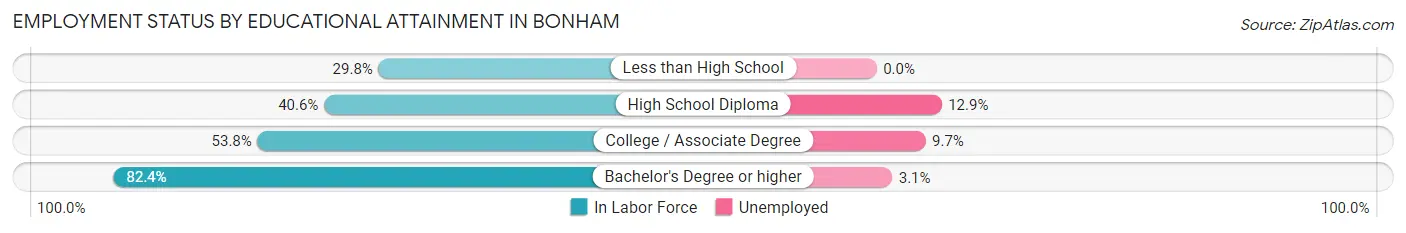
| Educational Attainment | In Labor Force | Unemployed |
| Less than High School | 372 (29.8%) | 0 (0.0%) |
| High School Diploma | 975 (40.6%) | 310 (12.9%) |
| College / Associate Degree | 775 (53.8%) | 140 (9.7%) |
| Bachelor's Degree or higher | 802 (82.4%) | 30 (3.1%) |
| Total | 2,922 (48.2%) | 467 (7.7%) |
Employment Occupations by Sex in Bonham
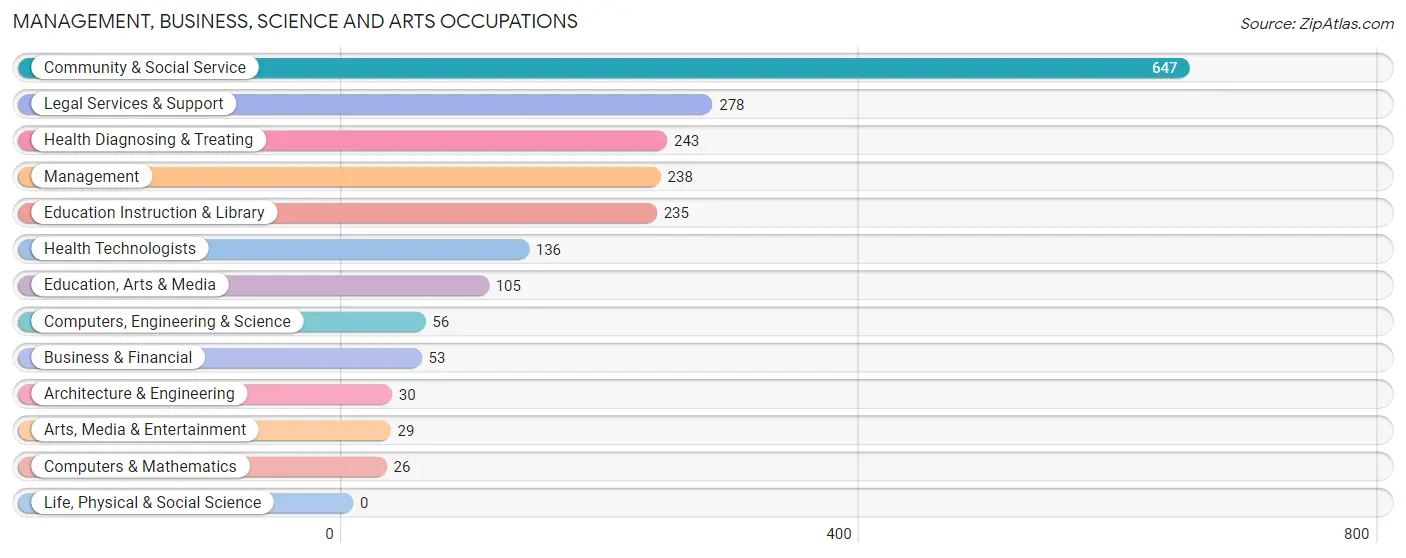
Management, Business, Science and Arts Occupations
The most common Management, Business, Science and Arts occupations in Bonham are Community & Social Service (647 | 19.1%), Legal Services & Support (278 | 8.2%), Health Diagnosing & Treating (243 | 7.2%), Management (238 | 7.0%), and Education Instruction & Library (235 | 6.9%).
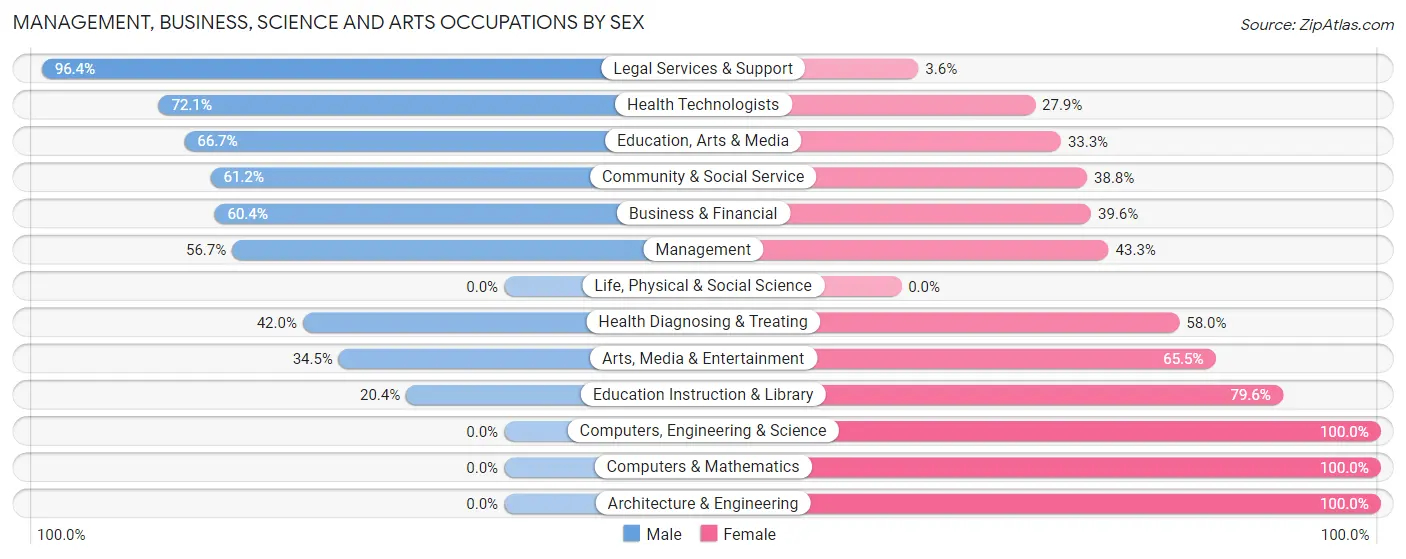
Management, Business, Science and Arts Occupations by Sex
Within the Management, Business, Science and Arts occupations in Bonham, the most male-oriented occupations are Legal Services & Support (96.4%), Health Technologists (72.1%), and Education, Arts & Media (66.7%), while the most female-oriented occupations are Computers, Engineering & Science (100.0%), Computers & Mathematics (100.0%), and Architecture & Engineering (100.0%).
| Occupation | Male | Female |
| Management | 135 (56.7%) | 103 (43.3%) |
| Business & Financial | 32 (60.4%) | 21 (39.6%) |
| Computers, Engineering & Science | 0 (0.0%) | 56 (100.0%) |
| Computers & Mathematics | 0 (0.0%) | 26 (100.0%) |
| Architecture & Engineering | 0 (0.0%) | 30 (100.0%) |
| Life, Physical & Social Science | 0 (0.0%) | 0 (0.0%) |
| Community & Social Service | 396 (61.2%) | 251 (38.8%) |
| Education, Arts & Media | 70 (66.7%) | 35 (33.3%) |
| Legal Services & Support | 268 (96.4%) | 10 (3.6%) |
| Education Instruction & Library | 48 (20.4%) | 187 (79.6%) |
| Arts, Media & Entertainment | 10 (34.5%) | 19 (65.5%) |
| Health Diagnosing & Treating | 102 (42.0%) | 141 (58.0%) |
| Health Technologists | 98 (72.1%) | 38 (27.9%) |
| Total (Category) | 665 (53.8%) | 572 (46.2%) |
| Total (Overall) | 1,879 (55.5%) | 1,507 (44.5%) |
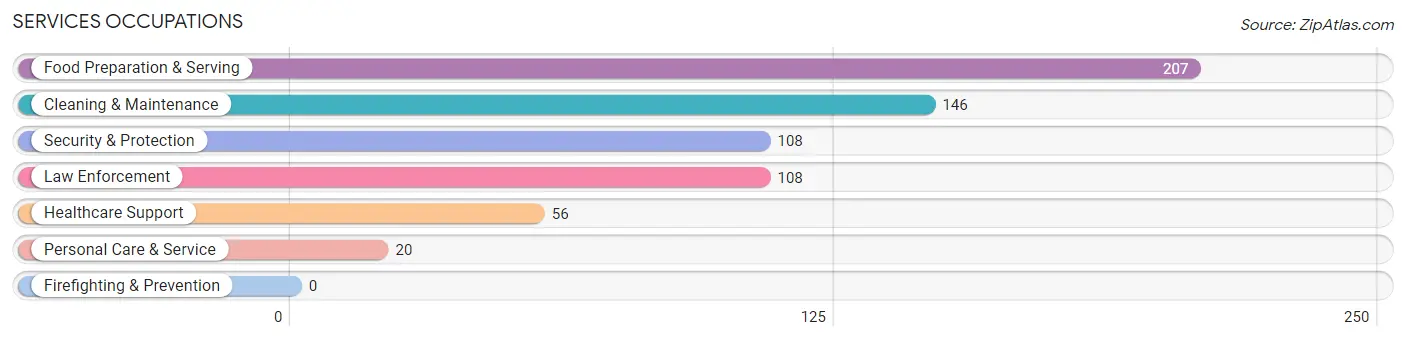
Services Occupations
The most common Services occupations in Bonham are Food Preparation & Serving (207 | 6.1%), Cleaning & Maintenance (146 | 4.3%), Security & Protection (108 | 3.2%), Law Enforcement (108 | 3.2%), and Healthcare Support (56 | 1.7%).
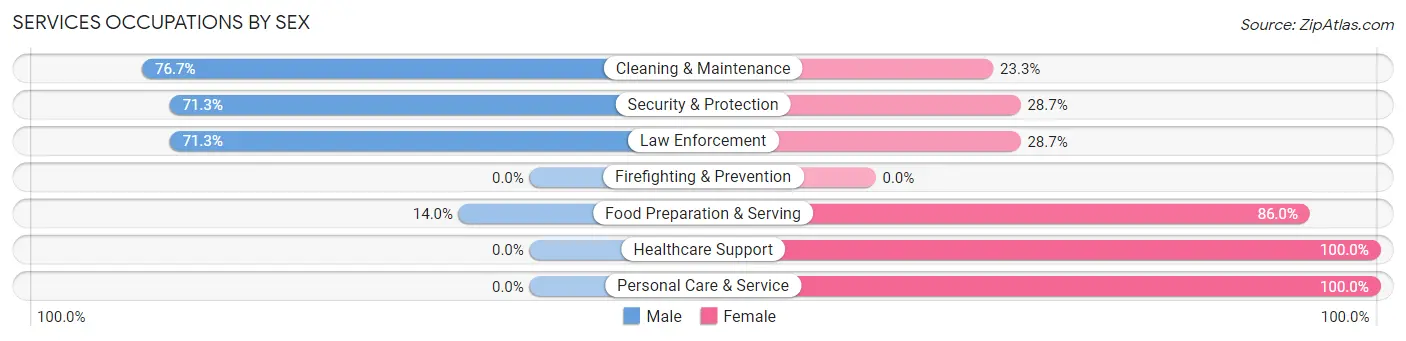
Services Occupations by Sex
Within the Services occupations in Bonham, the most male-oriented occupations are Cleaning & Maintenance (76.7%), Security & Protection (71.3%), and Law Enforcement (71.3%), while the most female-oriented occupations are Healthcare Support (100.0%), Personal Care & Service (100.0%), and Food Preparation & Serving (86.0%).
| Occupation | Male | Female |
| Healthcare Support | 0 (0.0%) | 56 (100.0%) |
| Security & Protection | 77 (71.3%) | 31 (28.7%) |
| Firefighting & Prevention | 0 (0.0%) | 0 (0.0%) |
| Law Enforcement | 77 (71.3%) | 31 (28.7%) |
| Food Preparation & Serving | 29 (14.0%) | 178 (86.0%) |
| Cleaning & Maintenance | 112 (76.7%) | 34 (23.3%) |
| Personal Care & Service | 0 (0.0%) | 20 (100.0%) |
| Total (Category) | 218 (40.6%) | 319 (59.4%) |
| Total (Overall) | 1,879 (55.5%) | 1,507 (44.5%) |
Sales and Office Occupations
The most common Sales and Office occupations in Bonham are Office & Administration (390 | 11.5%), and Sales & Related (285 | 8.4%).
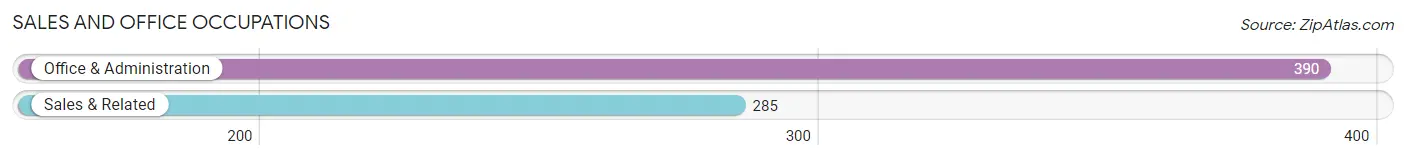
Sales and Office Occupations by Sex
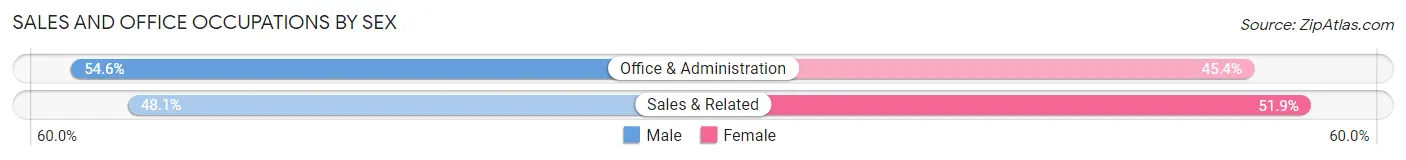
| Occupation | Male | Female |
| Sales & Related | 137 (48.1%) | 148 (51.9%) |
| Office & Administration | 213 (54.6%) | 177 (45.4%) |
| Total (Category) | 350 (51.8%) | 325 (48.1%) |
| Total (Overall) | 1,879 (55.5%) | 1,507 (44.5%) |
Natural Resources, Construction and Maintenance Occupations
The most common Natural Resources, Construction and Maintenance occupations in Bonham are Construction & Extraction (189 | 5.6%), Farming, Fishing & Forestry (27 | 0.8%), and Installation, Maintenance & Repair (10 | 0.3%).
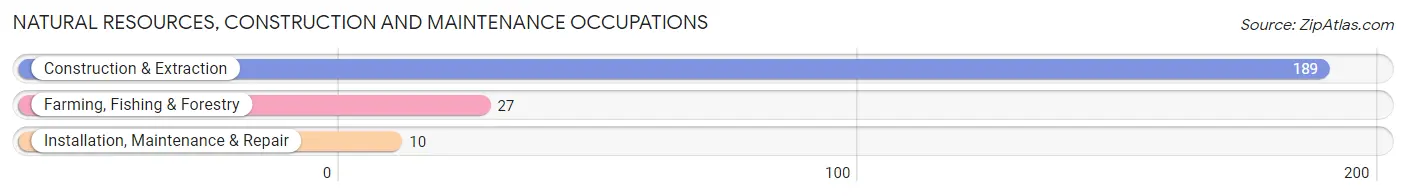
Natural Resources, Construction and Maintenance Occupations by Sex
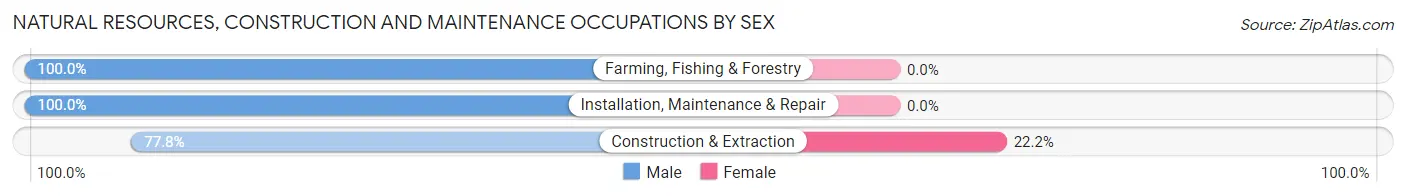
| Occupation | Male | Female |
| Farming, Fishing & Forestry | 27 (100.0%) | 0 (0.0%) |
| Construction & Extraction | 147 (77.8%) | 42 (22.2%) |
| Installation, Maintenance & Repair | 10 (100.0%) | 0 (0.0%) |
| Total (Category) | 184 (81.4%) | 42 (18.6%) |
| Total (Overall) | 1,879 (55.5%) | 1,507 (44.5%) |
Production, Transportation and Moving Occupations
The most common Production, Transportation and Moving occupations in Bonham are Production (396 | 11.7%), Transportation (179 | 5.3%), and Material Moving (136 | 4.0%).
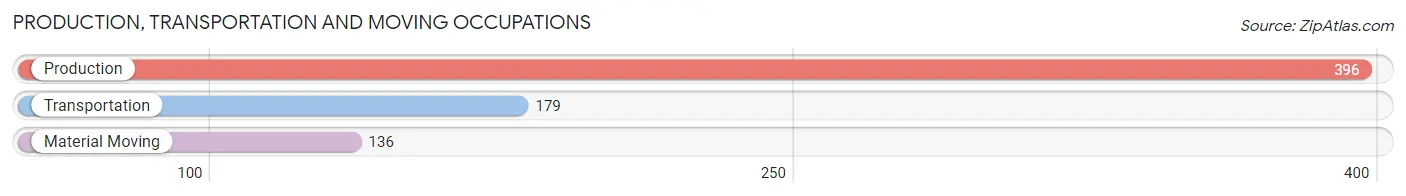
Production, Transportation and Moving Occupations by Sex
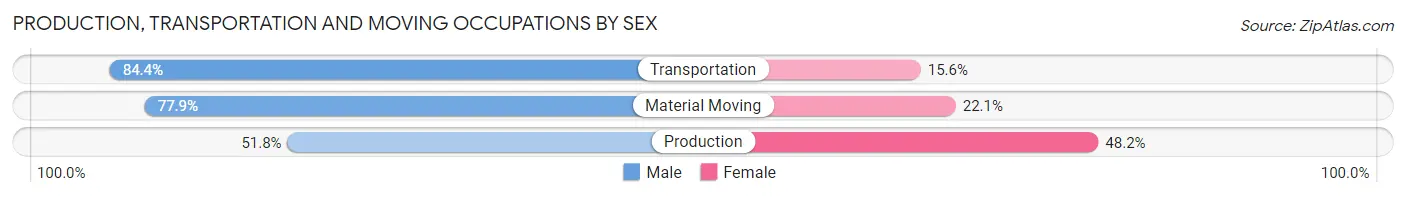
| Occupation | Male | Female |
| Production | 205 (51.8%) | 191 (48.2%) |
| Transportation | 151 (84.4%) | 28 (15.6%) |
| Material Moving | 106 (77.9%) | 30 (22.1%) |
| Total (Category) | 462 (65.0%) | 249 (35.0%) |
| Total (Overall) | 1,879 (55.5%) | 1,507 (44.5%) |
Employment Industries by Sex in Bonham
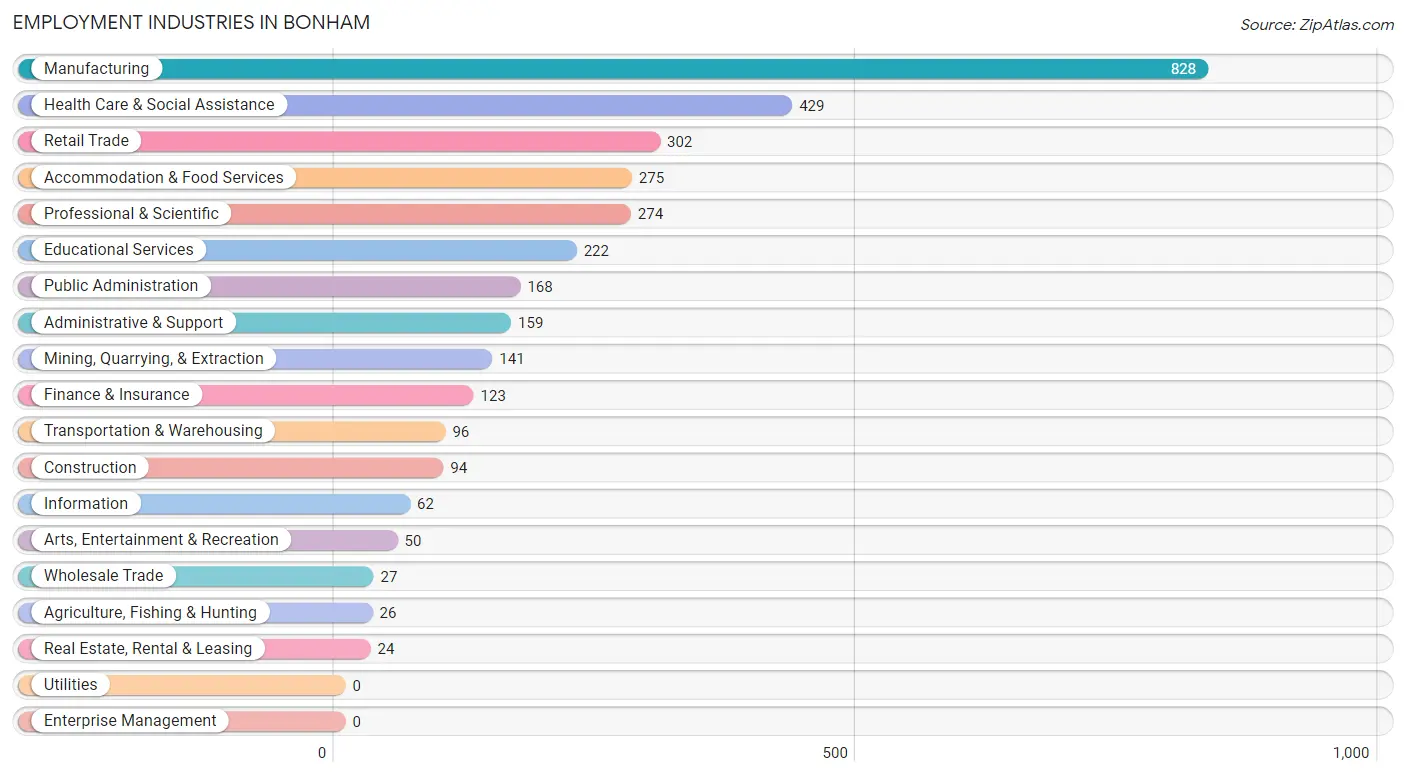
Employment Industries in Bonham
The major employment industries in Bonham include Manufacturing (828 | 24.4%), Health Care & Social Assistance (429 | 12.7%), Retail Trade (302 | 8.9%), Accommodation & Food Services (275 | 8.1%), and Professional & Scientific (274 | 8.1%).
Employment Industries by Sex in Bonham
The Bonham industries that see more men than women are Agriculture, Fishing & Hunting (100.0%), Construction (100.0%), and Professional & Scientific (91.6%), whereas the industries that tend to have a higher number of women are Wholesale Trade (100.0%), Real Estate, Rental & Leasing (100.0%), and Educational Services (78.4%).
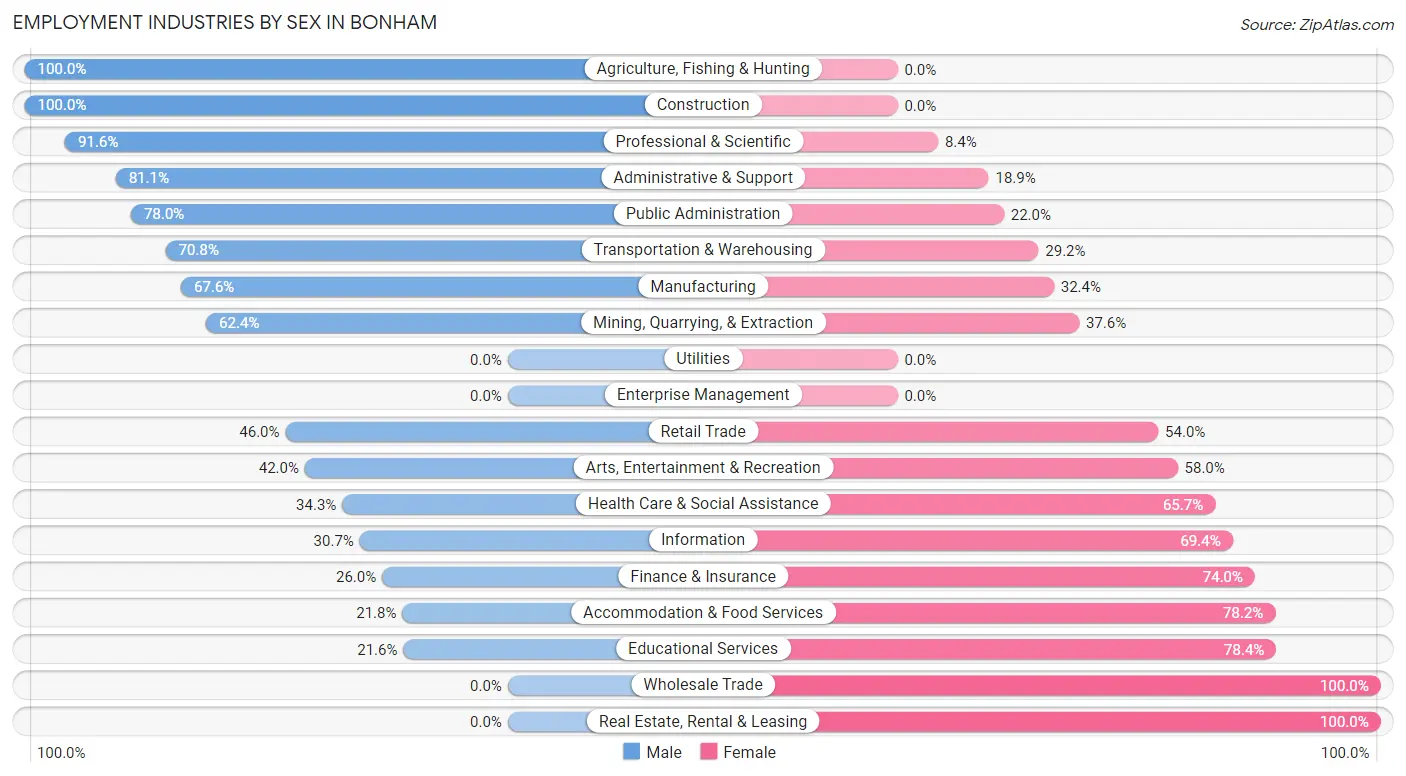
| Industry | Male | Female |
| Agriculture, Fishing & Hunting | 26 (100.0%) | 0 (0.0%) |
| Mining, Quarrying, & Extraction | 88 (62.4%) | 53 (37.6%) |
| Construction | 94 (100.0%) | 0 (0.0%) |
| Manufacturing | 560 (67.6%) | 268 (32.4%) |
| Wholesale Trade | 0 (0.0%) | 27 (100.0%) |
| Retail Trade | 139 (46.0%) | 163 (54.0%) |
| Transportation & Warehousing | 68 (70.8%) | 28 (29.2%) |
| Utilities | 0 (0.0%) | 0 (0.0%) |
| Information | 19 (30.6%) | 43 (69.4%) |
| Finance & Insurance | 32 (26.0%) | 91 (74.0%) |
| Real Estate, Rental & Leasing | 0 (0.0%) | 24 (100.0%) |
| Professional & Scientific | 251 (91.6%) | 23 (8.4%) |
| Enterprise Management | 0 (0.0%) | 0 (0.0%) |
| Administrative & Support | 129 (81.1%) | 30 (18.9%) |
| Educational Services | 48 (21.6%) | 174 (78.4%) |
| Health Care & Social Assistance | 147 (34.3%) | 282 (65.7%) |
| Arts, Entertainment & Recreation | 21 (42.0%) | 29 (58.0%) |
| Accommodation & Food Services | 60 (21.8%) | 215 (78.2%) |
| Public Administration | 131 (78.0%) | 37 (22.0%) |
| Total | 1,879 (55.5%) | 1,507 (44.5%) |
Education in Bonham
School Enrollment in Bonham
The most common levels of schooling among the 2,105 students in Bonham are high school (510 | 24.2%), elementary school (471 | 22.4%), and college / undergraduate (400 | 19.0%).
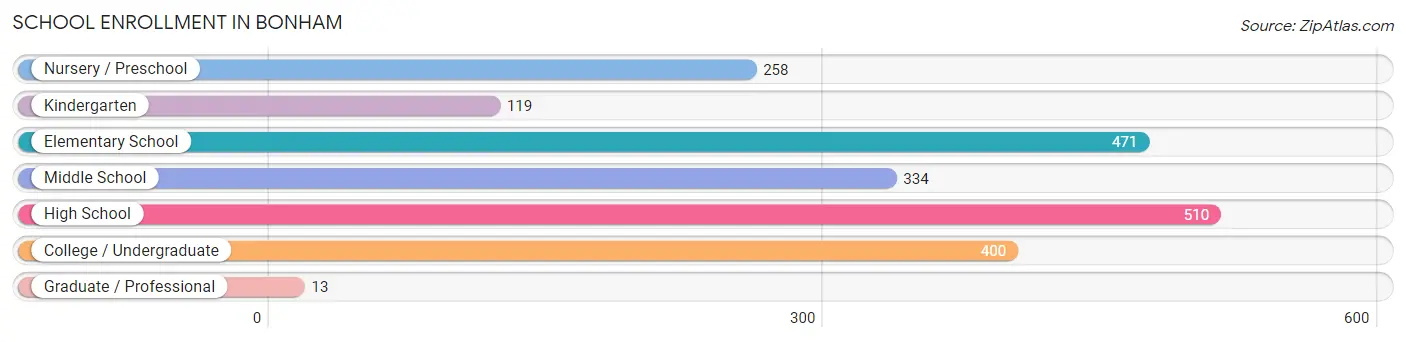
| School Level | # Students | % Students |
| Nursery / Preschool | 258 | 12.3% |
| Kindergarten | 119 | 5.7% |
| Elementary School | 471 | 22.4% |
| Middle School | 334 | 15.9% |
| High School | 510 | 24.2% |
| College / Undergraduate | 400 | 19.0% |
| Graduate / Professional | 13 | 0.6% |
| Total | 2,105 | 100.0% |
School Enrollment by Age by Funding Source in Bonham
Out of a total of 2,105 students who are enrolled in schools in Bonham, 299 (14.2%) attend a private institution, while the remaining 1,806 (85.8%) are enrolled in public schools. The age group of 25 to 34 year olds has the highest likelihood of being enrolled in private schools, with 130 (65.3% in the age bracket) enrolled. Conversely, the age group of 18 to 19 year olds has the lowest likelihood of being enrolled in a private school, with 220 (96.1% in the age bracket) attending a public institution.
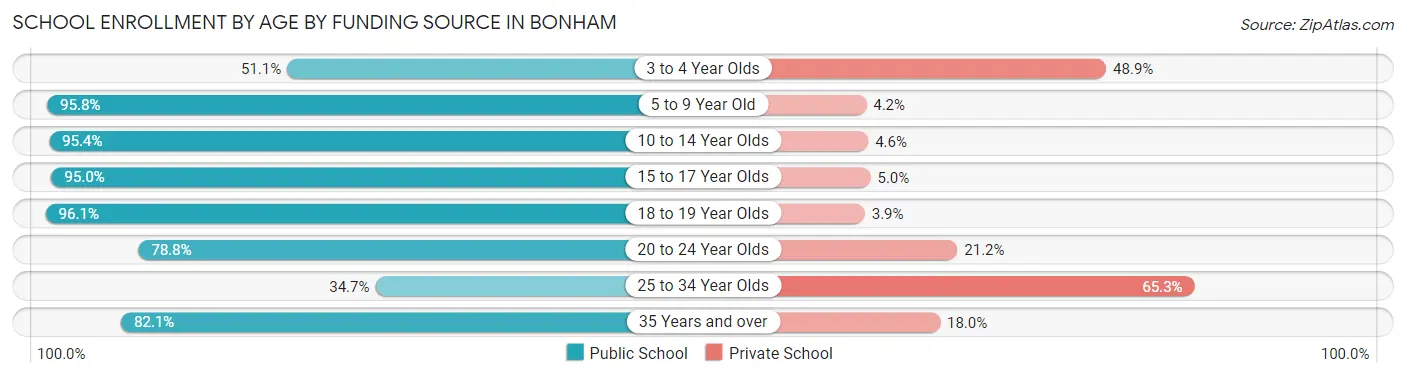
| Age Bracket | Public School | Private School |
| 3 to 4 Year Olds | 69 (51.1%) | 66 (48.9%) |
| 5 to 9 Year Old | 637 (95.8%) | 28 (4.2%) |
| 10 to 14 Year Olds | 376 (95.4%) | 18 (4.6%) |
| 15 to 17 Year Olds | 304 (95.0%) | 16 (5.0%) |
| 18 to 19 Year Olds | 220 (96.1%) | 9 (3.9%) |
| 20 to 24 Year Olds | 67 (78.8%) | 18 (21.2%) |
| 25 to 34 Year Olds | 69 (34.7%) | 130 (65.3%) |
| 35 Years and over | 64 (82.1%) | 14 (17.9%) |
| Total | 1,806 (85.8%) | 299 (14.2%) |
Educational Attainment by Field of Study in Bonham
Arts & humanities (201 | 13.8%), psychology (187 | 12.8%), business (186 | 12.7%), education (178 | 12.2%), and social sciences (148 | 10.1%) are the most common fields of study among 1,460 individuals in Bonham who have obtained a bachelor's degree or higher.
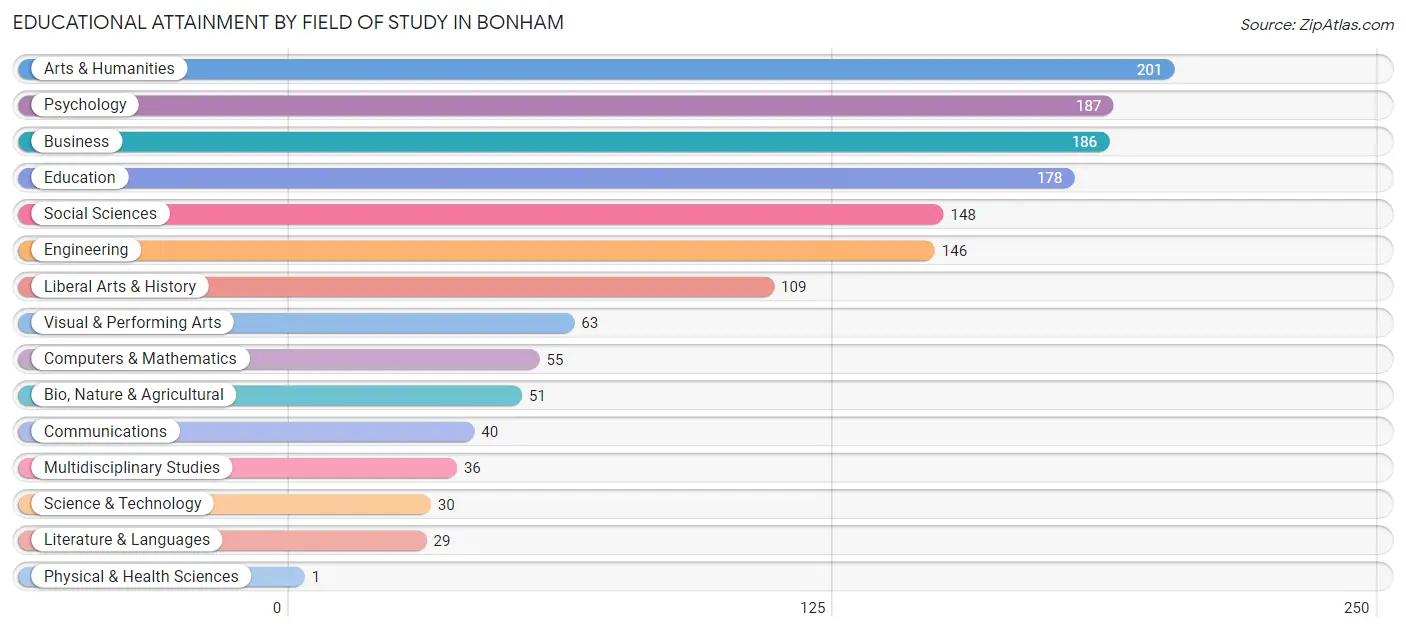
| Field of Study | # Graduates | % Graduates |
| Computers & Mathematics | 55 | 3.8% |
| Bio, Nature & Agricultural | 51 | 3.5% |
| Physical & Health Sciences | 1 | 0.1% |
| Psychology | 187 | 12.8% |
| Social Sciences | 148 | 10.1% |
| Engineering | 146 | 10.0% |
| Multidisciplinary Studies | 36 | 2.5% |
| Science & Technology | 30 | 2.1% |
| Business | 186 | 12.7% |
| Education | 178 | 12.2% |
| Literature & Languages | 29 | 2.0% |
| Liberal Arts & History | 109 | 7.5% |
| Visual & Performing Arts | 63 | 4.3% |
| Communications | 40 | 2.7% |
| Arts & Humanities | 201 | 13.8% |
| Total | 1,460 | 100.0% |
Transportation & Commute in Bonham
Vehicle Availability by Sex in Bonham
The most prevalent vehicle ownership categories in Bonham are males with 2 vehicles (793, accounting for 42.4%) and females with 2 vehicles (454, making up 56.8%).
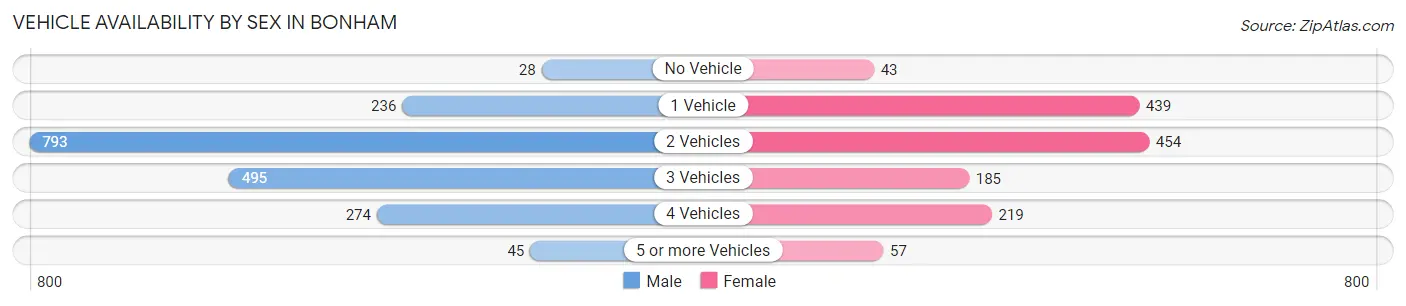
| Vehicles Available | Male | Female |
| No Vehicle | 28 (1.5%) | 43 (3.1%) |
| 1 Vehicle | 236 (12.6%) | 439 (31.4%) |
| 2 Vehicles | 793 (42.4%) | 454 (32.5%) |
| 3 Vehicles | 495 (26.5%) | 185 (13.2%) |
| 4 Vehicles | 274 (14.6%) | 219 (15.7%) |
| 5 or more Vehicles | 45 (2.4%) | 57 (4.1%) |
| Total | 1,871 (100.0%) | 1,397 (100.0%) |
Commute Time in Bonham
The most frequently occuring commute durations in Bonham are 5 to 9 minutes (791 commuters, 25.9%), 30 to 34 minutes (581 commuters, 19.0%), and 10 to 14 minutes (554 commuters, 18.1%).
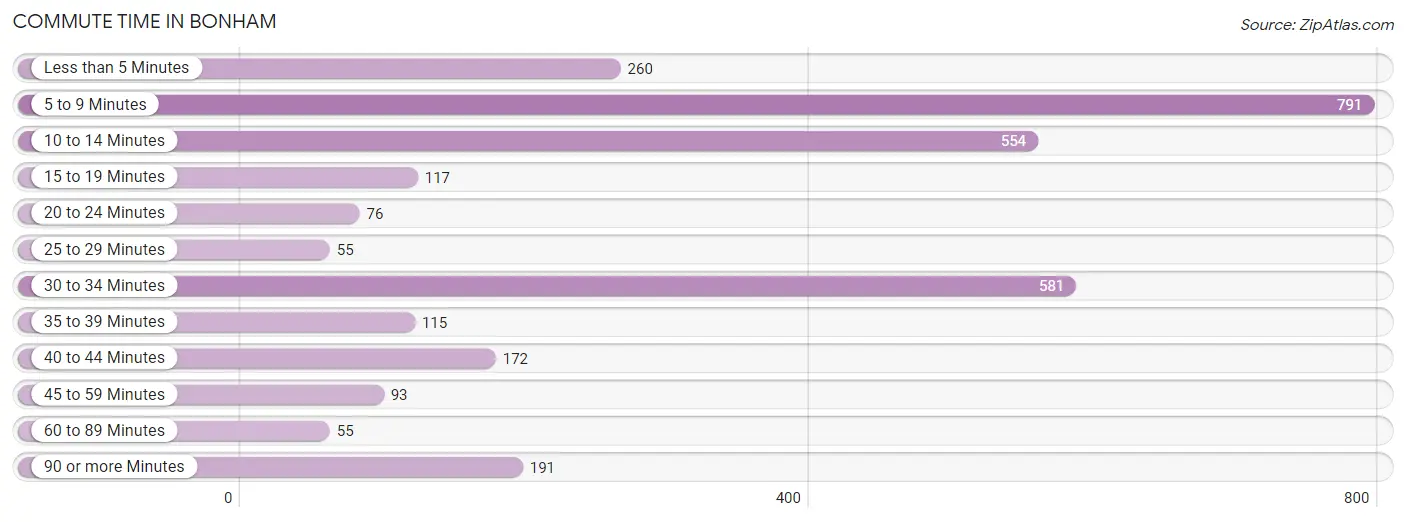
| Commute Time | # Commuters | % Commuters |
| Less than 5 Minutes | 260 | 8.5% |
| 5 to 9 Minutes | 791 | 25.9% |
| 10 to 14 Minutes | 554 | 18.1% |
| 15 to 19 Minutes | 117 | 3.8% |
| 20 to 24 Minutes | 76 | 2.5% |
| 25 to 29 Minutes | 55 | 1.8% |
| 30 to 34 Minutes | 581 | 19.0% |
| 35 to 39 Minutes | 115 | 3.8% |
| 40 to 44 Minutes | 172 | 5.6% |
| 45 to 59 Minutes | 93 | 3.0% |
| 60 to 89 Minutes | 55 | 1.8% |
| 90 or more Minutes | 191 | 6.2% |
Commute Time by Sex in Bonham
The most common commute times in Bonham are 10 to 14 minutes (432 commuters, 24.4%) for males and 5 to 9 minutes (505 commuters, 39.2%) for females.
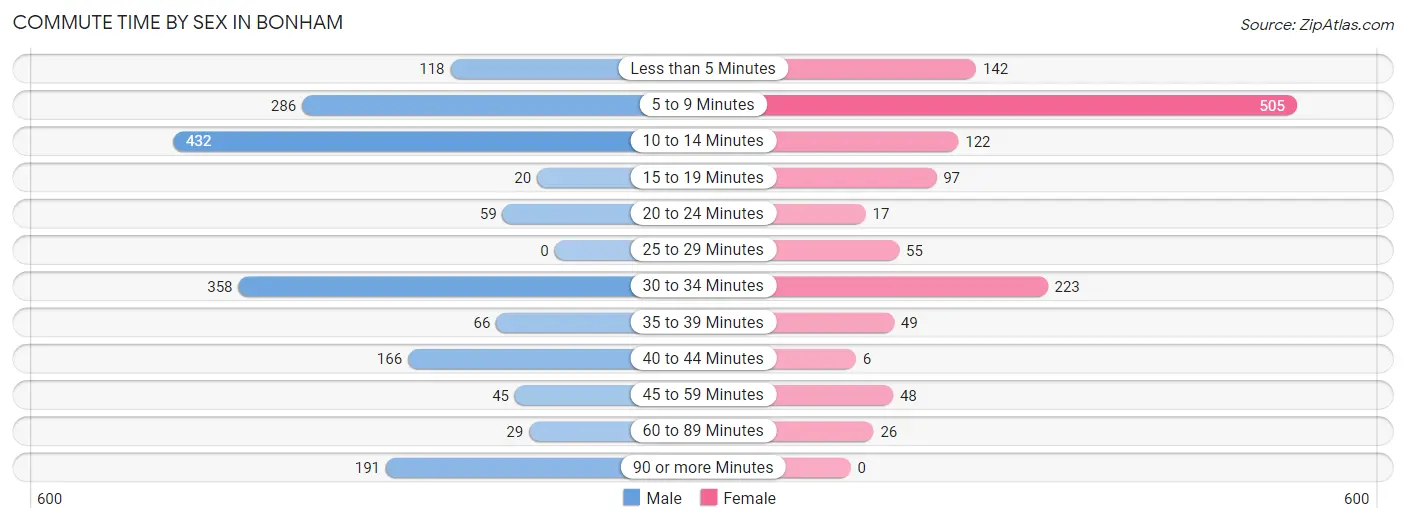
| Commute Time | Male | Female |
| Less than 5 Minutes | 118 (6.7%) | 142 (11.0%) |
| 5 to 9 Minutes | 286 (16.2%) | 505 (39.2%) |
| 10 to 14 Minutes | 432 (24.4%) | 122 (9.5%) |
| 15 to 19 Minutes | 20 (1.1%) | 97 (7.5%) |
| 20 to 24 Minutes | 59 (3.3%) | 17 (1.3%) |
| 25 to 29 Minutes | 0 (0.0%) | 55 (4.3%) |
| 30 to 34 Minutes | 358 (20.2%) | 223 (17.3%) |
| 35 to 39 Minutes | 66 (3.7%) | 49 (3.8%) |
| 40 to 44 Minutes | 166 (9.4%) | 6 (0.5%) |
| 45 to 59 Minutes | 45 (2.5%) | 48 (3.7%) |
| 60 to 89 Minutes | 29 (1.6%) | 26 (2.0%) |
| 90 or more Minutes | 191 (10.8%) | 0 (0.0%) |
Time of Departure to Work by Sex in Bonham
The most frequent times of departure to work in Bonham are 7:30 AM to 7:59 AM (248, 14.0%) for males and 7:00 AM to 7:29 AM (257, 19.9%) for females.
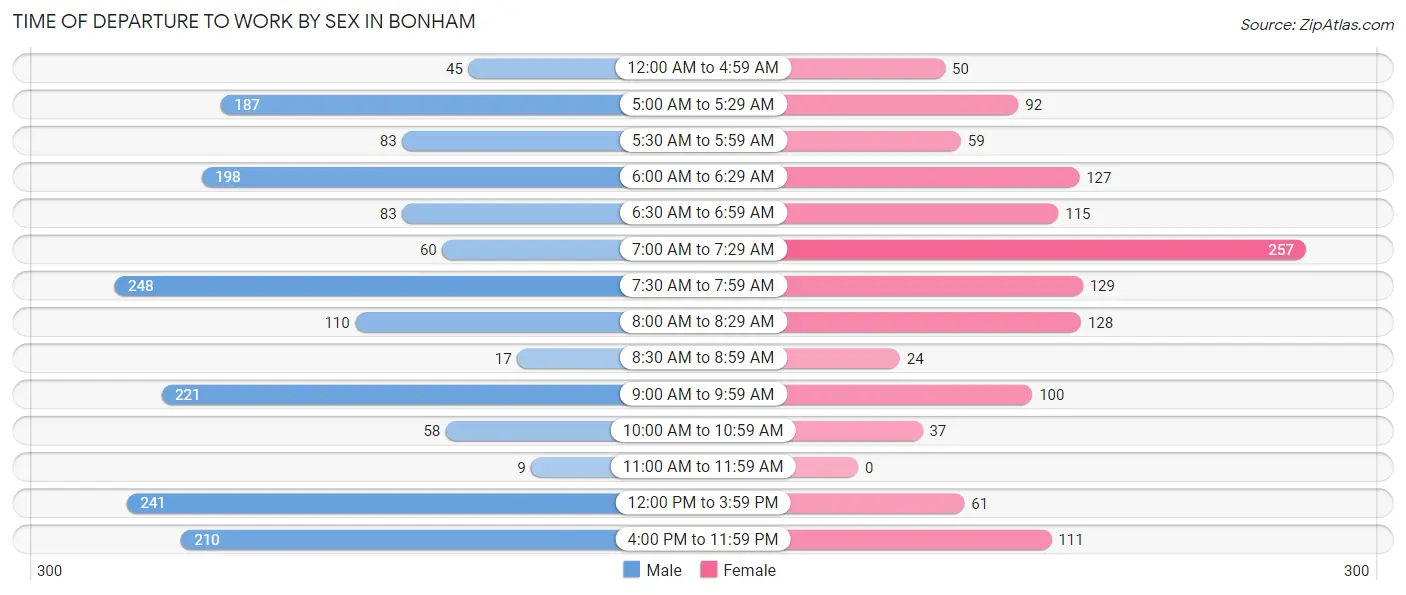
| Time of Departure | Male | Female |
| 12:00 AM to 4:59 AM | 45 (2.5%) | 50 (3.9%) |
| 5:00 AM to 5:29 AM | 187 (10.6%) | 92 (7.1%) |
| 5:30 AM to 5:59 AM | 83 (4.7%) | 59 (4.6%) |
| 6:00 AM to 6:29 AM | 198 (11.2%) | 127 (9.8%) |
| 6:30 AM to 6:59 AM | 83 (4.7%) | 115 (8.9%) |
| 7:00 AM to 7:29 AM | 60 (3.4%) | 257 (19.9%) |
| 7:30 AM to 7:59 AM | 248 (14.0%) | 129 (10.0%) |
| 8:00 AM to 8:29 AM | 110 (6.2%) | 128 (9.9%) |
| 8:30 AM to 8:59 AM | 17 (1.0%) | 24 (1.9%) |
| 9:00 AM to 9:59 AM | 221 (12.5%) | 100 (7.7%) |
| 10:00 AM to 10:59 AM | 58 (3.3%) | 37 (2.9%) |
| 11:00 AM to 11:59 AM | 9 (0.5%) | 0 (0.0%) |
| 12:00 PM to 3:59 PM | 241 (13.6%) | 61 (4.7%) |
| 4:00 PM to 11:59 PM | 210 (11.9%) | 111 (8.6%) |
| Total | 1,770 (100.0%) | 1,290 (100.0%) |
Housing Occupancy in Bonham
Occupancy by Ownership in Bonham
Of the total 3,073 dwellings in Bonham, owner-occupied units account for 1,853 (60.3%), while renter-occupied units make up 1,220 (39.7%).
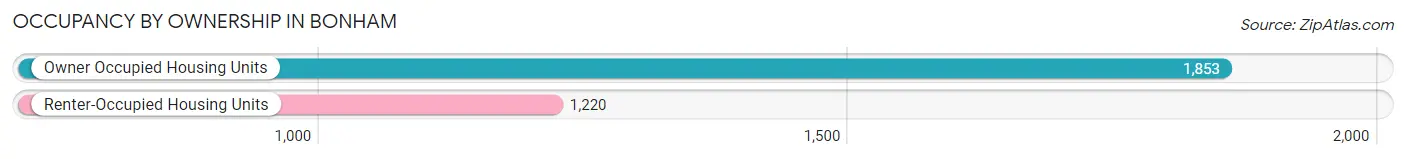
| Occupancy | # Housing Units | % Housing Units |
| Owner Occupied Housing Units | 1,853 | 60.3% |
| Renter-Occupied Housing Units | 1,220 | 39.7% |
| Total Occupied Housing Units | 3,073 | 100.0% |
Occupancy by Household Size in Bonham
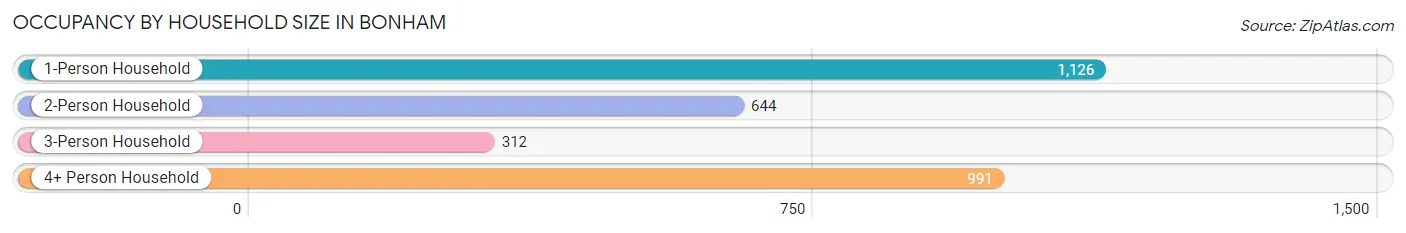
| Household Size | # Housing Units | % Housing Units |
| 1-Person Household | 1,126 | 36.6% |
| 2-Person Household | 644 | 21.0% |
| 3-Person Household | 312 | 10.2% |
| 4+ Person Household | 991 | 32.3% |
| Total Housing Units | 3,073 | 100.0% |
Occupancy by Ownership by Household Size in Bonham
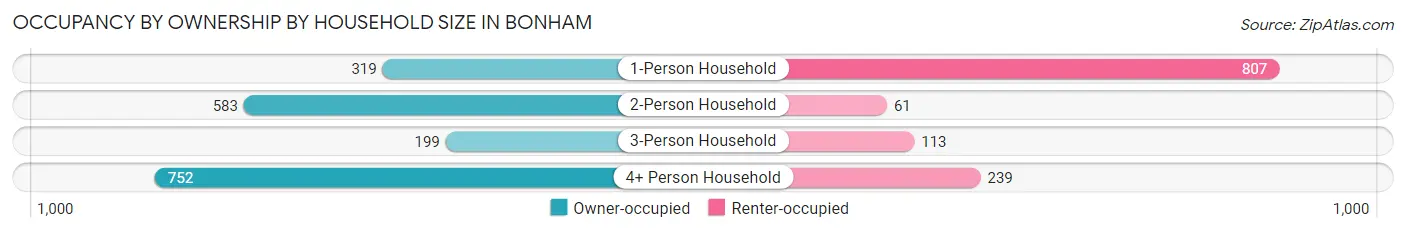
| Household Size | Owner-occupied | Renter-occupied |
| 1-Person Household | 319 (28.3%) | 807 (71.7%) |
| 2-Person Household | 583 (90.5%) | 61 (9.5%) |
| 3-Person Household | 199 (63.8%) | 113 (36.2%) |
| 4+ Person Household | 752 (75.9%) | 239 (24.1%) |
| Total Housing Units | 1,853 (60.3%) | 1,220 (39.7%) |
Occupancy by Educational Attainment in Bonham
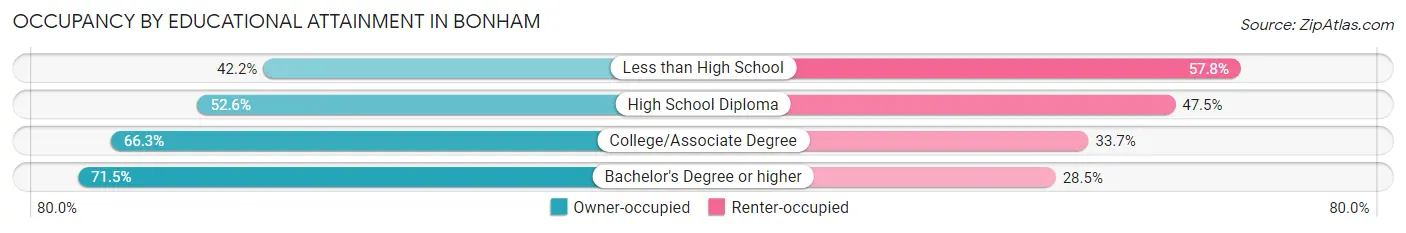
| Household Size | Owner-occupied | Renter-occupied |
| Less than High School | 164 (42.2%) | 225 (57.8%) |
| High School Diploma | 505 (52.5%) | 456 (47.4%) |
| College/Associate Degree | 614 (66.3%) | 312 (33.7%) |
| Bachelor's Degree or higher | 570 (71.5%) | 227 (28.5%) |
Occupancy by Age of Householder in Bonham
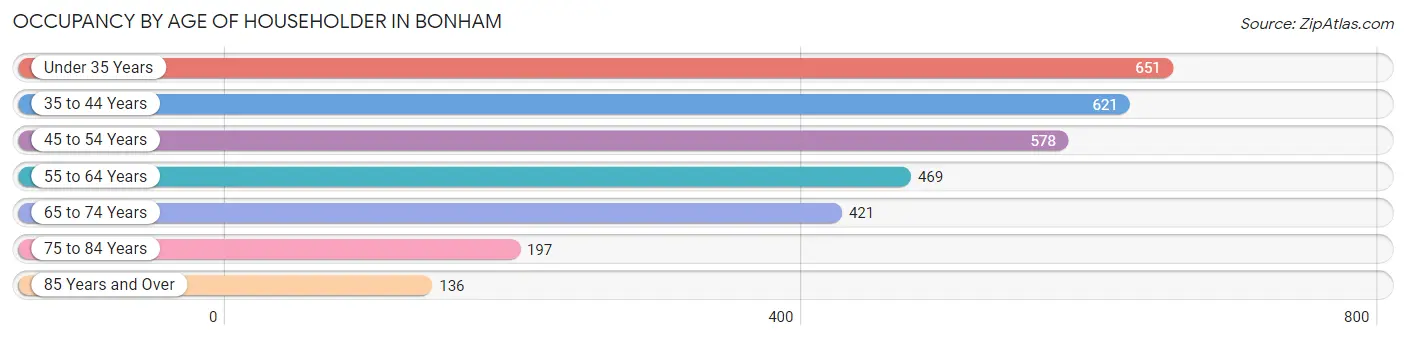
| Age Bracket | # Households | % Households |
| Under 35 Years | 651 | 21.2% |
| 35 to 44 Years | 621 | 20.2% |
| 45 to 54 Years | 578 | 18.8% |
| 55 to 64 Years | 469 | 15.3% |
| 65 to 74 Years | 421 | 13.7% |
| 75 to 84 Years | 197 | 6.4% |
| 85 Years and Over | 136 | 4.4% |
| Total | 3,073 | 100.0% |
Housing Finances in Bonham
Median Income by Occupancy in Bonham
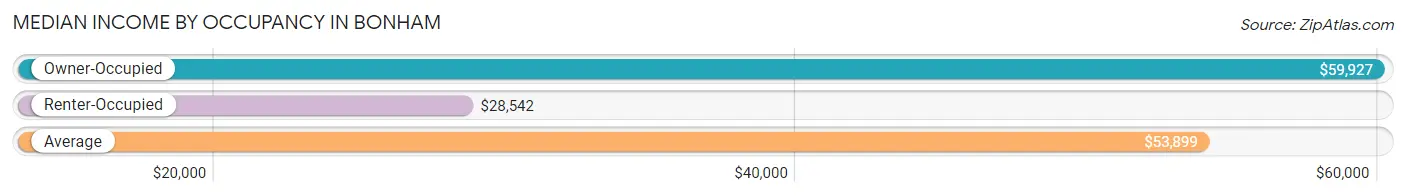
| Occupancy Type | # Households | Median Income |
| Owner-Occupied | 1,853 (60.3%) | $59,927 |
| Renter-Occupied | 1,220 (39.7%) | $28,542 |
| Average | 3,073 (100.0%) | $53,899 |
Occupancy by Householder Income Bracket in Bonham
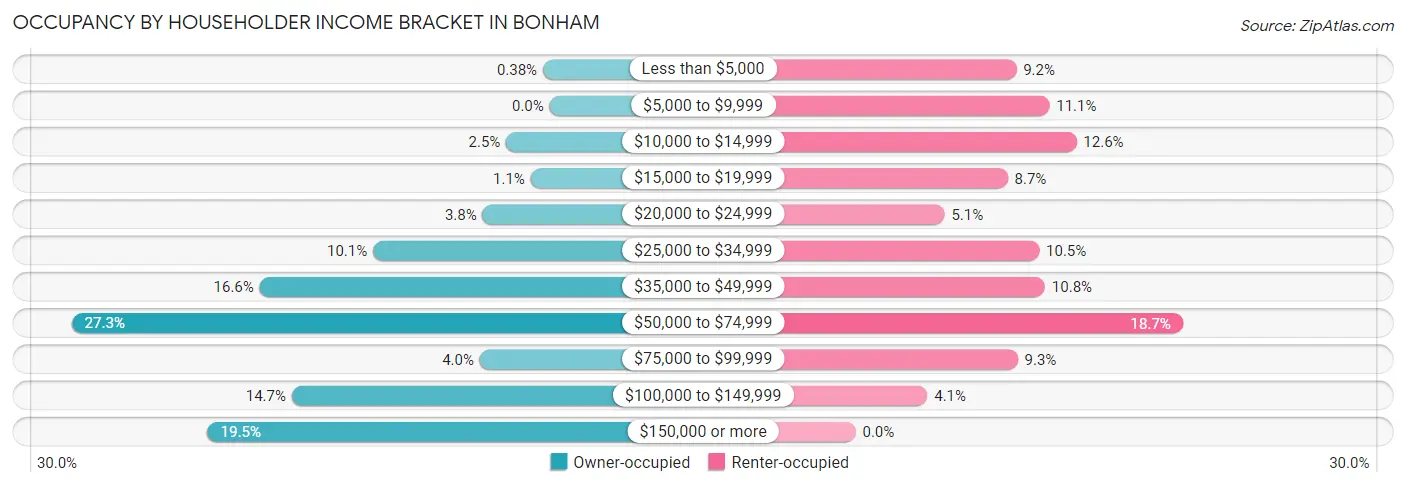
| Income Bracket | Owner-occupied | Renter-occupied |
| Less than $5,000 | 7 (0.4%) | 112 (9.2%) |
| $5,000 to $9,999 | 0 (0.0%) | 135 (11.1%) |
| $10,000 to $14,999 | 46 (2.5%) | 154 (12.6%) |
| $15,000 to $19,999 | 20 (1.1%) | 106 (8.7%) |
| $20,000 to $24,999 | 71 (3.8%) | 62 (5.1%) |
| $25,000 to $34,999 | 187 (10.1%) | 128 (10.5%) |
| $35,000 to $49,999 | 307 (16.6%) | 132 (10.8%) |
| $50,000 to $74,999 | 506 (27.3%) | 228 (18.7%) |
| $75,000 to $99,999 | 74 (4.0%) | 113 (9.3%) |
| $100,000 to $149,999 | 273 (14.7%) | 50 (4.1%) |
| $150,000 or more | 362 (19.5%) | 0 (0.0%) |
| Total | 1,853 (100.0%) | 1,220 (100.0%) |
Monthly Housing Cost Tiers in Bonham
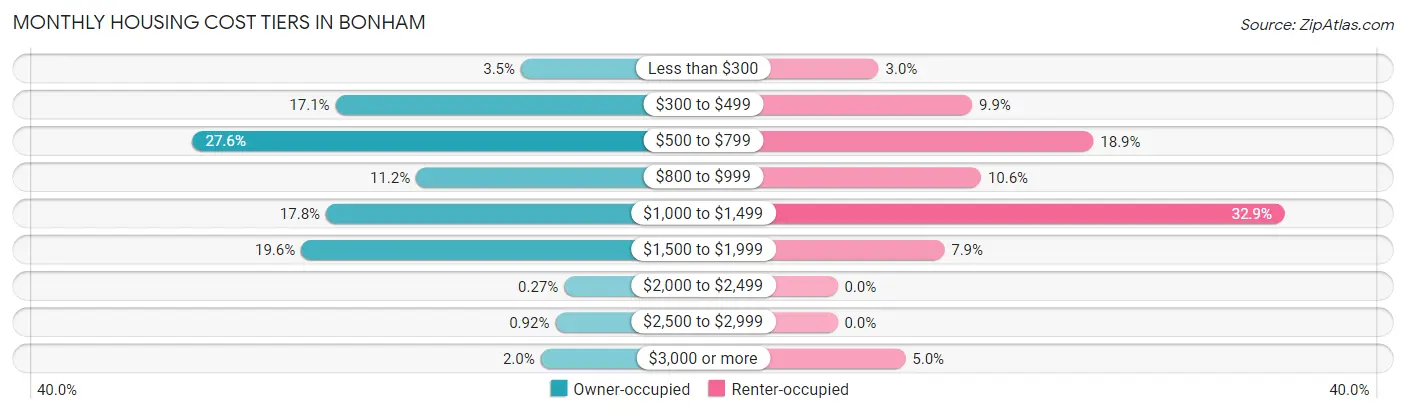
| Monthly Cost | Owner-occupied | Renter-occupied |
| Less than $300 | 64 (3.5%) | 37 (3.0%) |
| $300 to $499 | 317 (17.1%) | 121 (9.9%) |
| $500 to $799 | 512 (27.6%) | 230 (18.9%) |
| $800 to $999 | 207 (11.2%) | 129 (10.6%) |
| $1,000 to $1,499 | 330 (17.8%) | 401 (32.9%) |
| $1,500 to $1,999 | 364 (19.6%) | 96 (7.9%) |
| $2,000 to $2,499 | 5 (0.3%) | 0 (0.0%) |
| $2,500 to $2,999 | 17 (0.9%) | 0 (0.0%) |
| $3,000 or more | 37 (2.0%) | 61 (5.0%) |
| Total | 1,853 (100.0%) | 1,220 (100.0%) |
Physical Housing Characteristics in Bonham
Housing Structures in Bonham
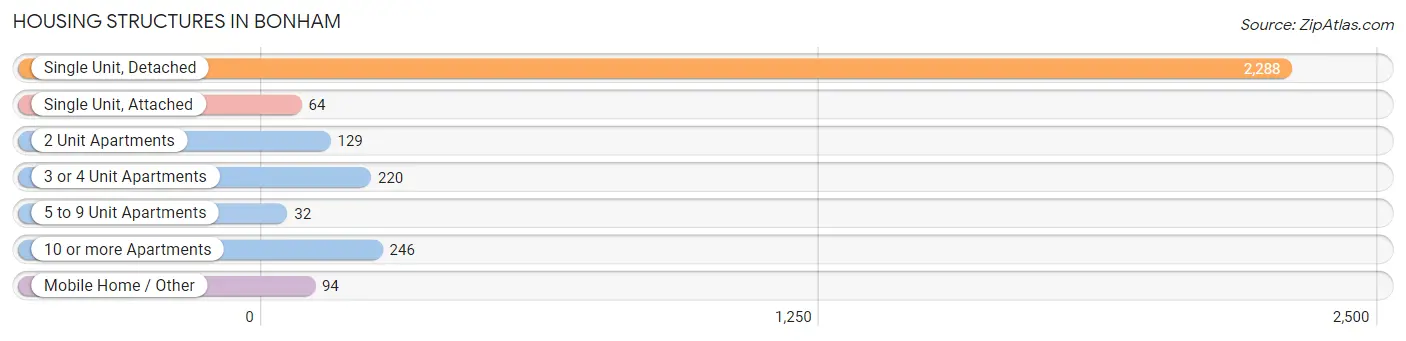
| Structure Type | # Housing Units | % Housing Units |
| Single Unit, Detached | 2,288 | 74.5% |
| Single Unit, Attached | 64 | 2.1% |
| 2 Unit Apartments | 129 | 4.2% |
| 3 or 4 Unit Apartments | 220 | 7.2% |
| 5 to 9 Unit Apartments | 32 | 1.0% |
| 10 or more Apartments | 246 | 8.0% |
| Mobile Home / Other | 94 | 3.1% |
| Total | 3,073 | 100.0% |
Housing Structures by Occupancy in Bonham
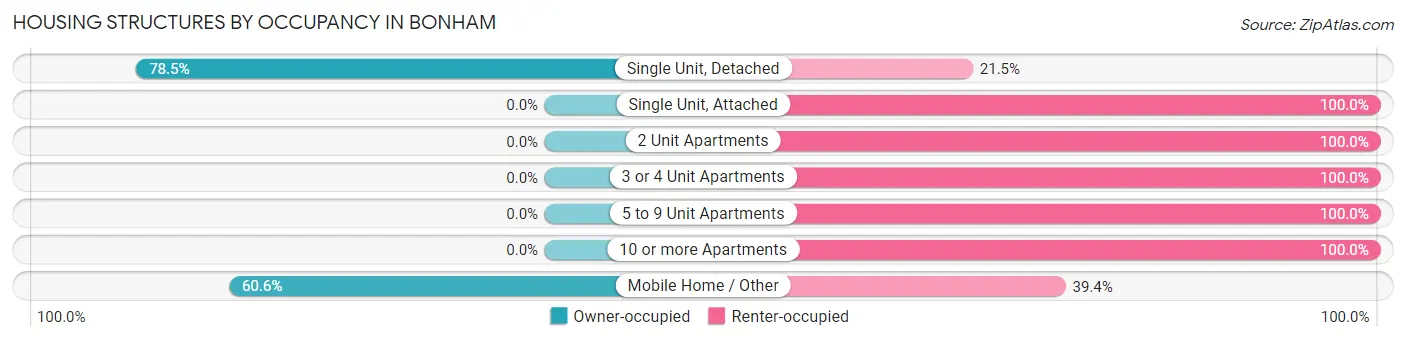
| Structure Type | Owner-occupied | Renter-occupied |
| Single Unit, Detached | 1,796 (78.5%) | 492 (21.5%) |
| Single Unit, Attached | 0 (0.0%) | 64 (100.0%) |
| 2 Unit Apartments | 0 (0.0%) | 129 (100.0%) |
| 3 or 4 Unit Apartments | 0 (0.0%) | 220 (100.0%) |
| 5 to 9 Unit Apartments | 0 (0.0%) | 32 (100.0%) |
| 10 or more Apartments | 0 (0.0%) | 246 (100.0%) |
| Mobile Home / Other | 57 (60.6%) | 37 (39.4%) |
| Total | 1,853 (60.3%) | 1,220 (39.7%) |
Housing Structures by Number of Rooms in Bonham
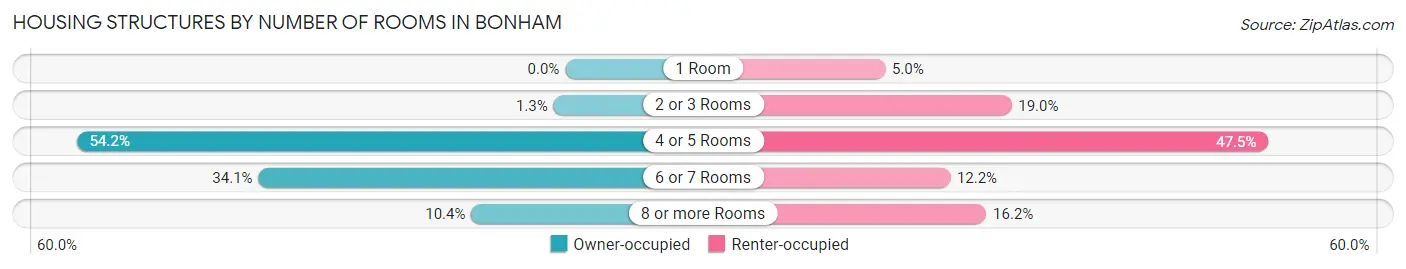
| Number of Rooms | Owner-occupied | Renter-occupied |
| 1 Room | 0 (0.0%) | 61 (5.0%) |
| 2 or 3 Rooms | 24 (1.3%) | 232 (19.0%) |
| 4 or 5 Rooms | 1,005 (54.2%) | 580 (47.5%) |
| 6 or 7 Rooms | 631 (34.1%) | 149 (12.2%) |
| 8 or more Rooms | 193 (10.4%) | 198 (16.2%) |
| Total | 1,853 (100.0%) | 1,220 (100.0%) |
Housing Structure by Heating Type in Bonham
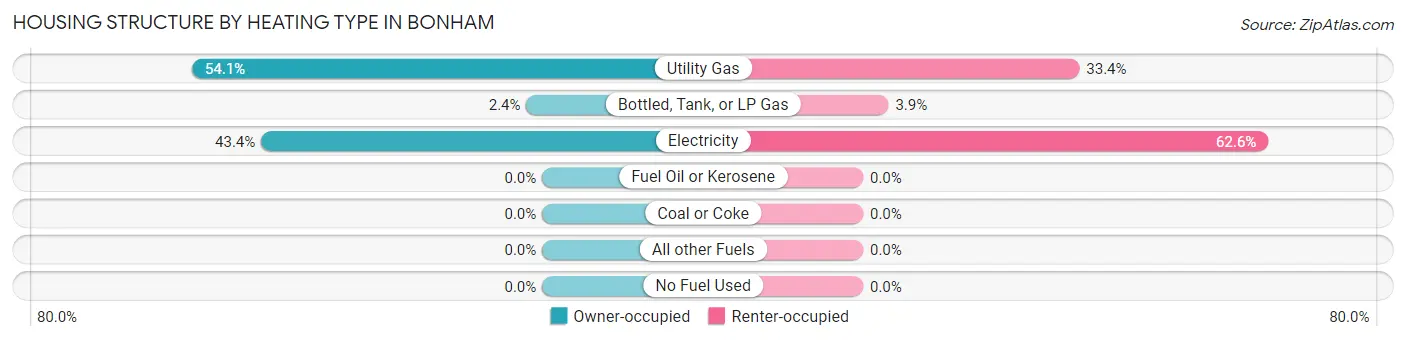
| Heating Type | Owner-occupied | Renter-occupied |
| Utility Gas | 1,003 (54.1%) | 408 (33.4%) |
| Bottled, Tank, or LP Gas | 45 (2.4%) | 48 (3.9%) |
| Electricity | 805 (43.4%) | 764 (62.6%) |
| Fuel Oil or Kerosene | 0 (0.0%) | 0 (0.0%) |
| Coal or Coke | 0 (0.0%) | 0 (0.0%) |
| All other Fuels | 0 (0.0%) | 0 (0.0%) |
| No Fuel Used | 0 (0.0%) | 0 (0.0%) |
| Total | 1,853 (100.0%) | 1,220 (100.0%) |
Household Vehicle Usage in Bonham
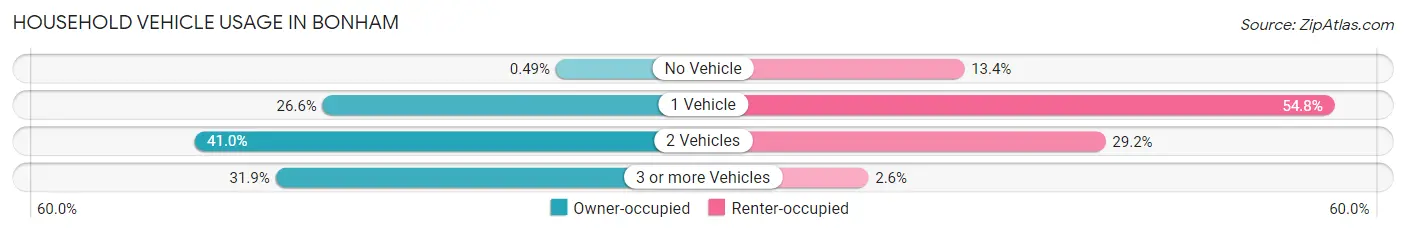
| Vehicles per Household | Owner-occupied | Renter-occupied |
| No Vehicle | 9 (0.5%) | 163 (13.4%) |
| 1 Vehicle | 493 (26.6%) | 669 (54.8%) |
| 2 Vehicles | 760 (41.0%) | 356 (29.2%) |
| 3 or more Vehicles | 591 (31.9%) | 32 (2.6%) |
| Total | 1,853 (100.0%) | 1,220 (100.0%) |
Real Estate & Mortgages in Bonham
Real Estate and Mortgage Overview in Bonham
| Characteristic | Without Mortgage | With Mortgage |
| Housing Units | 996 | 857 |
| Median Property Value | $97,900 | $201,300 |
| Median Household Income | $62,708 | $154 |
| Monthly Housing Costs | $564 | $37 |
| Real Estate Taxes | $1,817 | $23 |
Property Value by Mortgage Status in Bonham
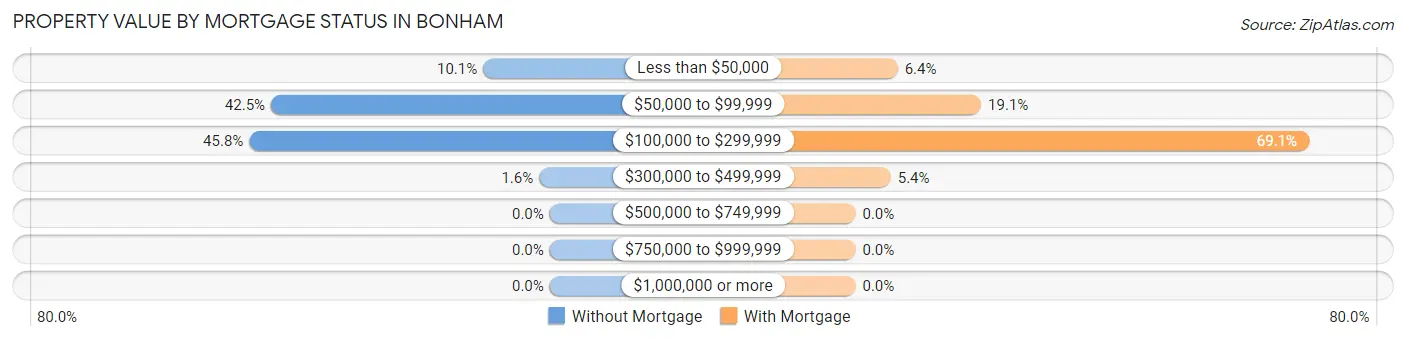
| Property Value | Without Mortgage | With Mortgage |
| Less than $50,000 | 101 (10.1%) | 55 (6.4%) |
| $50,000 to $99,999 | 423 (42.5%) | 164 (19.1%) |
| $100,000 to $299,999 | 456 (45.8%) | 592 (69.1%) |
| $300,000 to $499,999 | 16 (1.6%) | 46 (5.4%) |
| $500,000 to $749,999 | 0 (0.0%) | 0 (0.0%) |
| $750,000 to $999,999 | 0 (0.0%) | 0 (0.0%) |
| $1,000,000 or more | 0 (0.0%) | 0 (0.0%) |
| Total | 996 (100.0%) | 857 (100.0%) |
Household Income by Mortgage Status in Bonham
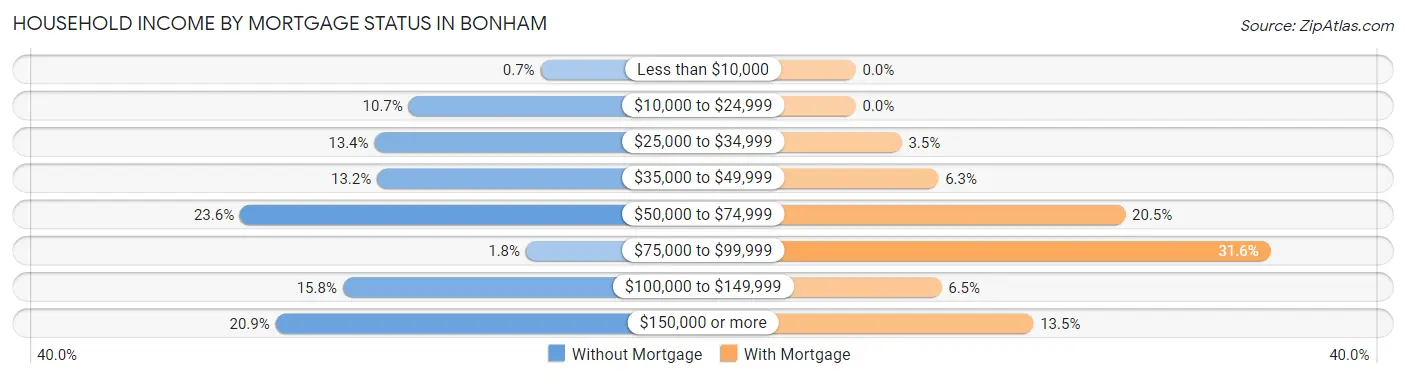
| Household Income | Without Mortgage | With Mortgage |
| Less than $10,000 | 7 (0.7%) | 0 (0.0%) |
| $10,000 to $24,999 | 107 (10.7%) | 0 (0.0%) |
| $25,000 to $34,999 | 133 (13.4%) | 30 (3.5%) |
| $35,000 to $49,999 | 131 (13.2%) | 54 (6.3%) |
| $50,000 to $74,999 | 235 (23.6%) | 176 (20.5%) |
| $75,000 to $99,999 | 18 (1.8%) | 271 (31.6%) |
| $100,000 to $149,999 | 157 (15.8%) | 56 (6.5%) |
| $150,000 or more | 208 (20.9%) | 116 (13.5%) |
| Total | 996 (100.0%) | 857 (100.0%) |
Property Value to Household Income Ratio in Bonham
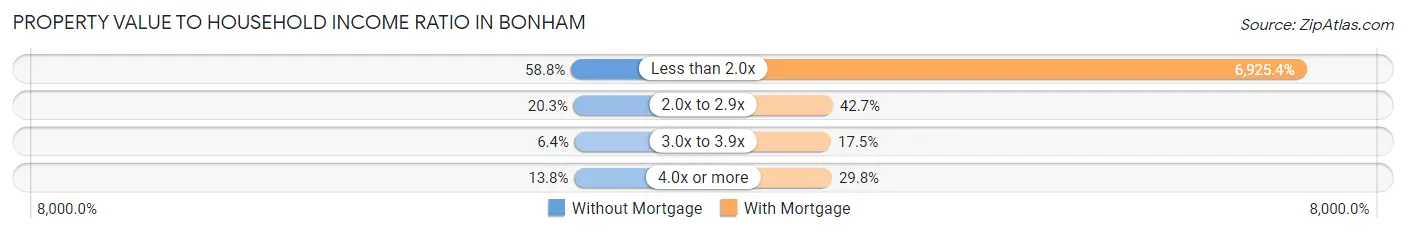
| Value-to-Income Ratio | Without Mortgage | With Mortgage |
| Less than 2.0x | 586 (58.8%) | 59,351 (6,925.4%) |
| 2.0x to 2.9x | 202 (20.3%) | 366 (42.7%) |
| 3.0x to 3.9x | 64 (6.4%) | 150 (17.5%) |
| 4.0x or more | 137 (13.8%) | 255 (29.7%) |
| Total | 996 (100.0%) | 857 (100.0%) |
Real Estate Taxes by Mortgage Status in Bonham
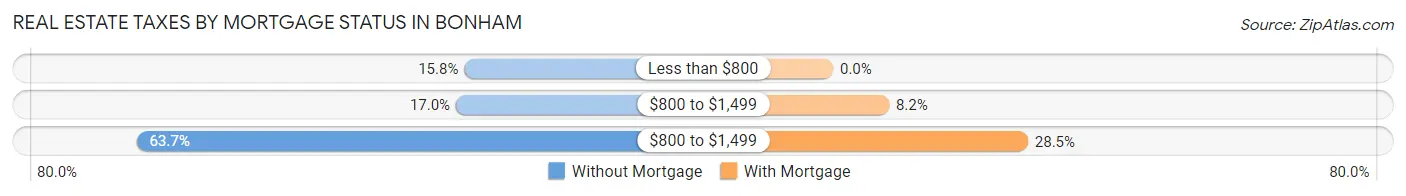
| Property Taxes | Without Mortgage | With Mortgage |
| Less than $800 | 157 (15.8%) | 0 (0.0%) |
| $800 to $1,499 | 169 (17.0%) | 70 (8.2%) |
| $800 to $1,499 | 634 (63.6%) | 244 (28.5%) |
| Total | 996 (100.0%) | 857 (100.0%) |
Health & Disability in Bonham
Health Insurance Coverage by Age in Bonham
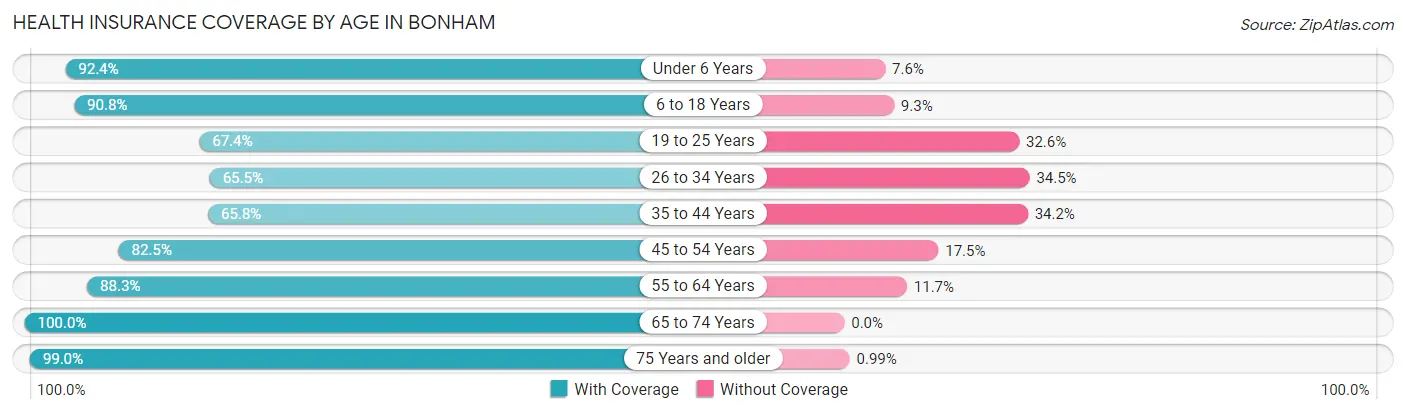
| Age Bracket | With Coverage | Without Coverage |
| Under 6 Years | 631 (92.4%) | 52 (7.6%) |
| 6 to 18 Years | 1,226 (90.7%) | 125 (9.2%) |
| 19 to 25 Years | 453 (67.4%) | 219 (32.6%) |
| 26 to 34 Years | 565 (65.5%) | 298 (34.5%) |
| 35 to 44 Years | 831 (65.8%) | 432 (34.2%) |
| 45 to 54 Years | 814 (82.5%) | 173 (17.5%) |
| 55 to 64 Years | 651 (88.3%) | 86 (11.7%) |
| 65 to 74 Years | 709 (100.0%) | 0 (0.0%) |
| 75 Years and older | 502 (99.0%) | 5 (1.0%) |
| Total | 6,382 (82.1%) | 1,390 (17.9%) |
Health Insurance Coverage by Citizenship Status in Bonham
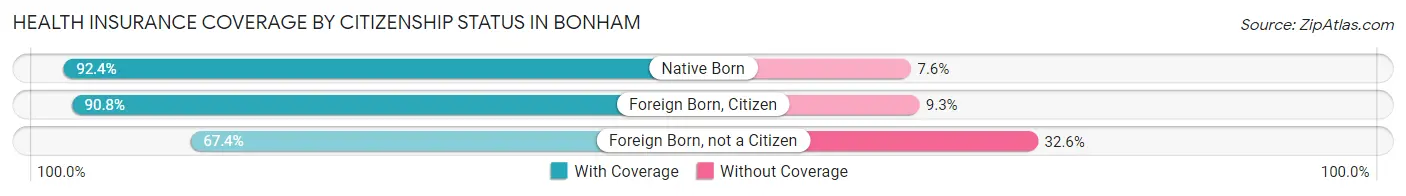
| Citizenship Status | With Coverage | Without Coverage |
| Native Born | 631 (92.4%) | 52 (7.6%) |
| Foreign Born, Citizen | 1,226 (90.7%) | 125 (9.2%) |
| Foreign Born, not a Citizen | 453 (67.4%) | 219 (32.6%) |
Health Insurance Coverage by Household Income in Bonham
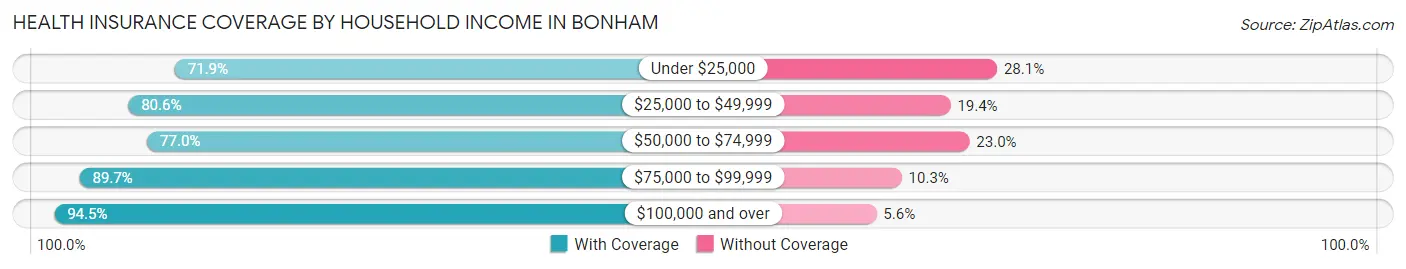
| Household Income | With Coverage | Without Coverage |
| Under $25,000 | 779 (71.9%) | 305 (28.1%) |
| $25,000 to $49,999 | 1,473 (80.6%) | 355 (19.4%) |
| $50,000 to $74,999 | 1,502 (77.0%) | 448 (23.0%) |
| $75,000 to $99,999 | 445 (89.7%) | 51 (10.3%) |
| $100,000 and over | 2,078 (94.5%) | 122 (5.6%) |
Public vs Private Health Insurance Coverage by Age in Bonham
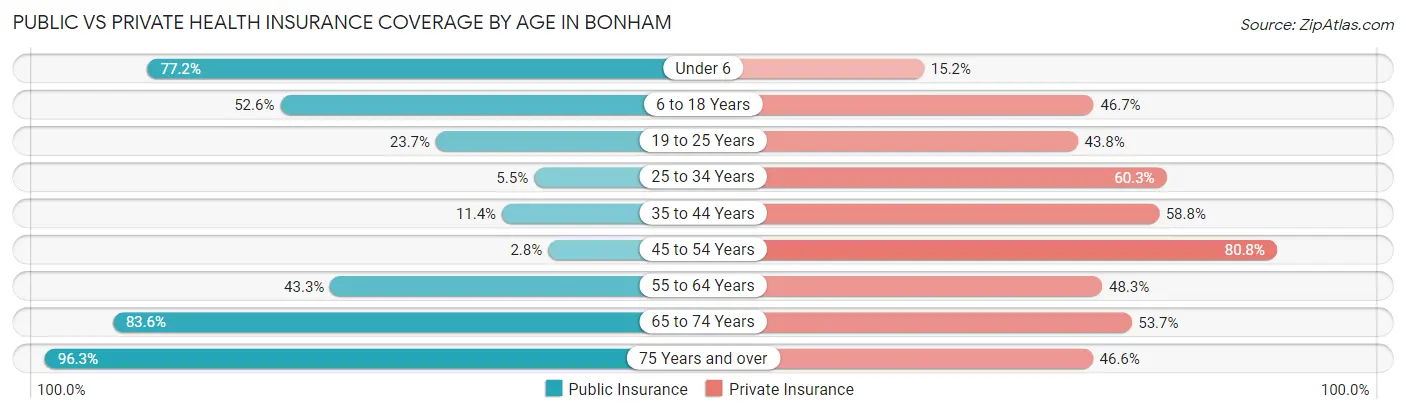
| Age Bracket | Public Insurance | Private Insurance |
| Under 6 | 527 (77.2%) | 104 (15.2%) |
| 6 to 18 Years | 710 (52.5%) | 631 (46.7%) |
| 19 to 25 Years | 159 (23.7%) | 294 (43.8%) |
| 25 to 34 Years | 47 (5.4%) | 520 (60.3%) |
| 35 to 44 Years | 144 (11.4%) | 743 (58.8%) |
| 45 to 54 Years | 28 (2.8%) | 797 (80.7%) |
| 55 to 64 Years | 319 (43.3%) | 356 (48.3%) |
| 65 to 74 Years | 593 (83.6%) | 381 (53.7%) |
| 75 Years and over | 488 (96.3%) | 236 (46.6%) |
| Total | 3,015 (38.8%) | 4,062 (52.3%) |
Disability Status by Sex by Age in Bonham
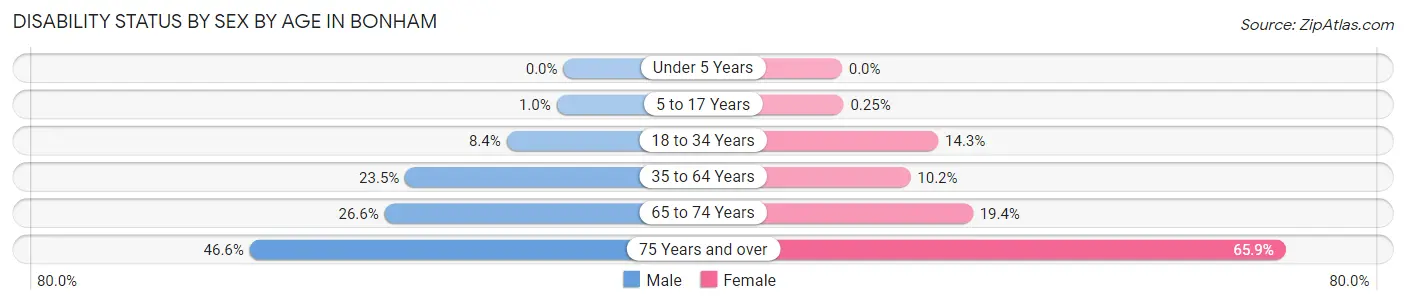
| Age Bracket | Male | Female |
| Under 5 Years | 0 (0.0%) | 0 (0.0%) |
| 5 to 17 Years | 6 (1.0%) | 2 (0.3%) |
| 18 to 34 Years | 73 (8.4%) | 114 (14.3%) |
| 35 to 64 Years | 353 (23.5%) | 151 (10.2%) |
| 65 to 74 Years | 94 (26.6%) | 69 (19.4%) |
| 75 Years and over | 116 (46.6%) | 170 (65.9%) |
Disability Class by Sex by Age in Bonham
Disability Class: Hearing Difficulty
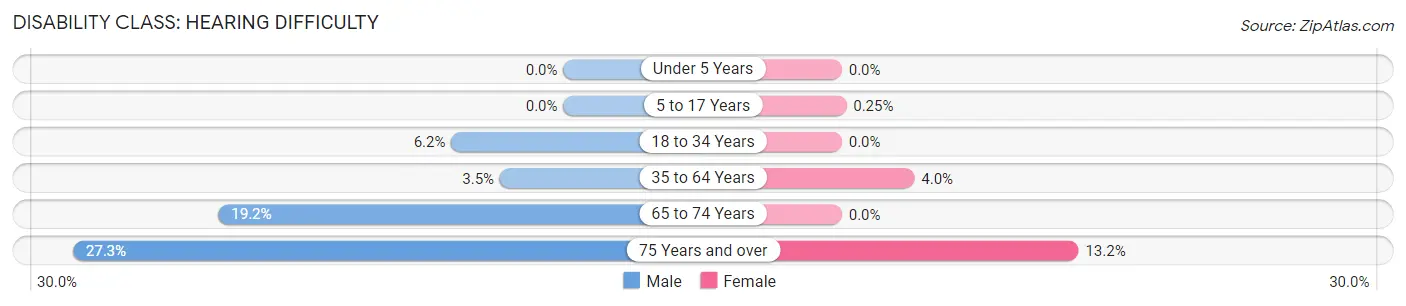
| Age Bracket | Male | Female |
| Under 5 Years | 0 (0.0%) | 0 (0.0%) |
| 5 to 17 Years | 0 (0.0%) | 2 (0.3%) |
| 18 to 34 Years | 54 (6.2%) | 0 (0.0%) |
| 35 to 64 Years | 53 (3.5%) | 60 (4.0%) |
| 65 to 74 Years | 68 (19.2%) | 0 (0.0%) |
| 75 Years and over | 68 (27.3%) | 34 (13.2%) |
Disability Class: Vision Difficulty
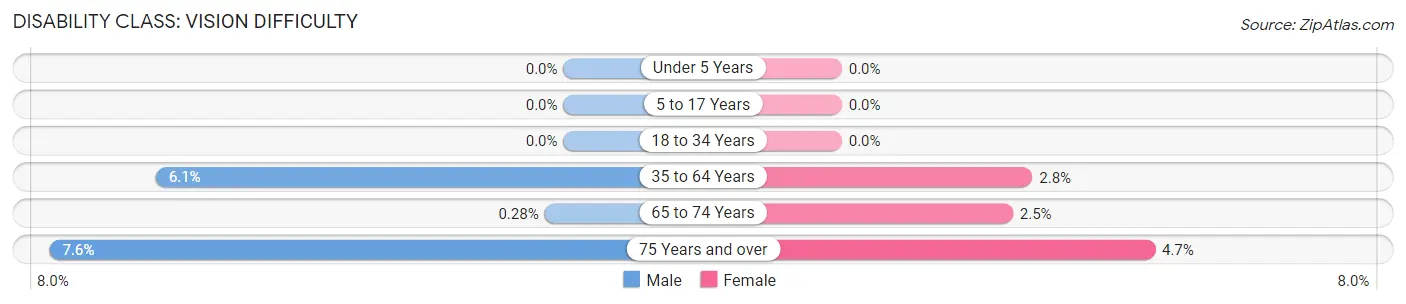
| Age Bracket | Male | Female |
| Under 5 Years | 0 (0.0%) | 0 (0.0%) |
| 5 to 17 Years | 0 (0.0%) | 0 (0.0%) |
| 18 to 34 Years | 0 (0.0%) | 0 (0.0%) |
| 35 to 64 Years | 91 (6.0%) | 42 (2.8%) |
| 65 to 74 Years | 1 (0.3%) | 9 (2.5%) |
| 75 Years and over | 19 (7.6%) | 12 (4.6%) |
Disability Class: Cognitive Difficulty
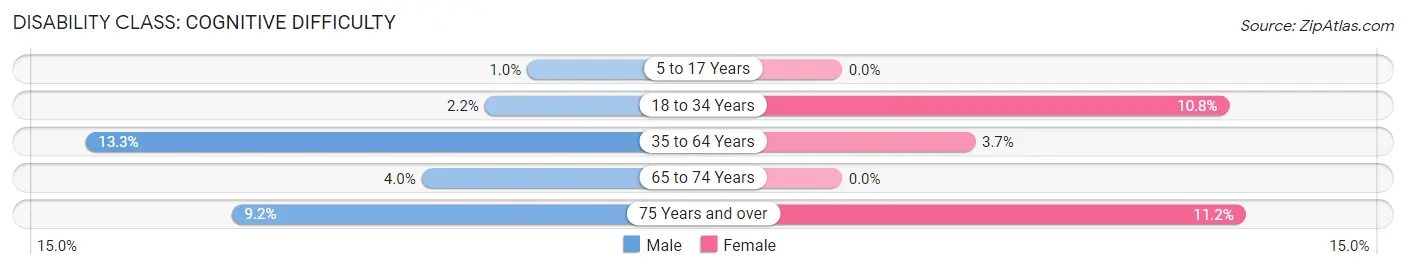
| Age Bracket | Male | Female |
| 5 to 17 Years | 6 (1.0%) | 0 (0.0%) |
| 18 to 34 Years | 19 (2.2%) | 86 (10.8%) |
| 35 to 64 Years | 200 (13.3%) | 55 (3.7%) |
| 65 to 74 Years | 14 (4.0%) | 0 (0.0%) |
| 75 Years and over | 23 (9.2%) | 29 (11.2%) |
Disability Class: Ambulatory Difficulty
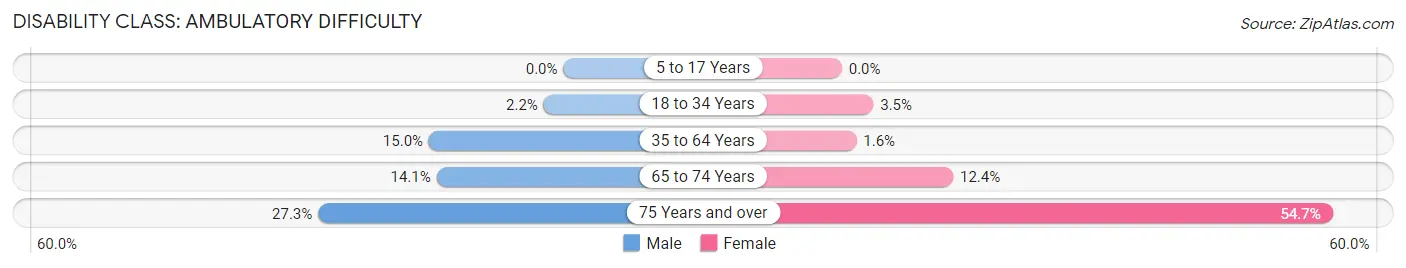
| Age Bracket | Male | Female |
| 5 to 17 Years | 0 (0.0%) | 0 (0.0%) |
| 18 to 34 Years | 19 (2.2%) | 28 (3.5%) |
| 35 to 64 Years | 225 (15.0%) | 24 (1.6%) |
| 65 to 74 Years | 50 (14.1%) | 44 (12.4%) |
| 75 Years and over | 68 (27.3%) | 141 (54.6%) |
Disability Class: Self-Care Difficulty
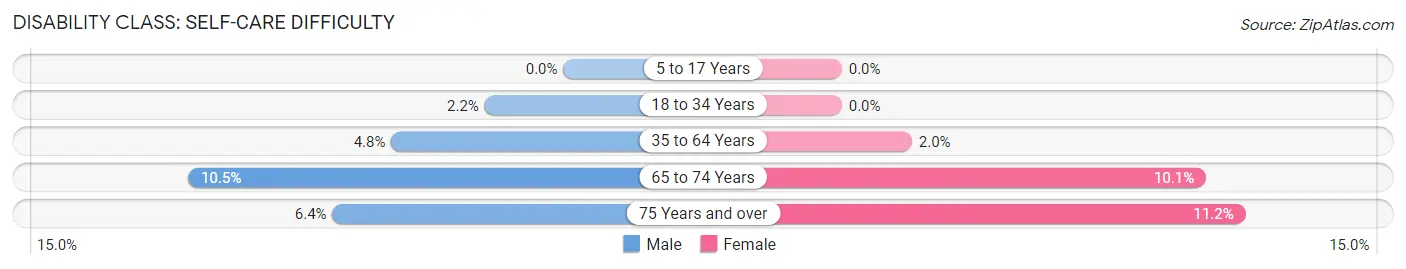
| Age Bracket | Male | Female |
| 5 to 17 Years | 0 (0.0%) | 0 (0.0%) |
| 18 to 34 Years | 19 (2.2%) | 0 (0.0%) |
| 35 to 64 Years | 72 (4.8%) | 29 (1.9%) |
| 65 to 74 Years | 37 (10.4%) | 36 (10.1%) |
| 75 Years and over | 16 (6.4%) | 29 (11.2%) |
Technology Access in Bonham
Computing Device Access in Bonham
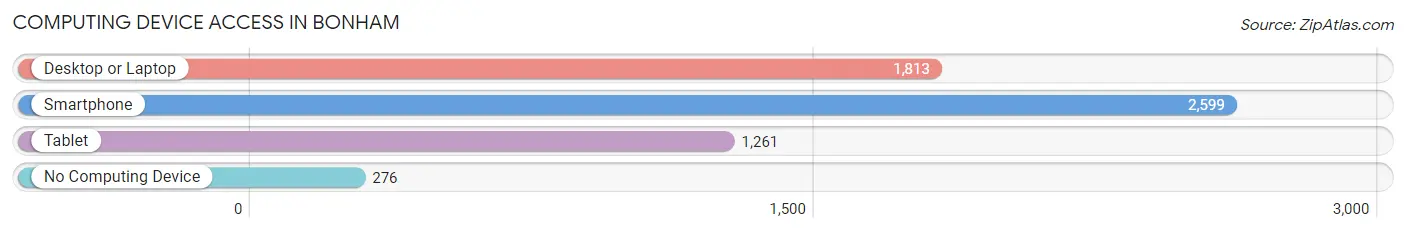
| Device Type | # Households | % Households |
| Desktop or Laptop | 1,813 | 59.0% |
| Smartphone | 2,599 | 84.6% |
| Tablet | 1,261 | 41.0% |
| No Computing Device | 276 | 9.0% |
| Total | 3,073 | 100.0% |
Internet Access in Bonham
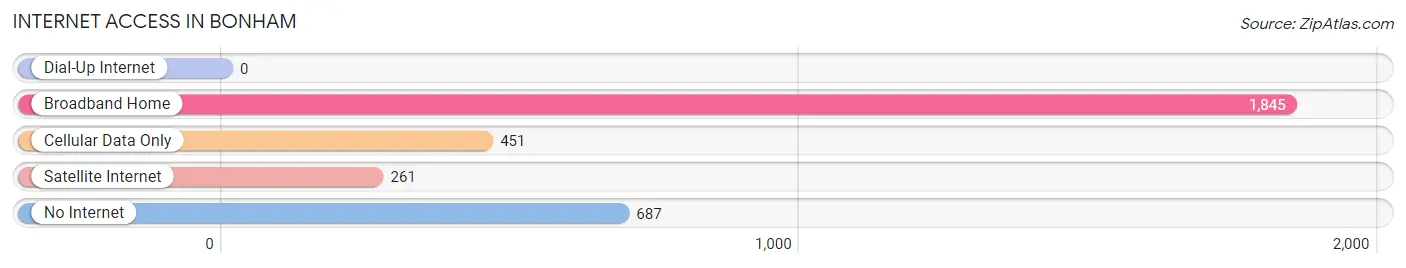
| Internet Type | # Households | % Households |
| Dial-Up Internet | 0 | 0.0% |
| Broadband Home | 1,845 | 60.0% |
| Cellular Data Only | 451 | 14.7% |
| Satellite Internet | 261 | 8.5% |
| No Internet | 687 | 22.4% |
| Total | 3,073 | 100.0% |
Bonham Summary
Introduction
Bonham is a city located in Fannin County, Texas, United States. It is the county seat of Fannin County and is situated in the northeastern part of the state. The city is located on the Red River, which forms the border between Texas and Oklahoma. Bonham is part of the Texoma region and is approximately 75 miles northeast of Dallas. The city has a population of 10,127 as of the 2010 census.
History
Bonham was founded in 1837 by Bailey Inglish, a settler from Tennessee. The city was named after James Butler Bonham, a hero of the Battle of the Alamo. Bonham was an important stop on the Butterfield Overland Mail route and was the site of the first post office in Fannin County. The city was incorporated in 1873 and has since grown to become the county seat of Fannin County.
Geography
Bonham is located at 33°34'N 96°11'W (33.567, -96.183). The city has a total area of 8.2 square miles, all of which is land. The Red River forms the border between Texas and Oklahoma and is located just south of the city. Bonham is located in the Texoma region of Texas and is approximately 75 miles northeast of Dallas.
Climate
Bonham has a humid subtropical climate, with hot summers and mild winters. The average annual temperature is 64°F, with an average high of 87°F in the summer and an average low of 41°F in the winter. The average annual precipitation is 37.5 inches, with an average of 4.5 inches of snowfall per year.
Economy
Bonham’s economy is largely based on agriculture and manufacturing. The city is home to several large manufacturing companies, including Bonham Industries, which produces automotive parts, and Bonham Plastics, which produces plastic products. The city is also home to several agricultural businesses, including cattle ranches, dairy farms, and poultry farms.
Demographics
As of the 2010 census, Bonham had a population of 10,127. The racial makeup of the city was 79.3% White, 15.2% Hispanic or Latino, 2.3% African American, 0.7% Native American, 0.5% Asian, and 2.0% from other races. The median household income was $37,945, and the median family income was $45,945.
Conclusion
Bonham is a city located in Fannin County, Texas, United States. It is the county seat of Fannin County and is situated in the northeastern part of the state. The city is located on the Red River, which forms the border between Texas and Oklahoma. Bonham is part of the Texoma region and is approximately 75 miles northeast of Dallas. The city has a population of 10,127 as of the 2010 census. Bonham’s economy is largely based on agriculture and manufacturing, and the city is home to several large manufacturing companies and agricultural businesses. The racial makeup of the city is 79.3% White, 15.2% Hispanic or Latino, 2.3% African American, 0.7% Native American, 0.5% Asian, and 2.0% from other races. The median household income was $37,945, and the median family income was $45,945.
Common Questions
What is Per Capita Income in Bonham?
Per Capita income in Bonham is $25,520.
What is the Median Family Income in Bonham?
Median Family Income in Bonham is $59,524.
What is the Median Household income in Bonham?
Median Household Income in Bonham is $53,899.
What is Income or Wage Gap in Bonham?
Income or Wage Gap in Bonham is 5.2%.
Women in Bonham earn 94.8 cents for every dollar earned by a man.
What is Inequality or Gini Index in Bonham?
Inequality or Gini Index in Bonham is 0.52.
What is the Total Population of Bonham?
Total Population of Bonham is 10,485.
What is the Total Male Population of Bonham?
Total Male Population of Bonham is 6,386.
What is the Total Female Population of Bonham?
Total Female Population of Bonham is 4,099.
What is the Ratio of Males per 100 Females in Bonham?
There are 155.79 Males per 100 Females in Bonham.
What is the Ratio of Females per 100 Males in Bonham?
There are 64.19 Females per 100 Males in Bonham.
What is the Median Population Age in Bonham?
Median Population Age in Bonham is 36.4 Years.
What is the Average Family Size in Bonham
Average Family Size in Bonham is 3.2 People.
What is the Average Household Size in Bonham
Average Household Size in Bonham is 2.5 People.
How Large is the Labor Force in Bonham?
There are 3,614 People in the Labor Forcein in Bonham.
What is the Percentage of People in the Labor Force in Bonham?
40.9% of People are in the Labor Force in Bonham.
What is the Unemployment Rate in Bonham?
Unemployment Rate in Bonham is 6.3%.