Cameron, TX Map & Demographics
Cameron Map
Cameron Overview
$23,700
PER CAPITA INCOME
$61,437
AVG FAMILY INCOME
$57,076
AVG HOUSEHOLD INCOME
31.5%
WAGE / INCOME GAP [ % ]
68.5¢/ $1
WAGE / INCOME GAP [ $ ]
0.40
INEQUALITY / GINI INDEX
5,356
TOTAL POPULATION
2,665
MALE POPULATION
2,691
FEMALE POPULATION
99.03
MALES / 100 FEMALES
100.98
FEMALES / 100 MALES
36.1
MEDIAN AGE
3.5
AVG FAMILY SIZE
2.9
AVG HOUSEHOLD SIZE
2,417
LABOR FORCE [ PEOPLE ]
62.1%
PERCENT IN LABOR FORCE
5.1%
UNEMPLOYMENT RATE
Cameron Zip Codes
Cameron Area Codes
Income in Cameron
Income Overview in Cameron
Per Capita Income in Cameron is $23,700, while median incomes of families and households are $61,437 and $57,076 respectively.
| Characteristic | Number | Measure |
| Per Capita Income | 5,356 | $23,700 |
| Median Family Income | 1,261 | $61,437 |
| Mean Family Income | 1,261 | $76,321 |
| Median Household Income | 1,753 | $57,076 |
| Mean Household Income | 1,753 | $66,871 |
| Income Deficit | 1,261 | $0 |
| Wage / Income Gap (%) | 5,356 | 31.52% |
| Wage / Income Gap ($) | 5,356 | 68.48¢ per $1 |
| Gini / Inequality Index | 5,356 | 0.40 |
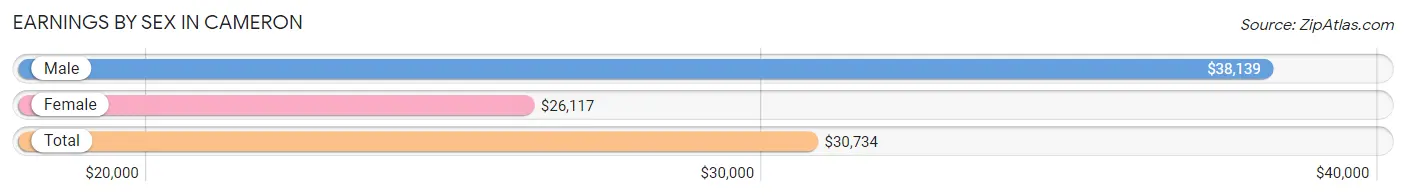
Earnings by Sex in Cameron
Average Earnings in Cameron are $30,734, $38,139 for men and $26,117 for women, a difference of 31.5%.
| Sex | Number | Average Earnings |
| Male | 1,193 (48.7%) | $38,139 |
| Female | 1,257 (51.3%) | $26,117 |
| Total | 2,450 (100.0%) | $30,734 |
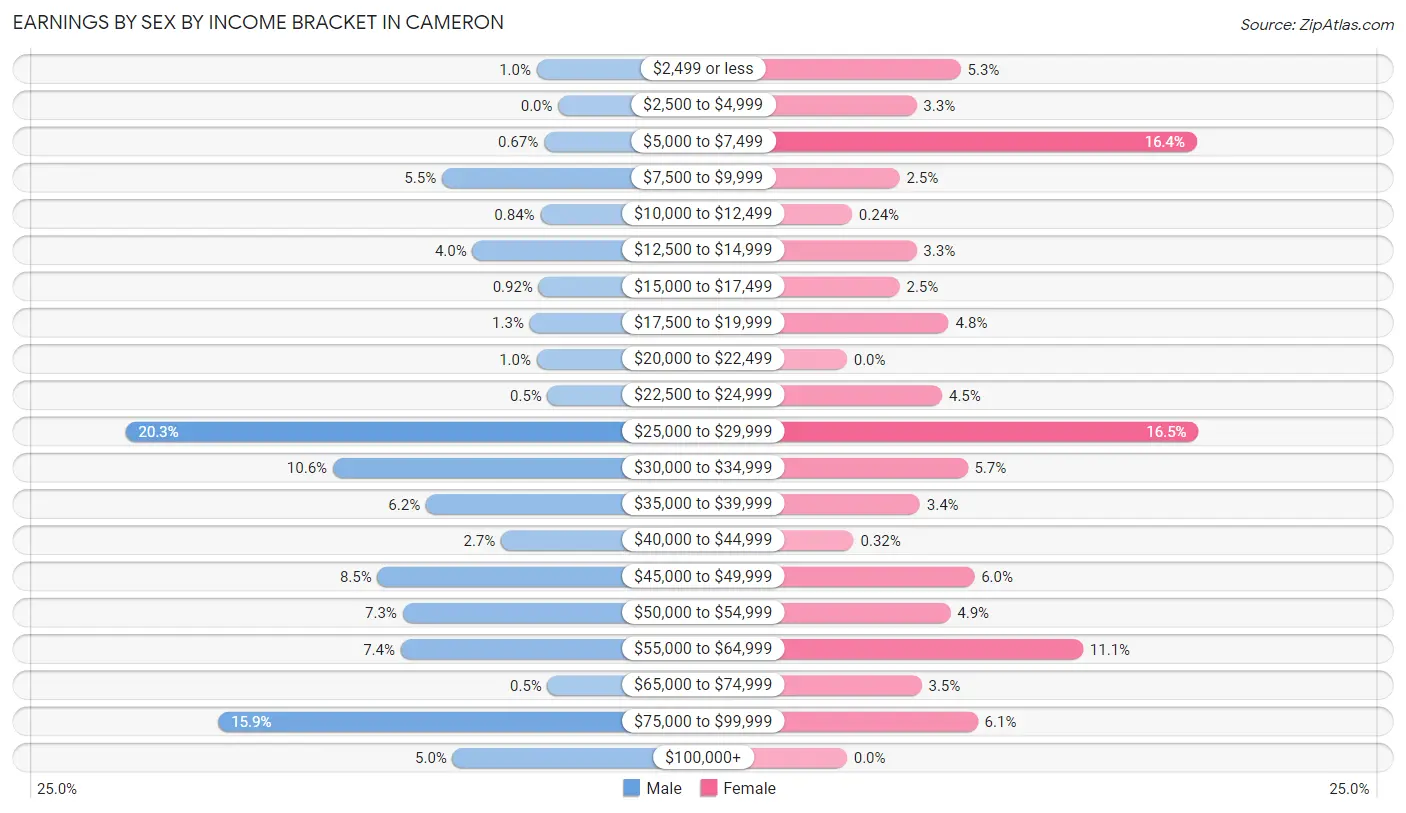
Earnings by Sex by Income Bracket in Cameron
The most common earnings brackets in Cameron are $25,000 to $29,999 for men (242 | 20.3%) and $25,000 to $29,999 for women (207 | 16.5%).
| Income | Male | Female |
| $2,499 or less | 12 (1.0%) | 67 (5.3%) |
| $2,500 to $4,999 | 0 (0.0%) | 41 (3.3%) |
| $5,000 to $7,499 | 8 (0.7%) | 206 (16.4%) |
| $7,500 to $9,999 | 65 (5.4%) | 31 (2.5%) |
| $10,000 to $12,499 | 10 (0.8%) | 3 (0.2%) |
| $12,500 to $14,999 | 48 (4.0%) | 41 (3.3%) |
| $15,000 to $17,499 | 11 (0.9%) | 31 (2.5%) |
| $17,500 to $19,999 | 16 (1.3%) | 60 (4.8%) |
| $20,000 to $22,499 | 12 (1.0%) | 0 (0.0%) |
| $22,500 to $24,999 | 6 (0.5%) | 56 (4.5%) |
| $25,000 to $29,999 | 242 (20.3%) | 207 (16.5%) |
| $30,000 to $34,999 | 126 (10.6%) | 71 (5.7%) |
| $35,000 to $39,999 | 74 (6.2%) | 43 (3.4%) |
| $40,000 to $44,999 | 32 (2.7%) | 4 (0.3%) |
| $45,000 to $49,999 | 101 (8.5%) | 75 (6.0%) |
| $50,000 to $54,999 | 87 (7.3%) | 61 (4.9%) |
| $55,000 to $64,999 | 88 (7.4%) | 139 (11.1%) |
| $65,000 to $74,999 | 6 (0.5%) | 44 (3.5%) |
| $75,000 to $99,999 | 190 (15.9%) | 77 (6.1%) |
| $100,000+ | 59 (5.0%) | 0 (0.0%) |
| Total | 1,193 (100.0%) | 1,257 (100.0%) |
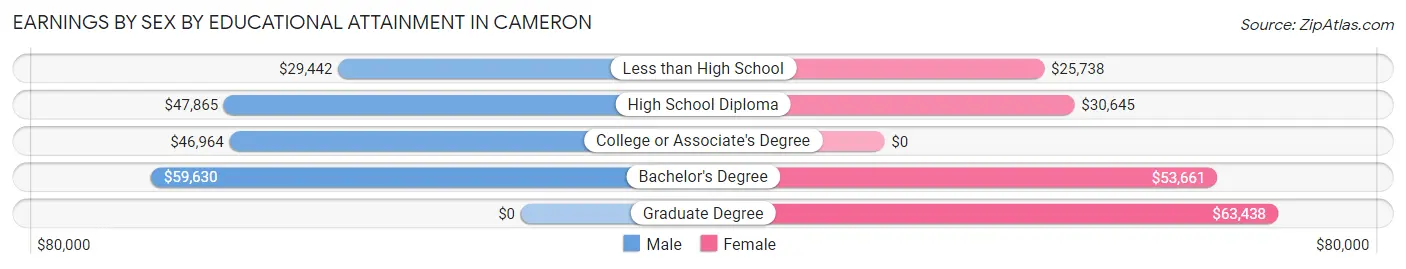
Earnings by Sex by Educational Attainment in Cameron
Average earnings in Cameron are $41,719 for men and $27,319 for women, a difference of 34.5%. Men with an educational attainment of bachelor's degree enjoy the highest average annual earnings of $59,630, while those with less than high school education earn the least with $29,442. Women with an educational attainment of graduate degree earn the most with the average annual earnings of $63,438, while those with less than high school education have the smallest earnings of $25,738.
| Educational Attainment | Male Income | Female Income |
| Less than High School | $29,442 | $25,738 |
| High School Diploma | $47,865 | $30,645 |
| College or Associate's Degree | $46,964 | $0 |
| Bachelor's Degree | $59,630 | $53,661 |
| Graduate Degree | - | - |
| Total | $41,719 | $27,319 |
Family Income in Cameron
Family Income Brackets in Cameron
According to the Cameron family income data, there are 284 families falling into the $50,000 to $74,999 income range, which is the most common income bracket and makes up 22.5% of all families. Conversely, the $200,000+ income bracket is the least frequent group with only 25 families (2.0%) belonging to this category.
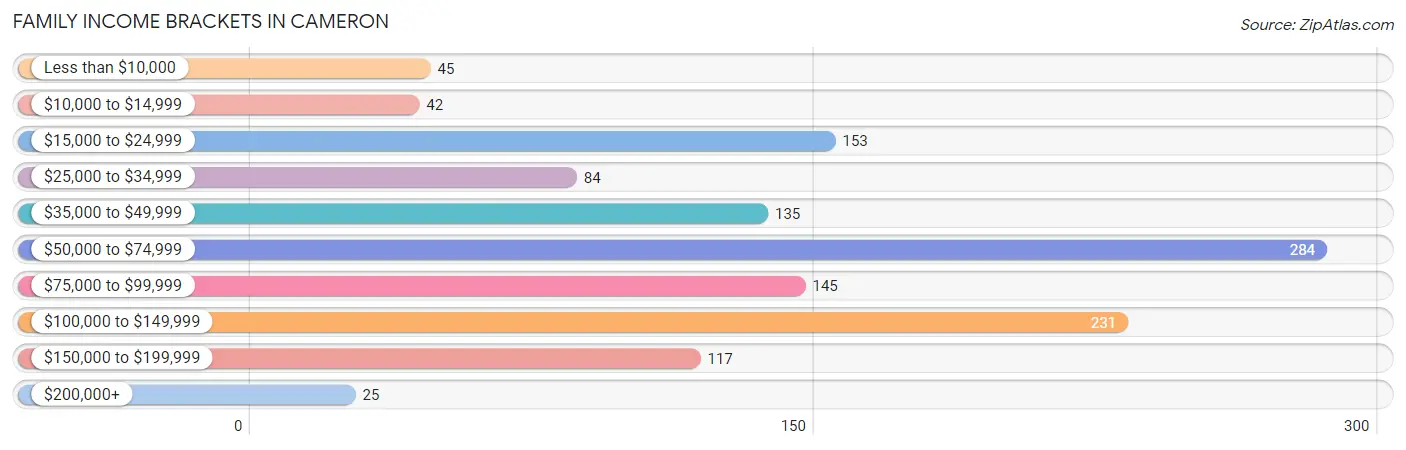
| Income Bracket | # Families | % Families |
| Less than $10,000 | 45 | 3.6% |
| $10,000 to $14,999 | 42 | 3.3% |
| $15,000 to $24,999 | 153 | 12.1% |
| $25,000 to $34,999 | 84 | 6.7% |
| $35,000 to $49,999 | 135 | 10.7% |
| $50,000 to $74,999 | 284 | 22.5% |
| $75,000 to $99,999 | 145 | 11.5% |
| $100,000 to $149,999 | 231 | 18.3% |
| $150,000 to $199,999 | 117 | 9.3% |
| $200,000+ | 25 | 2.0% |
Family Income by Famaliy Size in Cameron
4-person families (353 | 28.0%) account for the highest median family income in Cameron with $108,496 per family, while 2-person families (524 | 41.5%) have the highest median income of $28,882 per family member.
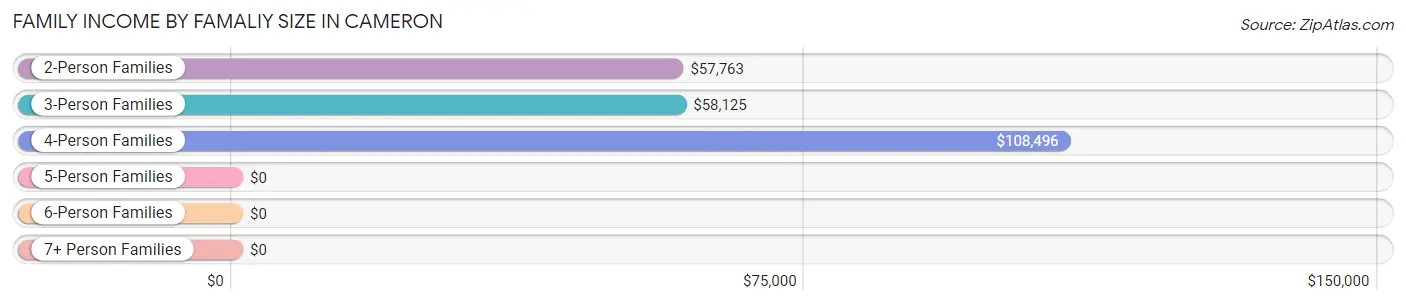
| Income Bracket | # Families | Median Income |
| 2-Person Families | 524 (41.5%) | $57,763 |
| 3-Person Families | 255 (20.2%) | $58,125 |
| 4-Person Families | 353 (28.0%) | $108,496 |
| 5-Person Families | 43 (3.4%) | $0 |
| 6-Person Families | 28 (2.2%) | $0 |
| 7+ Person Families | 58 (4.6%) | $0 |
| Total | 1,261 (100.0%) | $61,437 |
Family Income by Number of Earners in Cameron
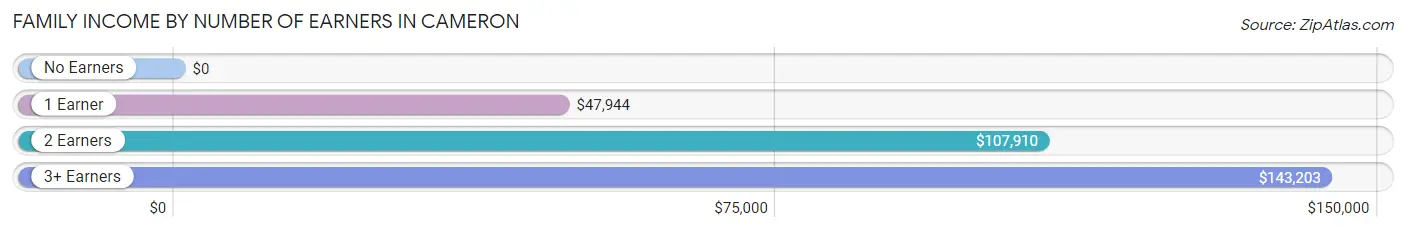
| Number of Earners | # Families | Median Income |
| No Earners | 156 (12.4%) | $0 |
| 1 Earner | 453 (35.9%) | $47,944 |
| 2 Earners | 553 (43.9%) | $107,910 |
| 3+ Earners | 99 (7.9%) | $143,203 |
| Total | 1,261 (100.0%) | $61,437 |
Household Income in Cameron
Household Income Brackets in Cameron
With 475 households falling in the category, the $50,000 to $74,999 income range is the most frequent in Cameron, accounting for 27.1% of all households. In contrast, only 25 households (1.4%) fall into the $200,000+ income bracket, making it the least populous group.
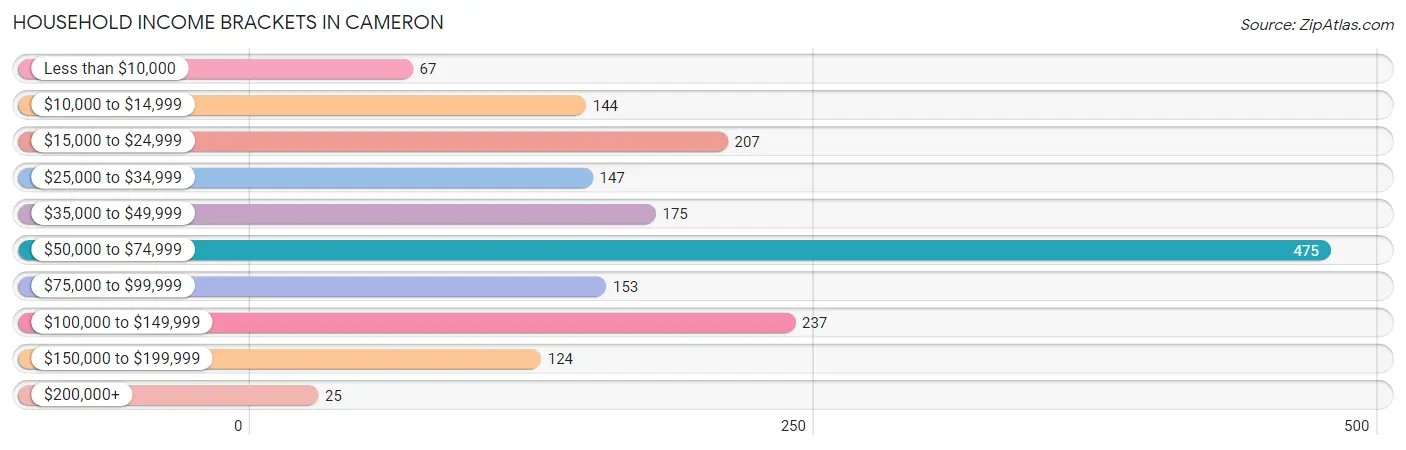
| Income Bracket | # Households | % Households |
| Less than $10,000 | 67 | 3.8% |
| $10,000 to $14,999 | 144 | 8.2% |
| $15,000 to $24,999 | 207 | 11.8% |
| $25,000 to $34,999 | 147 | 8.4% |
| $35,000 to $49,999 | 175 | 10.0% |
| $50,000 to $74,999 | 475 | 27.1% |
| $75,000 to $99,999 | 153 | 8.7% |
| $100,000 to $149,999 | 237 | 13.5% |
| $150,000 to $199,999 | 124 | 7.1% |
| $200,000+ | 25 | 1.4% |
Household Income by Householder Age in Cameron
The median household income in Cameron is $57,076, with the highest median household income of $78,472 found in the 25 to 44 years age bracket for the primary householder. A total of 546 households (31.1%) fall into this category. Meanwhile, the 15 to 24 years age bracket for the primary householder has the lowest median household income of $0, with 53 households (3.0%) in this group.
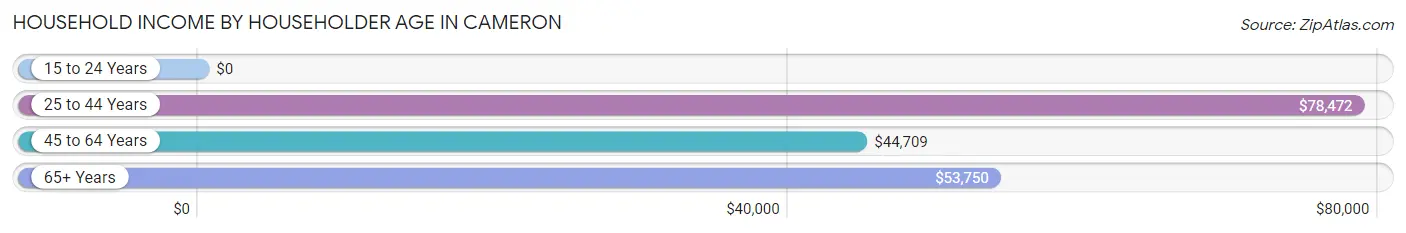
| Income Bracket | # Households | Median Income |
| 15 to 24 Years | 53 (3.0%) | $0 |
| 25 to 44 Years | 546 (31.1%) | $78,472 |
| 45 to 64 Years | 692 (39.5%) | $44,709 |
| 65+ Years | 462 (26.4%) | $53,750 |
| Total | 1,753 (100.0%) | $57,076 |
Poverty in Cameron
Income Below Poverty by Sex and Age in Cameron
With 22.4% poverty level for males and 26.3% for females among the residents of Cameron, 12 to 14 year old males and 16 and 17 year old females are the most vulnerable to poverty, with 25 males (100.0%) and 23 females (100.0%) in their respective age groups living below the poverty level.
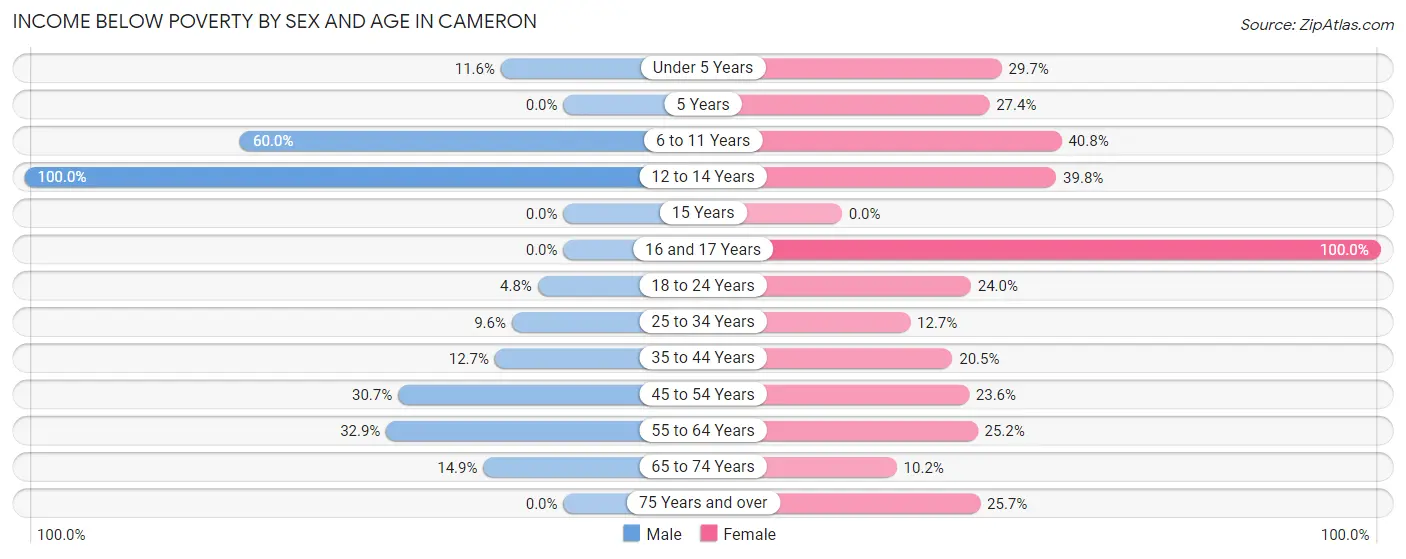
| Age Bracket | Male | Female |
| Under 5 Years | 18 (11.6%) | 35 (29.7%) |
| 5 Years | 0 (0.0%) | 26 (27.4%) |
| 6 to 11 Years | 228 (60.0%) | 146 (40.8%) |
| 12 to 14 Years | 25 (100.0%) | 76 (39.8%) |
| 15 Years | 0 (0.0%) | 0 (0.0%) |
| 16 and 17 Years | 0 (0.0%) | 23 (100.0%) |
| 18 to 24 Years | 8 (4.8%) | 57 (23.9%) |
| 25 to 34 Years | 35 (9.6%) | 26 (12.7%) |
| 35 to 44 Years | 48 (12.7%) | 56 (20.5%) |
| 45 to 54 Years | 104 (30.7%) | 83 (23.6%) |
| 55 to 64 Years | 73 (32.9%) | 68 (25.2%) |
| 65 to 74 Years | 26 (14.9%) | 23 (10.2%) |
| 75 Years and over | 0 (0.0%) | 48 (25.7%) |
| Total | 565 (22.4%) | 667 (26.3%) |
Income Above Poverty by Sex and Age in Cameron
According to the poverty statistics in Cameron, males aged 5 years and females aged 65 to 74 years are the age groups that are most secure financially, with 100.0% of males and 89.8% of females in these age groups living above the poverty line.
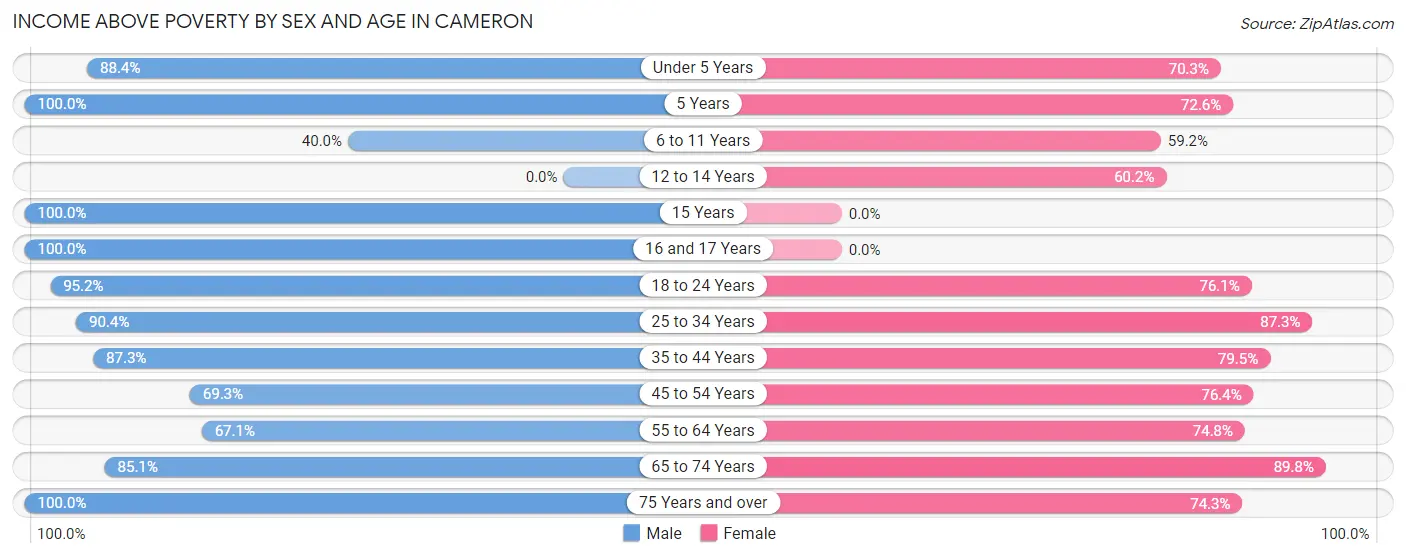
| Age Bracket | Male | Female |
| Under 5 Years | 137 (88.4%) | 83 (70.3%) |
| 5 Years | 115 (100.0%) | 69 (72.6%) |
| 6 to 11 Years | 152 (40.0%) | 212 (59.2%) |
| 12 to 14 Years | 0 (0.0%) | 115 (60.2%) |
| 15 Years | 27 (100.0%) | 0 (0.0%) |
| 16 and 17 Years | 24 (100.0%) | 0 (0.0%) |
| 18 to 24 Years | 160 (95.2%) | 181 (76.0%) |
| 25 to 34 Years | 331 (90.4%) | 179 (87.3%) |
| 35 to 44 Years | 329 (87.3%) | 217 (79.5%) |
| 45 to 54 Years | 235 (69.3%) | 269 (76.4%) |
| 55 to 64 Years | 149 (67.1%) | 202 (74.8%) |
| 65 to 74 Years | 149 (85.1%) | 203 (89.8%) |
| 75 Years and over | 152 (100.0%) | 139 (74.3%) |
| Total | 1,960 (77.6%) | 1,869 (73.7%) |
Income Below Poverty Among Married-Couple Families in Cameron
The poverty statistics for married-couple families in Cameron show that 4.6% or 34 of the total 745 families live below the poverty line. Families with no children have the highest poverty rate of 7.5%, comprising of 30 families. On the other hand, families with 1 or 2 children have the lowest poverty rate of 0.0%, which includes 0 families.
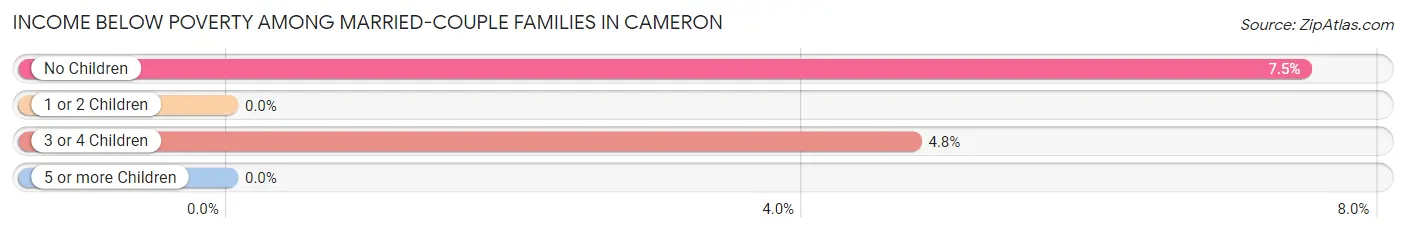
| Children | Above Poverty | Below Poverty |
| No Children | 371 (92.5%) | 30 (7.5%) |
| 1 or 2 Children | 253 (100.0%) | 0 (0.0%) |
| 3 or 4 Children | 80 (95.2%) | 4 (4.8%) |
| 5 or more Children | 7 (100.0%) | 0 (0.0%) |
| Total | 711 (95.4%) | 34 (4.6%) |
Income Below Poverty Among Single-Parent Households in Cameron
According to the poverty data in Cameron, 40.9% or 65 single-father households and 45.4% or 162 single-mother households are living below the poverty line. Among single-father households, those with 1 or 2 children have the highest poverty rate, with 65 households (64.4%) experiencing poverty. Likewise, among single-mother households, those with 3 or 4 children have the highest poverty rate, with 21 households (100.0%) falling below the poverty line.
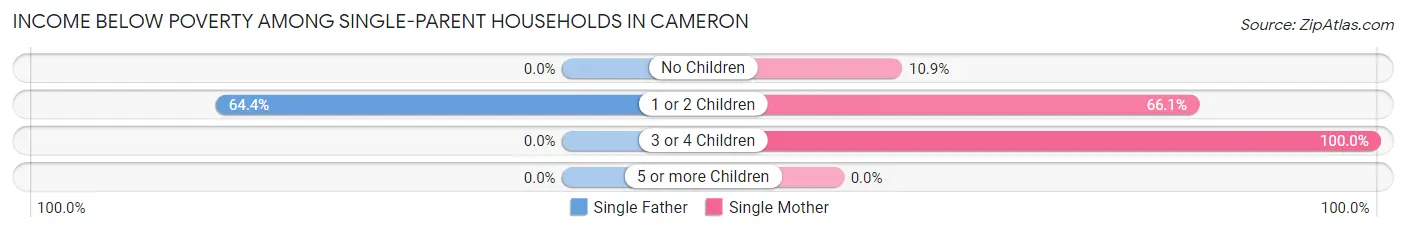
| Children | Single Father | Single Mother |
| No Children | 0 (0.0%) | 16 (10.9%) |
| 1 or 2 Children | 65 (64.4%) | 125 (66.1%) |
| 3 or 4 Children | 0 (0.0%) | 21 (100.0%) |
| 5 or more Children | 0 (0.0%) | 0 (0.0%) |
| Total | 65 (40.9%) | 162 (45.4%) |
Income Below Poverty Among Married-Couple vs Single-Parent Households in Cameron
The poverty data for Cameron shows that 34 of the married-couple family households (4.6%) and 227 of the single-parent households (44.0%) are living below the poverty level. Within the married-couple family households, those with no children have the highest poverty rate, with 30 households (7.5%) falling below the poverty line. Among the single-parent households, those with 3 or 4 children have the highest poverty rate, with 21 household (100.0%) living below poverty.
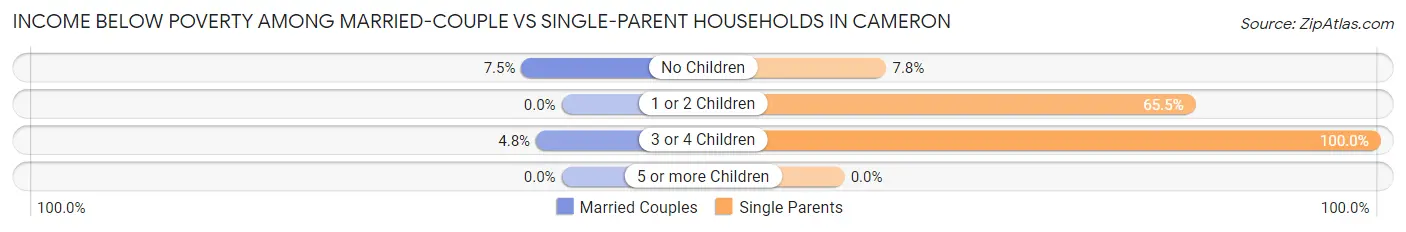
| Children | Married-Couple Families | Single-Parent Households |
| No Children | 30 (7.5%) | 16 (7.8%) |
| 1 or 2 Children | 0 (0.0%) | 190 (65.5%) |
| 3 or 4 Children | 4 (4.8%) | 21 (100.0%) |
| 5 or more Children | 0 (0.0%) | 0 (0.0%) |
| Total | 34 (4.6%) | 227 (44.0%) |
Race in Cameron
The most populous races in Cameron are White / Caucasian (3,188 | 59.5%), Hispanic or Latino (2,232 | 41.7%), and Black / African American (1,139 | 21.3%).
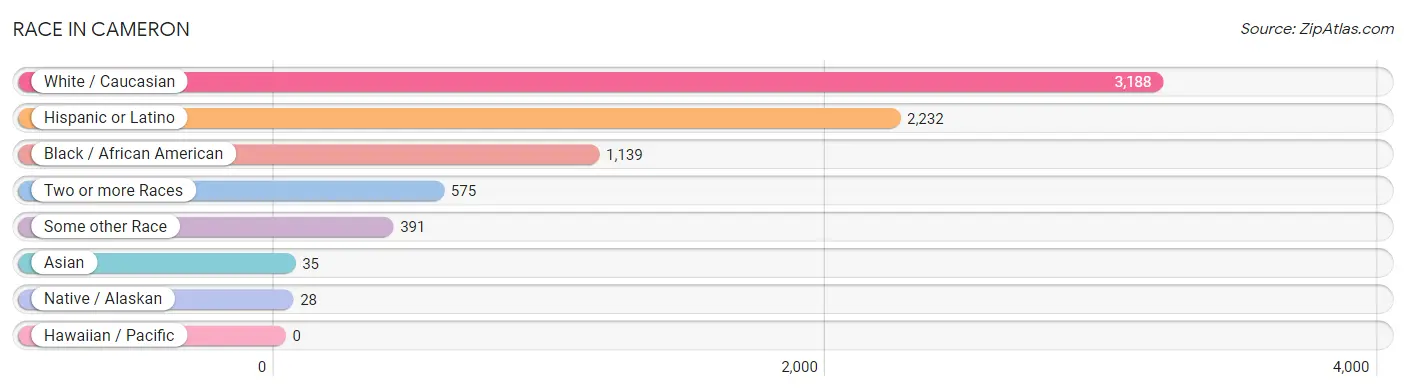
| Race | # Population | % Population |
| Asian | 35 | 0.6% |
| Black / African American | 1,139 | 21.3% |
| Hawaiian / Pacific | 0 | 0.0% |
| Hispanic or Latino | 2,232 | 41.7% |
| Native / Alaskan | 28 | 0.5% |
| White / Caucasian | 3,188 | 59.5% |
| Two or more Races | 575 | 10.7% |
| Some other Race | 391 | 7.3% |
| Total | 5,356 | 100.0% |
Ancestry in Cameron
The most populous ancestries reported in Cameron are Mexican (2,154 | 40.2%), German (588 | 11.0%), Irish (248 | 4.6%), Norwegian (220 | 4.1%), and English (191 | 3.6%), together accounting for 63.5% of all Cameron residents.
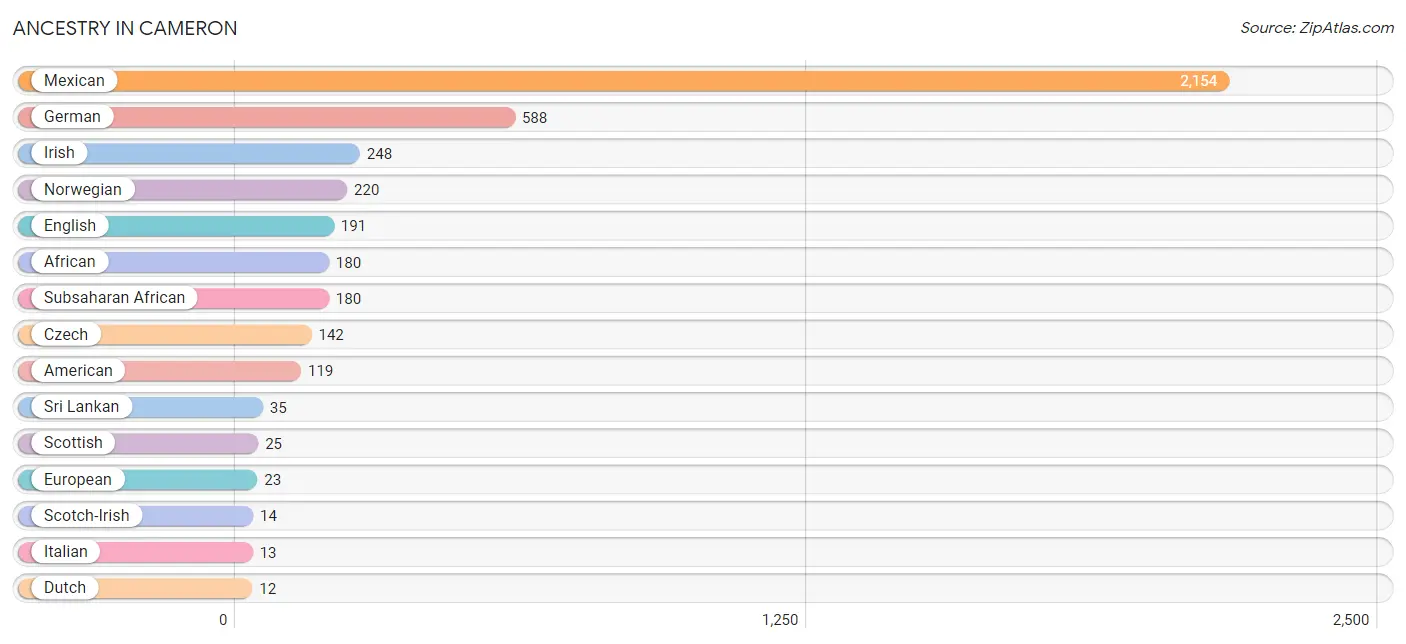
| Ancestry | # Population | % Population |
| African | 180 | 3.4% |
| American | 119 | 2.2% |
| British | 3 | 0.1% |
| Canadian | 6 | 0.1% |
| Central American | 4 | 0.1% |
| Cherokee | 9 | 0.2% |
| Czech | 142 | 2.6% |
| Dutch | 12 | 0.2% |
| English | 191 | 3.6% |
| European | 23 | 0.4% |
| French | 9 | 0.2% |
| German | 588 | 11.0% |
| Honduran | 4 | 0.1% |
| Irish | 248 | 4.6% |
| Italian | 13 | 0.2% |
| Mexican | 2,154 | 40.2% |
| Mexican American Indian | 9 | 0.2% |
| Native Hawaiian | 6 | 0.1% |
| Norwegian | 220 | 4.1% |
| Puerto Rican | 5 | 0.1% |
| Romanian | 9 | 0.2% |
| Scotch-Irish | 14 | 0.3% |
| Scottish | 25 | 0.5% |
| Sri Lankan | 35 | 0.6% |
| Subsaharan African | 180 | 3.4% |
| Swiss | 9 | 0.2% |
| Welsh | 9 | 0.2% | View All 27 Rows |
Immigrants in Cameron
The most numerous immigrant groups reported in Cameron came from Central America (417 | 7.8%), Latin America (417 | 7.8%), Mexico (417 | 7.8%), Asia (35 | 0.6%), and South Eastern Asia (35 | 0.6%), together accounting for 24.7% of all Cameron residents.
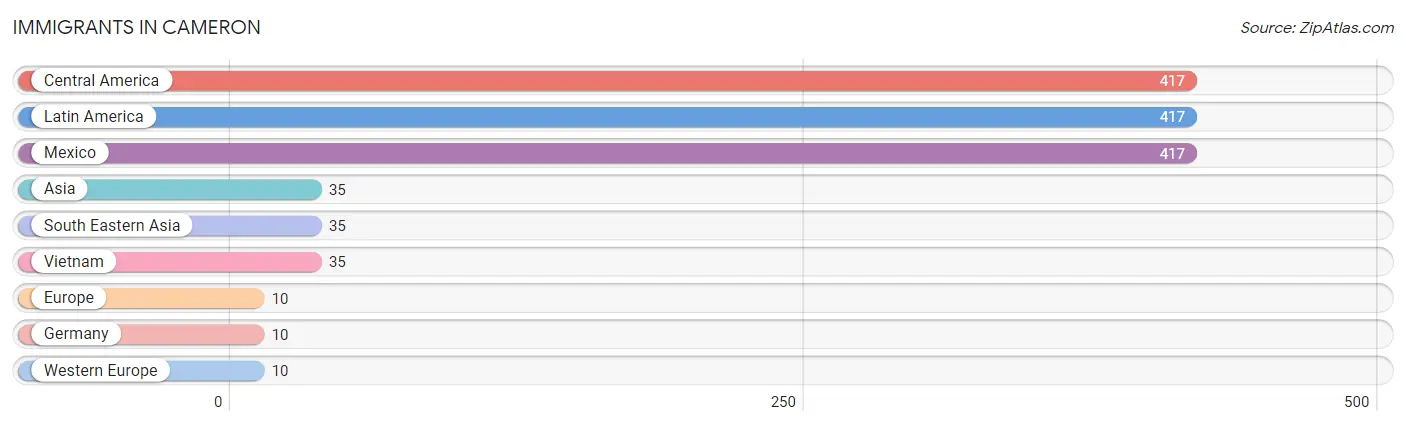
| Immigration Origin | # Population | % Population |
| Asia | 35 | 0.6% |
| Central America | 417 | 7.8% |
| Europe | 10 | 0.2% |
| Germany | 10 | 0.2% |
| Latin America | 417 | 7.8% |
| Mexico | 417 | 7.8% |
| South Eastern Asia | 35 | 0.6% |
| Vietnam | 35 | 0.6% |
| Western Europe | 10 | 0.2% | View All 9 Rows |
Sex and Age in Cameron
Sex and Age in Cameron
The most populous age groups in Cameron are 5 to 9 Years (346 | 13.0%) for men and 10 to 14 Years (451 | 16.8%) for women.
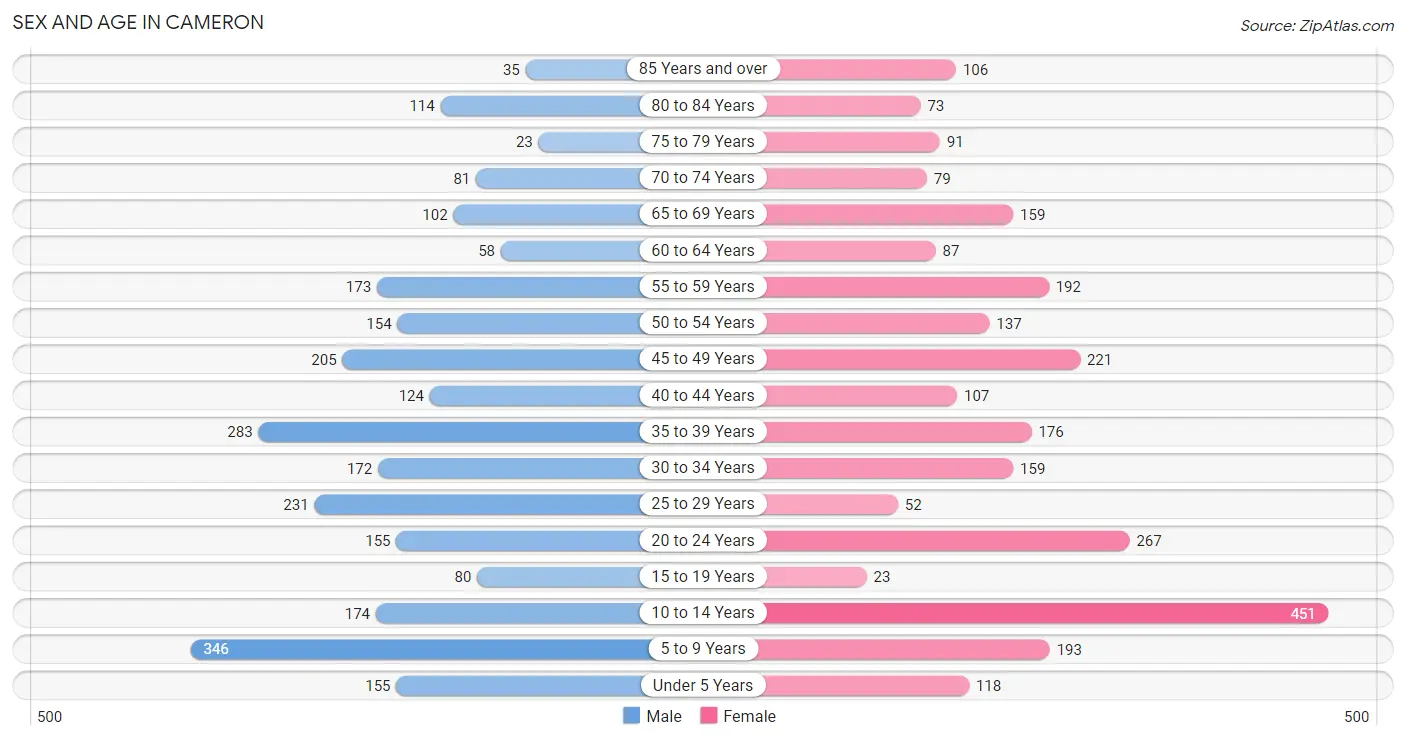
| Age Bracket | Male | Female |
| Under 5 Years | 155 (5.8%) | 118 (4.4%) |
| 5 to 9 Years | 346 (13.0%) | 193 (7.2%) |
| 10 to 14 Years | 174 (6.5%) | 451 (16.8%) |
| 15 to 19 Years | 80 (3.0%) | 23 (0.9%) |
| 20 to 24 Years | 155 (5.8%) | 267 (9.9%) |
| 25 to 29 Years | 231 (8.7%) | 52 (1.9%) |
| 30 to 34 Years | 172 (6.5%) | 159 (5.9%) |
| 35 to 39 Years | 283 (10.6%) | 176 (6.5%) |
| 40 to 44 Years | 124 (4.6%) | 107 (4.0%) |
| 45 to 49 Years | 205 (7.7%) | 221 (8.2%) |
| 50 to 54 Years | 154 (5.8%) | 137 (5.1%) |
| 55 to 59 Years | 173 (6.5%) | 192 (7.1%) |
| 60 to 64 Years | 58 (2.2%) | 87 (3.2%) |
| 65 to 69 Years | 102 (3.8%) | 159 (5.9%) |
| 70 to 74 Years | 81 (3.0%) | 79 (2.9%) |
| 75 to 79 Years | 23 (0.9%) | 91 (3.4%) |
| 80 to 84 Years | 114 (4.3%) | 73 (2.7%) |
| 85 Years and over | 35 (1.3%) | 106 (3.9%) |
| Total | 2,665 (100.0%) | 2,691 (100.0%) |
Families and Households in Cameron
Median Family Size in Cameron
The median family size in Cameron is 3.51 persons per family, with married-couple families (745 | 59.1%) accounting for the largest median family size of 3.85 persons per family. On the other hand, single male/father families (159 | 12.6%) represent the smallest median family size with 2.65 persons per family.
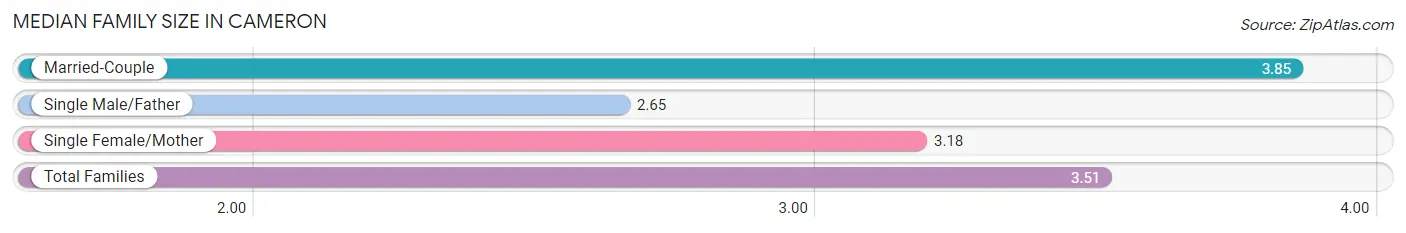
| Family Type | # Families | Family Size |
| Married-Couple | 745 (59.1%) | 3.85 |
| Single Male/Father | 159 (12.6%) | 2.65 |
| Single Female/Mother | 357 (28.3%) | 3.18 |
| Total Families | 1,261 (100.0%) | 3.51 |
Median Household Size in Cameron
The median household size in Cameron is 2.89 persons per household, with married-couple households (745 | 42.5%) accounting for the largest median household size of 3.85 persons per household. non-family households (492 | 28.1%) represent the smallest median household size with 1.05 persons per household.
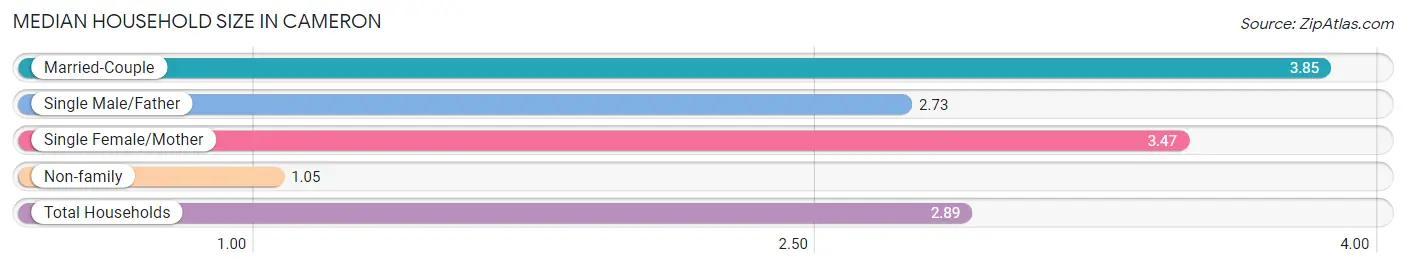
| Household Type | # Households | Household Size |
| Married-Couple | 745 (42.5%) | 3.85 |
| Single Male/Father | 159 (9.1%) | 2.73 |
| Single Female/Mother | 357 (20.4%) | 3.47 |
| Non-family | 492 (28.1%) | 1.05 |
| Total Households | 1,753 (100.0%) | 2.89 |
Household Size by Marriage Status in Cameron
Out of a total of 1,753 households in Cameron, 1,261 (71.9%) are family households, while 492 (28.1%) are nonfamily households. The most numerous type of family households are 2-person households, comprising 442, and the most common type of nonfamily households are 1-person households, comprising 464.
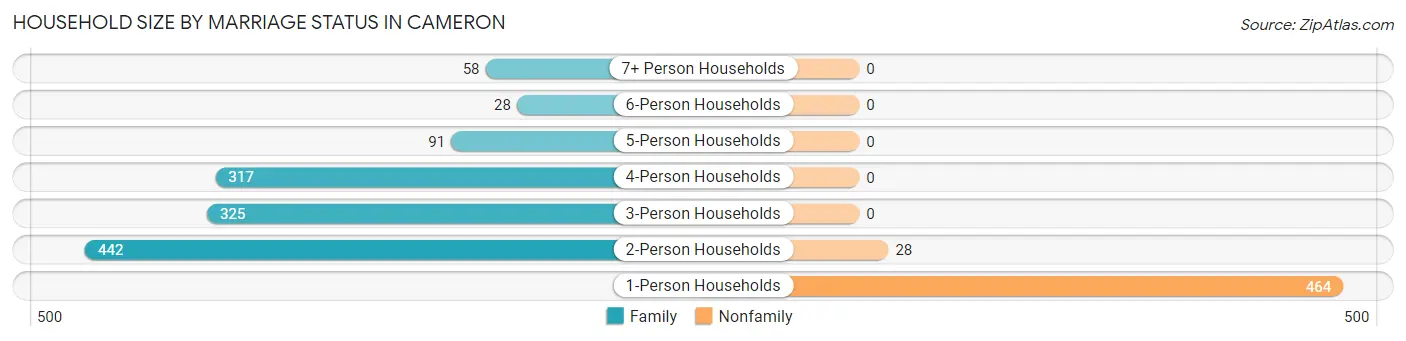
| Household Size | Family Households | Nonfamily Households |
| 1-Person Households | - | 464 (26.5%) |
| 2-Person Households | 442 (25.2%) | 28 (1.6%) |
| 3-Person Households | 325 (18.5%) | 0 (0.0%) |
| 4-Person Households | 317 (18.1%) | 0 (0.0%) |
| 5-Person Households | 91 (5.2%) | 0 (0.0%) |
| 6-Person Households | 28 (1.6%) | 0 (0.0%) |
| 7+ Person Households | 58 (3.3%) | 0 (0.0%) |
| Total | 1,261 (71.9%) | 492 (28.1%) |
Female Fertility in Cameron
Fertility by Age in Cameron
Average fertility rate in Cameron is 88.0 births per 1,000 women. Women in the age bracket of 20 to 34 years have the highest fertility rate with 197.0 births per 1,000 women. Women in the age bracket of 20 to 34 years acount for 100.0% of all women with births.
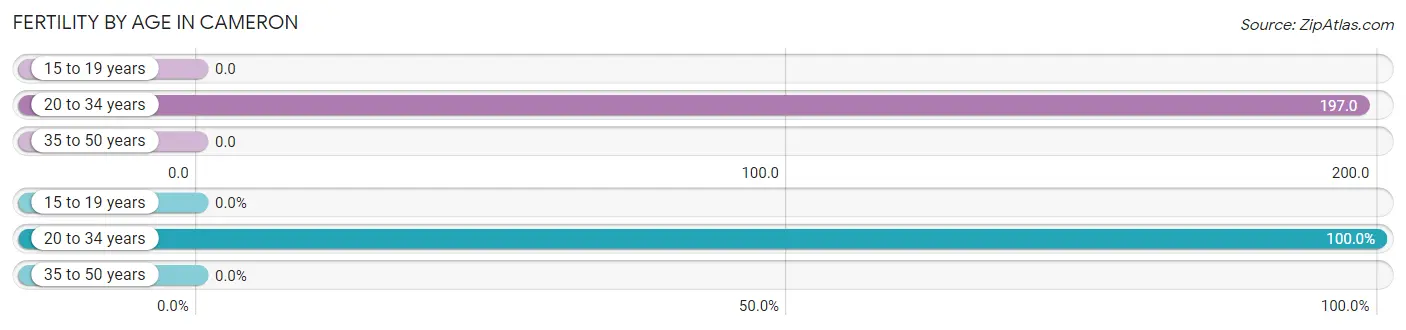
| Age Bracket | Women with Births | Births / 1,000 Women |
| 15 to 19 years | 0 (0.0%) | 0.0 |
| 20 to 34 years | 94 (100.0%) | 197.0 |
| 35 to 50 years | 0 (0.0%) | 0.0 |
| Total | 94 (100.0%) | 88.0 |
Fertility by Age by Marriage Status in Cameron
54.3% of women with births (94) in Cameron are married. The highest percentage of unmarried women with births falls into 20 to 34 years age bracket with 45.7% of them unmarried at the time of birth, while the lowest percentage of unmarried women with births belong to 20 to 34 years age bracket with 45.7% of them unmarried.
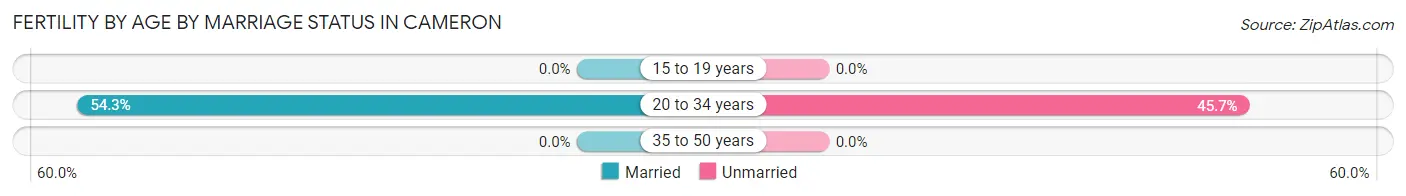
| Age Bracket | Married | Unmarried |
| 15 to 19 years | 0 (0.0%) | 0 (0.0%) |
| 20 to 34 years | 51 (54.3%) | 43 (45.7%) |
| 35 to 50 years | 0 (0.0%) | 0 (0.0%) |
| Total | 51 (54.3%) | 43 (45.7%) |
Fertility by Education in Cameron
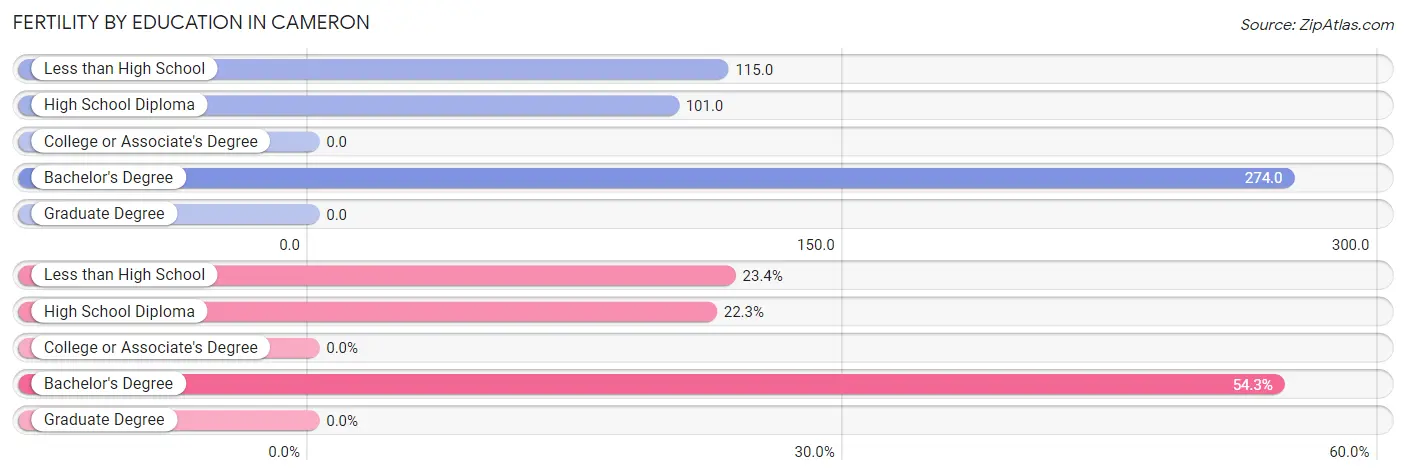
| Educational Attainment | Women with Births | Births / 1,000 Women |
| Less than High School | 22 (23.4%) | 115.0 |
| High School Diploma | 21 (22.3%) | 101.0 |
| College or Associate's Degree | 0 (0.0%) | 0.0 |
| Bachelor's Degree | 51 (54.3%) | 274.0 |
| Graduate Degree | 0 (0.0%) | 0.0 |
| Total | 94 (100.0%) | 88.0 |
Fertility by Education by Marriage Status in Cameron
45.7% of women with births in Cameron are unmarried. Women with the educational attainment of bachelor's degree are most likely to be married with 100.0% of them married at childbirth, while women with the educational attainment of less than high school are least likely to be married with 100.0% of them unmarried at childbirth.
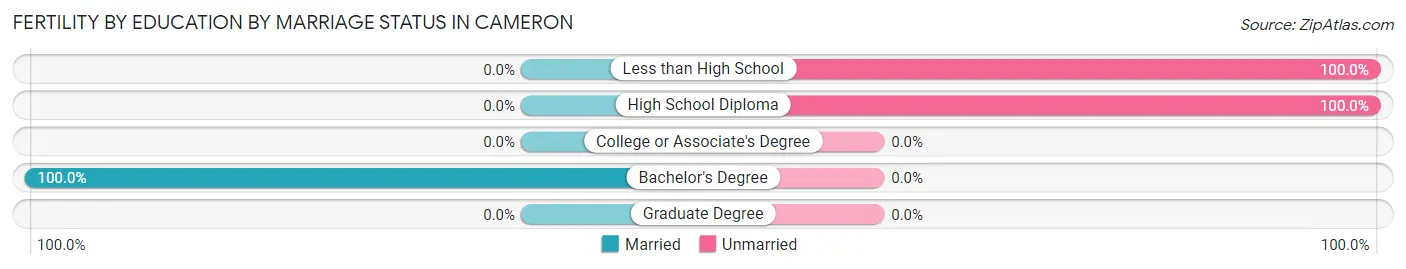
| Educational Attainment | Married | Unmarried |
| Less than High School | 0 (0.0%) | 22 (100.0%) |
| High School Diploma | 0 (0.0%) | 21 (100.0%) |
| College or Associate's Degree | 0 (0.0%) | 0 (0.0%) |
| Bachelor's Degree | 51 (100.0%) | 0 (0.0%) |
| Graduate Degree | 0 (0.0%) | 0 (0.0%) |
| Total | 51 (54.3%) | 43 (45.7%) |
Employment Characteristics in Cameron
Employment by Class of Employer in Cameron
Among the 2,243 employed individuals in Cameron, private company employees (1,401 | 62.5%), not-for-profit organizations (289 | 12.9%), and state government employees (182 | 8.1%) make up the most common classes of employment.
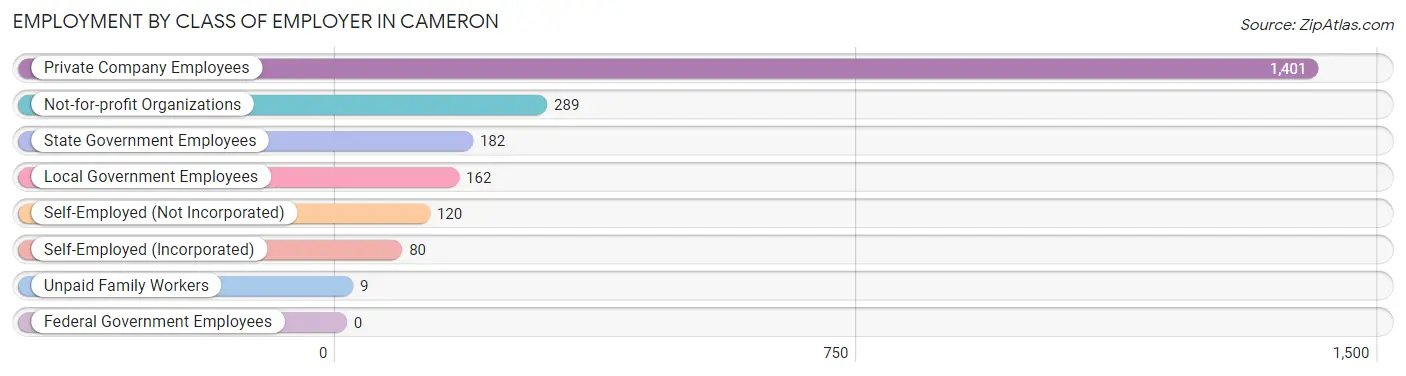
| Employer Class | # Employees | % Employees |
| Private Company Employees | 1,401 | 62.5% |
| Self-Employed (Incorporated) | 80 | 3.6% |
| Self-Employed (Not Incorporated) | 120 | 5.3% |
| Not-for-profit Organizations | 289 | 12.9% |
| Local Government Employees | 162 | 7.2% |
| State Government Employees | 182 | 8.1% |
| Federal Government Employees | 0 | 0.0% |
| Unpaid Family Workers | 9 | 0.4% |
| Total | 2,243 | 100.0% |
Employment Status by Age in Cameron
According to the labor force statistics for Cameron, out of the total population over 16 years of age (3,892), 62.1% or 2,417 individuals are in the labor force, with 5.1% or 123 of them unemployed. The age group with the highest labor force participation rate is 35 to 44 years, with 89.1% or 615 individuals in the labor force. Within the labor force, the 25 to 29 years age range has the highest percentage of unemployed individuals, with 29.3% or 61 of them being unemployed.
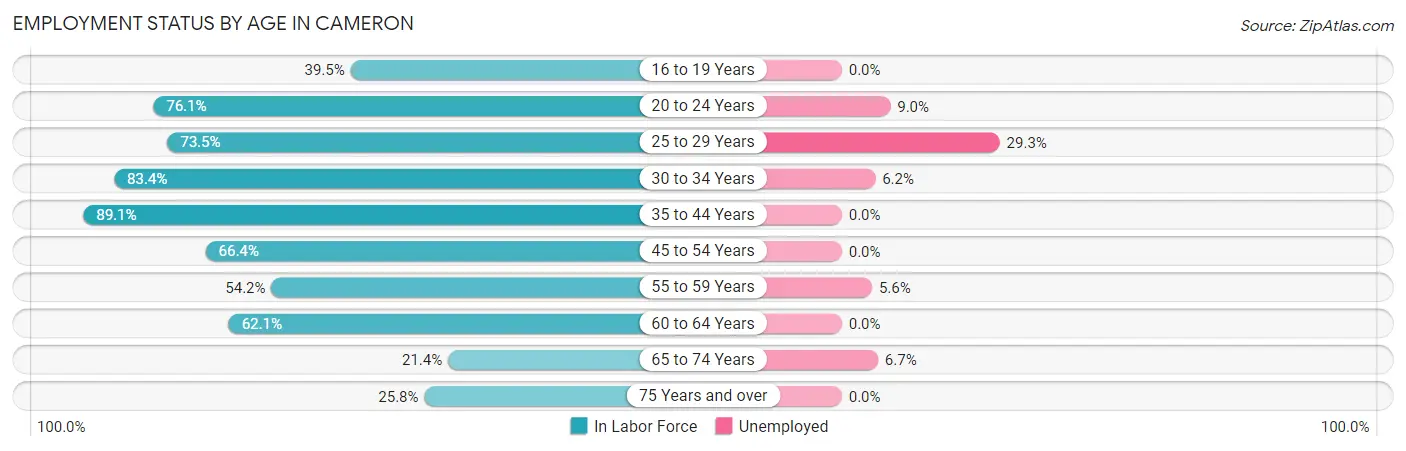
| Age Bracket | In Labor Force | Unemployed |
| 16 to 19 Years | 30 (39.5%) | 0 (0.0%) |
| 20 to 24 Years | 321 (76.1%) | 29 (9.0%) |
| 25 to 29 Years | 208 (73.5%) | 61 (29.3%) |
| 30 to 34 Years | 276 (83.4%) | 17 (6.2%) |
| 35 to 44 Years | 615 (89.1%) | 0 (0.0%) |
| 45 to 54 Years | 476 (66.4%) | 0 (0.0%) |
| 55 to 59 Years | 198 (54.2%) | 11 (5.6%) |
| 60 to 64 Years | 90 (62.1%) | 0 (0.0%) |
| 65 to 74 Years | 90 (21.4%) | 6 (6.7%) |
| 75 Years and over | 114 (25.8%) | 0 (0.0%) |
| Total | 2,417 (62.1%) | 123 (5.1%) |
Employment Status by Educational Attainment in Cameron
According to labor force statistics for Cameron, 73.6% of individuals (1,863) out of the total population between 25 and 64 years of age (2,531) are in the labor force, with 4.8% or 89 of them being unemployed. The group with the highest labor force participation rate are those with the educational attainment of college / associate degree, with 91.3% or 682 individuals in the labor force. Within the labor force, individuals with college / associate degree education have the highest percentage of unemployment, with 6.7% or 46 of them being unemployed.
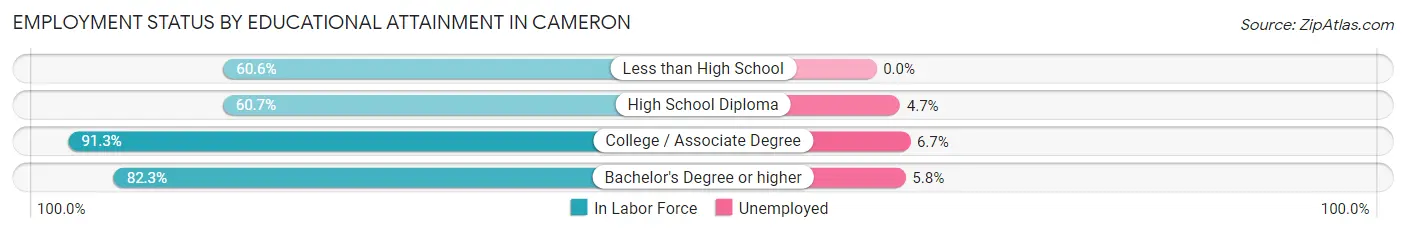
| Educational Attainment | In Labor Force | Unemployed |
| Less than High School | 361 (60.6%) | 0 (0.0%) |
| High School Diploma | 443 (60.7%) | 34 (4.7%) |
| College / Associate Degree | 682 (91.3%) | 50 (6.7%) |
| Bachelor's Degree or higher | 377 (82.3%) | 27 (5.8%) |
| Total | 1,863 (73.6%) | 121 (4.8%) |
Employment Occupations by Sex in Cameron
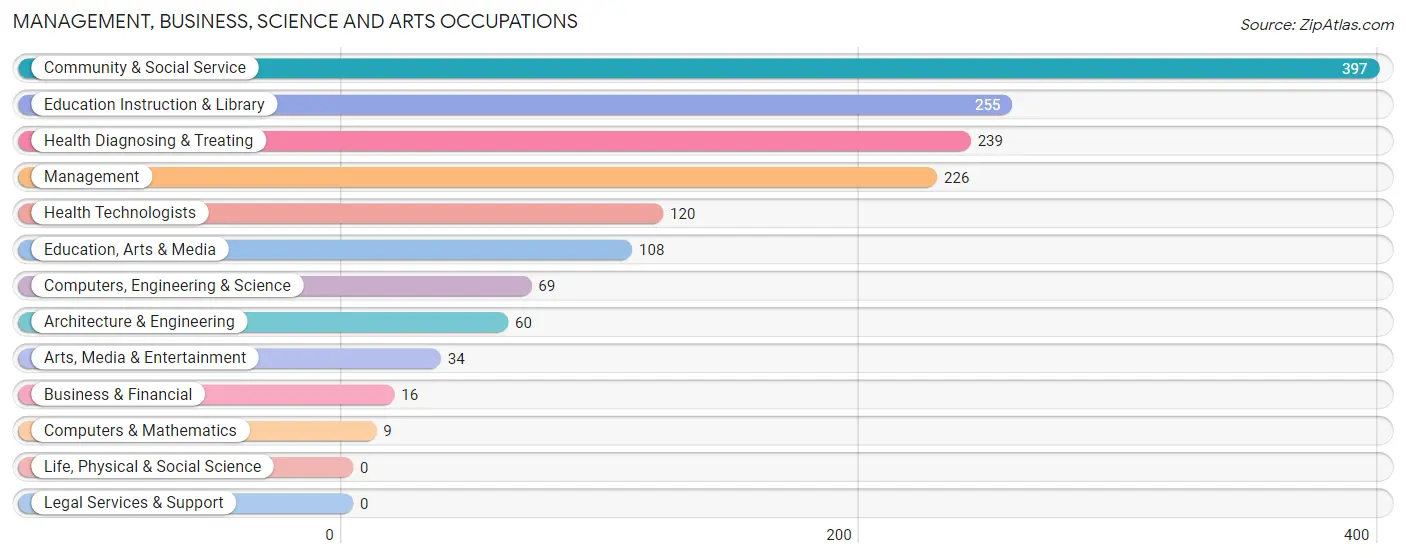
Management, Business, Science and Arts Occupations
The most common Management, Business, Science and Arts occupations in Cameron are Community & Social Service (397 | 17.3%), Education Instruction & Library (255 | 11.1%), Health Diagnosing & Treating (239 | 10.4%), Management (226 | 9.9%), and Health Technologists (120 | 5.2%).
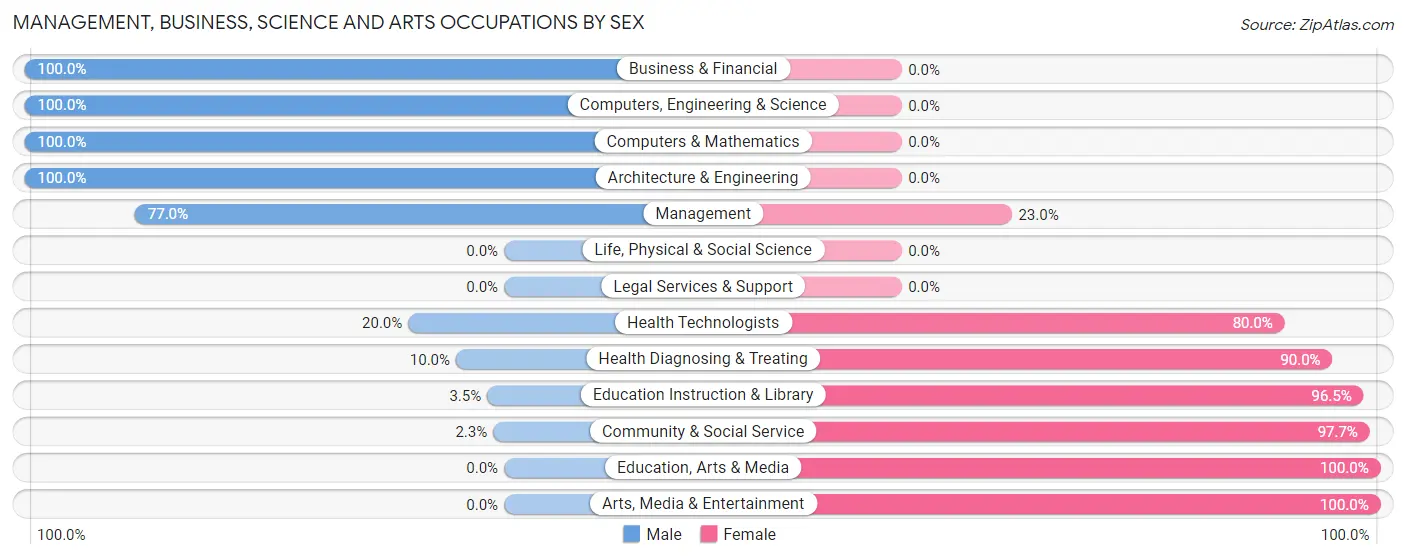
Management, Business, Science and Arts Occupations by Sex
Within the Management, Business, Science and Arts occupations in Cameron, the most male-oriented occupations are Business & Financial (100.0%), Computers, Engineering & Science (100.0%), and Computers & Mathematics (100.0%), while the most female-oriented occupations are Education, Arts & Media (100.0%), Arts, Media & Entertainment (100.0%), and Community & Social Service (97.7%).
| Occupation | Male | Female |
| Management | 174 (77.0%) | 52 (23.0%) |
| Business & Financial | 16 (100.0%) | 0 (0.0%) |
| Computers, Engineering & Science | 69 (100.0%) | 0 (0.0%) |
| Computers & Mathematics | 9 (100.0%) | 0 (0.0%) |
| Architecture & Engineering | 60 (100.0%) | 0 (0.0%) |
| Life, Physical & Social Science | 0 (0.0%) | 0 (0.0%) |
| Community & Social Service | 9 (2.3%) | 388 (97.7%) |
| Education, Arts & Media | 0 (0.0%) | 108 (100.0%) |
| Legal Services & Support | 0 (0.0%) | 0 (0.0%) |
| Education Instruction & Library | 9 (3.5%) | 246 (96.5%) |
| Arts, Media & Entertainment | 0 (0.0%) | 34 (100.0%) |
| Health Diagnosing & Treating | 24 (10.0%) | 215 (90.0%) |
| Health Technologists | 24 (20.0%) | 96 (80.0%) |
| Total (Category) | 292 (30.8%) | 655 (69.2%) |
| Total (Overall) | 1,137 (49.6%) | 1,157 (50.4%) |
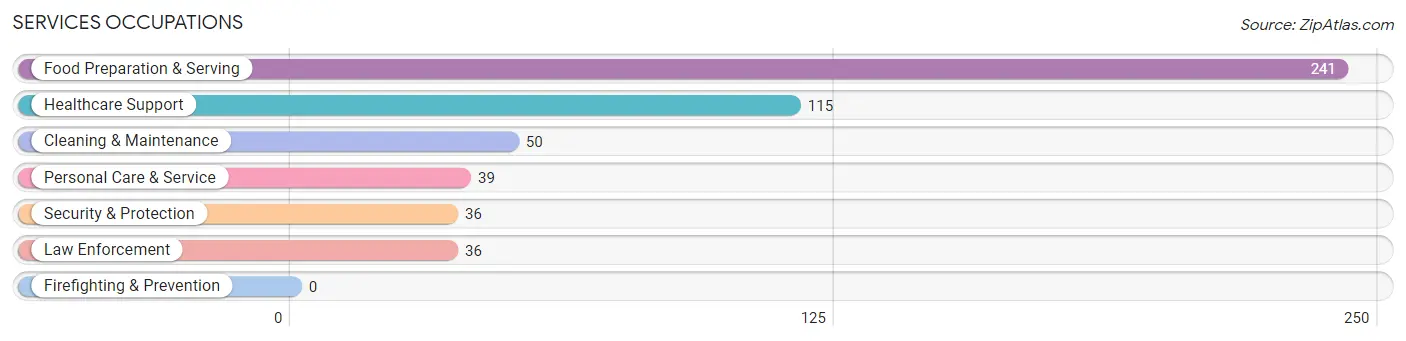
Services Occupations
The most common Services occupations in Cameron are Food Preparation & Serving (241 | 10.5%), Healthcare Support (115 | 5.0%), Cleaning & Maintenance (50 | 2.2%), Personal Care & Service (39 | 1.7%), and Security & Protection (36 | 1.6%).
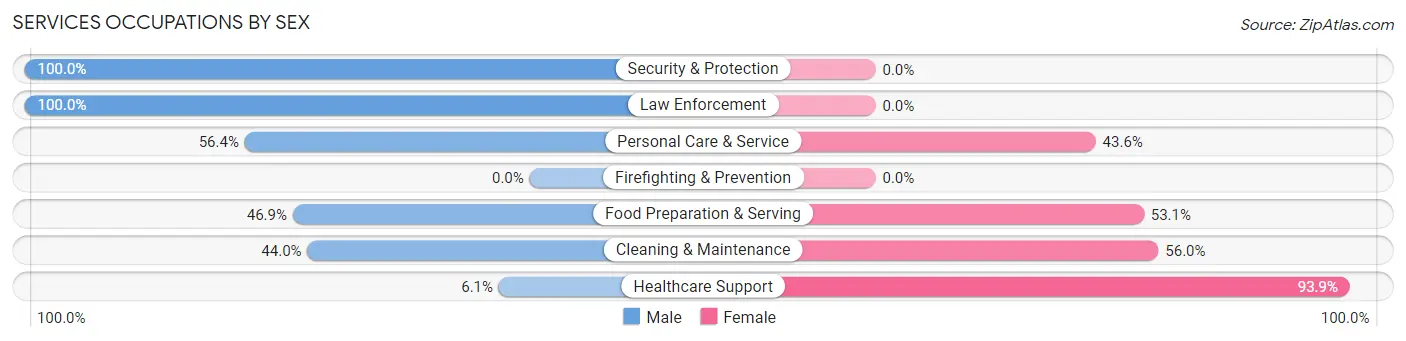
Services Occupations by Sex
Within the Services occupations in Cameron, the most male-oriented occupations are Security & Protection (100.0%), Law Enforcement (100.0%), and Personal Care & Service (56.4%), while the most female-oriented occupations are Healthcare Support (93.9%), Cleaning & Maintenance (56.0%), and Food Preparation & Serving (53.1%).
| Occupation | Male | Female |
| Healthcare Support | 7 (6.1%) | 108 (93.9%) |
| Security & Protection | 36 (100.0%) | 0 (0.0%) |
| Firefighting & Prevention | 0 (0.0%) | 0 (0.0%) |
| Law Enforcement | 36 (100.0%) | 0 (0.0%) |
| Food Preparation & Serving | 113 (46.9%) | 128 (53.1%) |
| Cleaning & Maintenance | 22 (44.0%) | 28 (56.0%) |
| Personal Care & Service | 22 (56.4%) | 17 (43.6%) |
| Total (Category) | 200 (41.6%) | 281 (58.4%) |
| Total (Overall) | 1,137 (49.6%) | 1,157 (50.4%) |
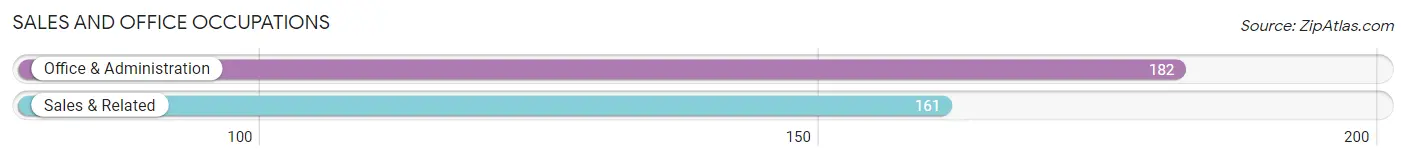
Sales and Office Occupations
The most common Sales and Office occupations in Cameron are Office & Administration (182 | 7.9%), and Sales & Related (161 | 7.0%).
Sales and Office Occupations by Sex
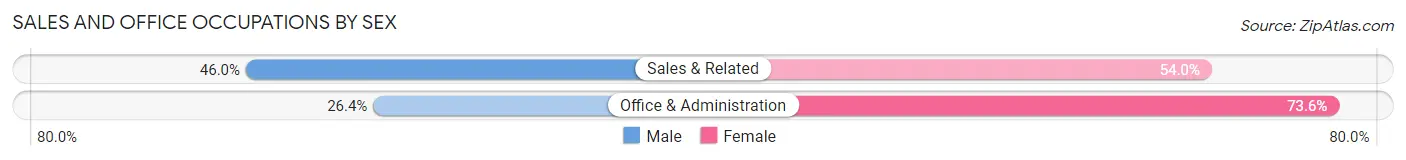
| Occupation | Male | Female |
| Sales & Related | 74 (46.0%) | 87 (54.0%) |
| Office & Administration | 48 (26.4%) | 134 (73.6%) |
| Total (Category) | 122 (35.6%) | 221 (64.4%) |
| Total (Overall) | 1,137 (49.6%) | 1,157 (50.4%) |
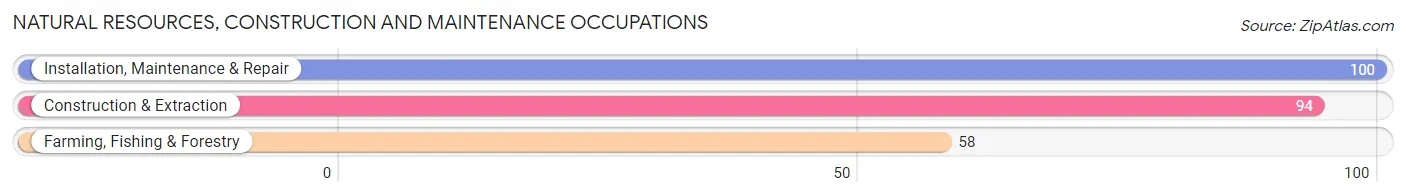
Natural Resources, Construction and Maintenance Occupations
The most common Natural Resources, Construction and Maintenance occupations in Cameron are Installation, Maintenance & Repair (100 | 4.4%), Construction & Extraction (94 | 4.1%), and Farming, Fishing & Forestry (58 | 2.5%).
Natural Resources, Construction and Maintenance Occupations by Sex
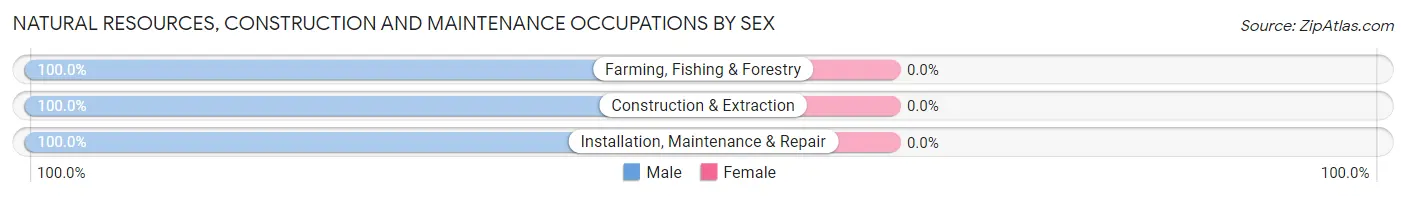
| Occupation | Male | Female |
| Farming, Fishing & Forestry | 58 (100.0%) | 0 (0.0%) |
| Construction & Extraction | 94 (100.0%) | 0 (0.0%) |
| Installation, Maintenance & Repair | 100 (100.0%) | 0 (0.0%) |
| Total (Category) | 252 (100.0%) | 0 (0.0%) |
| Total (Overall) | 1,137 (49.6%) | 1,157 (50.4%) |
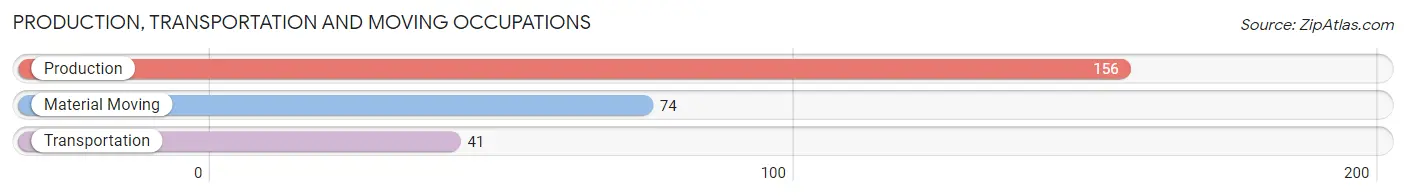
Production, Transportation and Moving Occupations
The most common Production, Transportation and Moving occupations in Cameron are Production (156 | 6.8%), Material Moving (74 | 3.2%), and Transportation (41 | 1.8%).
Production, Transportation and Moving Occupations by Sex
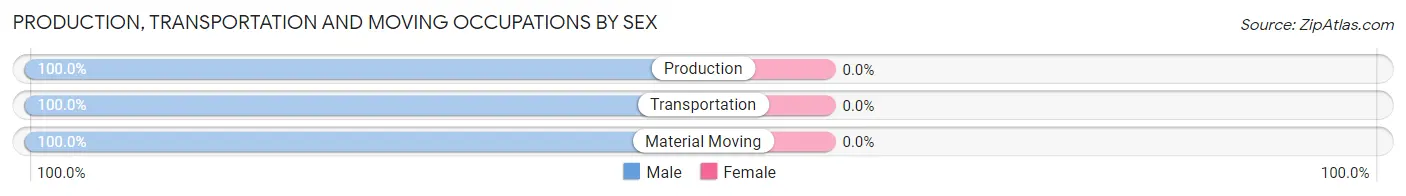
| Occupation | Male | Female |
| Production | 156 (100.0%) | 0 (0.0%) |
| Transportation | 41 (100.0%) | 0 (0.0%) |
| Material Moving | 74 (100.0%) | 0 (0.0%) |
| Total (Category) | 271 (100.0%) | 0 (0.0%) |
| Total (Overall) | 1,137 (49.6%) | 1,157 (50.4%) |
Employment Industries by Sex in Cameron
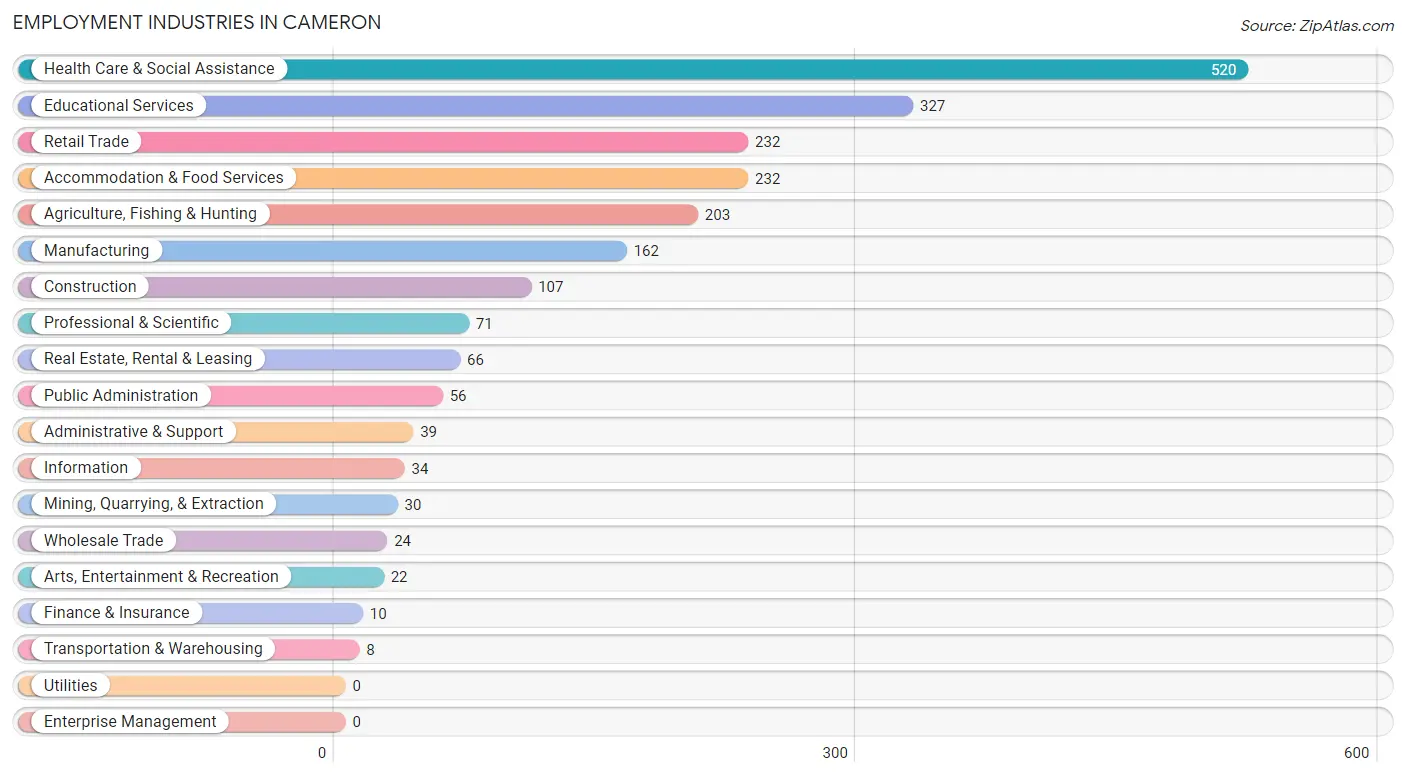
Employment Industries in Cameron
The major employment industries in Cameron include Health Care & Social Assistance (520 | 22.7%), Educational Services (327 | 14.2%), Retail Trade (232 | 10.1%), Accommodation & Food Services (232 | 10.1%), and Agriculture, Fishing & Hunting (203 | 8.8%).
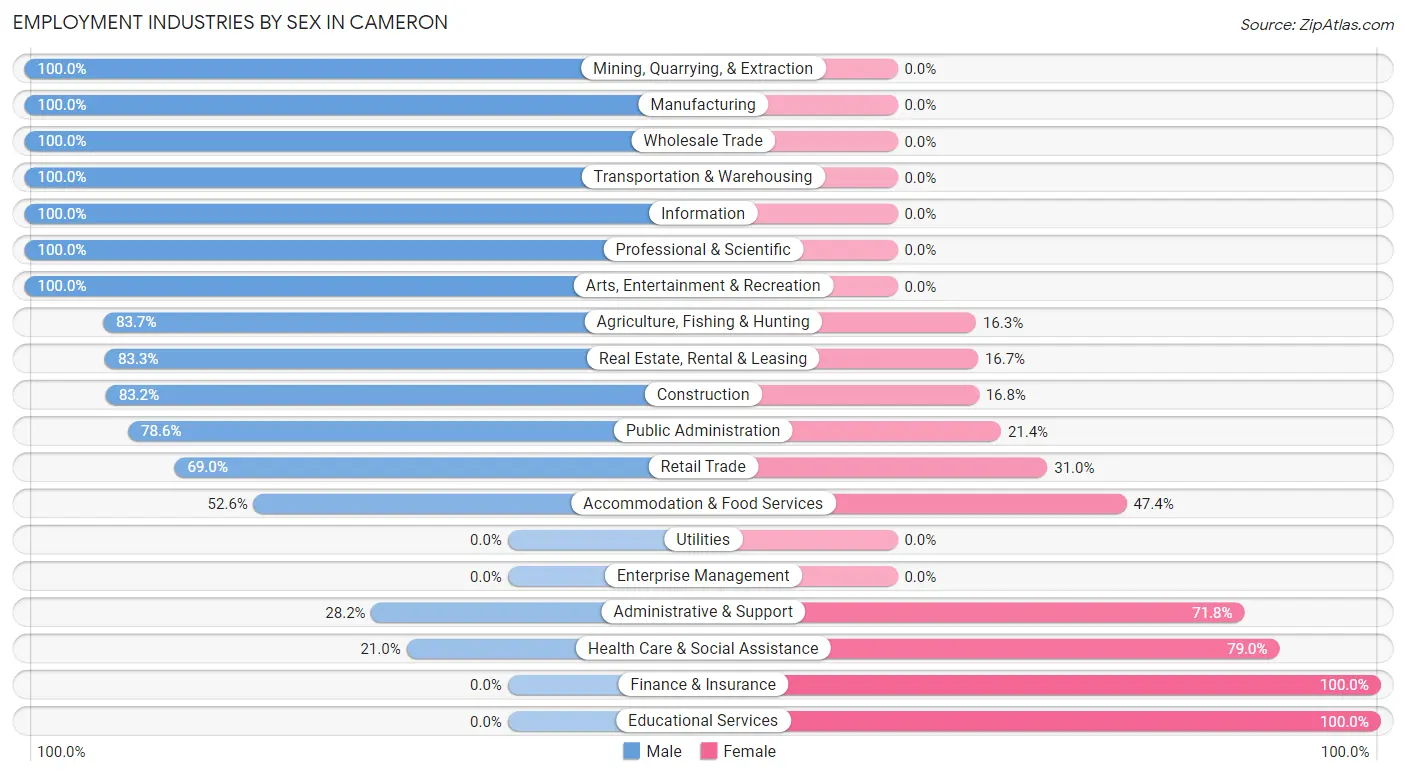
Employment Industries by Sex in Cameron
The Cameron industries that see more men than women are Mining, Quarrying, & Extraction (100.0%), Manufacturing (100.0%), and Wholesale Trade (100.0%), whereas the industries that tend to have a higher number of women are Finance & Insurance (100.0%), Educational Services (100.0%), and Health Care & Social Assistance (79.0%).
| Industry | Male | Female |
| Agriculture, Fishing & Hunting | 170 (83.7%) | 33 (16.3%) |
| Mining, Quarrying, & Extraction | 30 (100.0%) | 0 (0.0%) |
| Construction | 89 (83.2%) | 18 (16.8%) |
| Manufacturing | 162 (100.0%) | 0 (0.0%) |
| Wholesale Trade | 24 (100.0%) | 0 (0.0%) |
| Retail Trade | 160 (69.0%) | 72 (31.0%) |
| Transportation & Warehousing | 8 (100.0%) | 0 (0.0%) |
| Utilities | 0 (0.0%) | 0 (0.0%) |
| Information | 34 (100.0%) | 0 (0.0%) |
| Finance & Insurance | 0 (0.0%) | 10 (100.0%) |
| Real Estate, Rental & Leasing | 55 (83.3%) | 11 (16.7%) |
| Professional & Scientific | 71 (100.0%) | 0 (0.0%) |
| Enterprise Management | 0 (0.0%) | 0 (0.0%) |
| Administrative & Support | 11 (28.2%) | 28 (71.8%) |
| Educational Services | 0 (0.0%) | 327 (100.0%) |
| Health Care & Social Assistance | 109 (21.0%) | 411 (79.0%) |
| Arts, Entertainment & Recreation | 22 (100.0%) | 0 (0.0%) |
| Accommodation & Food Services | 122 (52.6%) | 110 (47.4%) |
| Public Administration | 44 (78.6%) | 12 (21.4%) |
| Total | 1,137 (49.6%) | 1,157 (50.4%) |
Education in Cameron
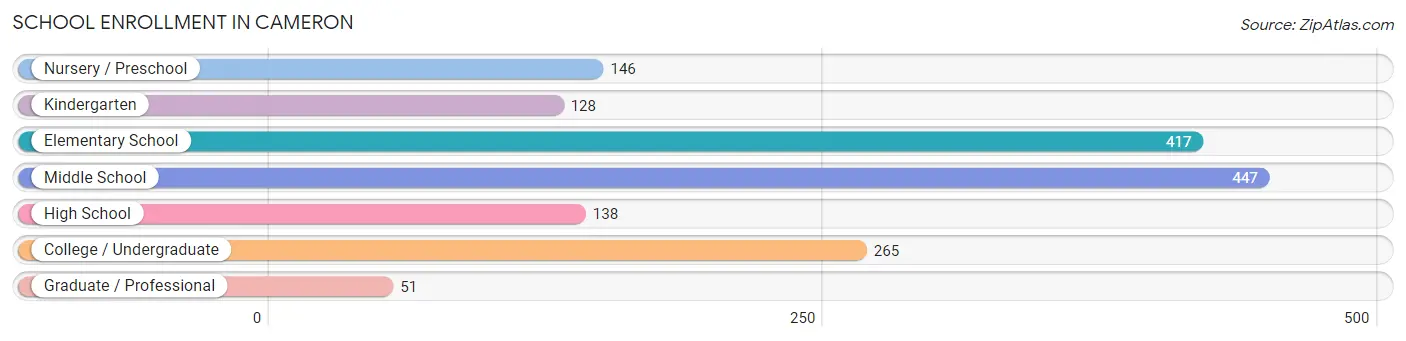
School Enrollment in Cameron
The most common levels of schooling among the 1,592 students in Cameron are middle school (447 | 28.1%), elementary school (417 | 26.2%), and college / undergraduate (265 | 16.7%).
| School Level | # Students | % Students |
| Nursery / Preschool | 146 | 9.2% |
| Kindergarten | 128 | 8.0% |
| Elementary School | 417 | 26.2% |
| Middle School | 447 | 28.1% |
| High School | 138 | 8.7% |
| College / Undergraduate | 265 | 16.7% |
| Graduate / Professional | 51 | 3.2% |
| Total | 1,592 | 100.0% |
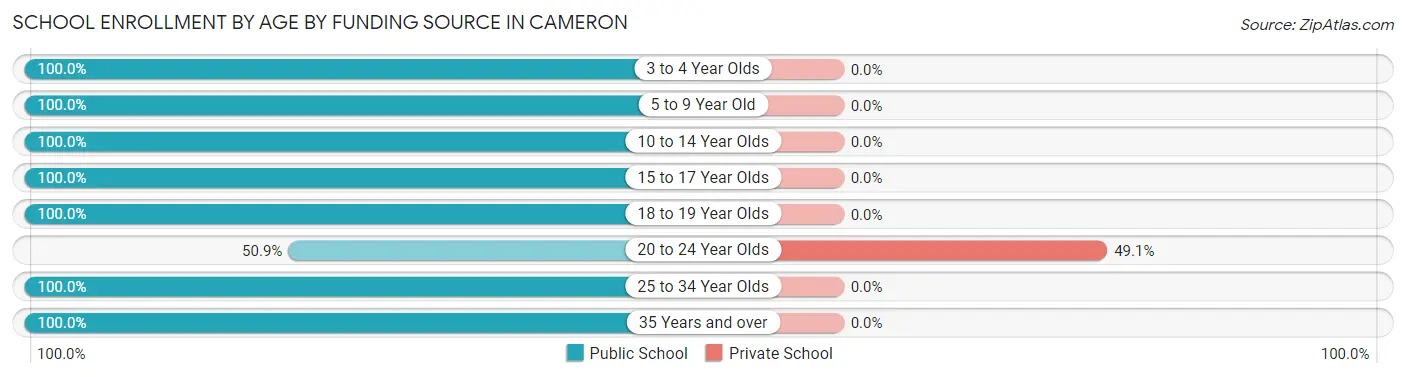
School Enrollment by Age by Funding Source in Cameron
Out of a total of 1,592 students who are enrolled in schools in Cameron, 108 (6.8%) attend a private institution, while the remaining 1,484 (93.2%) are enrolled in public schools. The age group of 20 to 24 year olds has the highest likelihood of being enrolled in private schools, with 108 (49.1% in the age bracket) enrolled. Conversely, the age group of 3 to 4 year olds has the lowest likelihood of being enrolled in a private school, with 35 (100.0% in the age bracket) attending a public institution.
| Age Bracket | Public School | Private School |
| 3 to 4 Year Olds | 35 (100.0%) | 0 (0.0%) |
| 5 to 9 Year Old | 539 (100.0%) | 0 (0.0%) |
| 10 to 14 Year Olds | 625 (100.0%) | 0 (0.0%) |
| 15 to 17 Year Olds | 74 (100.0%) | 0 (0.0%) |
| 18 to 19 Year Olds | 11 (100.0%) | 0 (0.0%) |
| 20 to 24 Year Olds | 112 (50.9%) | 108 (49.1%) |
| 25 to 34 Year Olds | 72 (100.0%) | 0 (0.0%) |
| 35 Years and over | 16 (100.0%) | 0 (0.0%) |
| Total | 1,484 (93.2%) | 108 (6.8%) |
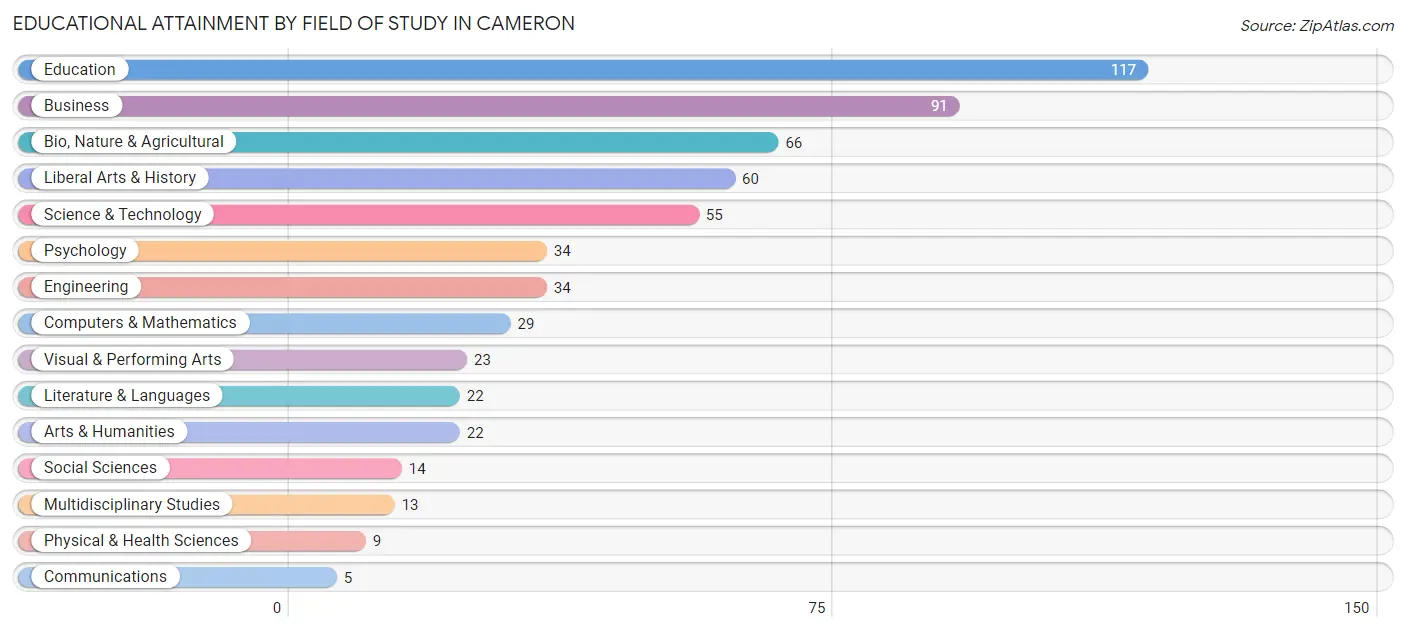
Educational Attainment by Field of Study in Cameron
Education (117 | 19.7%), business (91 | 15.3%), bio, nature & agricultural (66 | 11.1%), liberal arts & history (60 | 10.1%), and science & technology (55 | 9.3%) are the most common fields of study among 594 individuals in Cameron who have obtained a bachelor's degree or higher.
| Field of Study | # Graduates | % Graduates |
| Computers & Mathematics | 29 | 4.9% |
| Bio, Nature & Agricultural | 66 | 11.1% |
| Physical & Health Sciences | 9 | 1.5% |
| Psychology | 34 | 5.7% |
| Social Sciences | 14 | 2.4% |
| Engineering | 34 | 5.7% |
| Multidisciplinary Studies | 13 | 2.2% |
| Science & Technology | 55 | 9.3% |
| Business | 91 | 15.3% |
| Education | 117 | 19.7% |
| Literature & Languages | 22 | 3.7% |
| Liberal Arts & History | 60 | 10.1% |
| Visual & Performing Arts | 23 | 3.9% |
| Communications | 5 | 0.8% |
| Arts & Humanities | 22 | 3.7% |
| Total | 594 | 100.0% |
Transportation & Commute in Cameron
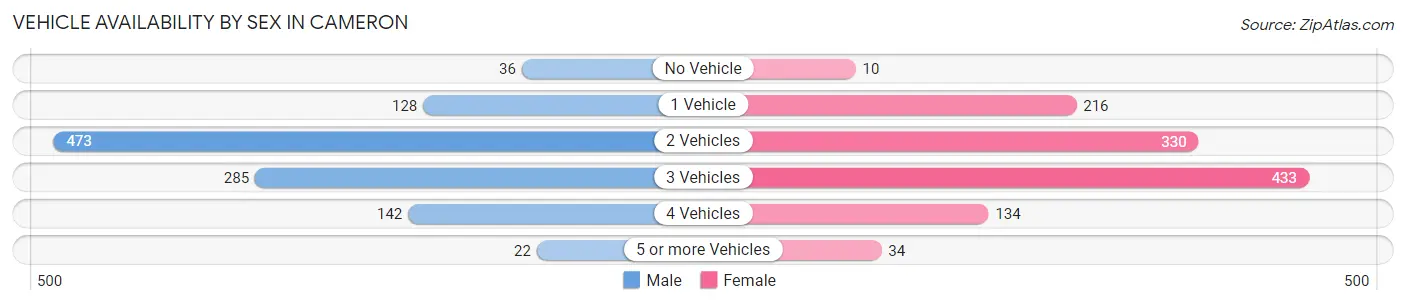
Vehicle Availability by Sex in Cameron
The most prevalent vehicle ownership categories in Cameron are males with 2 vehicles (473, accounting for 43.5%) and females with 2 vehicles (330, making up 40.9%).
| Vehicles Available | Male | Female |
| No Vehicle | 36 (3.3%) | 10 (0.9%) |
| 1 Vehicle | 128 (11.8%) | 216 (18.7%) |
| 2 Vehicles | 473 (43.5%) | 330 (28.5%) |
| 3 Vehicles | 285 (26.2%) | 433 (37.4%) |
| 4 Vehicles | 142 (13.1%) | 134 (11.6%) |
| 5 or more Vehicles | 22 (2.0%) | 34 (2.9%) |
| Total | 1,086 (100.0%) | 1,157 (100.0%) |
Commute Time in Cameron
The most frequently occuring commute durations in Cameron are 5 to 9 minutes (574 commuters, 27.5%), 10 to 14 minutes (251 commuters, 12.0%), and less than 5 minutes (200 commuters, 9.6%).
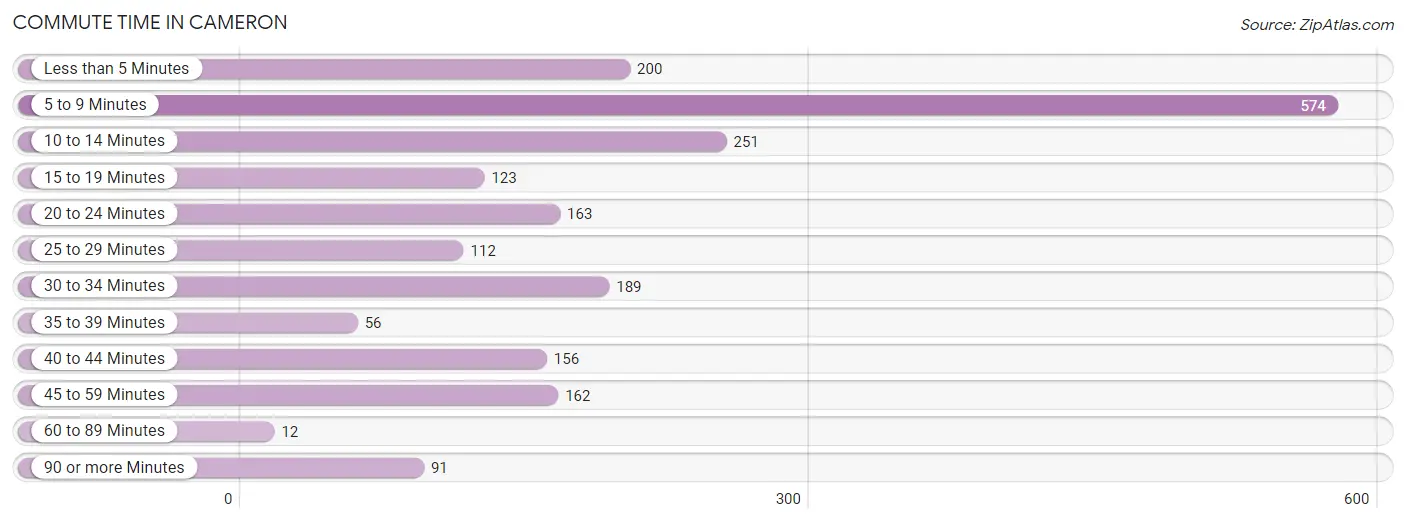
| Commute Time | # Commuters | % Commuters |
| Less than 5 Minutes | 200 | 9.6% |
| 5 to 9 Minutes | 574 | 27.5% |
| 10 to 14 Minutes | 251 | 12.0% |
| 15 to 19 Minutes | 123 | 5.9% |
| 20 to 24 Minutes | 163 | 7.8% |
| 25 to 29 Minutes | 112 | 5.4% |
| 30 to 34 Minutes | 189 | 9.0% |
| 35 to 39 Minutes | 56 | 2.7% |
| 40 to 44 Minutes | 156 | 7.5% |
| 45 to 59 Minutes | 162 | 7.7% |
| 60 to 89 Minutes | 12 | 0.6% |
| 90 or more Minutes | 91 | 4.4% |
Commute Time by Sex in Cameron
The most common commute times in Cameron are 5 to 9 minutes (317 commuters, 32.9%) for males and 5 to 9 minutes (257 commuters, 22.8%) for females.
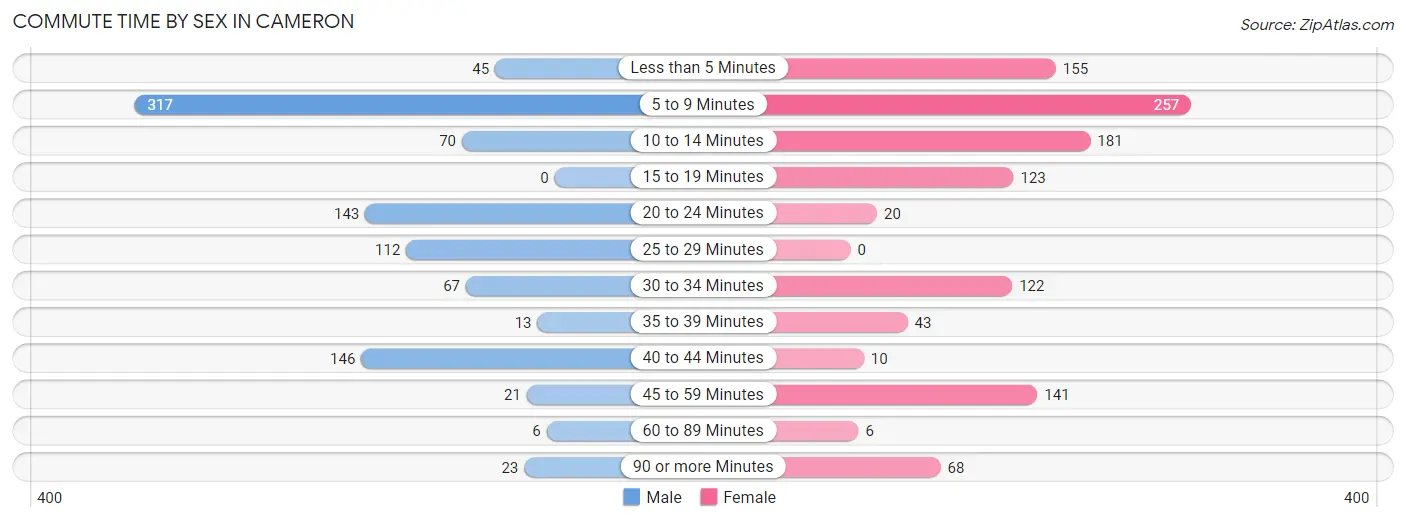
| Commute Time | Male | Female |
| Less than 5 Minutes | 45 (4.7%) | 155 (13.8%) |
| 5 to 9 Minutes | 317 (32.9%) | 257 (22.8%) |
| 10 to 14 Minutes | 70 (7.3%) | 181 (16.1%) |
| 15 to 19 Minutes | 0 (0.0%) | 123 (10.9%) |
| 20 to 24 Minutes | 143 (14.8%) | 20 (1.8%) |
| 25 to 29 Minutes | 112 (11.6%) | 0 (0.0%) |
| 30 to 34 Minutes | 67 (7.0%) | 122 (10.8%) |
| 35 to 39 Minutes | 13 (1.3%) | 43 (3.8%) |
| 40 to 44 Minutes | 146 (15.2%) | 10 (0.9%) |
| 45 to 59 Minutes | 21 (2.2%) | 141 (12.5%) |
| 60 to 89 Minutes | 6 (0.6%) | 6 (0.5%) |
| 90 or more Minutes | 23 (2.4%) | 68 (6.0%) |
Time of Departure to Work by Sex in Cameron
The most frequent times of departure to work in Cameron are 7:00 AM to 7:29 AM (185, 19.2%) for males and 7:30 AM to 7:59 AM (324, 28.8%) for females.
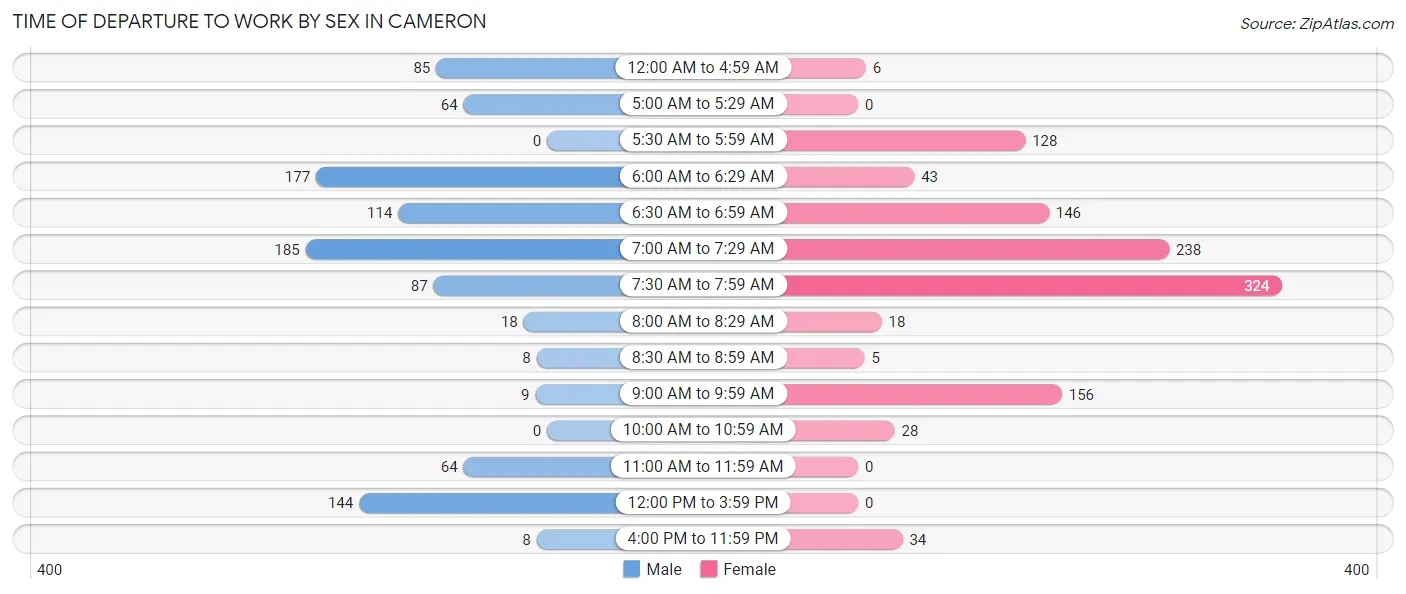
| Time of Departure | Male | Female |
| 12:00 AM to 4:59 AM | 85 (8.8%) | 6 (0.5%) |
| 5:00 AM to 5:29 AM | 64 (6.7%) | 0 (0.0%) |
| 5:30 AM to 5:59 AM | 0 (0.0%) | 128 (11.4%) |
| 6:00 AM to 6:29 AM | 177 (18.4%) | 43 (3.8%) |
| 6:30 AM to 6:59 AM | 114 (11.8%) | 146 (13.0%) |
| 7:00 AM to 7:29 AM | 185 (19.2%) | 238 (21.1%) |
| 7:30 AM to 7:59 AM | 87 (9.0%) | 324 (28.8%) |
| 8:00 AM to 8:29 AM | 18 (1.9%) | 18 (1.6%) |
| 8:30 AM to 8:59 AM | 8 (0.8%) | 5 (0.4%) |
| 9:00 AM to 9:59 AM | 9 (0.9%) | 156 (13.9%) |
| 10:00 AM to 10:59 AM | 0 (0.0%) | 28 (2.5%) |
| 11:00 AM to 11:59 AM | 64 (6.7%) | 0 (0.0%) |
| 12:00 PM to 3:59 PM | 144 (14.9%) | 0 (0.0%) |
| 4:00 PM to 11:59 PM | 8 (0.8%) | 34 (3.0%) |
| Total | 963 (100.0%) | 1,126 (100.0%) |
Housing Occupancy in Cameron
Occupancy by Ownership in Cameron
Of the total 1,753 dwellings in Cameron, owner-occupied units account for 1,046 (59.7%), while renter-occupied units make up 707 (40.3%).
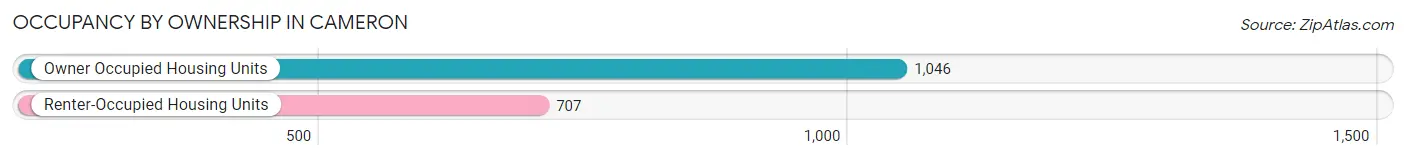
| Occupancy | # Housing Units | % Housing Units |
| Owner Occupied Housing Units | 1,046 | 59.7% |
| Renter-Occupied Housing Units | 707 | 40.3% |
| Total Occupied Housing Units | 1,753 | 100.0% |
Occupancy by Household Size in Cameron
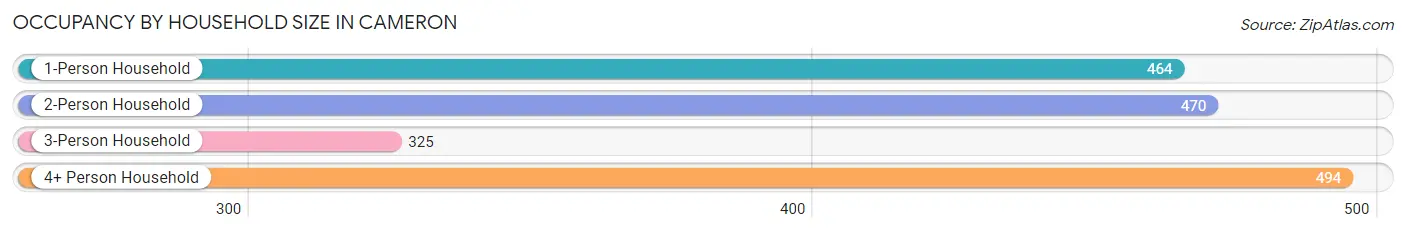
| Household Size | # Housing Units | % Housing Units |
| 1-Person Household | 464 | 26.5% |
| 2-Person Household | 470 | 26.8% |
| 3-Person Household | 325 | 18.5% |
| 4+ Person Household | 494 | 28.2% |
| Total Housing Units | 1,753 | 100.0% |
Occupancy by Ownership by Household Size in Cameron
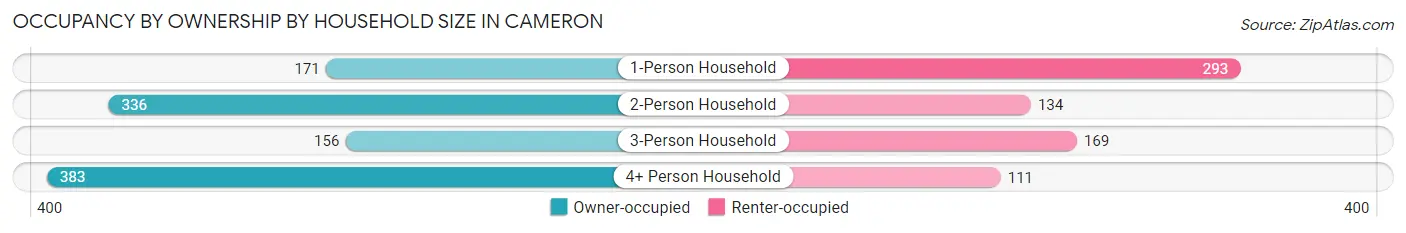
| Household Size | Owner-occupied | Renter-occupied |
| 1-Person Household | 171 (36.8%) | 293 (63.1%) |
| 2-Person Household | 336 (71.5%) | 134 (28.5%) |
| 3-Person Household | 156 (48.0%) | 169 (52.0%) |
| 4+ Person Household | 383 (77.5%) | 111 (22.5%) |
| Total Housing Units | 1,046 (59.7%) | 707 (40.3%) |
Occupancy by Educational Attainment in Cameron
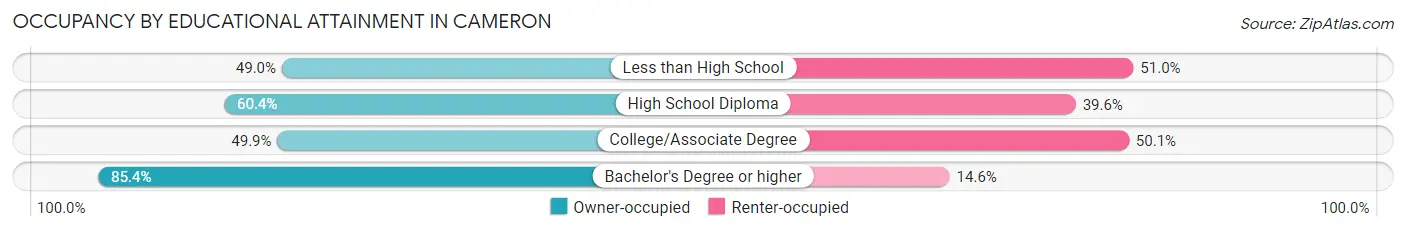
| Household Size | Owner-occupied | Renter-occupied |
| Less than High School | 171 (49.0%) | 178 (51.0%) |
| High School Diploma | 385 (60.4%) | 252 (39.6%) |
| College/Associate Degree | 232 (49.9%) | 233 (50.1%) |
| Bachelor's Degree or higher | 258 (85.4%) | 44 (14.6%) |
Occupancy by Age of Householder in Cameron
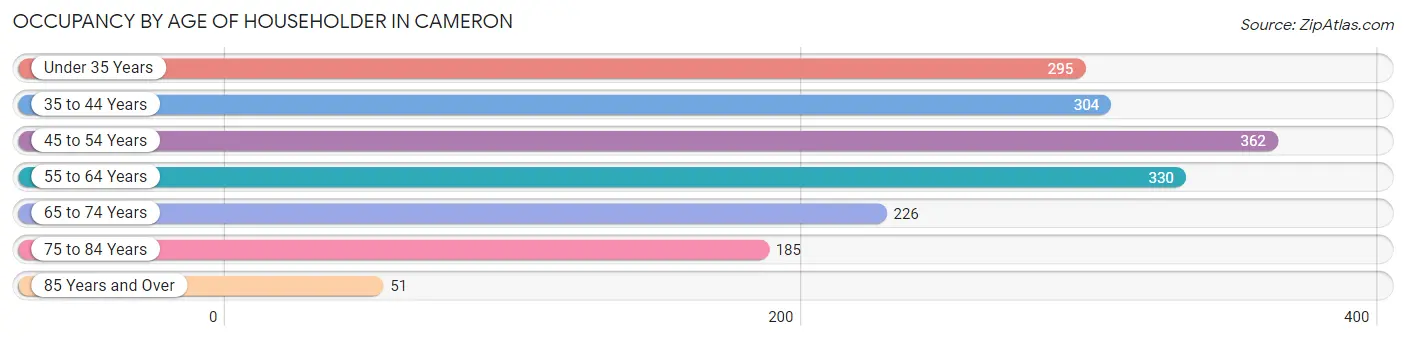
| Age Bracket | # Households | % Households |
| Under 35 Years | 295 | 16.8% |
| 35 to 44 Years | 304 | 17.3% |
| 45 to 54 Years | 362 | 20.6% |
| 55 to 64 Years | 330 | 18.8% |
| 65 to 74 Years | 226 | 12.9% |
| 75 to 84 Years | 185 | 10.5% |
| 85 Years and Over | 51 | 2.9% |
| Total | 1,753 | 100.0% |
Housing Finances in Cameron
Median Income by Occupancy in Cameron
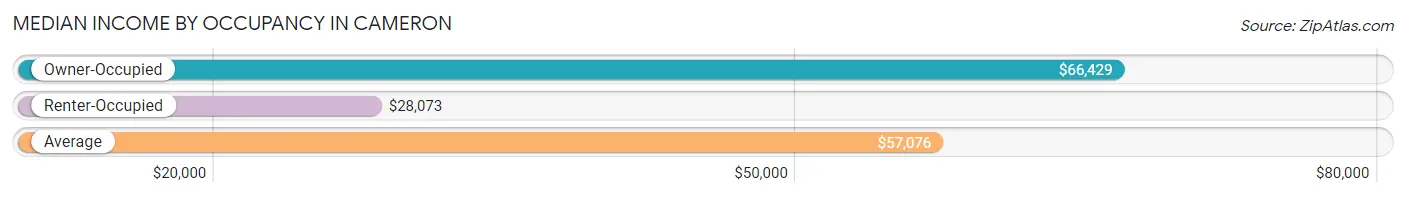
| Occupancy Type | # Households | Median Income |
| Owner-Occupied | 1,046 (59.7%) | $66,429 |
| Renter-Occupied | 707 (40.3%) | $28,073 |
| Average | 1,753 (100.0%) | $57,076 |
Occupancy by Householder Income Bracket in Cameron
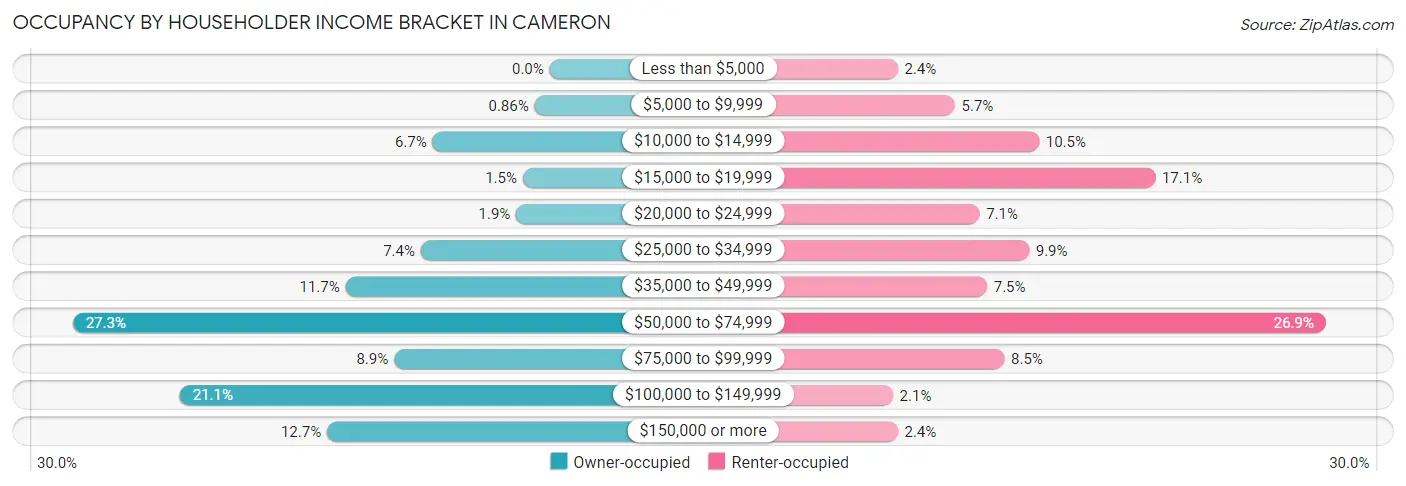
| Income Bracket | Owner-occupied | Renter-occupied |
| Less than $5,000 | 0 (0.0%) | 17 (2.4%) |
| $5,000 to $9,999 | 9 (0.9%) | 40 (5.7%) |
| $10,000 to $14,999 | 70 (6.7%) | 74 (10.5%) |
| $15,000 to $19,999 | 16 (1.5%) | 121 (17.1%) |
| $20,000 to $24,999 | 20 (1.9%) | 50 (7.1%) |
| $25,000 to $34,999 | 77 (7.4%) | 70 (9.9%) |
| $35,000 to $49,999 | 122 (11.7%) | 53 (7.5%) |
| $50,000 to $74,999 | 285 (27.3%) | 190 (26.9%) |
| $75,000 to $99,999 | 93 (8.9%) | 60 (8.5%) |
| $100,000 to $149,999 | 221 (21.1%) | 15 (2.1%) |
| $150,000 or more | 133 (12.7%) | 17 (2.4%) |
| Total | 1,046 (100.0%) | 707 (100.0%) |
Monthly Housing Cost Tiers in Cameron
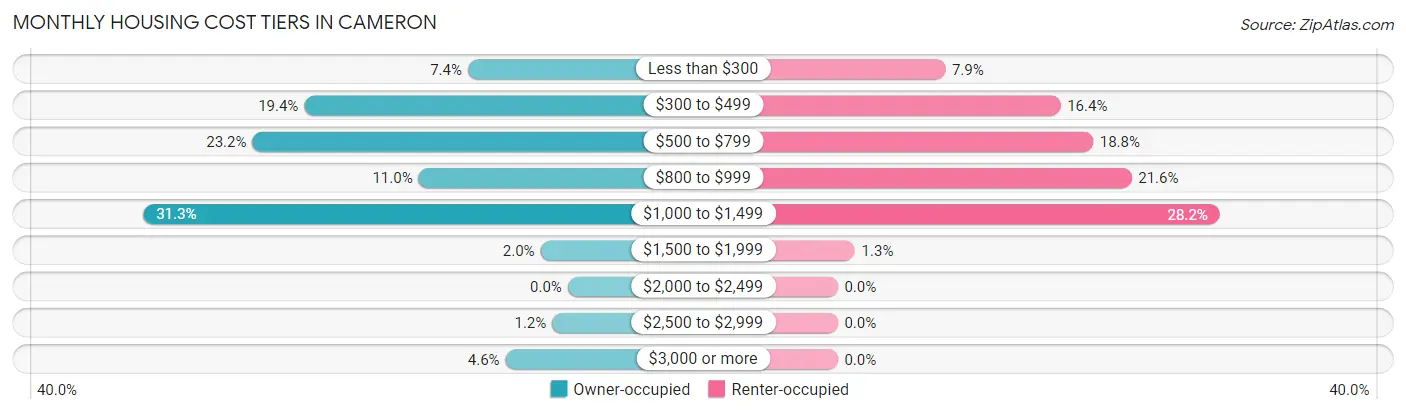
| Monthly Cost | Owner-occupied | Renter-occupied |
| Less than $300 | 77 (7.4%) | 56 (7.9%) |
| $300 to $499 | 203 (19.4%) | 116 (16.4%) |
| $500 to $799 | 243 (23.2%) | 133 (18.8%) |
| $800 to $999 | 115 (11.0%) | 153 (21.6%) |
| $1,000 to $1,499 | 327 (31.3%) | 199 (28.1%) |
| $1,500 to $1,999 | 21 (2.0%) | 9 (1.3%) |
| $2,000 to $2,499 | 0 (0.0%) | 0 (0.0%) |
| $2,500 to $2,999 | 12 (1.1%) | 0 (0.0%) |
| $3,000 or more | 48 (4.6%) | 0 (0.0%) |
| Total | 1,046 (100.0%) | 707 (100.0%) |
Physical Housing Characteristics in Cameron
Housing Structures in Cameron
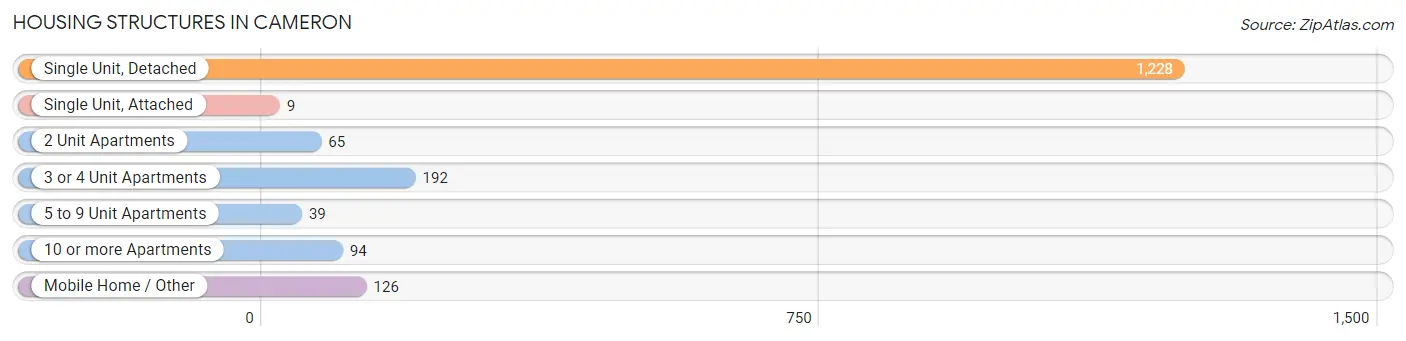
| Structure Type | # Housing Units | % Housing Units |
| Single Unit, Detached | 1,228 | 70.1% |
| Single Unit, Attached | 9 | 0.5% |
| 2 Unit Apartments | 65 | 3.7% |
| 3 or 4 Unit Apartments | 192 | 11.0% |
| 5 to 9 Unit Apartments | 39 | 2.2% |
| 10 or more Apartments | 94 | 5.4% |
| Mobile Home / Other | 126 | 7.2% |
| Total | 1,753 | 100.0% |
Housing Structures by Occupancy in Cameron
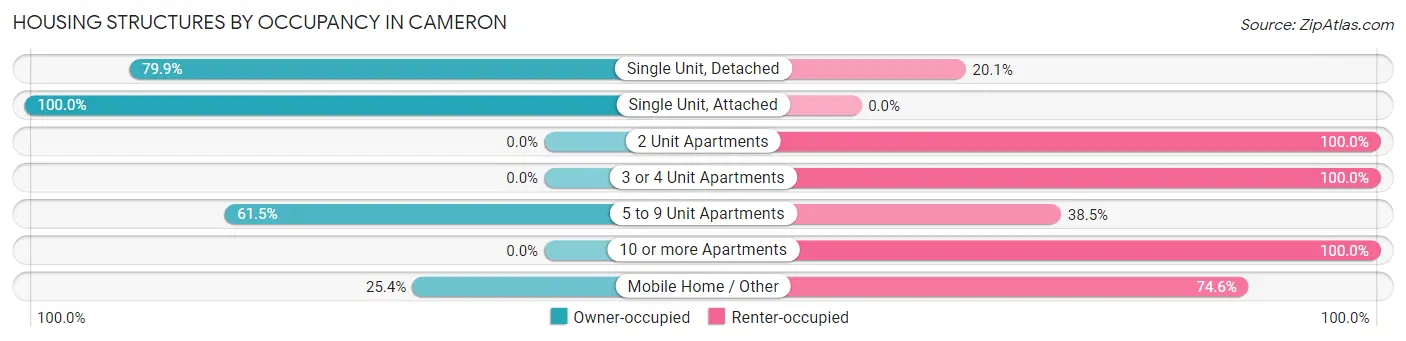
| Structure Type | Owner-occupied | Renter-occupied |
| Single Unit, Detached | 981 (79.9%) | 247 (20.1%) |
| Single Unit, Attached | 9 (100.0%) | 0 (0.0%) |
| 2 Unit Apartments | 0 (0.0%) | 65 (100.0%) |
| 3 or 4 Unit Apartments | 0 (0.0%) | 192 (100.0%) |
| 5 to 9 Unit Apartments | 24 (61.5%) | 15 (38.5%) |
| 10 or more Apartments | 0 (0.0%) | 94 (100.0%) |
| Mobile Home / Other | 32 (25.4%) | 94 (74.6%) |
| Total | 1,046 (59.7%) | 707 (40.3%) |
Housing Structures by Number of Rooms in Cameron
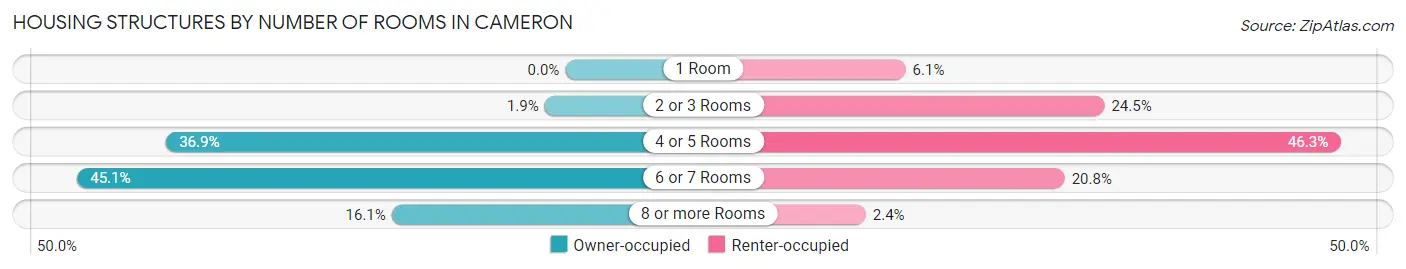
| Number of Rooms | Owner-occupied | Renter-occupied |
| 1 Room | 0 (0.0%) | 43 (6.1%) |
| 2 or 3 Rooms | 20 (1.9%) | 173 (24.5%) |
| 4 or 5 Rooms | 386 (36.9%) | 327 (46.3%) |
| 6 or 7 Rooms | 472 (45.1%) | 147 (20.8%) |
| 8 or more Rooms | 168 (16.1%) | 17 (2.4%) |
| Total | 1,046 (100.0%) | 707 (100.0%) |
Housing Structure by Heating Type in Cameron

| Heating Type | Owner-occupied | Renter-occupied |
| Utility Gas | 382 (36.5%) | 101 (14.3%) |
| Bottled, Tank, or LP Gas | 0 (0.0%) | 0 (0.0%) |
| Electricity | 649 (62.1%) | 606 (85.7%) |
| Fuel Oil or Kerosene | 0 (0.0%) | 0 (0.0%) |
| Coal or Coke | 0 (0.0%) | 0 (0.0%) |
| All other Fuels | 0 (0.0%) | 0 (0.0%) |
| No Fuel Used | 15 (1.4%) | 0 (0.0%) |
| Total | 1,046 (100.0%) | 707 (100.0%) |
Household Vehicle Usage in Cameron
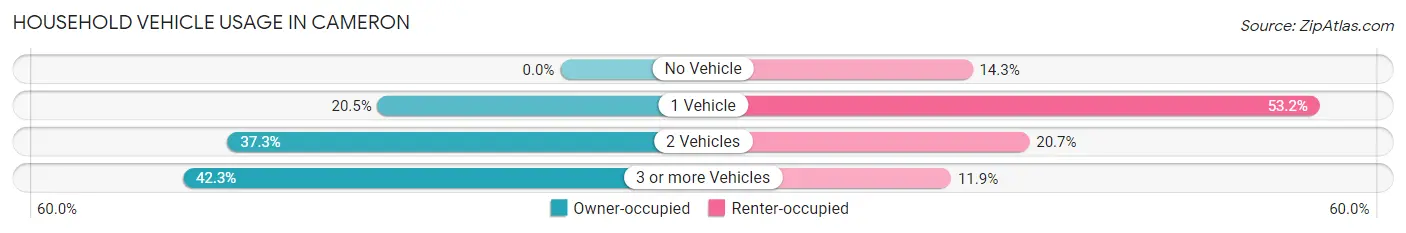
| Vehicles per Household | Owner-occupied | Renter-occupied |
| No Vehicle | 0 (0.0%) | 101 (14.3%) |
| 1 Vehicle | 214 (20.5%) | 376 (53.2%) |
| 2 Vehicles | 390 (37.3%) | 146 (20.6%) |
| 3 or more Vehicles | 442 (42.3%) | 84 (11.9%) |
| Total | 1,046 (100.0%) | 707 (100.0%) |
Real Estate & Mortgages in Cameron
Real Estate and Mortgage Overview in Cameron
| Characteristic | Without Mortgage | With Mortgage |
| Housing Units | 497 | 549 |
| Median Property Value | $90,200 | $107,500 |
| Median Household Income | $56,387 | $68 |
| Monthly Housing Costs | $481 | $48 |
| Real Estate Taxes | $1,434 | $0 |
Property Value by Mortgage Status in Cameron
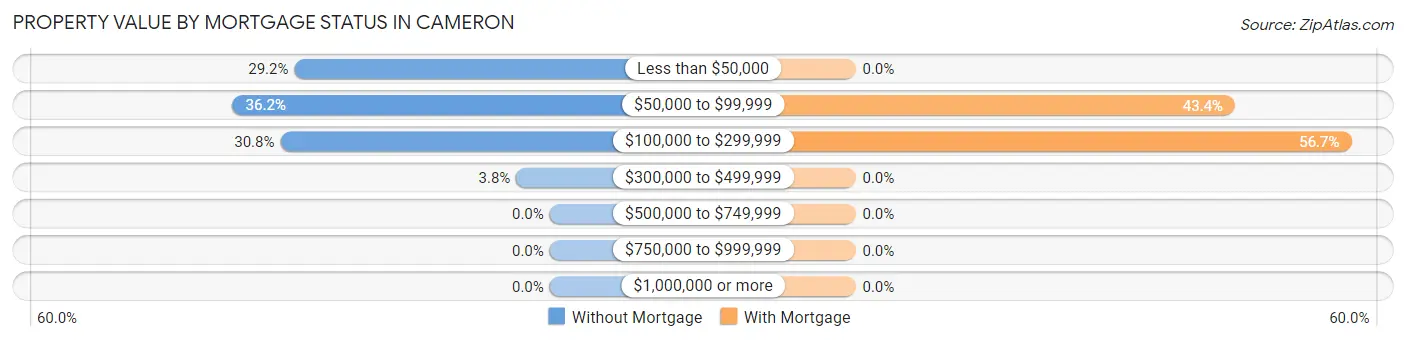
| Property Value | Without Mortgage | With Mortgage |
| Less than $50,000 | 145 (29.2%) | 0 (0.0%) |
| $50,000 to $99,999 | 180 (36.2%) | 238 (43.3%) |
| $100,000 to $299,999 | 153 (30.8%) | 311 (56.7%) |
| $300,000 to $499,999 | 19 (3.8%) | 0 (0.0%) |
| $500,000 to $749,999 | 0 (0.0%) | 0 (0.0%) |
| $750,000 to $999,999 | 0 (0.0%) | 0 (0.0%) |
| $1,000,000 or more | 0 (0.0%) | 0 (0.0%) |
| Total | 497 (100.0%) | 549 (100.0%) |
Household Income by Mortgage Status in Cameron
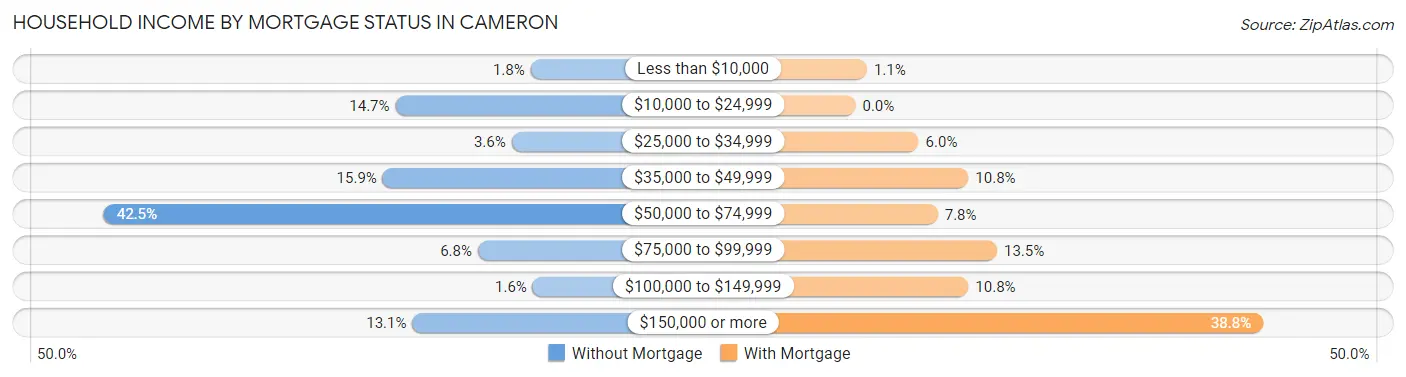
| Household Income | Without Mortgage | With Mortgage |
| Less than $10,000 | 9 (1.8%) | 6 (1.1%) |
| $10,000 to $24,999 | 73 (14.7%) | 0 (0.0%) |
| $25,000 to $34,999 | 18 (3.6%) | 33 (6.0%) |
| $35,000 to $49,999 | 79 (15.9%) | 59 (10.7%) |
| $50,000 to $74,999 | 211 (42.4%) | 43 (7.8%) |
| $75,000 to $99,999 | 34 (6.8%) | 74 (13.5%) |
| $100,000 to $149,999 | 8 (1.6%) | 59 (10.7%) |
| $150,000 or more | 65 (13.1%) | 213 (38.8%) |
| Total | 497 (100.0%) | 549 (100.0%) |
Property Value to Household Income Ratio in Cameron
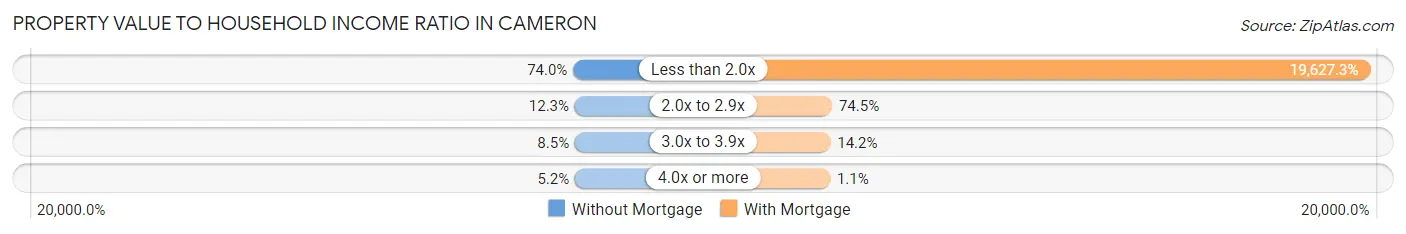
| Value-to-Income Ratio | Without Mortgage | With Mortgage |
| Less than 2.0x | 368 (74.0%) | 107,754 (19,627.3%) |
| 2.0x to 2.9x | 61 (12.3%) | 409 (74.5%) |
| 3.0x to 3.9x | 42 (8.5%) | 78 (14.2%) |
| 4.0x or more | 26 (5.2%) | 6 (1.1%) |
| Total | 497 (100.0%) | 549 (100.0%) |
Real Estate Taxes by Mortgage Status in Cameron
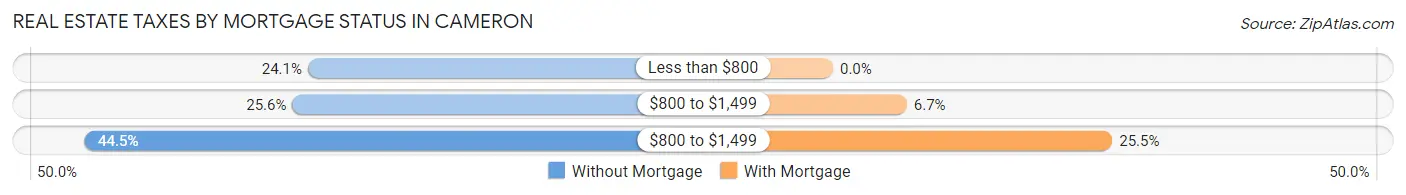
| Property Taxes | Without Mortgage | With Mortgage |
| Less than $800 | 120 (24.1%) | 0 (0.0%) |
| $800 to $1,499 | 127 (25.6%) | 37 (6.7%) |
| $800 to $1,499 | 221 (44.5%) | 140 (25.5%) |
| Total | 497 (100.0%) | 549 (100.0%) |
Health & Disability in Cameron
Health Insurance Coverage by Age in Cameron
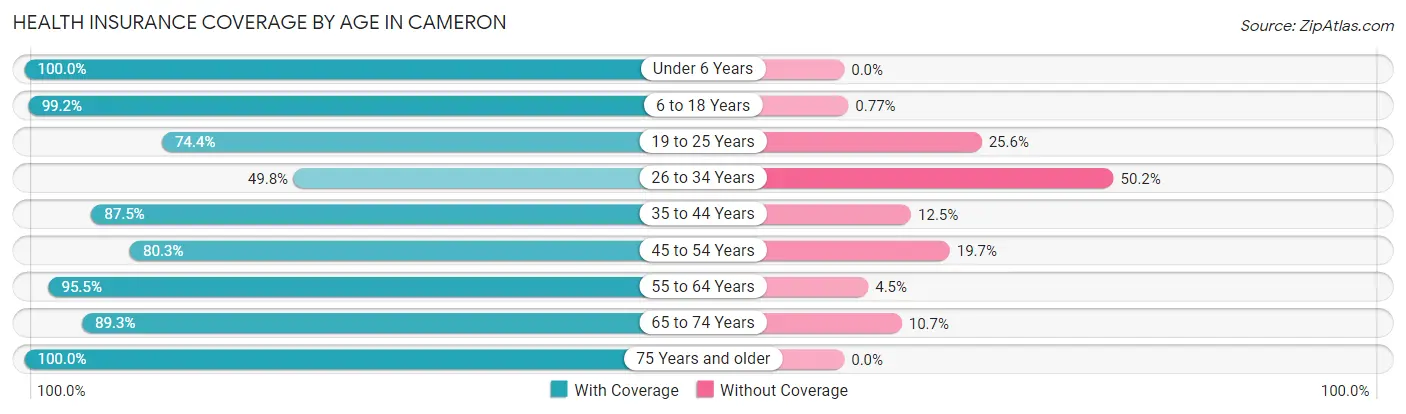
| Age Bracket | With Coverage | Without Coverage |
| Under 6 Years | 483 (100.0%) | 0 (0.0%) |
| 6 to 18 Years | 1,036 (99.2%) | 8 (0.8%) |
| 19 to 25 Years | 383 (74.4%) | 132 (25.6%) |
| 26 to 34 Years | 222 (49.8%) | 224 (50.2%) |
| 35 to 44 Years | 569 (87.5%) | 81 (12.5%) |
| 45 to 54 Years | 555 (80.3%) | 136 (19.7%) |
| 55 to 64 Years | 470 (95.5%) | 22 (4.5%) |
| 65 to 74 Years | 358 (89.3%) | 43 (10.7%) |
| 75 Years and older | 339 (100.0%) | 0 (0.0%) |
| Total | 4,415 (87.2%) | 646 (12.8%) |
Health Insurance Coverage by Citizenship Status in Cameron
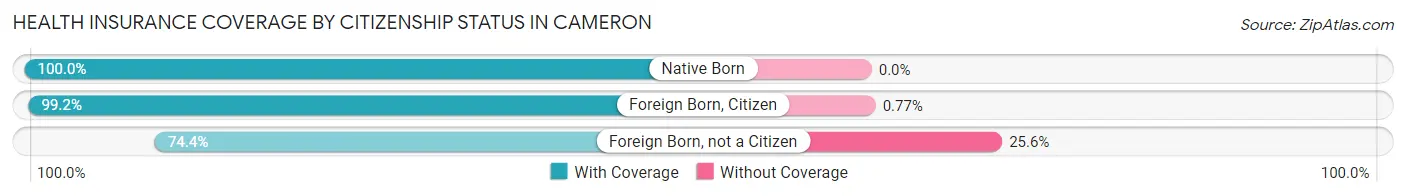
| Citizenship Status | With Coverage | Without Coverage |
| Native Born | 483 (100.0%) | 0 (0.0%) |
| Foreign Born, Citizen | 1,036 (99.2%) | 8 (0.8%) |
| Foreign Born, not a Citizen | 383 (74.4%) | 132 (25.6%) |
Health Insurance Coverage by Household Income in Cameron
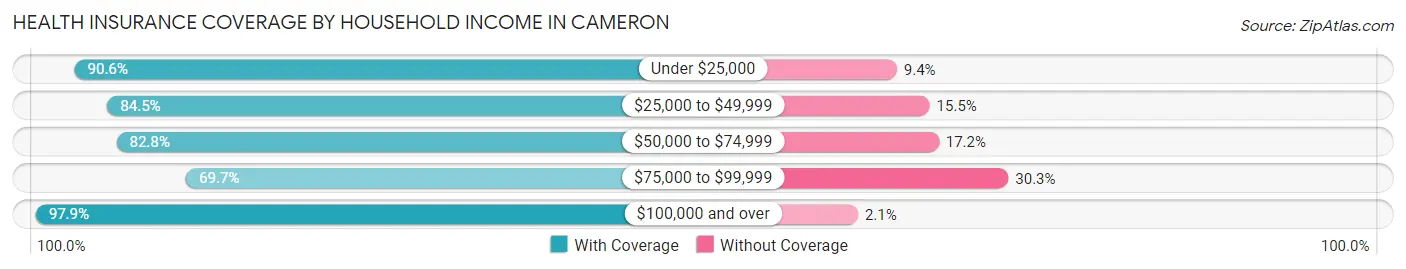
| Household Income | With Coverage | Without Coverage |
| Under $25,000 | 812 (90.6%) | 84 (9.4%) |
| $25,000 to $49,999 | 773 (84.5%) | 142 (15.5%) |
| $50,000 to $74,999 | 850 (82.8%) | 177 (17.2%) |
| $75,000 to $99,999 | 486 (69.7%) | 211 (30.3%) |
| $100,000 and over | 1,494 (97.9%) | 32 (2.1%) |
Public vs Private Health Insurance Coverage by Age in Cameron
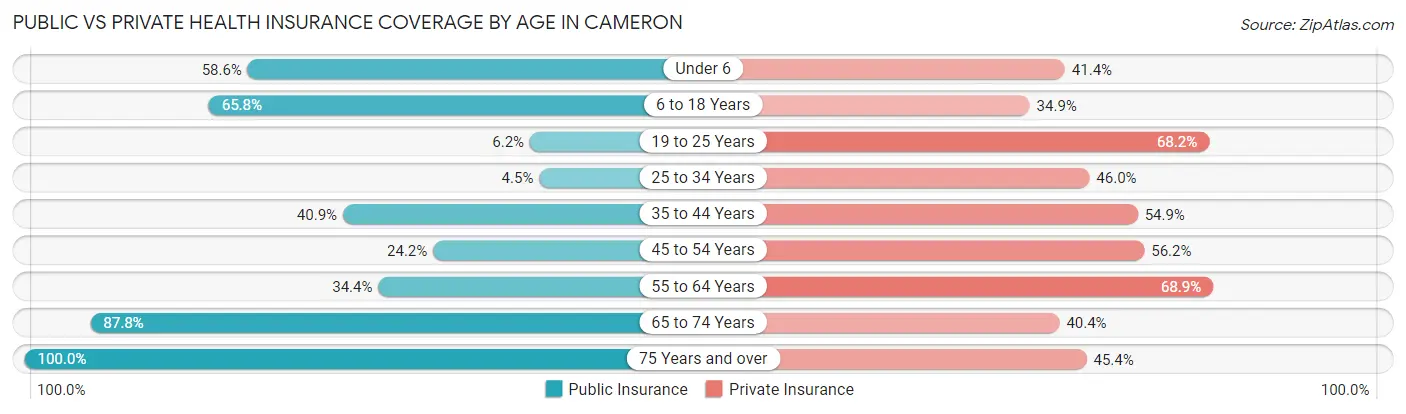
| Age Bracket | Public Insurance | Private Insurance |
| Under 6 | 283 (58.6%) | 200 (41.4%) |
| 6 to 18 Years | 687 (65.8%) | 364 (34.9%) |
| 19 to 25 Years | 32 (6.2%) | 351 (68.2%) |
| 25 to 34 Years | 20 (4.5%) | 205 (46.0%) |
| 35 to 44 Years | 266 (40.9%) | 357 (54.9%) |
| 45 to 54 Years | 167 (24.2%) | 388 (56.1%) |
| 55 to 64 Years | 169 (34.4%) | 339 (68.9%) |
| 65 to 74 Years | 352 (87.8%) | 162 (40.4%) |
| 75 Years and over | 339 (100.0%) | 154 (45.4%) |
| Total | 2,315 (45.7%) | 2,520 (49.8%) |
Disability Status by Sex by Age in Cameron
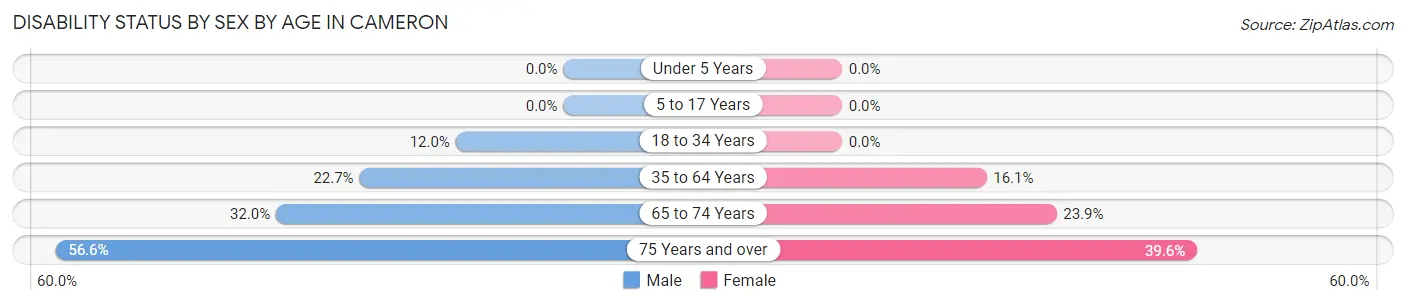
| Age Bracket | Male | Female |
| Under 5 Years | 0 (0.0%) | 0 (0.0%) |
| 5 to 17 Years | 0 (0.0%) | 0 (0.0%) |
| 18 to 34 Years | 64 (12.0%) | 0 (0.0%) |
| 35 to 64 Years | 213 (22.7%) | 144 (16.1%) |
| 65 to 74 Years | 56 (32.0%) | 54 (23.9%) |
| 75 Years and over | 86 (56.6%) | 74 (39.6%) |
Disability Class by Sex by Age in Cameron
Disability Class: Hearing Difficulty
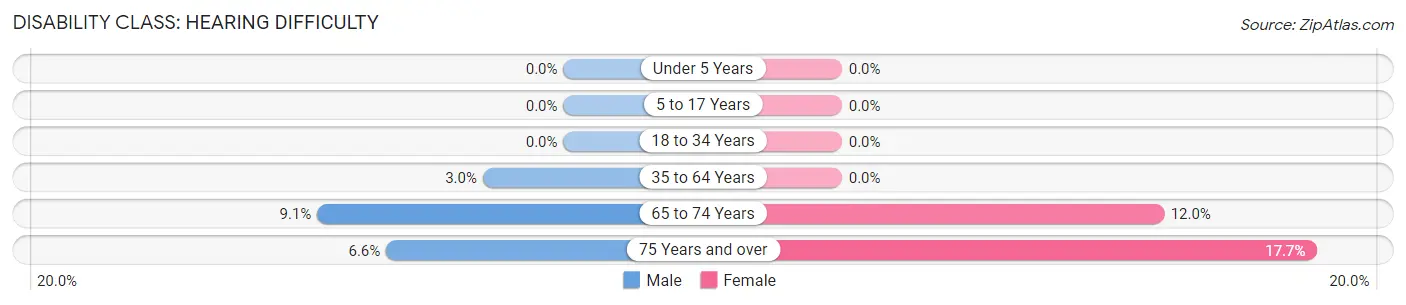
| Age Bracket | Male | Female |
| Under 5 Years | 0 (0.0%) | 0 (0.0%) |
| 5 to 17 Years | 0 (0.0%) | 0 (0.0%) |
| 18 to 34 Years | 0 (0.0%) | 0 (0.0%) |
| 35 to 64 Years | 28 (3.0%) | 0 (0.0%) |
| 65 to 74 Years | 16 (9.1%) | 27 (11.9%) |
| 75 Years and over | 10 (6.6%) | 33 (17.6%) |
Disability Class: Vision Difficulty
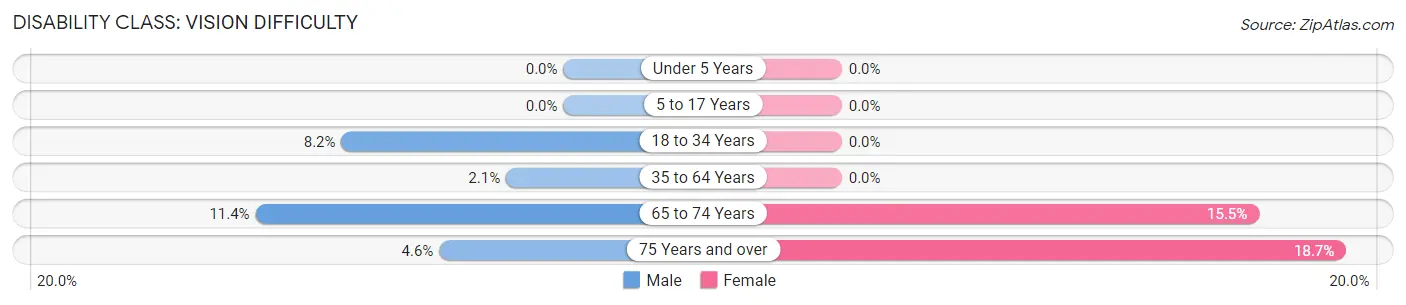
| Age Bracket | Male | Female |
| Under 5 Years | 0 (0.0%) | 0 (0.0%) |
| 5 to 17 Years | 0 (0.0%) | 0 (0.0%) |
| 18 to 34 Years | 44 (8.2%) | 0 (0.0%) |
| 35 to 64 Years | 20 (2.1%) | 0 (0.0%) |
| 65 to 74 Years | 20 (11.4%) | 35 (15.5%) |
| 75 Years and over | 7 (4.6%) | 35 (18.7%) |
Disability Class: Cognitive Difficulty
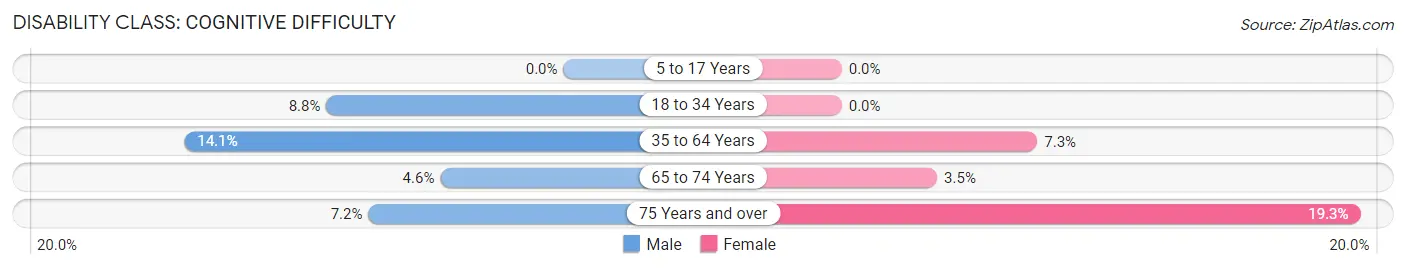
| Age Bracket | Male | Female |
| 5 to 17 Years | 0 (0.0%) | 0 (0.0%) |
| 18 to 34 Years | 47 (8.8%) | 0 (0.0%) |
| 35 to 64 Years | 132 (14.1%) | 65 (7.3%) |
| 65 to 74 Years | 8 (4.6%) | 8 (3.5%) |
| 75 Years and over | 11 (7.2%) | 36 (19.3%) |
Disability Class: Ambulatory Difficulty
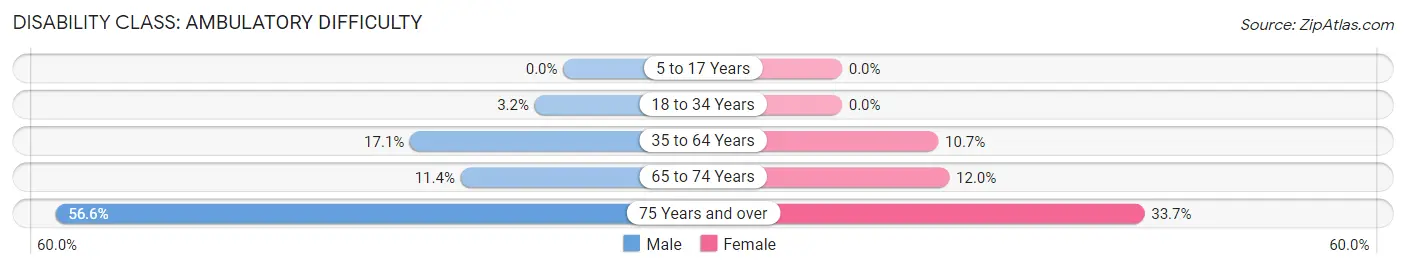
| Age Bracket | Male | Female |
| 5 to 17 Years | 0 (0.0%) | 0 (0.0%) |
| 18 to 34 Years | 17 (3.2%) | 0 (0.0%) |
| 35 to 64 Years | 160 (17.1%) | 96 (10.7%) |
| 65 to 74 Years | 20 (11.4%) | 27 (11.9%) |
| 75 Years and over | 86 (56.6%) | 63 (33.7%) |
Disability Class: Self-Care Difficulty
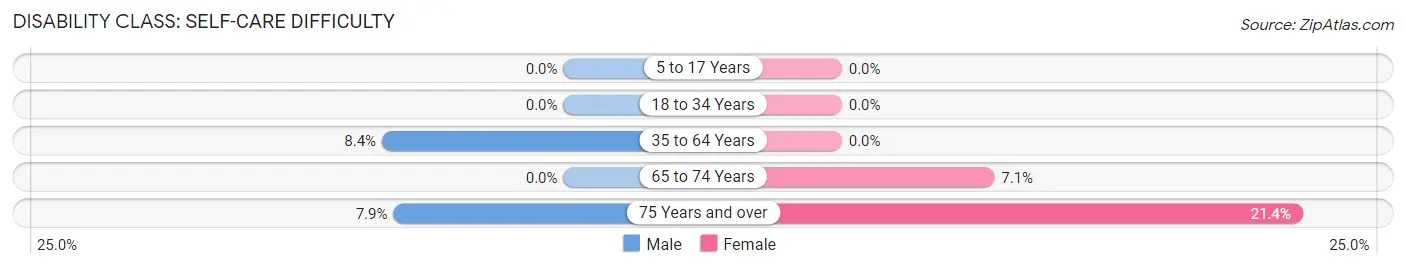
| Age Bracket | Male | Female |
| 5 to 17 Years | 0 (0.0%) | 0 (0.0%) |
| 18 to 34 Years | 0 (0.0%) | 0 (0.0%) |
| 35 to 64 Years | 79 (8.4%) | 0 (0.0%) |
| 65 to 74 Years | 0 (0.0%) | 16 (7.1%) |
| 75 Years and over | 12 (7.9%) | 40 (21.4%) |
Technology Access in Cameron
Computing Device Access in Cameron
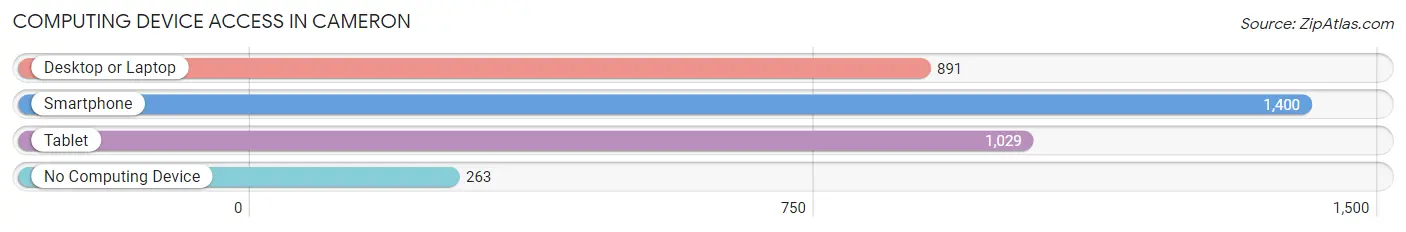
| Device Type | # Households | % Households |
| Desktop or Laptop | 891 | 50.8% |
| Smartphone | 1,400 | 79.9% |
| Tablet | 1,029 | 58.7% |
| No Computing Device | 263 | 15.0% |
| Total | 1,753 | 100.0% |
Internet Access in Cameron
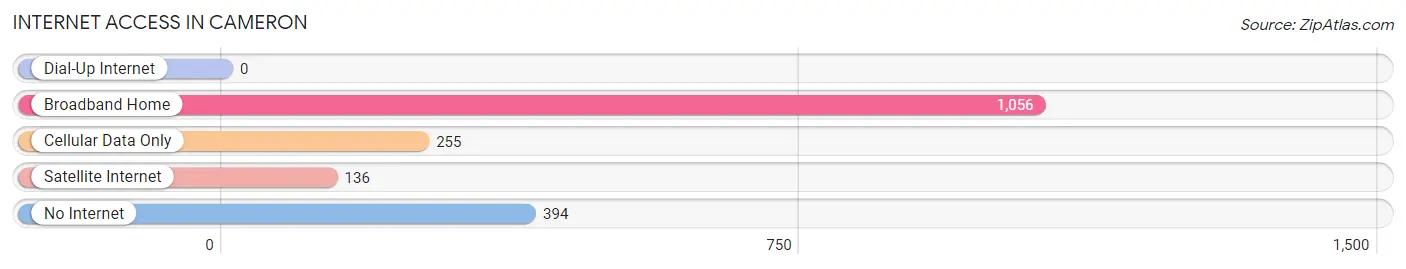
| Internet Type | # Households | % Households |
| Dial-Up Internet | 0 | 0.0% |
| Broadband Home | 1,056 | 60.2% |
| Cellular Data Only | 255 | 14.5% |
| Satellite Internet | 136 | 7.8% |
| No Internet | 394 | 22.5% |
| Total | 1,753 | 100.0% |
Cameron Summary
Cameron, Texas is a small city located in Milam County, Texas. It is situated about halfway between Austin and Waco, and is part of the Killeen-Temple-Fort Hood Metropolitan Statistical Area. The city has a population of 5,619 as of the 2010 census, and is the county seat of Milam County.
History
The area that is now Cameron was first settled in the early 1840s by a group of German immigrants. The town was originally called “Cameron’s Settlement” after one of the settlers, James Cameron. The town was officially established in 1846, and was named after the local postmaster, James Cameron.
In 1848, the town was incorporated and the first post office was established. The town grew slowly, but steadily, and by the late 19th century, it had become a thriving agricultural center. The town was also home to several businesses, including a cotton gin, a grist mill, and a blacksmith shop.
In the early 20th century, the town began to experience a period of growth and development. The town was connected to the rest of the state by the San Antonio and Aransas Pass Railway in 1906, and the town’s population began to grow. By the 1920s, the town had become a major center for cotton production, and the population had grown to over 2,000.
Geography
Cameron is located in Milam County, Texas, about halfway between Austin and Waco. The city is situated at the intersection of U.S. Highway 77 and State Highway 36. The city has a total area of 4.2 square miles, all of which is land.
The city is located in the Blackland Prairie region of Texas, and is characterized by flat terrain and fertile soil. The climate is humid subtropical, with hot summers and mild winters. The average annual temperature is 68 degrees Fahrenheit, and the average annual precipitation is 36 inches.
Economy
Cameron’s economy is largely based on agriculture. The city is home to several large farms, and the surrounding area is known for its production of cotton, corn, and other crops. The city is also home to several manufacturing and industrial businesses, including a steel mill and a paper mill.
The city is also home to several retail businesses, including several restaurants, grocery stores, and other shops. The city is also home to several medical facilities, including a hospital and several clinics.
Demographics
As of the 2010 census, the population of Cameron was 5,619. The racial makeup of the city was 79.3% White, 15.2% Hispanic or Latino, 2.7% African American, 0.7% Native American, 0.3% Asian, and 1.2% from other races.
The median household income in Cameron was $35,945, and the median family income was $41,945. The per capita income was $17,845. About 17.3% of the population was below the poverty line.
Conclusion
Cameron, Texas is a small city located in Milam County, Texas. It is situated about halfway between Austin and Waco, and is part of the Killeen-Temple-Fort Hood Metropolitan Statistical Area. The city has a population of 5,619 as of the 2010 census, and is the county seat of Milam County. The city’s economy is largely based on agriculture, and it is also home to several manufacturing and industrial businesses. The racial makeup of the city is 79.3% White, 15.2% Hispanic or Latino, 2.7% African American, 0.7% Native American, 0.3% Asian, and 1.2% from other races. The median household income in Cameron was $35,945, and the median family income was $41,945. The per capita income was $17,845. About 17.3% of the population was below the poverty line.
Common Questions
What is Per Capita Income in Cameron?
Per Capita income in Cameron is $23,700.
What is the Median Family Income in Cameron?
Median Family Income in Cameron is $61,437.
What is the Median Household income in Cameron?
Median Household Income in Cameron is $57,076.
What is Income or Wage Gap in Cameron?
Income or Wage Gap in Cameron is 31.5%.
Women in Cameron earn 68.5 cents for every dollar earned by a man.
What is Inequality or Gini Index in Cameron?
Inequality or Gini Index in Cameron is 0.40.
What is the Total Population of Cameron?
Total Population of Cameron is 5,356.
What is the Total Male Population of Cameron?
Total Male Population of Cameron is 2,665.
What is the Total Female Population of Cameron?
Total Female Population of Cameron is 2,691.
What is the Ratio of Males per 100 Females in Cameron?
There are 99.03 Males per 100 Females in Cameron.
What is the Ratio of Females per 100 Males in Cameron?
There are 100.98 Females per 100 Males in Cameron.
What is the Median Population Age in Cameron?
Median Population Age in Cameron is 36.1 Years.
What is the Average Family Size in Cameron
Average Family Size in Cameron is 3.5 People.
What is the Average Household Size in Cameron
Average Household Size in Cameron is 2.9 People.
How Large is the Labor Force in Cameron?
There are 2,417 People in the Labor Forcein in Cameron.
What is the Percentage of People in the Labor Force in Cameron?
62.1% of People are in the Labor Force in Cameron.
What is the Unemployment Rate in Cameron?
Unemployment Rate in Cameron is 5.1%.