Live Oak, TX Map & Demographics
Live Oak Map
Live Oak Overview
$37,561
PER CAPITA INCOME
$85,250
AVG FAMILY INCOME
$74,326
AVG HOUSEHOLD INCOME
20.6%
WAGE / INCOME GAP [ % ]
79.4¢/ $1
WAGE / INCOME GAP [ $ ]
$11,934
FAMILY INCOME DEFICIT
0.37
INEQUALITY / GINI INDEX
15,726
TOTAL POPULATION
7,439
MALE POPULATION
8,287
FEMALE POPULATION
89.77
MALES / 100 FEMALES
111.40
FEMALES / 100 MALES
33.7
MEDIAN AGE
3.0
AVG FAMILY SIZE
2.4
AVG HOUSEHOLD SIZE
8,615
LABOR FORCE [ PEOPLE ]
69.7%
PERCENT IN LABOR FORCE
5.5%
UNEMPLOYMENT RATE
Live Oak Area Codes
Income in Live Oak
Income Overview in Live Oak
Per Capita Income in Live Oak is $37,561, while median incomes of families and households are $85,250 and $74,326 respectively.
| Characteristic | Number | Measure |
| Per Capita Income | 15,726 | $37,561 |
| Median Family Income | 4,297 | $85,250 |
| Mean Family Income | 4,297 | $97,958 |
| Median Household Income | 6,476 | $74,326 |
| Mean Household Income | 6,476 | $89,727 |
| Income Deficit | 4,297 | $11,934 |
| Wage / Income Gap (%) | 15,726 | 20.57% |
| Wage / Income Gap ($) | 15,726 | 79.43¢ per $1 |
| Gini / Inequality Index | 15,726 | 0.37 |
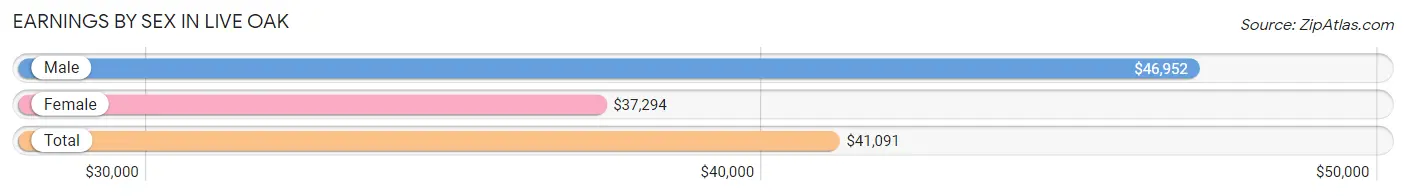
Earnings by Sex in Live Oak
Average Earnings in Live Oak are $41,091, $46,952 for men and $37,294 for women, a difference of 20.6%.
| Sex | Number | Average Earnings |
| Male | 4,377 (50.3%) | $46,952 |
| Female | 4,324 (49.7%) | $37,294 |
| Total | 8,701 (100.0%) | $41,091 |
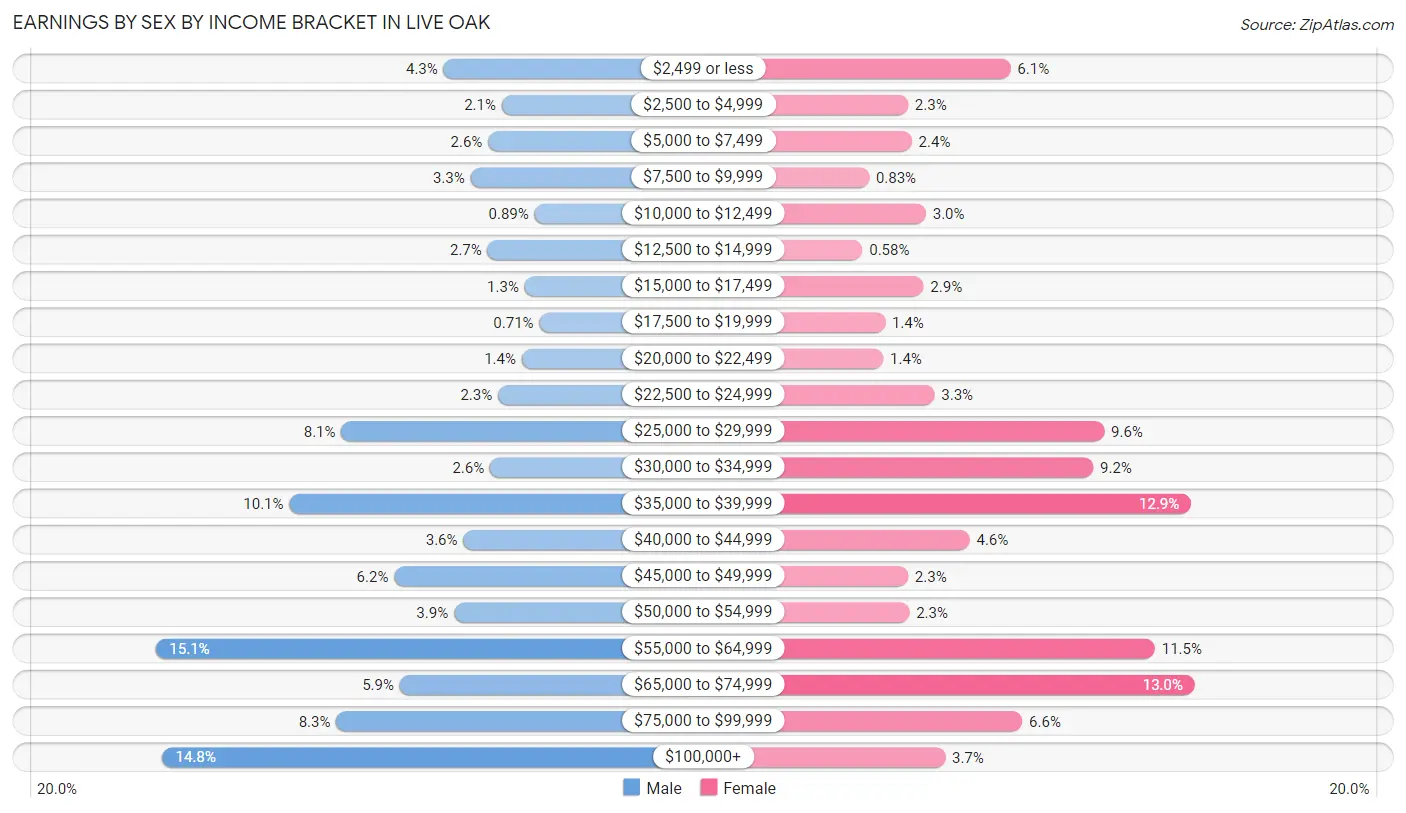
Earnings by Sex by Income Bracket in Live Oak
The most common earnings brackets in Live Oak are $55,000 to $64,999 for men (659 | 15.1%) and $65,000 to $74,999 for women (564 | 13.0%).
| Income | Male | Female |
| $2,499 or less | 188 (4.3%) | 265 (6.1%) |
| $2,500 to $4,999 | 93 (2.1%) | 99 (2.3%) |
| $5,000 to $7,499 | 115 (2.6%) | 105 (2.4%) |
| $7,500 to $9,999 | 144 (3.3%) | 36 (0.8%) |
| $10,000 to $12,499 | 39 (0.9%) | 128 (3.0%) |
| $12,500 to $14,999 | 116 (2.6%) | 25 (0.6%) |
| $15,000 to $17,499 | 55 (1.3%) | 124 (2.9%) |
| $17,500 to $19,999 | 31 (0.7%) | 62 (1.4%) |
| $20,000 to $22,499 | 60 (1.4%) | 59 (1.4%) |
| $22,500 to $24,999 | 99 (2.3%) | 142 (3.3%) |
| $25,000 to $29,999 | 356 (8.1%) | 417 (9.6%) |
| $30,000 to $34,999 | 112 (2.6%) | 399 (9.2%) |
| $35,000 to $39,999 | 441 (10.1%) | 558 (12.9%) |
| $40,000 to $44,999 | 156 (3.6%) | 199 (4.6%) |
| $45,000 to $49,999 | 269 (6.1%) | 99 (2.3%) |
| $50,000 to $54,999 | 171 (3.9%) | 101 (2.3%) |
| $55,000 to $64,999 | 659 (15.1%) | 499 (11.5%) |
| $65,000 to $74,999 | 260 (5.9%) | 564 (13.0%) |
| $75,000 to $99,999 | 364 (8.3%) | 284 (6.6%) |
| $100,000+ | 649 (14.8%) | 159 (3.7%) |
| Total | 4,377 (100.0%) | 4,324 (100.0%) |
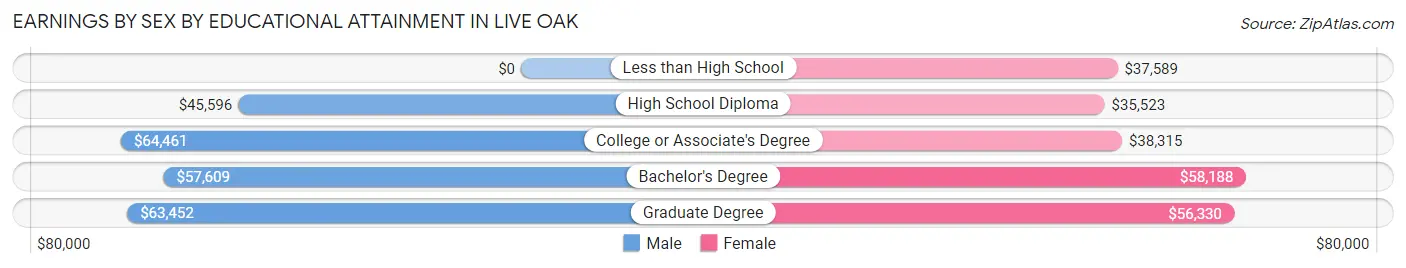
Earnings by Sex by Educational Attainment in Live Oak
Average earnings in Live Oak are $57,164 for men and $39,716 for women, a difference of 30.5%. Men with an educational attainment of college or associate's degree enjoy the highest average annual earnings of $64,461, while those with high school diploma education earn the least with $45,596. Women with an educational attainment of bachelor's degree earn the most with the average annual earnings of $58,188, while those with high school diploma education have the smallest earnings of $35,523.
| Educational Attainment | Male Income | Female Income |
| Less than High School | - | - |
| High School Diploma | $45,596 | $35,523 |
| College or Associate's Degree | $64,461 | $38,315 |
| Bachelor's Degree | $57,609 | $58,188 |
| Graduate Degree | $63,452 | $56,330 |
| Total | $57,164 | $39,716 |
Family Income in Live Oak
Family Income Brackets in Live Oak
According to the Live Oak family income data, there are 1,083 families falling into the $100,000 to $149,999 income range, which is the most common income bracket and makes up 25.2% of all families. Conversely, the $10,000 to $14,999 income bracket is the least frequent group with only 39 families (0.9%) belonging to this category.
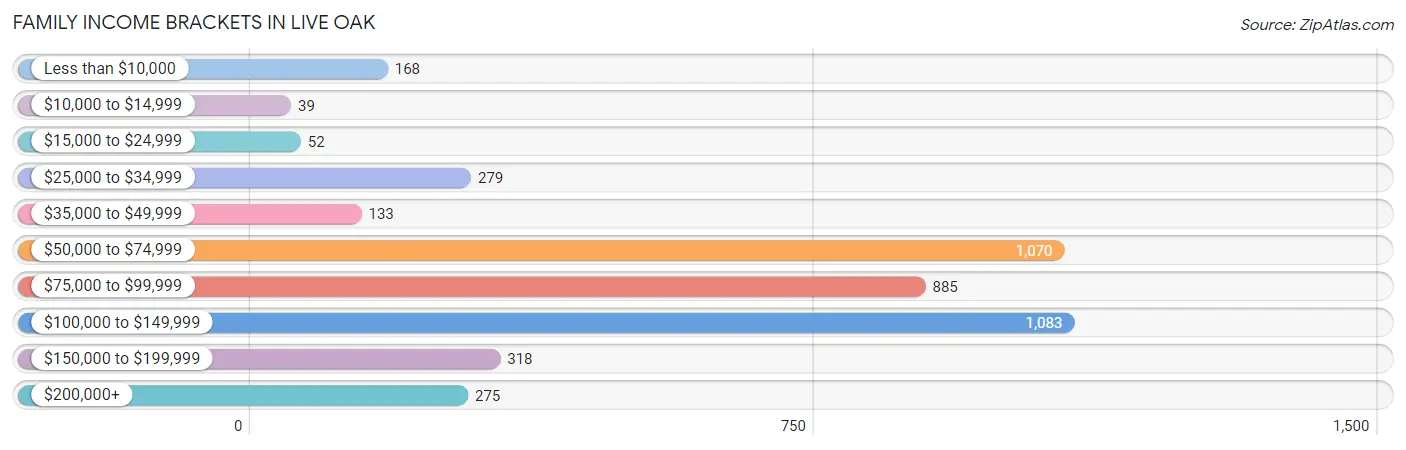
| Income Bracket | # Families | % Families |
| Less than $10,000 | 168 | 3.9% |
| $10,000 to $14,999 | 39 | 0.9% |
| $15,000 to $24,999 | 52 | 1.2% |
| $25,000 to $34,999 | 279 | 6.5% |
| $35,000 to $49,999 | 133 | 3.1% |
| $50,000 to $74,999 | 1,070 | 24.9% |
| $75,000 to $99,999 | 885 | 20.6% |
| $100,000 to $149,999 | 1,083 | 25.2% |
| $150,000 to $199,999 | 318 | 7.4% |
| $200,000+ | 275 | 6.4% |
Family Income by Famaliy Size in Live Oak
5-person families (147 | 3.4%) account for the highest median family income in Live Oak with $136,354 per family, while 2-person families (2,055 | 47.8%) have the highest median income of $37,934 per family member.
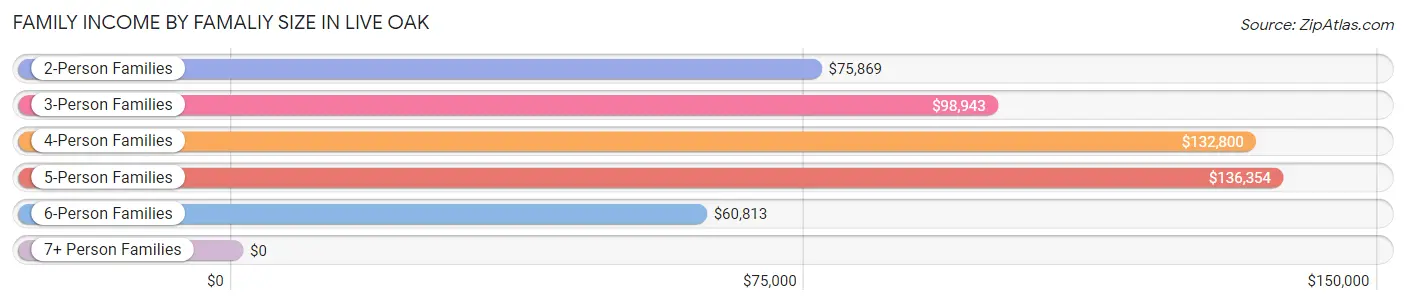
| Income Bracket | # Families | Median Income |
| 2-Person Families | 2,055 (47.8%) | $75,869 |
| 3-Person Families | 1,354 (31.5%) | $98,943 |
| 4-Person Families | 434 (10.1%) | $132,800 |
| 5-Person Families | 147 (3.4%) | $136,354 |
| 6-Person Families | 273 (6.4%) | $60,813 |
| 7+ Person Families | 34 (0.8%) | $0 |
| Total | 4,297 (100.0%) | $85,250 |
Family Income by Number of Earners in Live Oak
The median family income in Live Oak is $85,250, with families comprising 3+ earners (489) having the highest median family income of $126,917, while families with no earners (635) have the lowest median family income of $61,023, accounting for 11.4% and 14.8% of families, respectively.
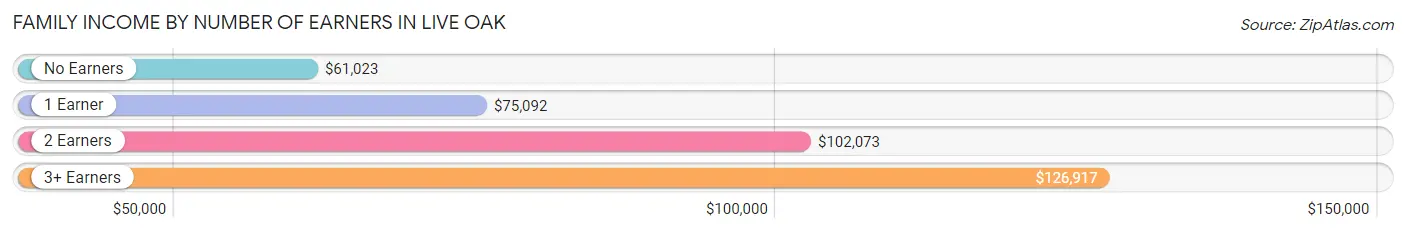
| Number of Earners | # Families | Median Income |
| No Earners | 635 (14.8%) | $61,023 |
| 1 Earner | 1,416 (33.0%) | $75,092 |
| 2 Earners | 1,757 (40.9%) | $102,073 |
| 3+ Earners | 489 (11.4%) | $126,917 |
| Total | 4,297 (100.0%) | $85,250 |
Household Income in Live Oak
Household Income Brackets in Live Oak
With 1,761 households falling in the category, the $50,000 to $74,999 income range is the most frequent in Live Oak, accounting for 27.2% of all households. In contrast, only 71 households (1.1%) fall into the $10,000 to $14,999 income bracket, making it the least populous group.
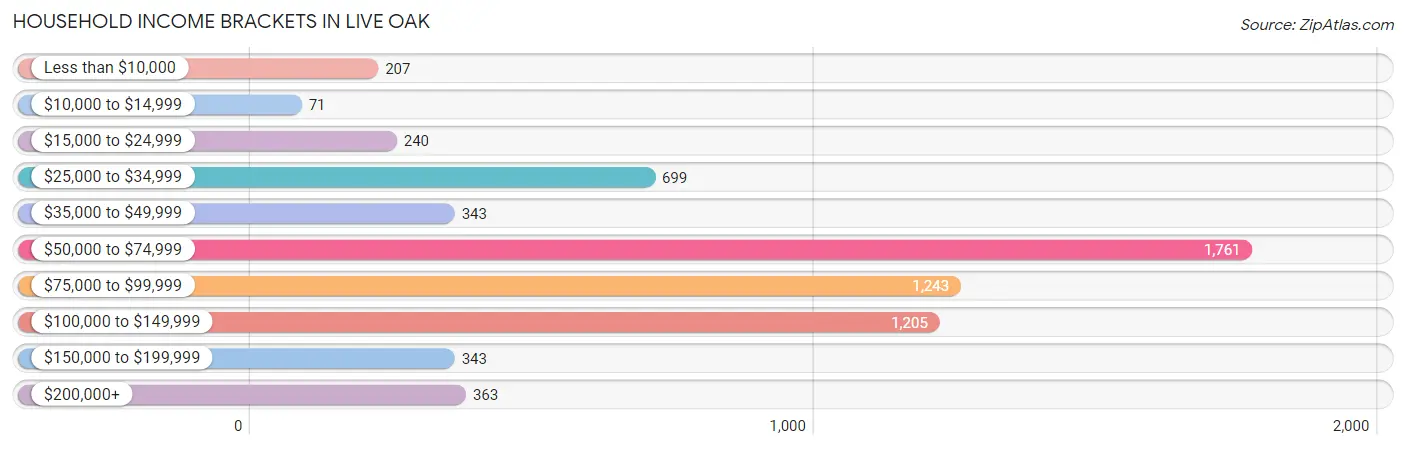
| Income Bracket | # Households | % Households |
| Less than $10,000 | 207 | 3.2% |
| $10,000 to $14,999 | 71 | 1.1% |
| $15,000 to $24,999 | 240 | 3.7% |
| $25,000 to $34,999 | 699 | 10.8% |
| $35,000 to $49,999 | 343 | 5.3% |
| $50,000 to $74,999 | 1,761 | 27.2% |
| $75,000 to $99,999 | 1,243 | 19.2% |
| $100,000 to $149,999 | 1,205 | 18.6% |
| $150,000 to $199,999 | 343 | 5.3% |
| $200,000+ | 363 | 5.6% |
Household Income by Householder Age in Live Oak
The median household income in Live Oak is $74,326, with the highest median household income of $84,694 found in the 45 to 64 years age bracket for the primary householder. A total of 2,155 households (33.3%) fall into this category. Meanwhile, the 15 to 24 years age bracket for the primary householder has the lowest median household income of $29,968, with 349 households (5.4%) in this group.
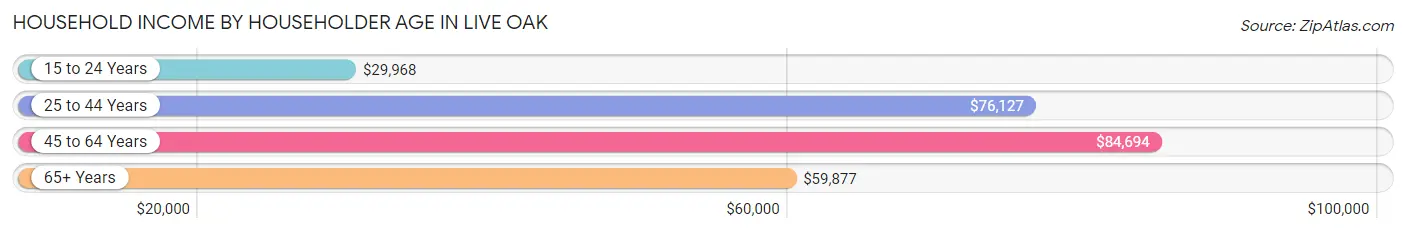
| Income Bracket | # Households | Median Income |
| 15 to 24 Years | 349 (5.4%) | $29,968 |
| 25 to 44 Years | 2,733 (42.2%) | $76,127 |
| 45 to 64 Years | 2,155 (33.3%) | $84,694 |
| 65+ Years | 1,239 (19.1%) | $59,877 |
| Total | 6,476 (100.0%) | $74,326 |
Poverty in Live Oak
Income Below Poverty by Sex and Age in Live Oak
With 9.1% poverty level for males and 9.4% for females among the residents of Live Oak, under 5 year old males and 18 to 24 year old females are the most vulnerable to poverty, with 254 males (44.0%) and 139 females (19.9%) in their respective age groups living below the poverty level.
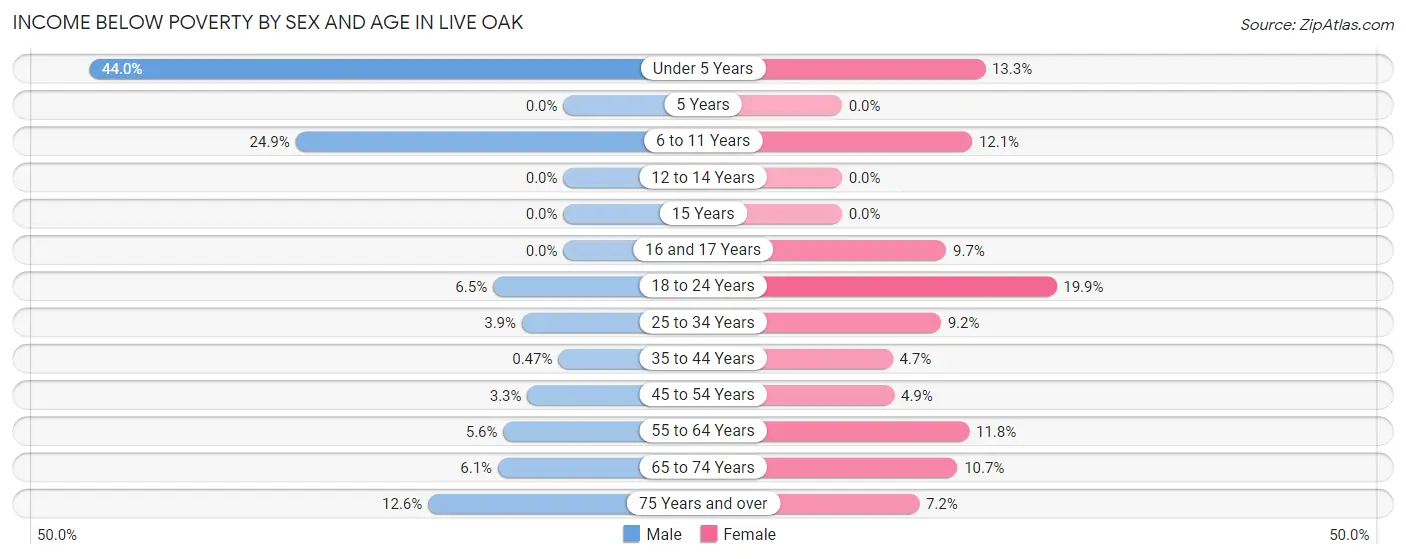
| Age Bracket | Male | Female |
| Under 5 Years | 254 (44.0%) | 114 (13.3%) |
| 5 Years | 0 (0.0%) | 0 (0.0%) |
| 6 to 11 Years | 166 (24.8%) | 57 (12.1%) |
| 12 to 14 Years | 0 (0.0%) | 0 (0.0%) |
| 15 Years | 0 (0.0%) | 0 (0.0%) |
| 16 and 17 Years | 0 (0.0%) | 18 (9.7%) |
| 18 to 24 Years | 59 (6.5%) | 139 (19.9%) |
| 25 to 34 Years | 53 (3.8%) | 133 (9.2%) |
| 35 to 44 Years | 4 (0.5%) | 64 (4.7%) |
| 45 to 54 Years | 30 (3.3%) | 44 (4.9%) |
| 55 to 64 Years | 50 (5.6%) | 112 (11.8%) |
| 65 to 74 Years | 25 (6.1%) | 60 (10.7%) |
| 75 Years and over | 34 (12.6%) | 36 (7.2%) |
| Total | 675 (9.1%) | 777 (9.4%) |
Income Above Poverty by Sex and Age in Live Oak
According to the poverty statistics in Live Oak, males aged 12 to 14 years and females aged 5 years are the age groups that are most secure financially, with 100.0% of males and 100.0% of females in these age groups living above the poverty line.
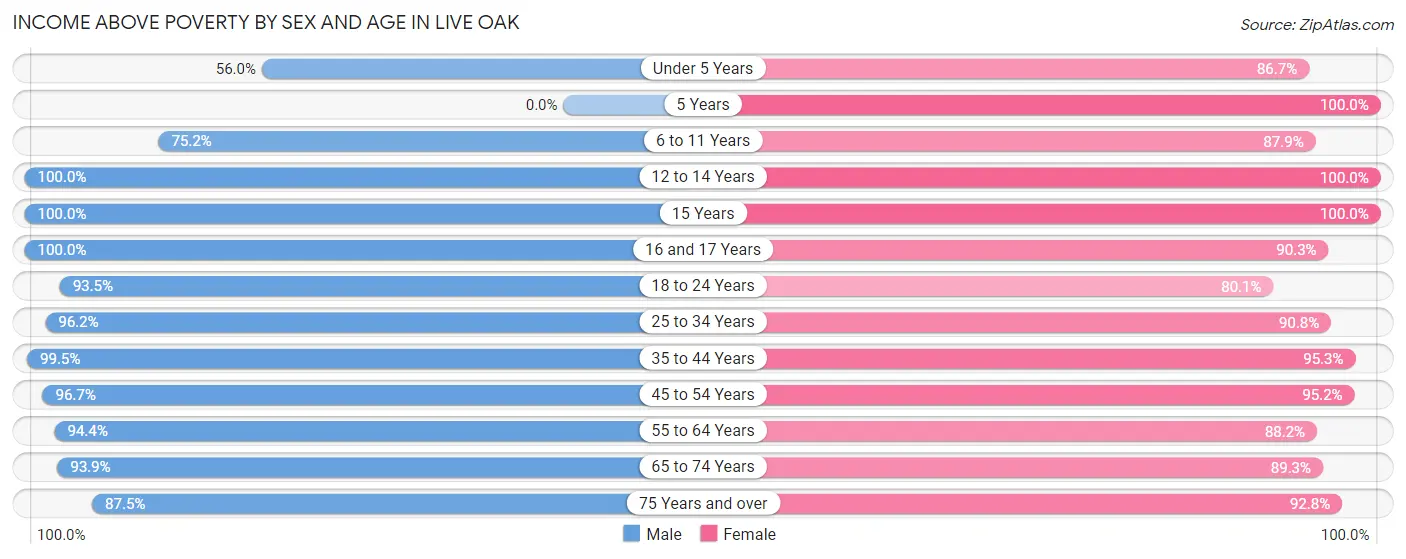
| Age Bracket | Male | Female |
| Under 5 Years | 323 (56.0%) | 744 (86.7%) |
| 5 Years | 0 (0.0%) | 82 (100.0%) |
| 6 to 11 Years | 502 (75.1%) | 415 (87.9%) |
| 12 to 14 Years | 377 (100.0%) | 158 (100.0%) |
| 15 Years | 89 (100.0%) | 60 (100.0%) |
| 16 and 17 Years | 128 (100.0%) | 168 (90.3%) |
| 18 to 24 Years | 844 (93.5%) | 559 (80.1%) |
| 25 to 34 Years | 1,324 (96.2%) | 1,316 (90.8%) |
| 35 to 44 Years | 839 (99.5%) | 1,297 (95.3%) |
| 45 to 54 Years | 867 (96.7%) | 864 (95.2%) |
| 55 to 64 Years | 847 (94.4%) | 836 (88.2%) |
| 65 to 74 Years | 387 (93.9%) | 500 (89.3%) |
| 75 Years and over | 237 (87.5%) | 467 (92.8%) |
| Total | 6,764 (90.9%) | 7,466 (90.6%) |
Income Below Poverty Among Married-Couple Families in Live Oak
The poverty statistics for married-couple families in Live Oak show that 1.6% or 46 of the total 2,885 families live below the poverty line. Families with 1 or 2 children have the highest poverty rate of 1.7%, comprising of 21 families. On the other hand, families with 3 or 4 children have the lowest poverty rate of 0.0%, which includes 0 families.
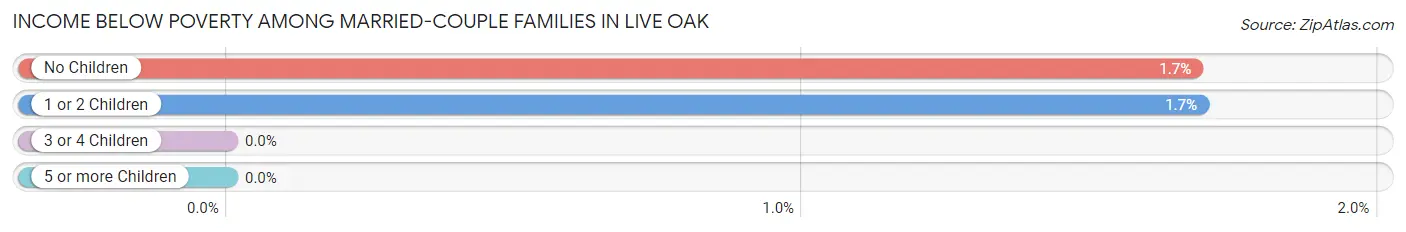
| Children | Above Poverty | Below Poverty |
| No Children | 1,462 (98.3%) | 25 (1.7%) |
| 1 or 2 Children | 1,225 (98.3%) | 21 (1.7%) |
| 3 or 4 Children | 129 (100.0%) | 0 (0.0%) |
| 5 or more Children | 23 (100.0%) | 0 (0.0%) |
| Total | 2,839 (98.4%) | 46 (1.6%) |
Income Below Poverty Among Single-Parent Households in Live Oak
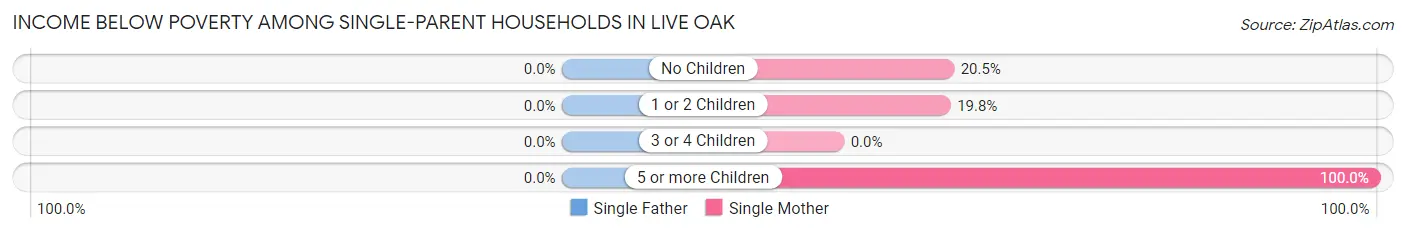
| Children | Single Father | Single Mother |
| No Children | 0 (0.0%) | 42 (20.5%) |
| 1 or 2 Children | 0 (0.0%) | 151 (19.8%) |
| 3 or 4 Children | 0 (0.0%) | 0 (0.0%) |
| 5 or more Children | 0 (0.0%) | 73 (100.0%) |
| Total | 0 (0.0%) | 266 (24.7%) |
Income Below Poverty Among Married-Couple vs Single-Parent Households in Live Oak
The poverty data for Live Oak shows that 46 of the married-couple family households (1.6%) and 266 of the single-parent households (18.8%) are living below the poverty level. Within the married-couple family households, those with 1 or 2 children have the highest poverty rate, with 21 households (1.7%) falling below the poverty line. Among the single-parent households, those with 5 or more children have the highest poverty rate, with 73 household (100.0%) living below poverty.
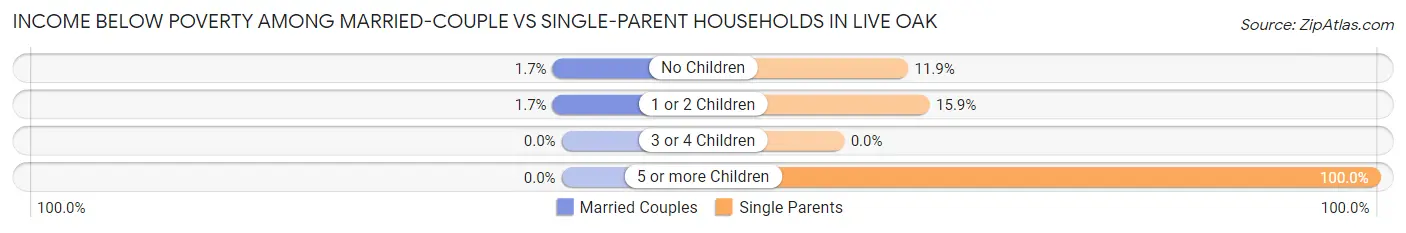
| Children | Married-Couple Families | Single-Parent Households |
| No Children | 25 (1.7%) | 42 (11.9%) |
| 1 or 2 Children | 21 (1.7%) | 151 (15.9%) |
| 3 or 4 Children | 0 (0.0%) | 0 (0.0%) |
| 5 or more Children | 0 (0.0%) | 73 (100.0%) |
| Total | 46 (1.6%) | 266 (18.8%) |
Race in Live Oak
The most populous races in Live Oak are White / Caucasian (7,683 | 48.9%), Hispanic or Latino (6,297 | 40.0%), and Two or more Races (3,540 | 22.5%).
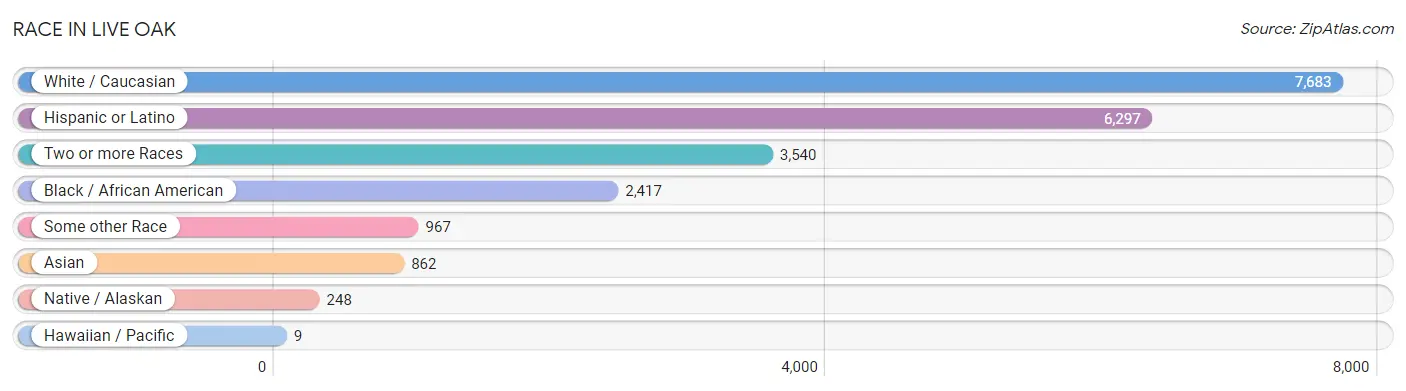
| Race | # Population | % Population |
| Asian | 862 | 5.5% |
| Black / African American | 2,417 | 15.4% |
| Hawaiian / Pacific | 9 | 0.1% |
| Hispanic or Latino | 6,297 | 40.0% |
| Native / Alaskan | 248 | 1.6% |
| White / Caucasian | 7,683 | 48.9% |
| Two or more Races | 3,540 | 22.5% |
| Some other Race | 967 | 6.1% |
| Total | 15,726 | 100.0% |
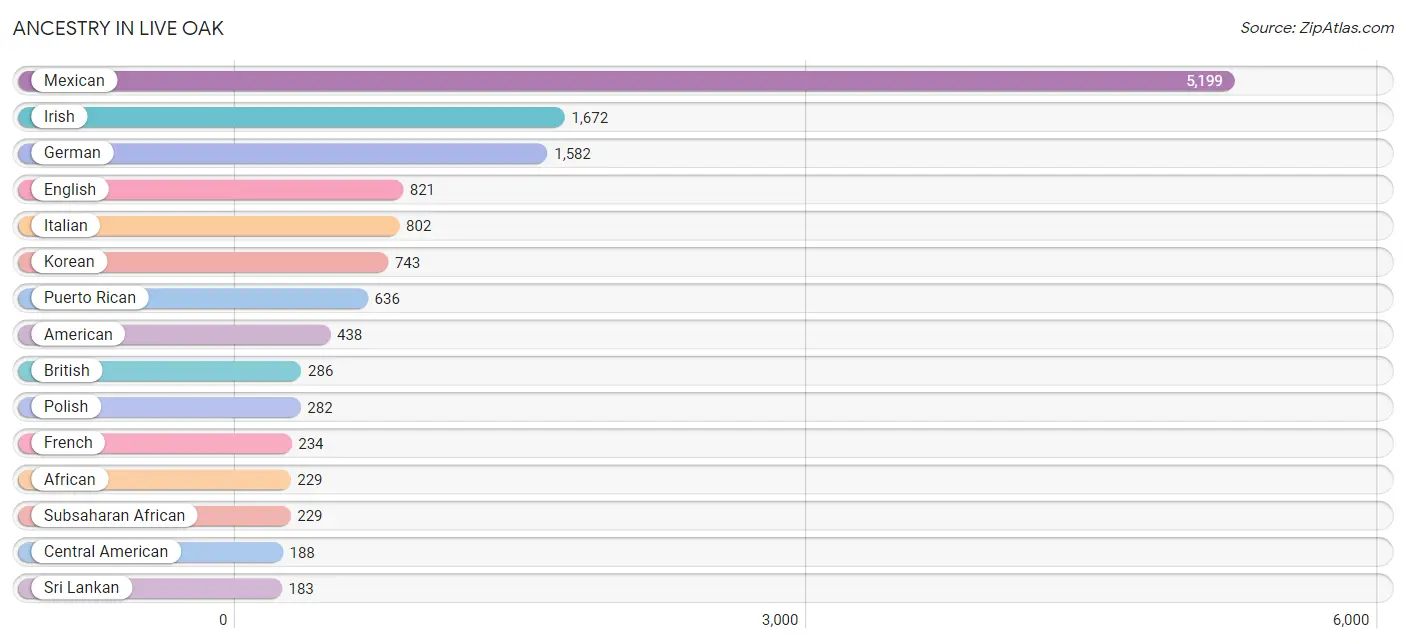
Ancestry in Live Oak
The most populous ancestries reported in Live Oak are Mexican (5,199 | 33.1%), Irish (1,672 | 10.6%), German (1,582 | 10.1%), English (821 | 5.2%), and Italian (802 | 5.1%), together accounting for 64.1% of all Live Oak residents.
| Ancestry | # Population | % Population |
| African | 229 | 1.5% |
| American | 438 | 2.8% |
| Arab | 3 | 0.0% |
| Belgian | 17 | 0.1% |
| Belizean | 11 | 0.1% |
| Bhutanese | 26 | 0.2% |
| Blackfeet | 34 | 0.2% |
| British | 286 | 1.8% |
| Bulgarian | 39 | 0.3% |
| Burmese | 91 | 0.6% |
| Canadian | 24 | 0.2% |
| Central American | 188 | 1.2% |
| Central American Indian | 75 | 0.5% |
| Cherokee | 114 | 0.7% |
| Choctaw | 64 | 0.4% |
| Colombian | 15 | 0.1% |
| Costa Rican | 117 | 0.7% |
| Croatian | 4 | 0.0% |
| Czech | 67 | 0.4% |
| Czechoslovakian | 46 | 0.3% |
| Dutch | 66 | 0.4% |
| Eastern European | 28 | 0.2% |
| English | 821 | 5.2% |
| European | 70 | 0.4% |
| French | 234 | 1.5% |
| French Canadian | 39 | 0.3% |
| German | 1,582 | 10.1% |
| Guamanian / Chamorro | 23 | 0.2% |
| Guatemalan | 14 | 0.1% |
| Haitian | 53 | 0.3% |
| Honduran | 10 | 0.1% |
| Icelander | 10 | 0.1% |
| Indian (Asian) | 27 | 0.2% |
| Irish | 1,672 | 10.6% |
| Italian | 802 | 5.1% |
| Jamaican | 45 | 0.3% |
| Korean | 743 | 4.7% |
| Lebanese | 3 | 0.0% |
| Mexican | 5,199 | 33.1% |
| Mexican American Indian | 121 | 0.8% |
| Native Hawaiian | 9 | 0.1% |
| Navajo | 80 | 0.5% |
| Northern European | 18 | 0.1% |
| Norwegian | 74 | 0.5% |
| Pakistani | 28 | 0.2% |
| Peruvian | 20 | 0.1% |
| Polish | 282 | 1.8% |
| Portuguese | 45 | 0.3% |
| Puerto Rican | 636 | 4.0% |
| Romanian | 17 | 0.1% |
| Russian | 28 | 0.2% |
| Salvadoran | 47 | 0.3% |
| Scotch-Irish | 80 | 0.5% |
| Scottish | 95 | 0.6% |
| Serbian | 16 | 0.1% |
| Slovak | 5 | 0.0% |
| Slovene | 20 | 0.1% |
| South American | 35 | 0.2% |
| Spaniard | 60 | 0.4% |
| Sri Lankan | 183 | 1.2% |
| Subsaharan African | 229 | 1.5% |
| Swedish | 119 | 0.8% |
| Swiss | 37 | 0.2% |
| Thai | 22 | 0.1% |
| Ukrainian | 44 | 0.3% |
| Welsh | 16 | 0.1% |
| West Indian | 21 | 0.1% | View All 67 Rows |
Immigrants in Live Oak
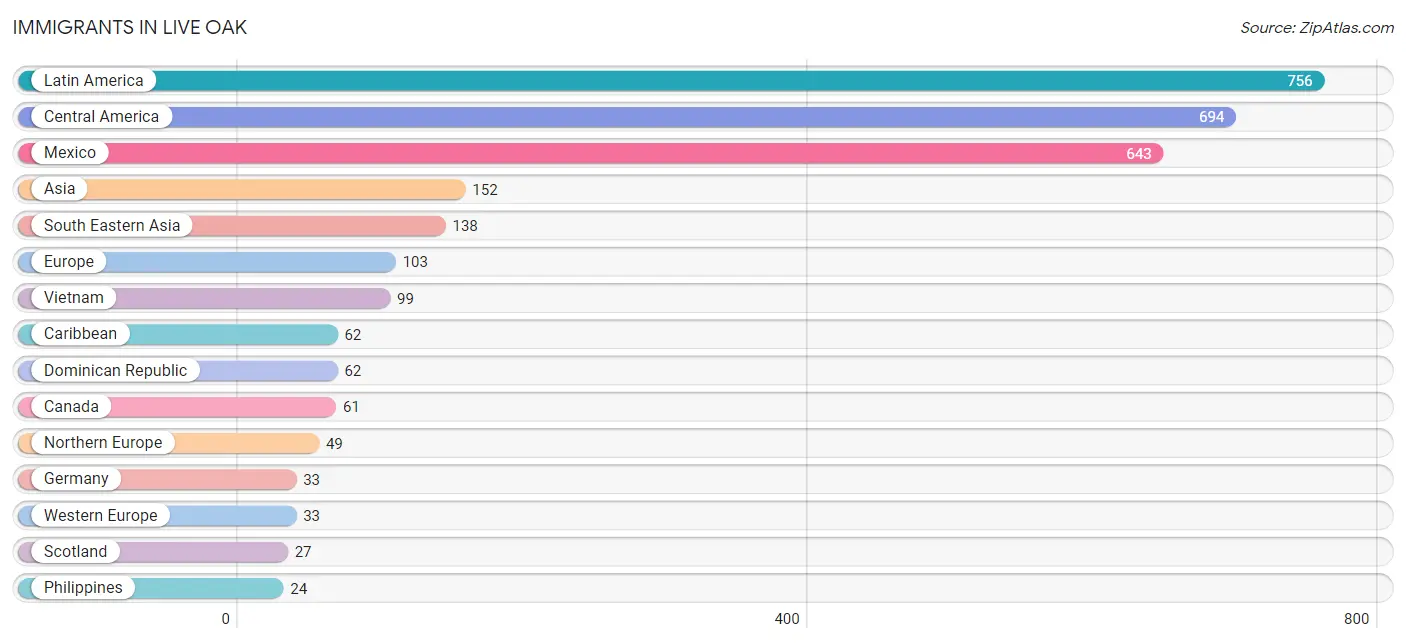
The most numerous immigrant groups reported in Live Oak came from Latin America (756 | 4.8%), Central America (694 | 4.4%), Mexico (643 | 4.1%), Asia (152 | 1.0%), and South Eastern Asia (138 | 0.9%), together accounting for 15.2% of all Live Oak residents.
| Immigration Origin | # Population | % Population |
| Asia | 152 | 1.0% |
| Canada | 61 | 0.4% |
| Caribbean | 62 | 0.4% |
| Central America | 694 | 4.4% |
| China | 7 | 0.0% |
| Dominican Republic | 62 | 0.4% |
| Eastern Asia | 14 | 0.1% |
| Eastern Europe | 16 | 0.1% |
| El Salvador | 22 | 0.1% |
| England | 22 | 0.1% |
| Europe | 103 | 0.6% |
| Germany | 33 | 0.2% |
| Guatemala | 19 | 0.1% |
| Honduras | 10 | 0.1% |
| Italy | 5 | 0.0% |
| Japan | 7 | 0.0% |
| Latin America | 756 | 4.8% |
| Mexico | 643 | 4.1% |
| Northern Europe | 49 | 0.3% |
| Philippines | 24 | 0.2% |
| Russia | 16 | 0.1% |
| Scotland | 27 | 0.2% |
| South Eastern Asia | 138 | 0.9% |
| Southern Europe | 5 | 0.0% |
| Thailand | 15 | 0.1% |
| Vietnam | 99 | 0.6% |
| Western Europe | 33 | 0.2% | View All 27 Rows |
Sex and Age in Live Oak
Sex and Age in Live Oak
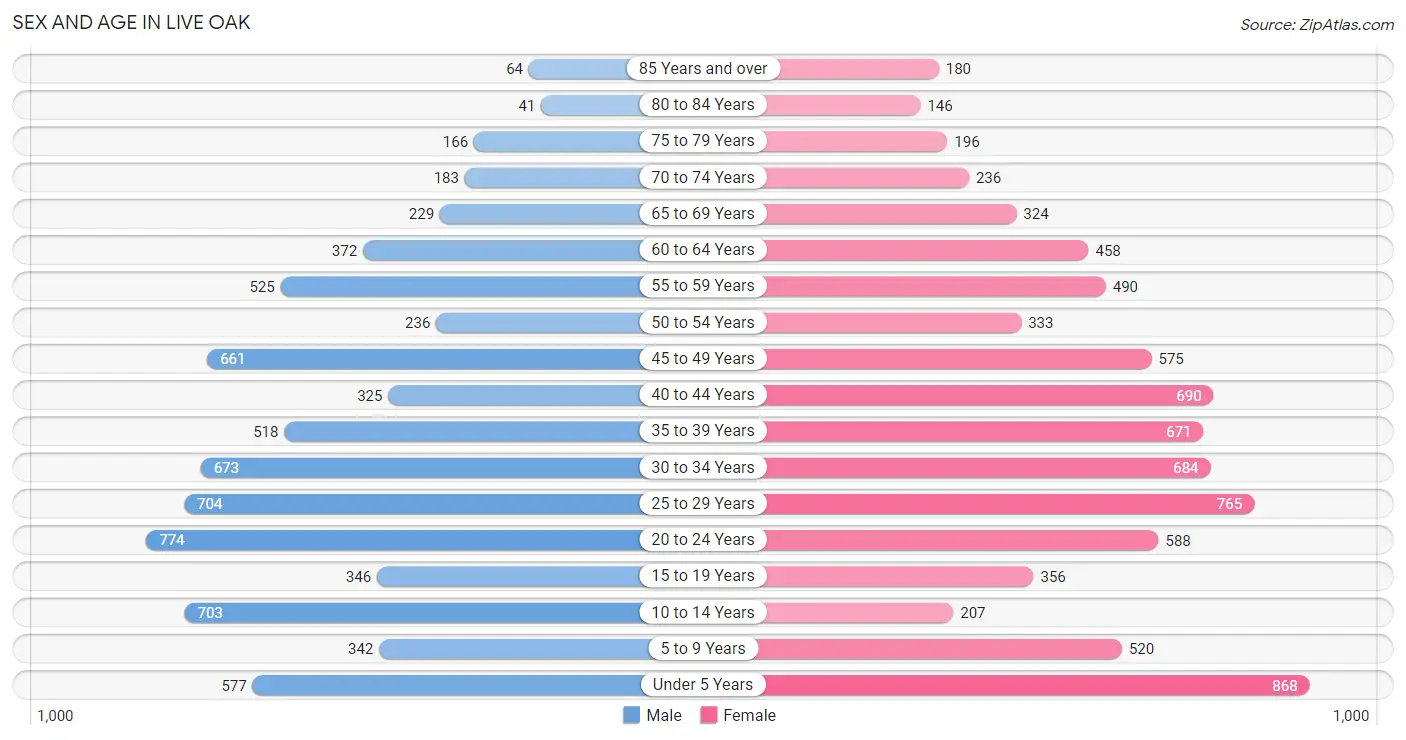
The most populous age groups in Live Oak are 20 to 24 Years (774 | 10.4%) for men and Under 5 Years (868 | 10.5%) for women.
| Age Bracket | Male | Female |
| Under 5 Years | 577 (7.8%) | 868 (10.5%) |
| 5 to 9 Years | 342 (4.6%) | 520 (6.3%) |
| 10 to 14 Years | 703 (9.5%) | 207 (2.5%) |
| 15 to 19 Years | 346 (4.6%) | 356 (4.3%) |
| 20 to 24 Years | 774 (10.4%) | 588 (7.1%) |
| 25 to 29 Years | 704 (9.5%) | 765 (9.2%) |
| 30 to 34 Years | 673 (9.0%) | 684 (8.3%) |
| 35 to 39 Years | 518 (7.0%) | 671 (8.1%) |
| 40 to 44 Years | 325 (4.4%) | 690 (8.3%) |
| 45 to 49 Years | 661 (8.9%) | 575 (6.9%) |
| 50 to 54 Years | 236 (3.2%) | 333 (4.0%) |
| 55 to 59 Years | 525 (7.1%) | 490 (5.9%) |
| 60 to 64 Years | 372 (5.0%) | 458 (5.5%) |
| 65 to 69 Years | 229 (3.1%) | 324 (3.9%) |
| 70 to 74 Years | 183 (2.5%) | 236 (2.9%) |
| 75 to 79 Years | 166 (2.2%) | 196 (2.4%) |
| 80 to 84 Years | 41 (0.5%) | 146 (1.8%) |
| 85 Years and over | 64 (0.9%) | 180 (2.2%) |
| Total | 7,439 (100.0%) | 8,287 (100.0%) |
Families and Households in Live Oak
Median Family Size in Live Oak
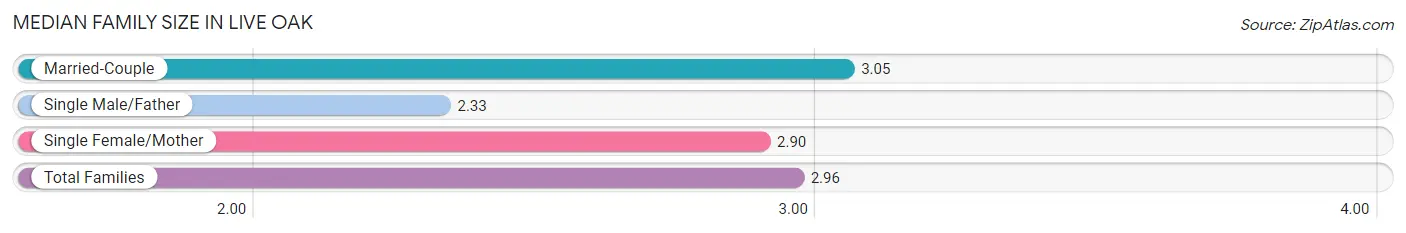
The median family size in Live Oak is 2.96 persons per family, with married-couple families (2,885 | 67.1%) accounting for the largest median family size of 3.05 persons per family. On the other hand, single male/father families (336 | 7.8%) represent the smallest median family size with 2.33 persons per family.
| Family Type | # Families | Family Size |
| Married-Couple | 2,885 (67.1%) | 3.05 |
| Single Male/Father | 336 (7.8%) | 2.33 |
| Single Female/Mother | 1,076 (25.0%) | 2.90 |
| Total Families | 4,297 (100.0%) | 2.96 |
Median Household Size in Live Oak
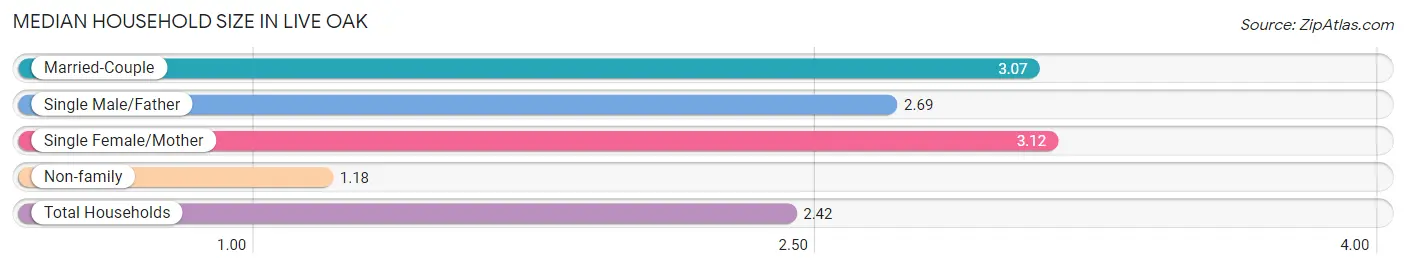
The median household size in Live Oak is 2.42 persons per household, with single female/mother households (1,076 | 16.6%) accounting for the largest median household size of 3.12 persons per household. non-family households (2,179 | 33.7%) represent the smallest median household size with 1.18 persons per household.
| Household Type | # Households | Household Size |
| Married-Couple | 2,885 (44.6%) | 3.07 |
| Single Male/Father | 336 (5.2%) | 2.69 |
| Single Female/Mother | 1,076 (16.6%) | 3.12 |
| Non-family | 2,179 (33.7%) | 1.18 |
| Total Households | 6,476 (100.0%) | 2.42 |
Household Size by Marriage Status in Live Oak
Out of a total of 6,476 households in Live Oak, 4,297 (66.3%) are family households, while 2,179 (33.7%) are nonfamily households. The most numerous type of family households are 2-person households, comprising 1,835, and the most common type of nonfamily households are 1-person households, comprising 1,797.
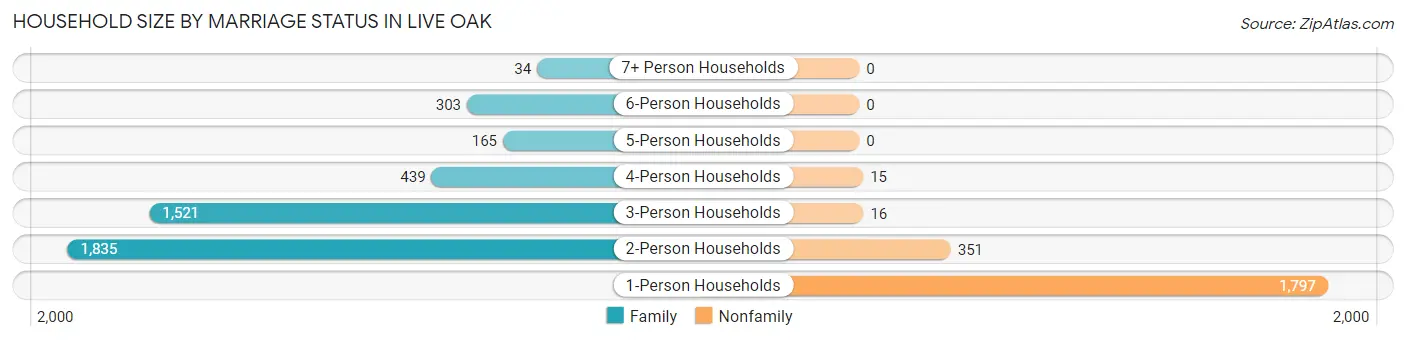
| Household Size | Family Households | Nonfamily Households |
| 1-Person Households | - | 1,797 (27.8%) |
| 2-Person Households | 1,835 (28.3%) | 351 (5.4%) |
| 3-Person Households | 1,521 (23.5%) | 16 (0.3%) |
| 4-Person Households | 439 (6.8%) | 15 (0.2%) |
| 5-Person Households | 165 (2.5%) | 0 (0.0%) |
| 6-Person Households | 303 (4.7%) | 0 (0.0%) |
| 7+ Person Households | 34 (0.5%) | 0 (0.0%) |
| Total | 4,297 (66.3%) | 2,179 (33.7%) |
Female Fertility in Live Oak
Fertility by Age in Live Oak
Average fertility rate in Live Oak is 61.0 births per 1,000 women. Women in the age bracket of 20 to 34 years have the highest fertility rate with 107.0 births per 1,000 women. Women in the age bracket of 20 to 34 years acount for 81.3% of all women with births.
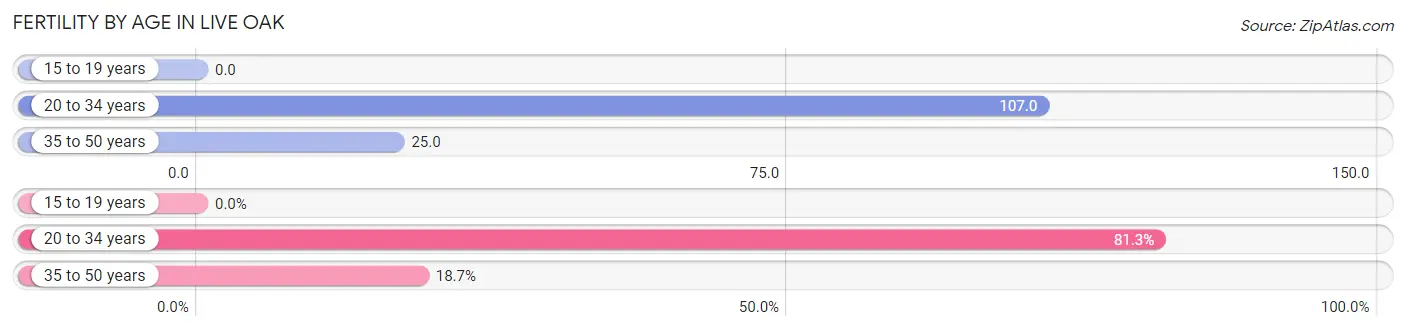
| Age Bracket | Women with Births | Births / 1,000 Women |
| 15 to 19 years | 0 (0.0%) | 0.0 |
| 20 to 34 years | 217 (81.3%) | 107.0 |
| 35 to 50 years | 50 (18.7%) | 25.0 |
| Total | 267 (100.0%) | 61.0 |
Fertility by Age by Marriage Status in Live Oak
56.2% of women with births (267) in Live Oak are married. The highest percentage of unmarried women with births falls into 35 to 50 years age bracket with 44.0% of them unmarried at the time of birth, while the lowest percentage of unmarried women with births belong to 20 to 34 years age bracket with 43.8% of them unmarried.
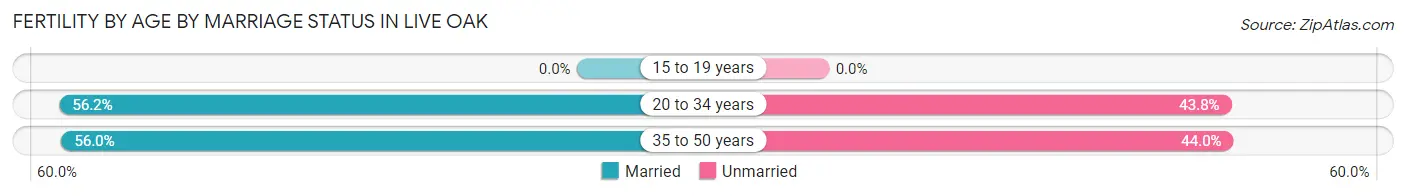
| Age Bracket | Married | Unmarried |
| 15 to 19 years | 0 (0.0%) | 0 (0.0%) |
| 20 to 34 years | 122 (56.2%) | 95 (43.8%) |
| 35 to 50 years | 28 (56.0%) | 22 (44.0%) |
| Total | 150 (56.2%) | 117 (43.8%) |
Fertility by Education in Live Oak
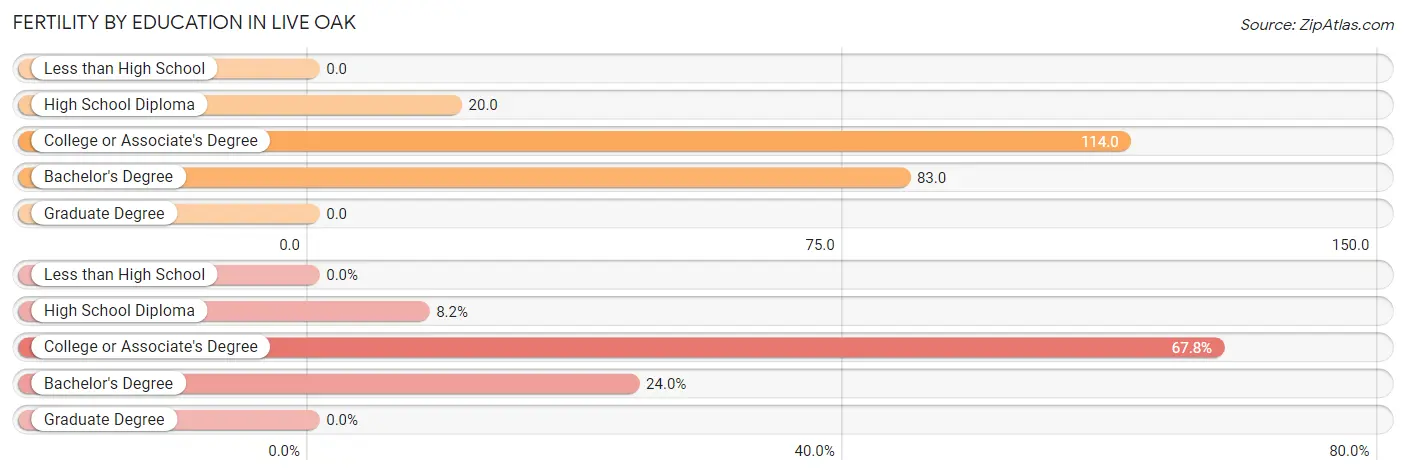
| Educational Attainment | Women with Births | Births / 1,000 Women |
| Less than High School | 0 (0.0%) | 0.0 |
| High School Diploma | 22 (8.2%) | 20.0 |
| College or Associate's Degree | 181 (67.8%) | 114.0 |
| Bachelor's Degree | 64 (24.0%) | 83.0 |
| Graduate Degree | 0 (0.0%) | 0.0 |
| Total | 267 (100.0%) | 61.0 |
Fertility by Education by Marriage Status in Live Oak
43.8% of women with births in Live Oak are unmarried. Women with the educational attainment of high school diploma are most likely to be married with 100.0% of them married at childbirth, while women with the educational attainment of college or associate's degree are least likely to be married with 52.5% of them unmarried at childbirth.
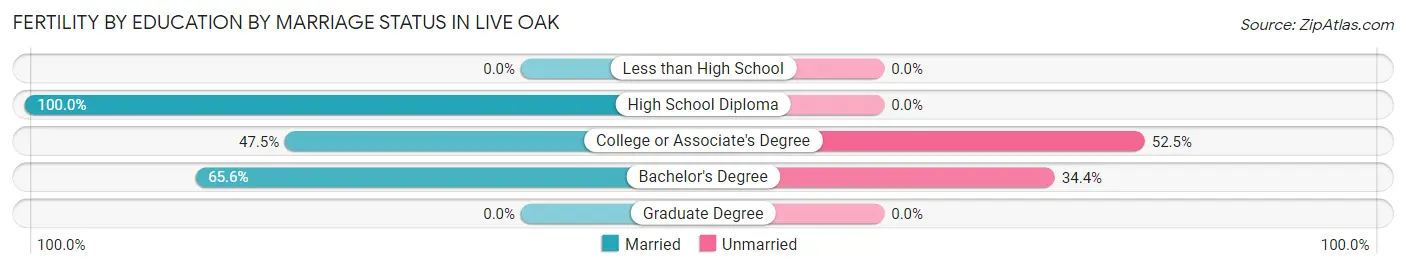
| Educational Attainment | Married | Unmarried |
| Less than High School | 0 (0.0%) | 0 (0.0%) |
| High School Diploma | 22 (100.0%) | 0 (0.0%) |
| College or Associate's Degree | 86 (47.5%) | 95 (52.5%) |
| Bachelor's Degree | 42 (65.6%) | 22 (34.4%) |
| Graduate Degree | 0 (0.0%) | 0 (0.0%) |
| Total | 150 (56.2%) | 117 (43.8%) |
Employment Characteristics in Live Oak
Employment by Class of Employer in Live Oak
Among the 7,976 employed individuals in Live Oak, private company employees (5,545 | 69.5%), federal government employees (667 | 8.4%), and not-for-profit organizations (501 | 6.3%) make up the most common classes of employment.
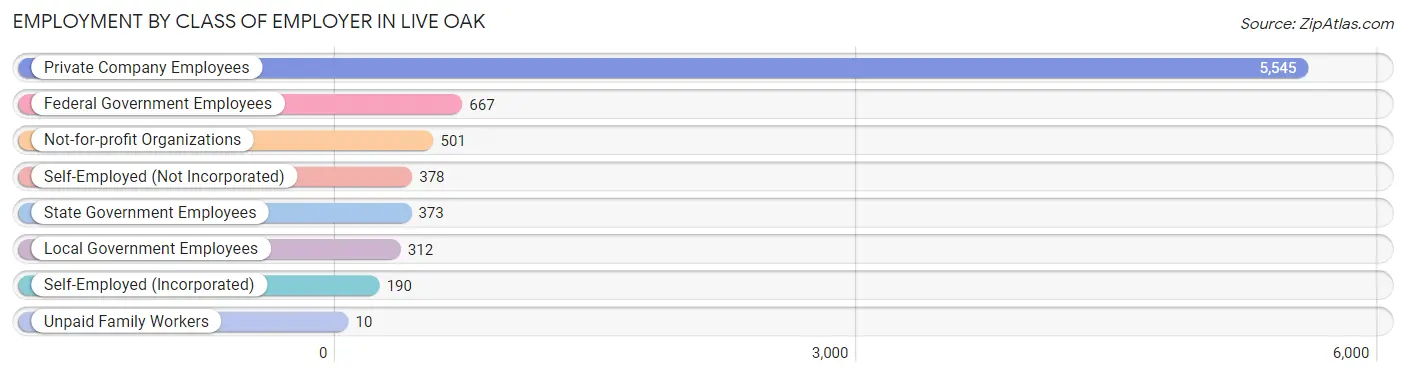
| Employer Class | # Employees | % Employees |
| Private Company Employees | 5,545 | 69.5% |
| Self-Employed (Incorporated) | 190 | 2.4% |
| Self-Employed (Not Incorporated) | 378 | 4.7% |
| Not-for-profit Organizations | 501 | 6.3% |
| Local Government Employees | 312 | 3.9% |
| State Government Employees | 373 | 4.7% |
| Federal Government Employees | 667 | 8.4% |
| Unpaid Family Workers | 10 | 0.1% |
| Total | 7,976 | 100.0% |
Employment Status by Age in Live Oak
According to the labor force statistics for Live Oak, out of the total population over 16 years of age (12,360), 69.7% or 8,615 individuals are in the labor force, with 5.5% or 474 of them unemployed. The age group with the highest labor force participation rate is 30 to 34 years, with 87.9% or 1,193 individuals in the labor force. Within the labor force, the 65 to 74 years age range has the highest percentage of unemployed individuals, with 23.4% or 50 of them being unemployed.
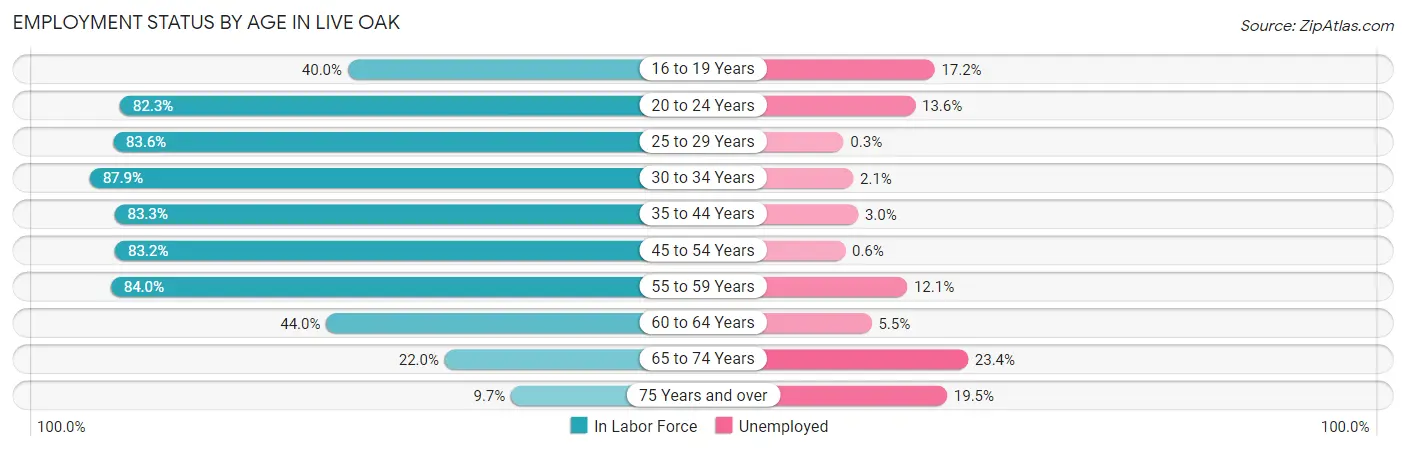
| Age Bracket | In Labor Force | Unemployed |
| 16 to 19 Years | 221 (40.0%) | 38 (17.2%) |
| 20 to 24 Years | 1,121 (82.3%) | 152 (13.6%) |
| 25 to 29 Years | 1,228 (83.6%) | 4 (0.3%) |
| 30 to 34 Years | 1,193 (87.9%) | 25 (2.1%) |
| 35 to 44 Years | 1,836 (83.3%) | 55 (3.0%) |
| 45 to 54 Years | 1,502 (83.2%) | 9 (0.6%) |
| 55 to 59 Years | 853 (84.0%) | 103 (12.1%) |
| 60 to 64 Years | 365 (44.0%) | 20 (5.5%) |
| 65 to 74 Years | 214 (22.0%) | 50 (23.4%) |
| 75 Years and over | 77 (9.7%) | 15 (19.5%) |
| Total | 8,615 (69.7%) | 474 (5.5%) |
Employment Status by Educational Attainment in Live Oak
According to labor force statistics for Live Oak, 80.4% of individuals (6,979) out of the total population between 25 and 64 years of age (8,680) are in the labor force, with 3.1% or 216 of them being unemployed. The group with the highest labor force participation rate are those with the educational attainment of bachelor's degree or higher, with 84.8% or 2,405 individuals in the labor force. Within the labor force, individuals with college / associate degree education have the highest percentage of unemployment, with 6.5% or 158 of them being unemployed.
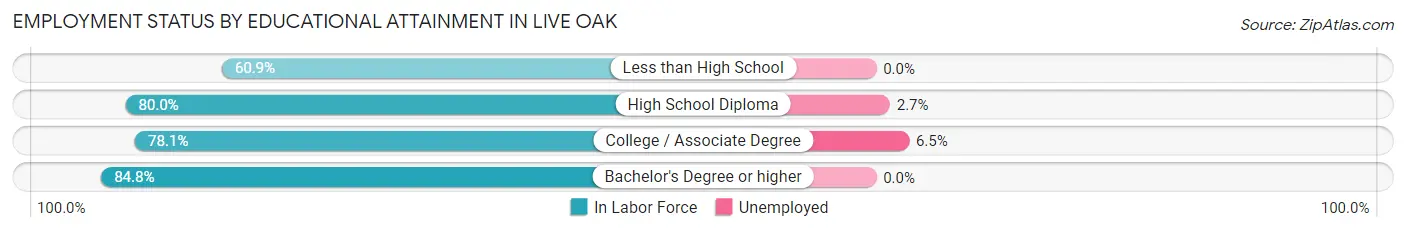
| Educational Attainment | In Labor Force | Unemployed |
| Less than High School | 140 (60.9%) | 0 (0.0%) |
| High School Diploma | 2,004 (80.0%) | 68 (2.7%) |
| College / Associate Degree | 2,428 (78.1%) | 202 (6.5%) |
| Bachelor's Degree or higher | 2,405 (84.8%) | 0 (0.0%) |
| Total | 6,979 (80.4%) | 269 (3.1%) |
Employment Occupations by Sex in Live Oak
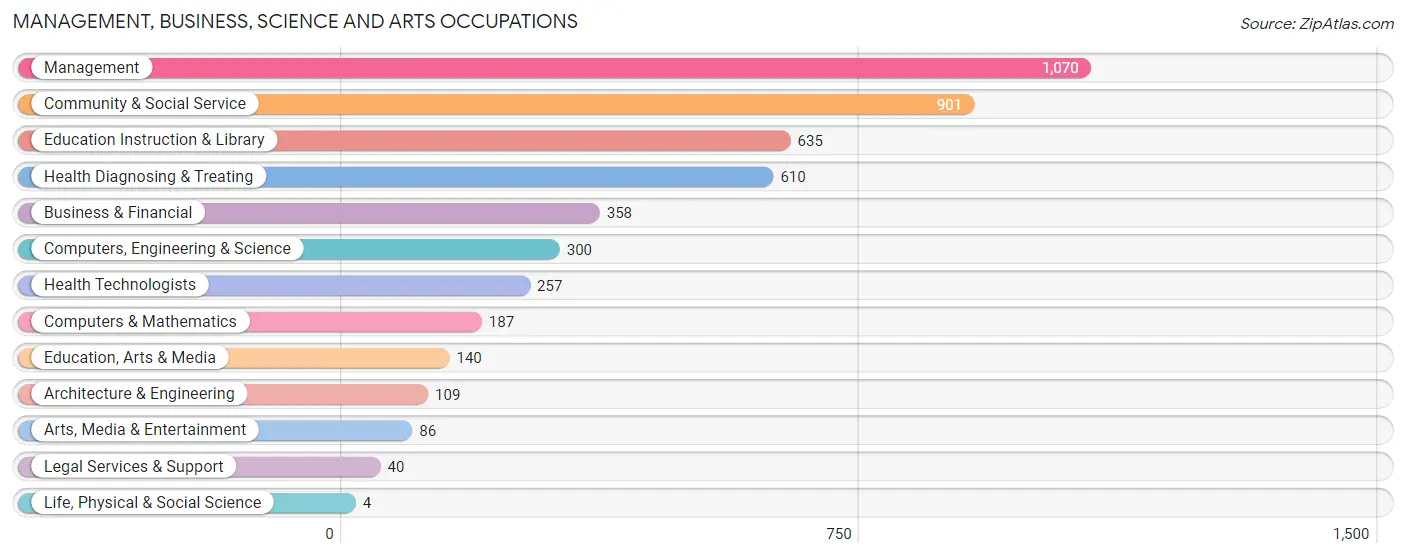
Management, Business, Science and Arts Occupations
The most common Management, Business, Science and Arts occupations in Live Oak are Management (1,070 | 13.4%), Community & Social Service (901 | 11.3%), Education Instruction & Library (635 | 8.0%), Health Diagnosing & Treating (610 | 7.6%), and Business & Financial (358 | 4.5%).
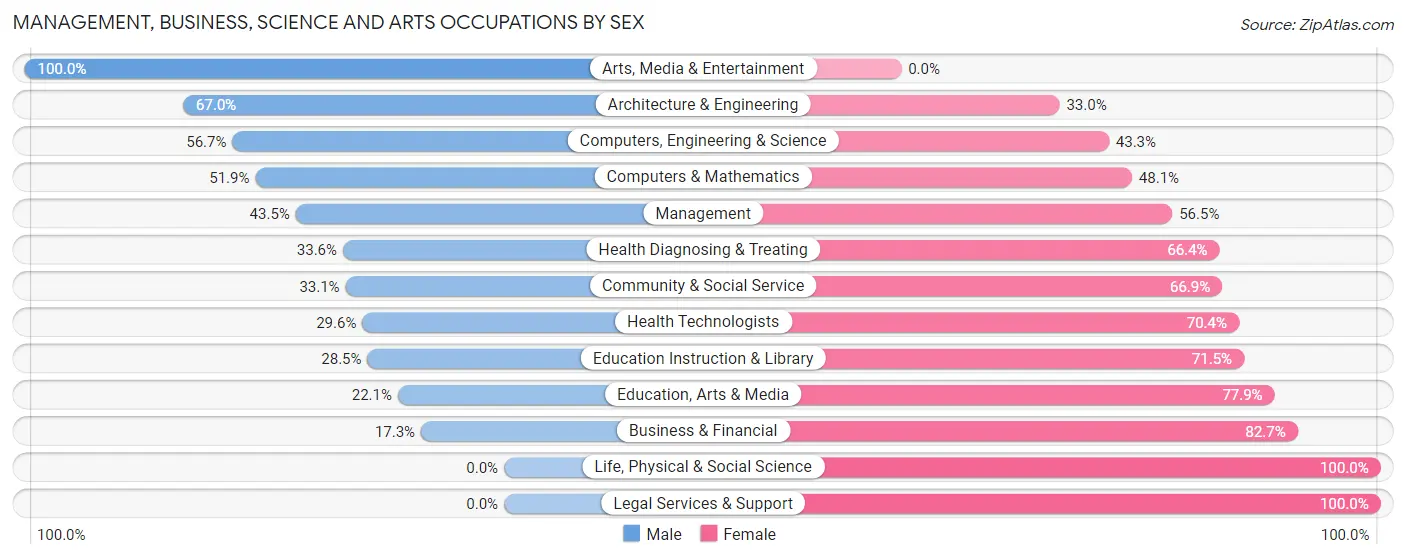
Management, Business, Science and Arts Occupations by Sex
Within the Management, Business, Science and Arts occupations in Live Oak, the most male-oriented occupations are Arts, Media & Entertainment (100.0%), Architecture & Engineering (67.0%), and Computers, Engineering & Science (56.7%), while the most female-oriented occupations are Life, Physical & Social Science (100.0%), Legal Services & Support (100.0%), and Business & Financial (82.7%).
| Occupation | Male | Female |
| Management | 465 (43.5%) | 605 (56.5%) |
| Business & Financial | 62 (17.3%) | 296 (82.7%) |
| Computers, Engineering & Science | 170 (56.7%) | 130 (43.3%) |
| Computers & Mathematics | 97 (51.9%) | 90 (48.1%) |
| Architecture & Engineering | 73 (67.0%) | 36 (33.0%) |
| Life, Physical & Social Science | 0 (0.0%) | 4 (100.0%) |
| Community & Social Service | 298 (33.1%) | 603 (66.9%) |
| Education, Arts & Media | 31 (22.1%) | 109 (77.9%) |
| Legal Services & Support | 0 (0.0%) | 40 (100.0%) |
| Education Instruction & Library | 181 (28.5%) | 454 (71.5%) |
| Arts, Media & Entertainment | 86 (100.0%) | 0 (0.0%) |
| Health Diagnosing & Treating | 205 (33.6%) | 405 (66.4%) |
| Health Technologists | 76 (29.6%) | 181 (70.4%) |
| Total (Category) | 1,200 (37.0%) | 2,039 (62.9%) |
| Total (Overall) | 3,988 (50.0%) | 3,992 (50.0%) |
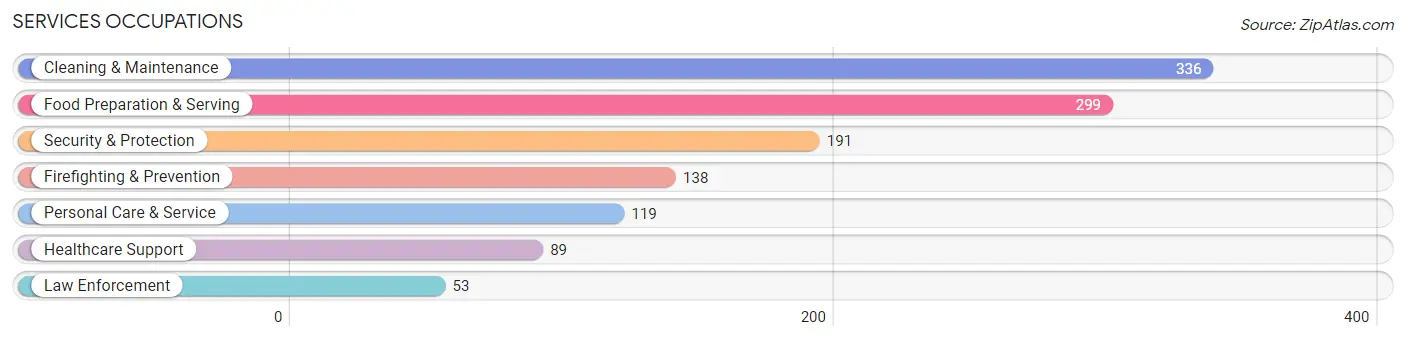
Services Occupations
The most common Services occupations in Live Oak are Cleaning & Maintenance (336 | 4.2%), Food Preparation & Serving (299 | 3.7%), Security & Protection (191 | 2.4%), Firefighting & Prevention (138 | 1.7%), and Personal Care & Service (119 | 1.5%).
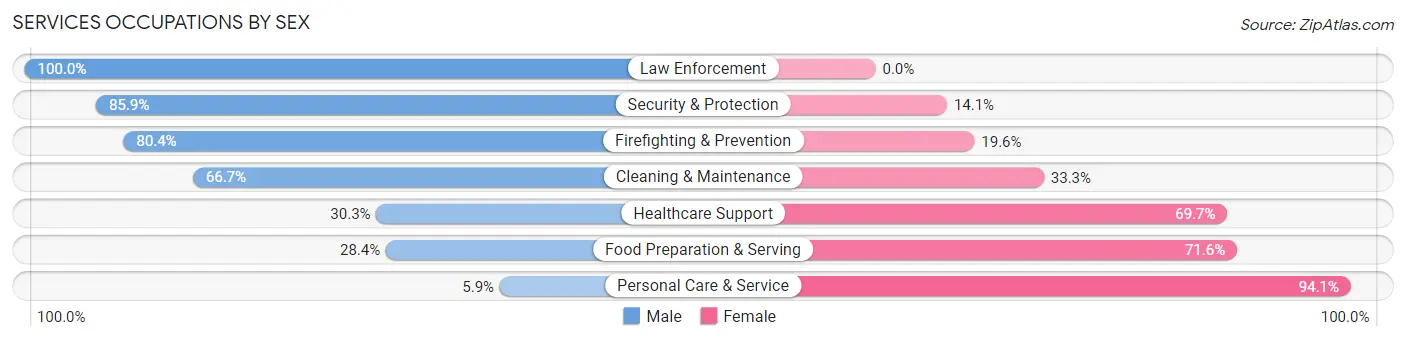
Services Occupations by Sex
Within the Services occupations in Live Oak, the most male-oriented occupations are Law Enforcement (100.0%), Security & Protection (85.9%), and Firefighting & Prevention (80.4%), while the most female-oriented occupations are Personal Care & Service (94.1%), Food Preparation & Serving (71.6%), and Healthcare Support (69.7%).
| Occupation | Male | Female |
| Healthcare Support | 27 (30.3%) | 62 (69.7%) |
| Security & Protection | 164 (85.9%) | 27 (14.1%) |
| Firefighting & Prevention | 111 (80.4%) | 27 (19.6%) |
| Law Enforcement | 53 (100.0%) | 0 (0.0%) |
| Food Preparation & Serving | 85 (28.4%) | 214 (71.6%) |
| Cleaning & Maintenance | 224 (66.7%) | 112 (33.3%) |
| Personal Care & Service | 7 (5.9%) | 112 (94.1%) |
| Total (Category) | 507 (49.0%) | 527 (51.0%) |
| Total (Overall) | 3,988 (50.0%) | 3,992 (50.0%) |
Sales and Office Occupations
The most common Sales and Office occupations in Live Oak are Office & Administration (1,346 | 16.9%), and Sales & Related (876 | 11.0%).

Sales and Office Occupations by Sex
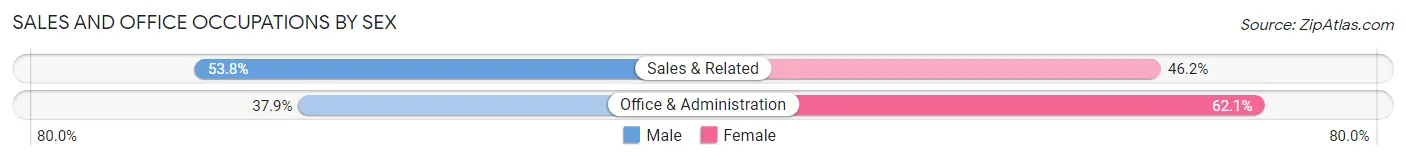
| Occupation | Male | Female |
| Sales & Related | 471 (53.8%) | 405 (46.2%) |
| Office & Administration | 510 (37.9%) | 836 (62.1%) |
| Total (Category) | 981 (44.2%) | 1,241 (55.8%) |
| Total (Overall) | 3,988 (50.0%) | 3,992 (50.0%) |
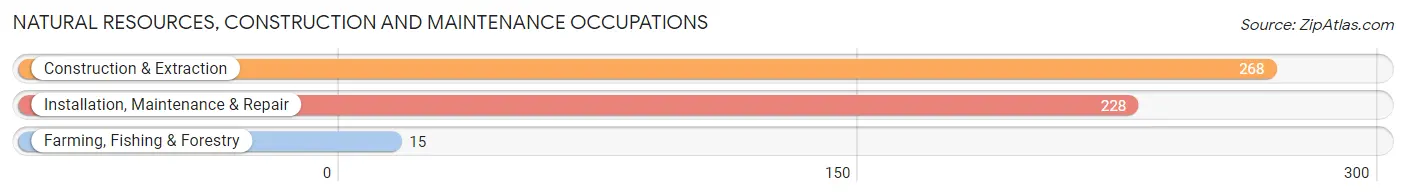
Natural Resources, Construction and Maintenance Occupations
The most common Natural Resources, Construction and Maintenance occupations in Live Oak are Construction & Extraction (268 | 3.4%), Installation, Maintenance & Repair (228 | 2.9%), and Farming, Fishing & Forestry (15 | 0.2%).
Natural Resources, Construction and Maintenance Occupations by Sex
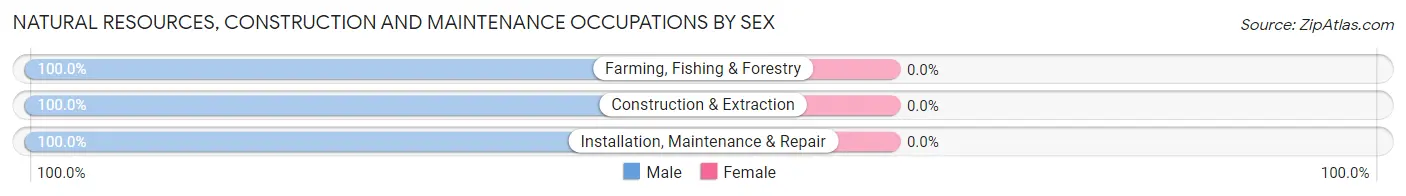
| Occupation | Male | Female |
| Farming, Fishing & Forestry | 15 (100.0%) | 0 (0.0%) |
| Construction & Extraction | 268 (100.0%) | 0 (0.0%) |
| Installation, Maintenance & Repair | 228 (100.0%) | 0 (0.0%) |
| Total (Category) | 511 (100.0%) | 0 (0.0%) |
| Total (Overall) | 3,988 (50.0%) | 3,992 (50.0%) |
Production, Transportation and Moving Occupations
The most common Production, Transportation and Moving occupations in Live Oak are Transportation (400 | 5.0%), Material Moving (313 | 3.9%), and Production (261 | 3.3%).
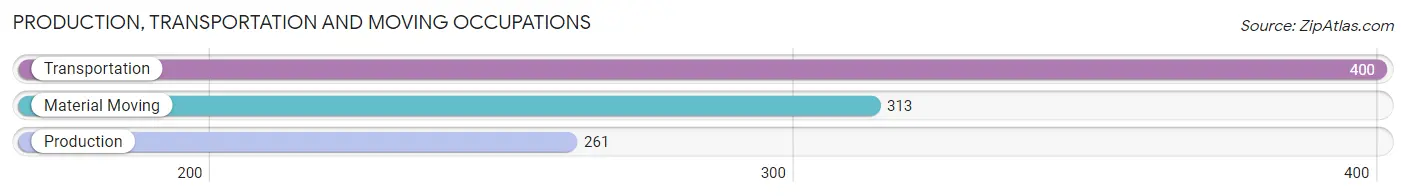
Production, Transportation and Moving Occupations by Sex
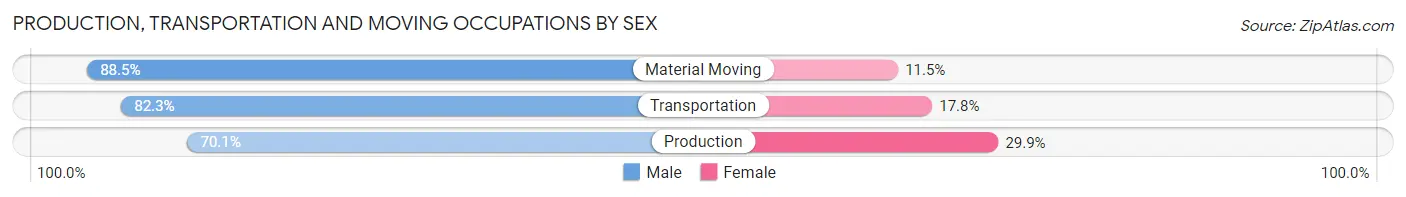
| Occupation | Male | Female |
| Production | 183 (70.1%) | 78 (29.9%) |
| Transportation | 329 (82.3%) | 71 (17.7%) |
| Material Moving | 277 (88.5%) | 36 (11.5%) |
| Total (Category) | 789 (81.0%) | 185 (19.0%) |
| Total (Overall) | 3,988 (50.0%) | 3,992 (50.0%) |
Employment Industries by Sex in Live Oak
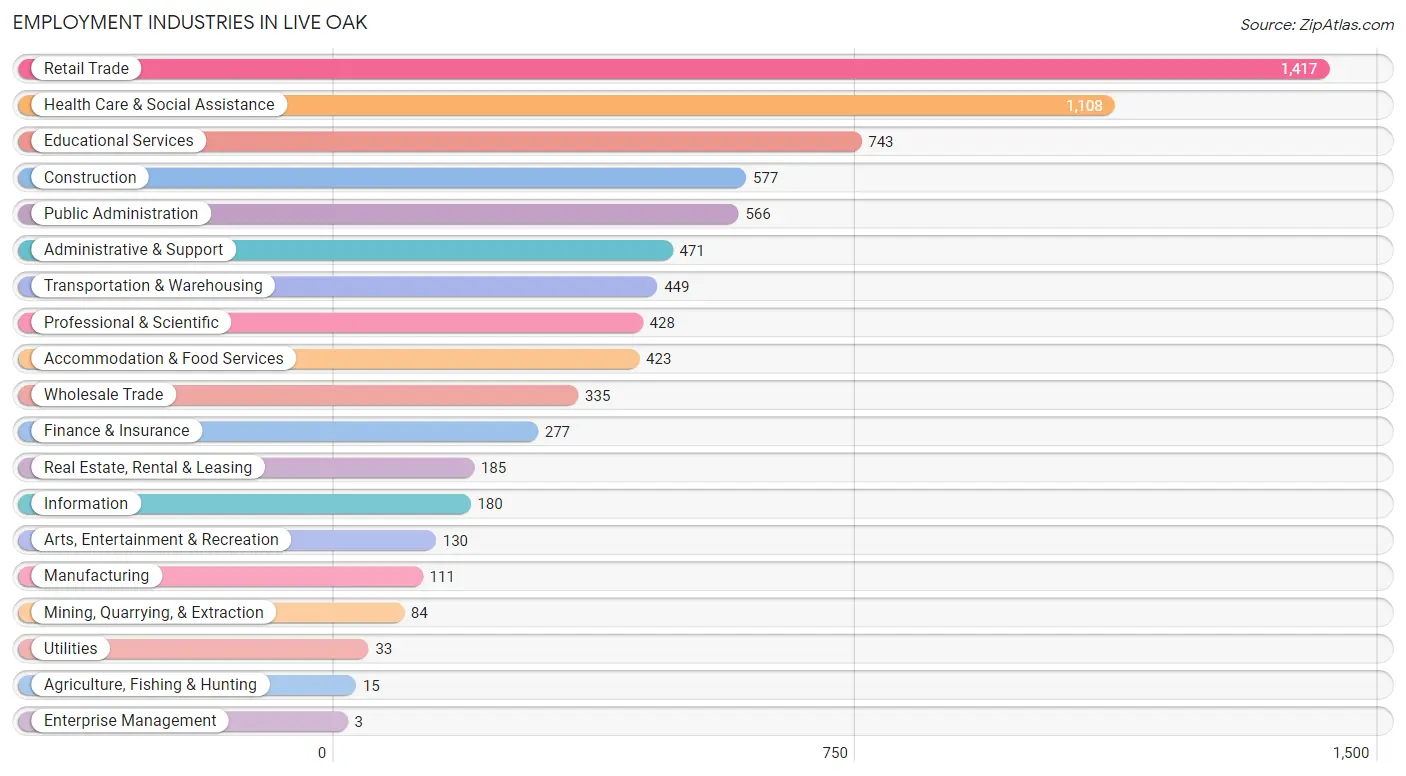
Employment Industries in Live Oak
The major employment industries in Live Oak include Retail Trade (1,417 | 17.8%), Health Care & Social Assistance (1,108 | 13.9%), Educational Services (743 | 9.3%), Construction (577 | 7.2%), and Public Administration (566 | 7.1%).
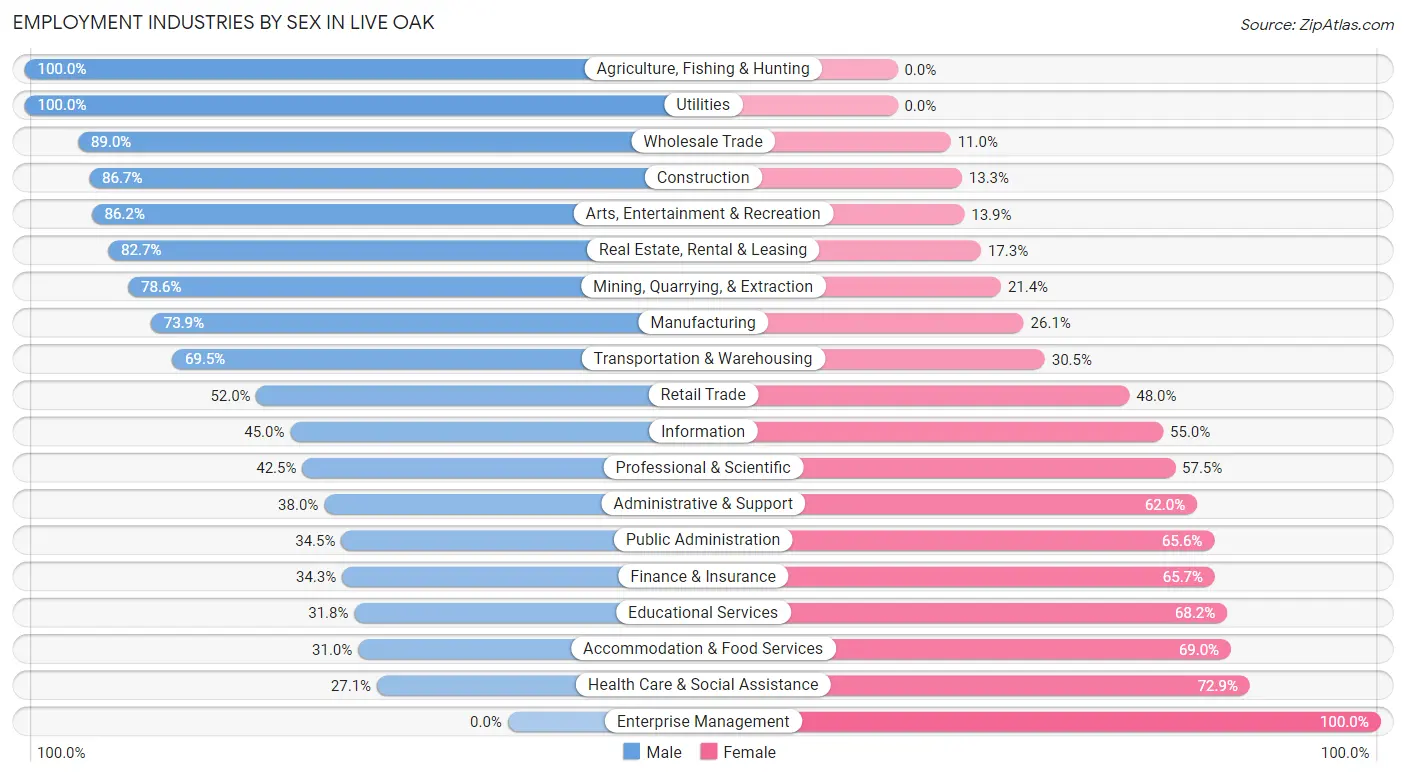
Employment Industries by Sex in Live Oak
The Live Oak industries that see more men than women are Agriculture, Fishing & Hunting (100.0%), Utilities (100.0%), and Wholesale Trade (89.0%), whereas the industries that tend to have a higher number of women are Enterprise Management (100.0%), Health Care & Social Assistance (72.9%), and Accommodation & Food Services (69.0%).
| Industry | Male | Female |
| Agriculture, Fishing & Hunting | 15 (100.0%) | 0 (0.0%) |
| Mining, Quarrying, & Extraction | 66 (78.6%) | 18 (21.4%) |
| Construction | 500 (86.7%) | 77 (13.3%) |
| Manufacturing | 82 (73.9%) | 29 (26.1%) |
| Wholesale Trade | 298 (89.0%) | 37 (11.0%) |
| Retail Trade | 737 (52.0%) | 680 (48.0%) |
| Transportation & Warehousing | 312 (69.5%) | 137 (30.5%) |
| Utilities | 33 (100.0%) | 0 (0.0%) |
| Information | 81 (45.0%) | 99 (55.0%) |
| Finance & Insurance | 95 (34.3%) | 182 (65.7%) |
| Real Estate, Rental & Leasing | 153 (82.7%) | 32 (17.3%) |
| Professional & Scientific | 182 (42.5%) | 246 (57.5%) |
| Enterprise Management | 0 (0.0%) | 3 (100.0%) |
| Administrative & Support | 179 (38.0%) | 292 (62.0%) |
| Educational Services | 236 (31.8%) | 507 (68.2%) |
| Health Care & Social Assistance | 300 (27.1%) | 808 (72.9%) |
| Arts, Entertainment & Recreation | 112 (86.2%) | 18 (13.9%) |
| Accommodation & Food Services | 131 (31.0%) | 292 (69.0%) |
| Public Administration | 195 (34.4%) | 371 (65.5%) |
| Total | 3,988 (50.0%) | 3,992 (50.0%) |
Education in Live Oak
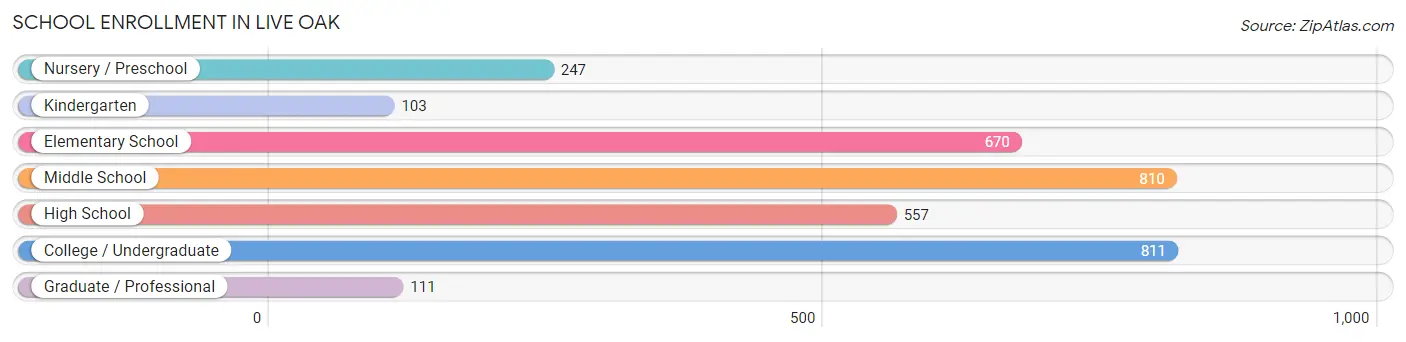
School Enrollment in Live Oak
The most common levels of schooling among the 3,309 students in Live Oak are college / undergraduate (811 | 24.5%), middle school (810 | 24.5%), and elementary school (670 | 20.3%).
| School Level | # Students | % Students |
| Nursery / Preschool | 247 | 7.5% |
| Kindergarten | 103 | 3.1% |
| Elementary School | 670 | 20.3% |
| Middle School | 810 | 24.5% |
| High School | 557 | 16.8% |
| College / Undergraduate | 811 | 24.5% |
| Graduate / Professional | 111 | 3.4% |
| Total | 3,309 | 100.0% |
School Enrollment by Age by Funding Source in Live Oak
Out of a total of 3,309 students who are enrolled in schools in Live Oak, 665 (20.1%) attend a private institution, while the remaining 2,644 (79.9%) are enrolled in public schools. The age group of 3 to 4 year olds has the highest likelihood of being enrolled in private schools, with 64 (31.8% in the age bracket) enrolled. Conversely, the age group of 18 to 19 year olds has the lowest likelihood of being enrolled in a private school, with 101 (100.0% in the age bracket) attending a public institution.
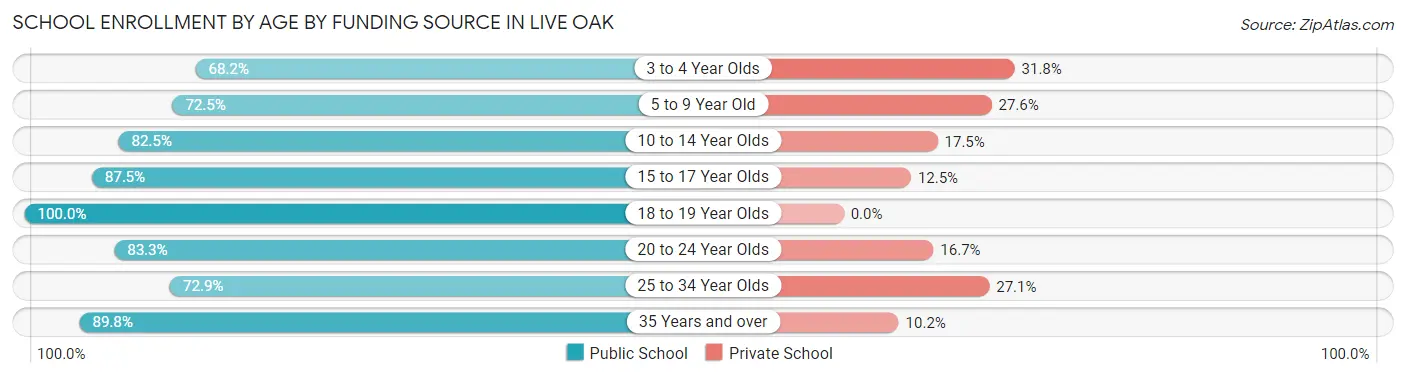
| Age Bracket | Public School | Private School |
| 3 to 4 Year Olds | 137 (68.2%) | 64 (31.8%) |
| 5 to 9 Year Old | 560 (72.5%) | 213 (27.6%) |
| 10 to 14 Year Olds | 726 (82.5%) | 154 (17.5%) |
| 15 to 17 Year Olds | 405 (87.5%) | 58 (12.5%) |
| 18 to 19 Year Olds | 101 (100.0%) | 0 (0.0%) |
| 20 to 24 Year Olds | 309 (83.3%) | 62 (16.7%) |
| 25 to 34 Year Olds | 258 (72.9%) | 96 (27.1%) |
| 35 Years and over | 149 (89.8%) | 17 (10.2%) |
| Total | 2,644 (79.9%) | 665 (20.1%) |
Educational Attainment by Field of Study in Live Oak
Business (791 | 23.1%), education (361 | 10.5%), bio, nature & agricultural (342 | 10.0%), arts & humanities (276 | 8.1%), and liberal arts & history (275 | 8.0%) are the most common fields of study among 3,426 individuals in Live Oak who have obtained a bachelor's degree or higher.
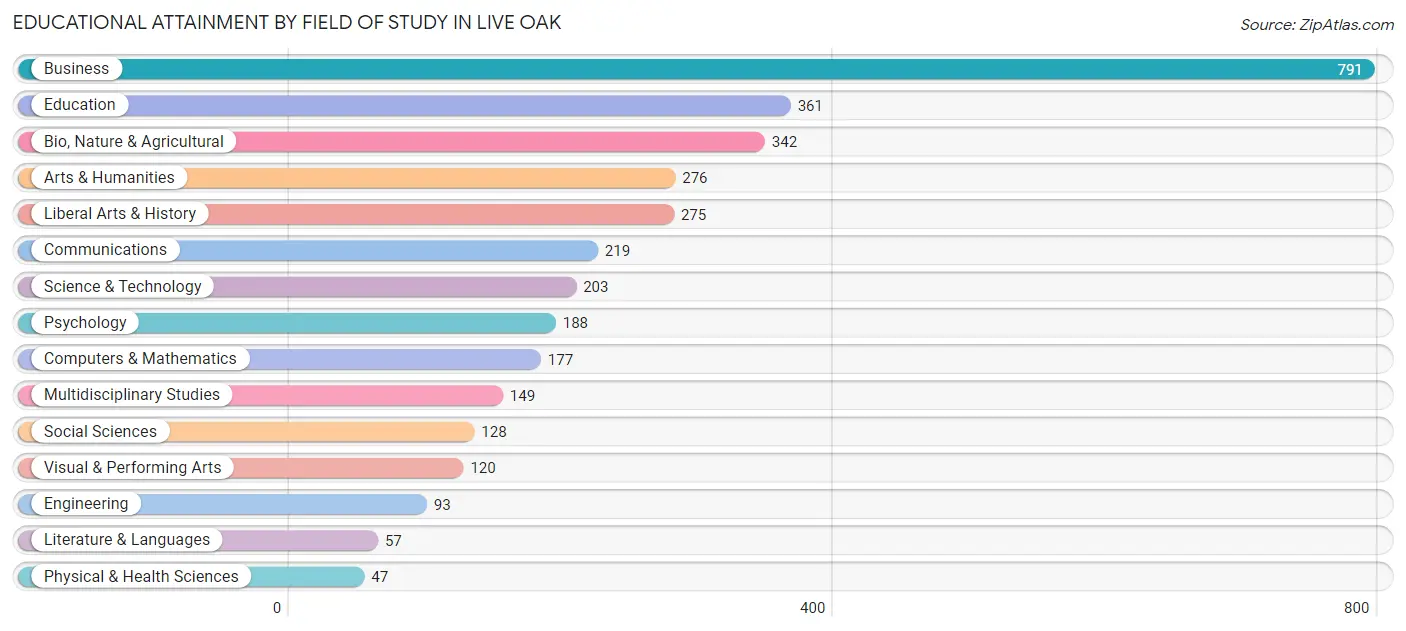
| Field of Study | # Graduates | % Graduates |
| Computers & Mathematics | 177 | 5.2% |
| Bio, Nature & Agricultural | 342 | 10.0% |
| Physical & Health Sciences | 47 | 1.4% |
| Psychology | 188 | 5.5% |
| Social Sciences | 128 | 3.7% |
| Engineering | 93 | 2.7% |
| Multidisciplinary Studies | 149 | 4.3% |
| Science & Technology | 203 | 5.9% |
| Business | 791 | 23.1% |
| Education | 361 | 10.5% |
| Literature & Languages | 57 | 1.7% |
| Liberal Arts & History | 275 | 8.0% |
| Visual & Performing Arts | 120 | 3.5% |
| Communications | 219 | 6.4% |
| Arts & Humanities | 276 | 8.1% |
| Total | 3,426 | 100.0% |
Transportation & Commute in Live Oak
Vehicle Availability by Sex in Live Oak
The most prevalent vehicle ownership categories in Live Oak are males with 2 vehicles (1,818, accounting for 44.7%) and females with 2 vehicles (1,360, making up 46.5%).
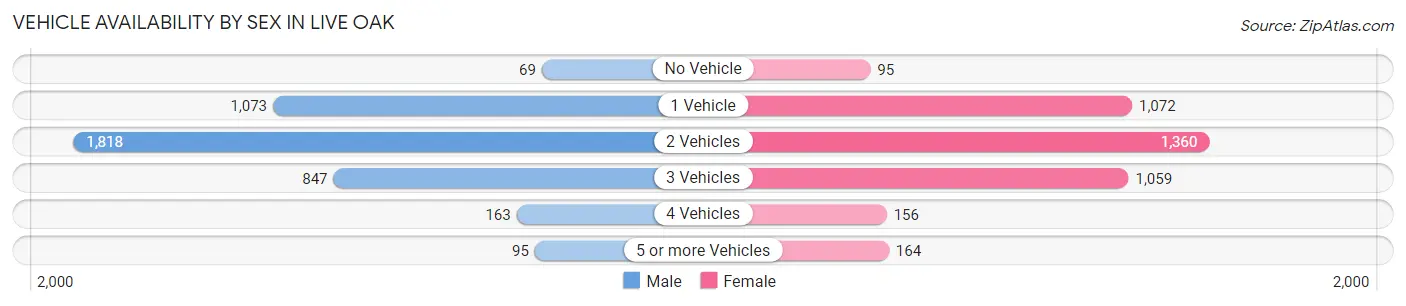
| Vehicles Available | Male | Female |
| No Vehicle | 69 (1.7%) | 95 (2.4%) |
| 1 Vehicle | 1,073 (26.4%) | 1,072 (27.4%) |
| 2 Vehicles | 1,818 (44.7%) | 1,360 (34.8%) |
| 3 Vehicles | 847 (20.8%) | 1,059 (27.1%) |
| 4 Vehicles | 163 (4.0%) | 156 (4.0%) |
| 5 or more Vehicles | 95 (2.3%) | 164 (4.2%) |
| Total | 4,065 (100.0%) | 3,906 (100.0%) |
Commute Time in Live Oak
The most frequently occuring commute durations in Live Oak are 20 to 24 minutes (1,697 commuters, 24.6%), 10 to 14 minutes (1,363 commuters, 19.8%), and 15 to 19 minutes (935 commuters, 13.6%).
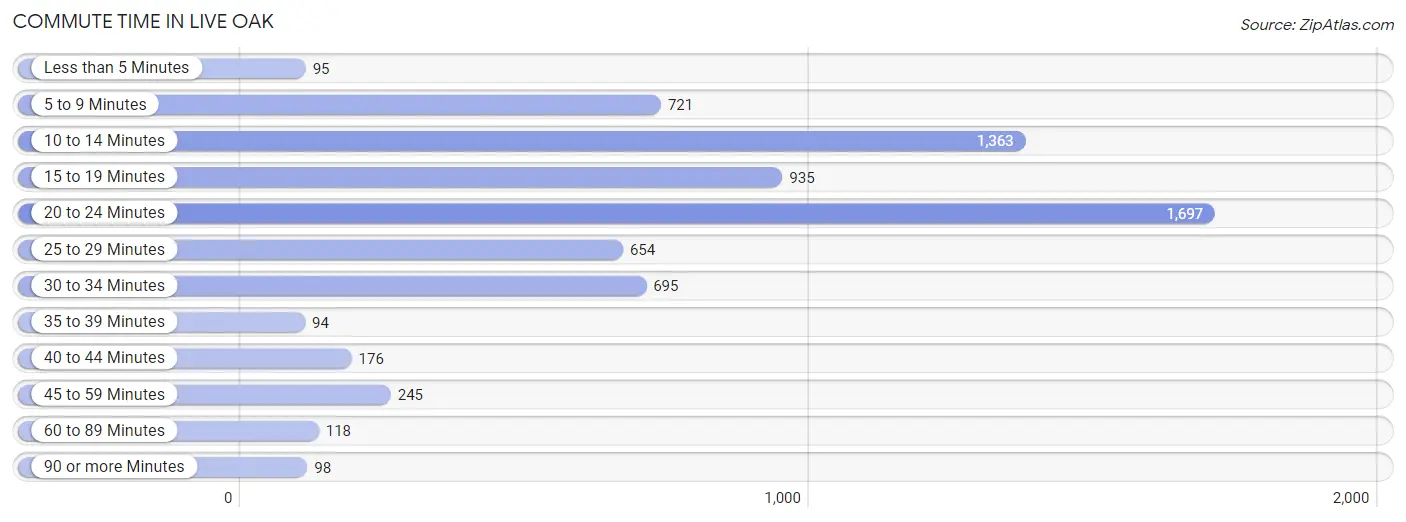
| Commute Time | # Commuters | % Commuters |
| Less than 5 Minutes | 95 | 1.4% |
| 5 to 9 Minutes | 721 | 10.5% |
| 10 to 14 Minutes | 1,363 | 19.8% |
| 15 to 19 Minutes | 935 | 13.6% |
| 20 to 24 Minutes | 1,697 | 24.6% |
| 25 to 29 Minutes | 654 | 9.5% |
| 30 to 34 Minutes | 695 | 10.1% |
| 35 to 39 Minutes | 94 | 1.4% |
| 40 to 44 Minutes | 176 | 2.5% |
| 45 to 59 Minutes | 245 | 3.6% |
| 60 to 89 Minutes | 118 | 1.7% |
| 90 or more Minutes | 98 | 1.4% |
Commute Time by Sex in Live Oak
The most common commute times in Live Oak are 10 to 14 minutes (896 commuters, 23.7%) for males and 20 to 24 minutes (996 commuters, 32.0%) for females.
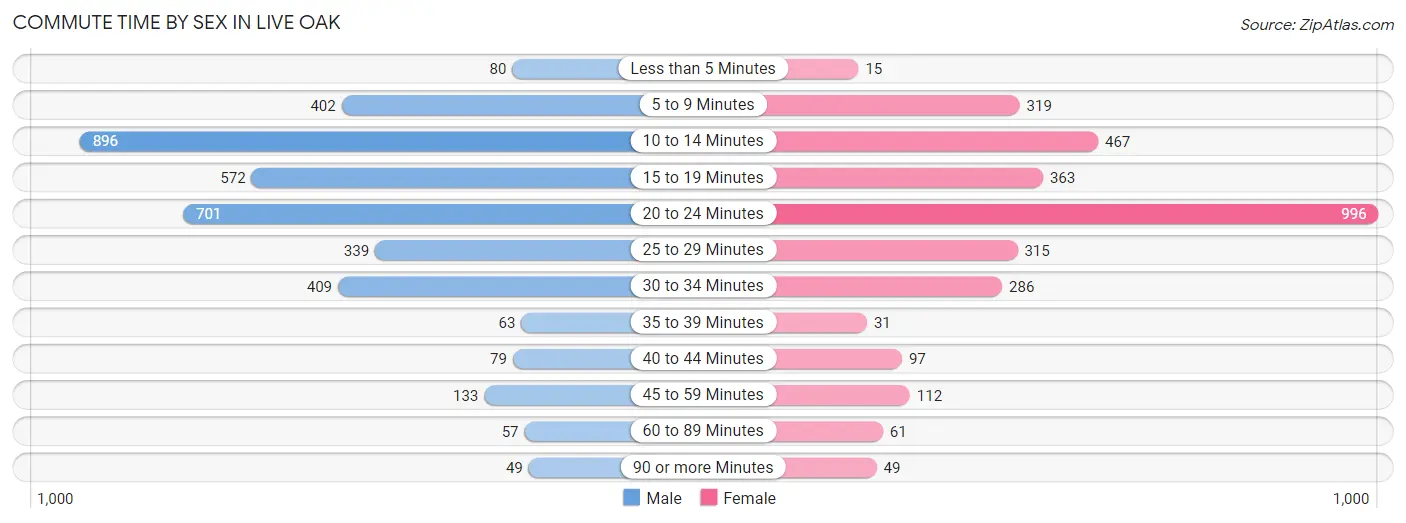
| Commute Time | Male | Female |
| Less than 5 Minutes | 80 (2.1%) | 15 (0.5%) |
| 5 to 9 Minutes | 402 (10.6%) | 319 (10.2%) |
| 10 to 14 Minutes | 896 (23.7%) | 467 (15.0%) |
| 15 to 19 Minutes | 572 (15.1%) | 363 (11.7%) |
| 20 to 24 Minutes | 701 (18.5%) | 996 (32.0%) |
| 25 to 29 Minutes | 339 (9.0%) | 315 (10.1%) |
| 30 to 34 Minutes | 409 (10.8%) | 286 (9.2%) |
| 35 to 39 Minutes | 63 (1.7%) | 31 (1.0%) |
| 40 to 44 Minutes | 79 (2.1%) | 97 (3.1%) |
| 45 to 59 Minutes | 133 (3.5%) | 112 (3.6%) |
| 60 to 89 Minutes | 57 (1.5%) | 61 (2.0%) |
| 90 or more Minutes | 49 (1.3%) | 49 (1.6%) |
Time of Departure to Work by Sex in Live Oak
The most frequent times of departure to work in Live Oak are 7:30 AM to 7:59 AM (505, 13.4%) for males and 9:00 AM to 9:59 AM (600, 19.3%) for females.
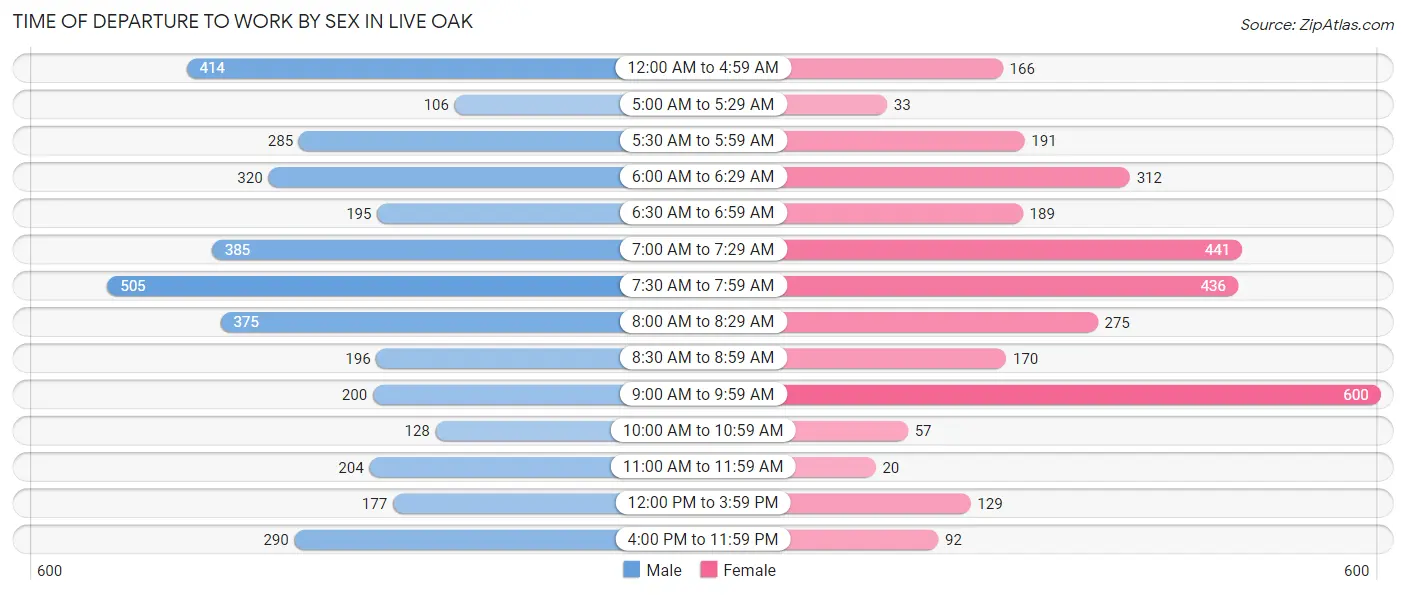
| Time of Departure | Male | Female |
| 12:00 AM to 4:59 AM | 414 (11.0%) | 166 (5.3%) |
| 5:00 AM to 5:29 AM | 106 (2.8%) | 33 (1.1%) |
| 5:30 AM to 5:59 AM | 285 (7.5%) | 191 (6.1%) |
| 6:00 AM to 6:29 AM | 320 (8.5%) | 312 (10.0%) |
| 6:30 AM to 6:59 AM | 195 (5.2%) | 189 (6.1%) |
| 7:00 AM to 7:29 AM | 385 (10.2%) | 441 (14.2%) |
| 7:30 AM to 7:59 AM | 505 (13.4%) | 436 (14.0%) |
| 8:00 AM to 8:29 AM | 375 (9.9%) | 275 (8.8%) |
| 8:30 AM to 8:59 AM | 196 (5.2%) | 170 (5.5%) |
| 9:00 AM to 9:59 AM | 200 (5.3%) | 600 (19.3%) |
| 10:00 AM to 10:59 AM | 128 (3.4%) | 57 (1.8%) |
| 11:00 AM to 11:59 AM | 204 (5.4%) | 20 (0.6%) |
| 12:00 PM to 3:59 PM | 177 (4.7%) | 129 (4.2%) |
| 4:00 PM to 11:59 PM | 290 (7.7%) | 92 (3.0%) |
| Total | 3,780 (100.0%) | 3,111 (100.0%) |
Housing Occupancy in Live Oak
Occupancy by Ownership in Live Oak
Of the total 6,476 dwellings in Live Oak, owner-occupied units account for 3,724 (57.5%), while renter-occupied units make up 2,752 (42.5%).
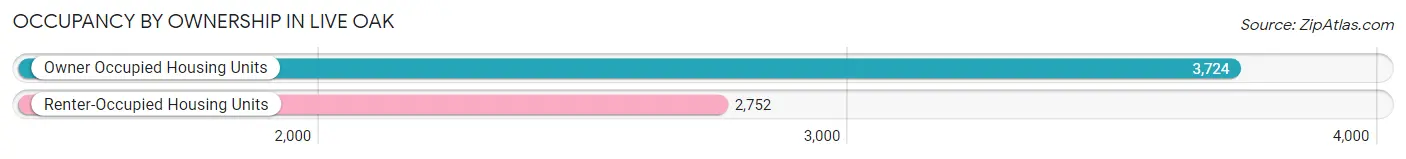
| Occupancy | # Housing Units | % Housing Units |
| Owner Occupied Housing Units | 3,724 | 57.5% |
| Renter-Occupied Housing Units | 2,752 | 42.5% |
| Total Occupied Housing Units | 6,476 | 100.0% |
Occupancy by Household Size in Live Oak
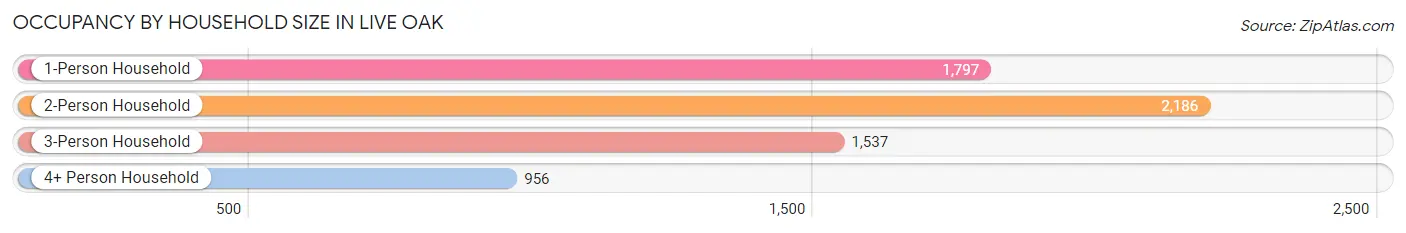
| Household Size | # Housing Units | % Housing Units |
| 1-Person Household | 1,797 | 27.8% |
| 2-Person Household | 2,186 | 33.8% |
| 3-Person Household | 1,537 | 23.7% |
| 4+ Person Household | 956 | 14.8% |
| Total Housing Units | 6,476 | 100.0% |
Occupancy by Ownership by Household Size in Live Oak
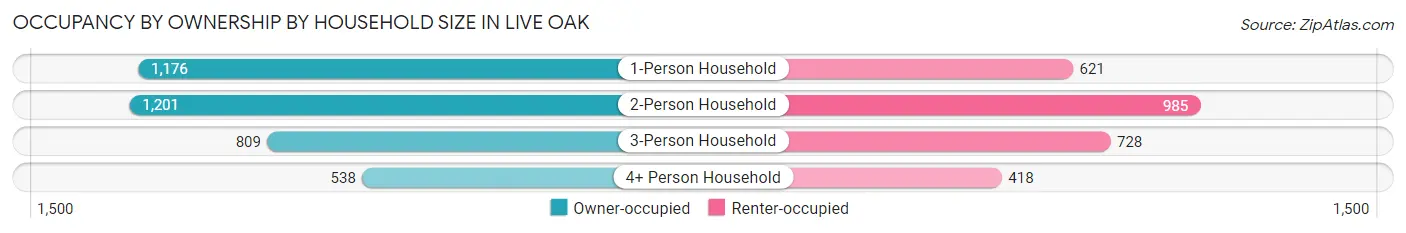
| Household Size | Owner-occupied | Renter-occupied |
| 1-Person Household | 1,176 (65.4%) | 621 (34.6%) |
| 2-Person Household | 1,201 (54.9%) | 985 (45.1%) |
| 3-Person Household | 809 (52.6%) | 728 (47.4%) |
| 4+ Person Household | 538 (56.3%) | 418 (43.7%) |
| Total Housing Units | 3,724 (57.5%) | 2,752 (42.5%) |
Occupancy by Educational Attainment in Live Oak
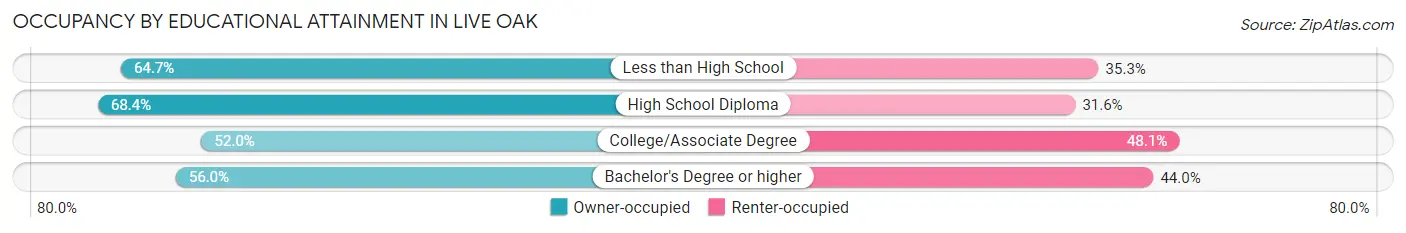
| Household Size | Owner-occupied | Renter-occupied |
| Less than High School | 121 (64.7%) | 66 (35.3%) |
| High School Diploma | 1,030 (68.4%) | 476 (31.6%) |
| College/Associate Degree | 1,356 (51.9%) | 1,254 (48.0%) |
| Bachelor's Degree or higher | 1,217 (56.0%) | 956 (44.0%) |
Occupancy by Age of Householder in Live Oak
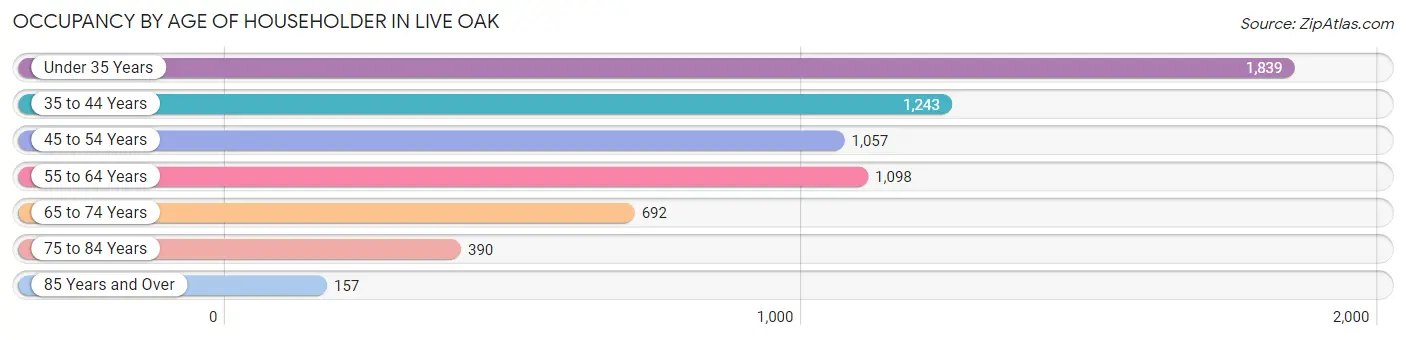
| Age Bracket | # Households | % Households |
| Under 35 Years | 1,839 | 28.4% |
| 35 to 44 Years | 1,243 | 19.2% |
| 45 to 54 Years | 1,057 | 16.3% |
| 55 to 64 Years | 1,098 | 17.0% |
| 65 to 74 Years | 692 | 10.7% |
| 75 to 84 Years | 390 | 6.0% |
| 85 Years and Over | 157 | 2.4% |
| Total | 6,476 | 100.0% |
Housing Finances in Live Oak
Median Income by Occupancy in Live Oak
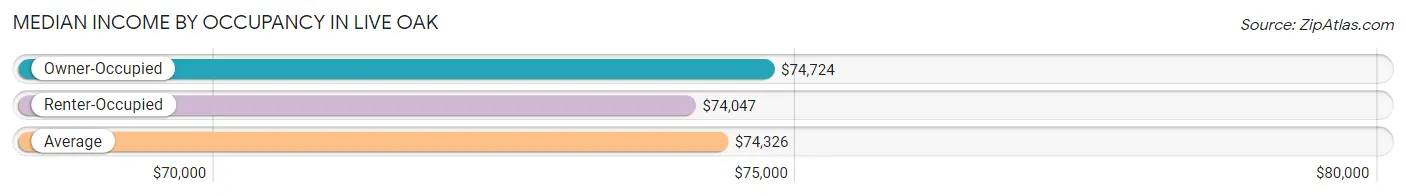
| Occupancy Type | # Households | Median Income |
| Owner-Occupied | 3,724 (57.5%) | $74,724 |
| Renter-Occupied | 2,752 (42.5%) | $74,047 |
| Average | 6,476 (100.0%) | $74,326 |
Occupancy by Householder Income Bracket in Live Oak
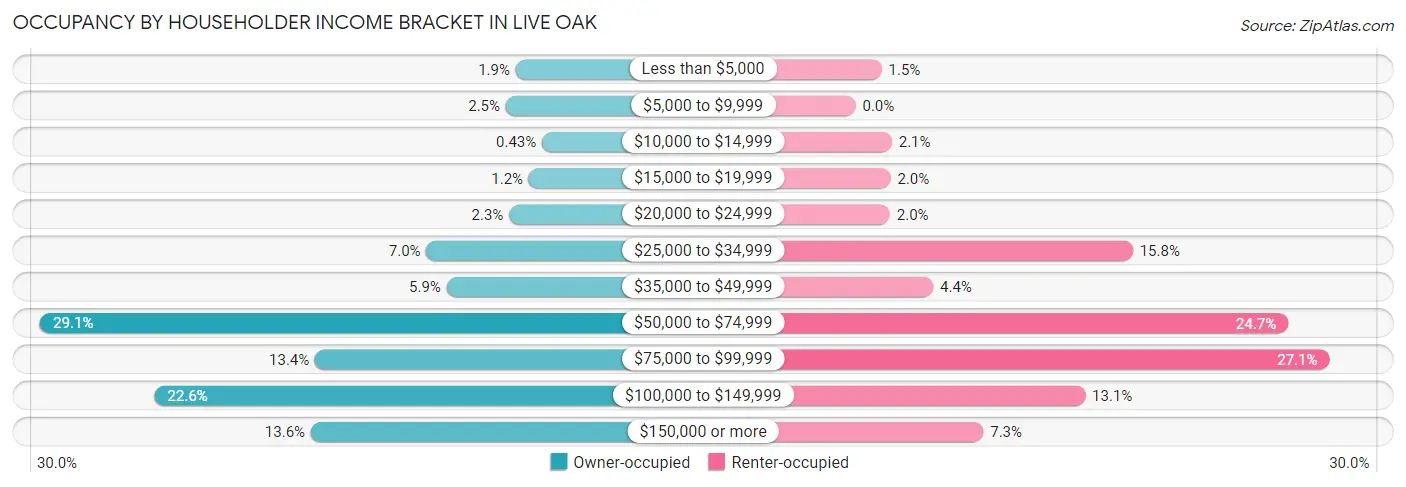
| Income Bracket | Owner-occupied | Renter-occupied |
| Less than $5,000 | 72 (1.9%) | 41 (1.5%) |
| $5,000 to $9,999 | 93 (2.5%) | 0 (0.0%) |
| $10,000 to $14,999 | 16 (0.4%) | 57 (2.1%) |
| $15,000 to $19,999 | 44 (1.2%) | 55 (2.0%) |
| $20,000 to $24,999 | 86 (2.3%) | 54 (2.0%) |
| $25,000 to $34,999 | 262 (7.0%) | 436 (15.8%) |
| $35,000 to $49,999 | 219 (5.9%) | 122 (4.4%) |
| $50,000 to $74,999 | 1,084 (29.1%) | 680 (24.7%) |
| $75,000 to $99,999 | 499 (13.4%) | 745 (27.1%) |
| $100,000 to $149,999 | 841 (22.6%) | 361 (13.1%) |
| $150,000 or more | 508 (13.6%) | 201 (7.3%) |
| Total | 3,724 (100.0%) | 2,752 (100.0%) |
Monthly Housing Cost Tiers in Live Oak
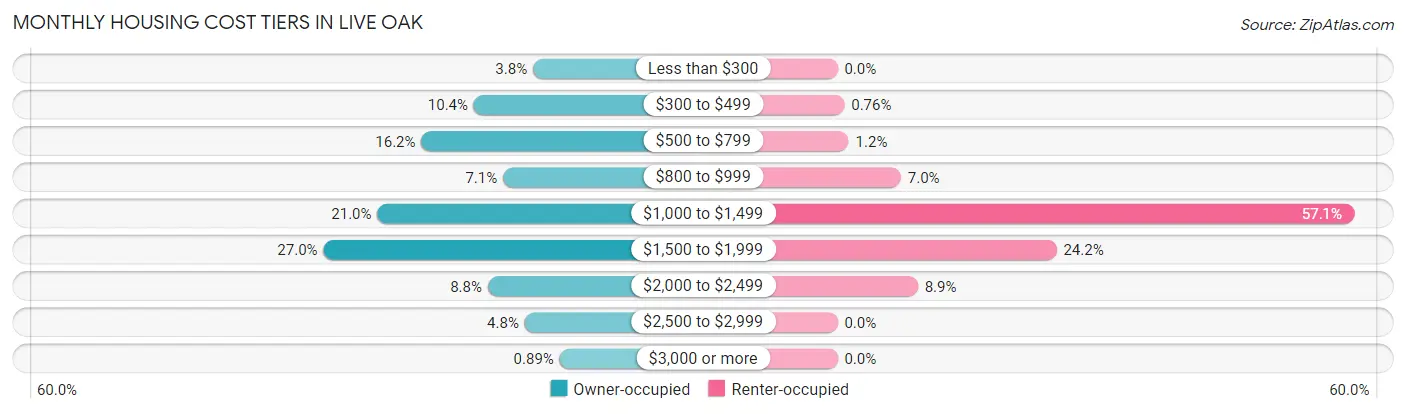
| Monthly Cost | Owner-occupied | Renter-occupied |
| Less than $300 | 143 (3.8%) | 0 (0.0%) |
| $300 to $499 | 386 (10.4%) | 21 (0.8%) |
| $500 to $799 | 602 (16.2%) | 34 (1.2%) |
| $800 to $999 | 266 (7.1%) | 193 (7.0%) |
| $1,000 to $1,499 | 783 (21.0%) | 1,570 (57.1%) |
| $1,500 to $1,999 | 1,005 (27.0%) | 666 (24.2%) |
| $2,000 to $2,499 | 329 (8.8%) | 244 (8.9%) |
| $2,500 to $2,999 | 177 (4.8%) | 0 (0.0%) |
| $3,000 or more | 33 (0.9%) | 0 (0.0%) |
| Total | 3,724 (100.0%) | 2,752 (100.0%) |
Physical Housing Characteristics in Live Oak
Housing Structures in Live Oak
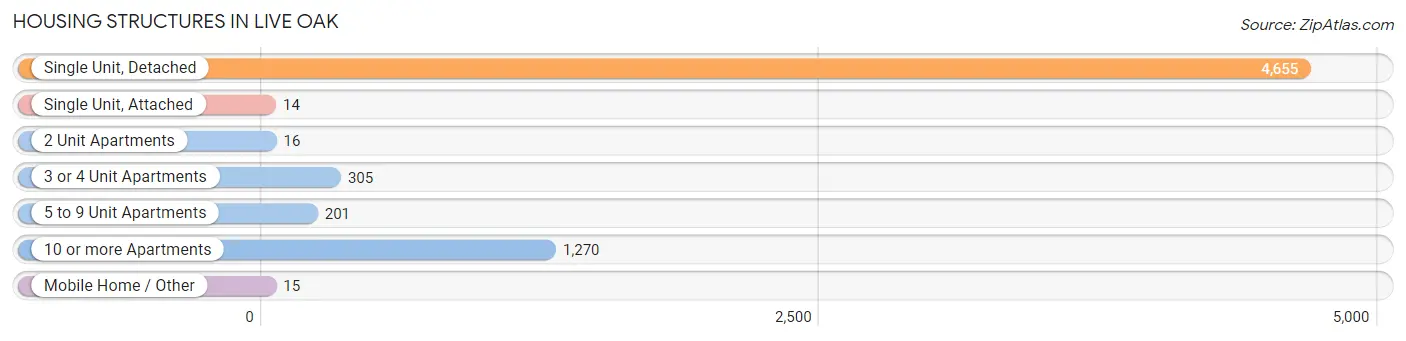
| Structure Type | # Housing Units | % Housing Units |
| Single Unit, Detached | 4,655 | 71.9% |
| Single Unit, Attached | 14 | 0.2% |
| 2 Unit Apartments | 16 | 0.3% |
| 3 or 4 Unit Apartments | 305 | 4.7% |
| 5 to 9 Unit Apartments | 201 | 3.1% |
| 10 or more Apartments | 1,270 | 19.6% |
| Mobile Home / Other | 15 | 0.2% |
| Total | 6,476 | 100.0% |
Housing Structures by Occupancy in Live Oak
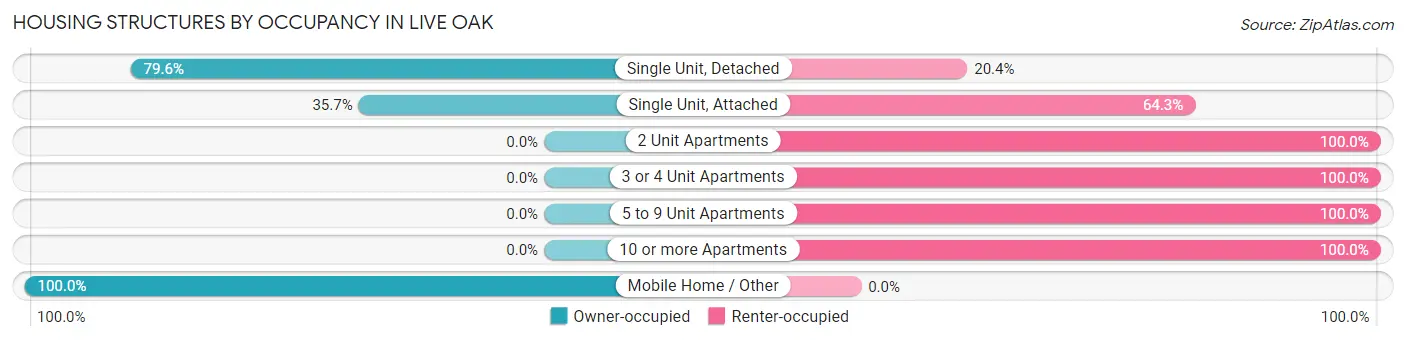
| Structure Type | Owner-occupied | Renter-occupied |
| Single Unit, Detached | 3,704 (79.6%) | 951 (20.4%) |
| Single Unit, Attached | 5 (35.7%) | 9 (64.3%) |
| 2 Unit Apartments | 0 (0.0%) | 16 (100.0%) |
| 3 or 4 Unit Apartments | 0 (0.0%) | 305 (100.0%) |
| 5 to 9 Unit Apartments | 0 (0.0%) | 201 (100.0%) |
| 10 or more Apartments | 0 (0.0%) | 1,270 (100.0%) |
| Mobile Home / Other | 15 (100.0%) | 0 (0.0%) |
| Total | 3,724 (57.5%) | 2,752 (42.5%) |
Housing Structures by Number of Rooms in Live Oak
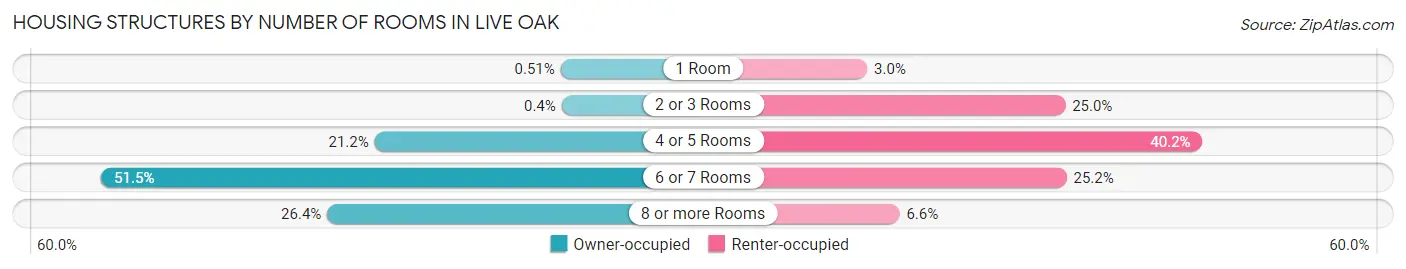
| Number of Rooms | Owner-occupied | Renter-occupied |
| 1 Room | 19 (0.5%) | 83 (3.0%) |
| 2 or 3 Rooms | 15 (0.4%) | 688 (25.0%) |
| 4 or 5 Rooms | 788 (21.2%) | 1,107 (40.2%) |
| 6 or 7 Rooms | 1,918 (51.5%) | 692 (25.2%) |
| 8 or more Rooms | 984 (26.4%) | 182 (6.6%) |
| Total | 3,724 (100.0%) | 2,752 (100.0%) |
Housing Structure by Heating Type in Live Oak
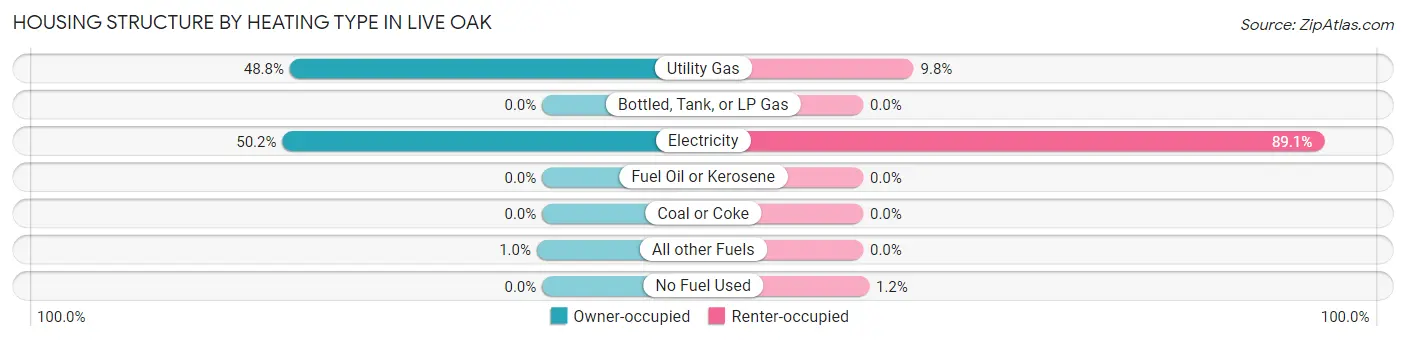
| Heating Type | Owner-occupied | Renter-occupied |
| Utility Gas | 1,816 (48.8%) | 269 (9.8%) |
| Bottled, Tank, or LP Gas | 0 (0.0%) | 0 (0.0%) |
| Electricity | 1,870 (50.2%) | 2,451 (89.1%) |
| Fuel Oil or Kerosene | 0 (0.0%) | 0 (0.0%) |
| Coal or Coke | 0 (0.0%) | 0 (0.0%) |
| All other Fuels | 38 (1.0%) | 0 (0.0%) |
| No Fuel Used | 0 (0.0%) | 32 (1.2%) |
| Total | 3,724 (100.0%) | 2,752 (100.0%) |
Household Vehicle Usage in Live Oak
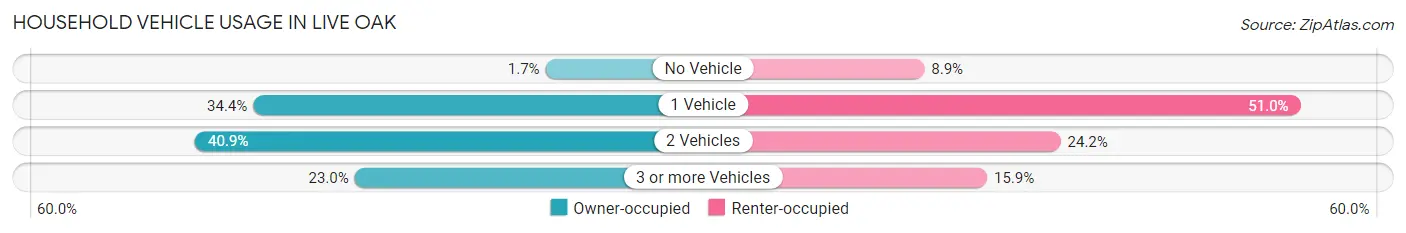
| Vehicles per Household | Owner-occupied | Renter-occupied |
| No Vehicle | 62 (1.7%) | 245 (8.9%) |
| 1 Vehicle | 1,281 (34.4%) | 1,404 (51.0%) |
| 2 Vehicles | 1,523 (40.9%) | 665 (24.2%) |
| 3 or more Vehicles | 858 (23.0%) | 438 (15.9%) |
| Total | 3,724 (100.0%) | 2,752 (100.0%) |
Real Estate & Mortgages in Live Oak
Real Estate and Mortgage Overview in Live Oak
| Characteristic | Without Mortgage | With Mortgage |
| Housing Units | 1,089 | 2,635 |
| Median Property Value | $178,000 | $229,100 |
| Median Household Income | $64,120 | $403 |
| Monthly Housing Costs | $516 | $33 |
| Real Estate Taxes | $2,119 | $527 |
Property Value by Mortgage Status in Live Oak
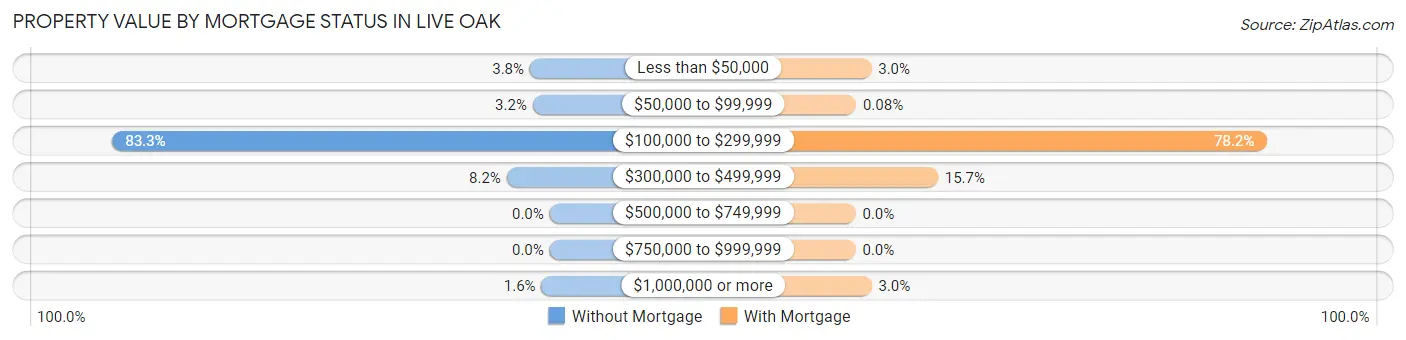
| Property Value | Without Mortgage | With Mortgage |
| Less than $50,000 | 41 (3.8%) | 79 (3.0%) |
| $50,000 to $99,999 | 35 (3.2%) | 2 (0.1%) |
| $100,000 to $299,999 | 907 (83.3%) | 2,061 (78.2%) |
| $300,000 to $499,999 | 89 (8.2%) | 413 (15.7%) |
| $500,000 to $749,999 | 0 (0.0%) | 0 (0.0%) |
| $750,000 to $999,999 | 0 (0.0%) | 0 (0.0%) |
| $1,000,000 or more | 17 (1.6%) | 80 (3.0%) |
| Total | 1,089 (100.0%) | 2,635 (100.0%) |
Household Income by Mortgage Status in Live Oak
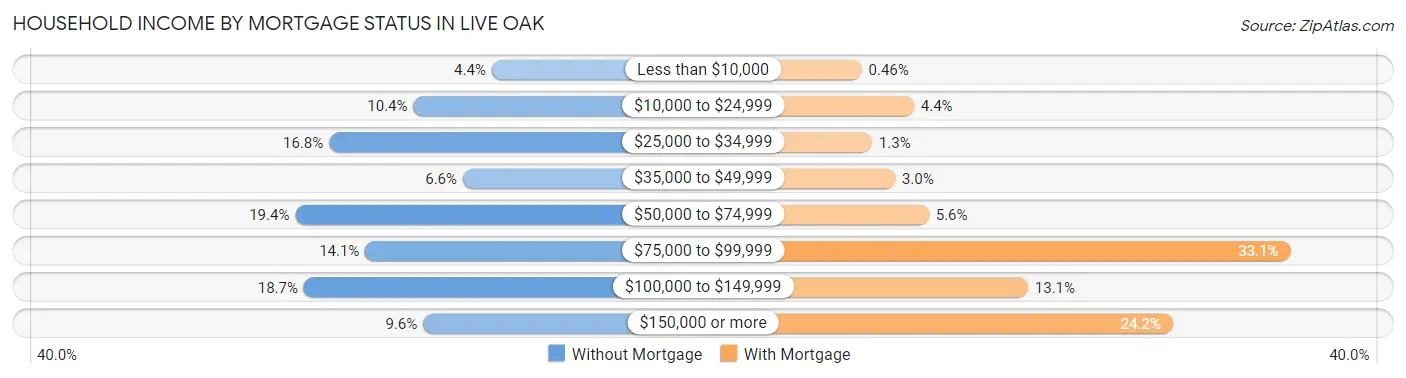
| Household Income | Without Mortgage | With Mortgage |
| Less than $10,000 | 48 (4.4%) | 12 (0.5%) |
| $10,000 to $24,999 | 113 (10.4%) | 117 (4.4%) |
| $25,000 to $34,999 | 183 (16.8%) | 33 (1.3%) |
| $35,000 to $49,999 | 72 (6.6%) | 79 (3.0%) |
| $50,000 to $74,999 | 211 (19.4%) | 147 (5.6%) |
| $75,000 to $99,999 | 153 (14.1%) | 873 (33.1%) |
| $100,000 to $149,999 | 204 (18.7%) | 346 (13.1%) |
| $150,000 or more | 105 (9.6%) | 637 (24.2%) |
| Total | 1,089 (100.0%) | 2,635 (100.0%) |
Property Value to Household Income Ratio in Live Oak
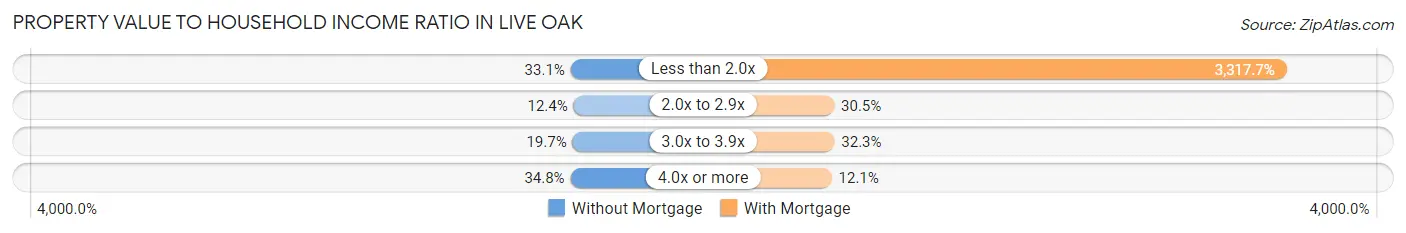
| Value-to-Income Ratio | Without Mortgage | With Mortgage |
| Less than 2.0x | 360 (33.1%) | 87,420 (3,317.6%) |
| 2.0x to 2.9x | 135 (12.4%) | 803 (30.5%) |
| 3.0x to 3.9x | 215 (19.7%) | 850 (32.3%) |
| 4.0x or more | 379 (34.8%) | 320 (12.1%) |
| Total | 1,089 (100.0%) | 2,635 (100.0%) |
Real Estate Taxes by Mortgage Status in Live Oak
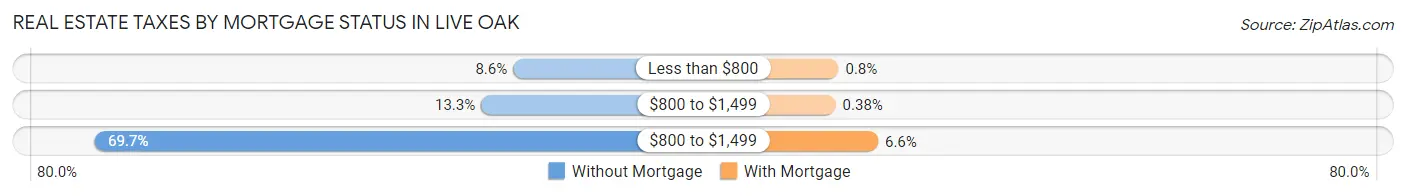
| Property Taxes | Without Mortgage | With Mortgage |
| Less than $800 | 94 (8.6%) | 21 (0.8%) |
| $800 to $1,499 | 145 (13.3%) | 10 (0.4%) |
| $800 to $1,499 | 759 (69.7%) | 173 (6.6%) |
| Total | 1,089 (100.0%) | 2,635 (100.0%) |
Health & Disability in Live Oak
Health Insurance Coverage by Age in Live Oak
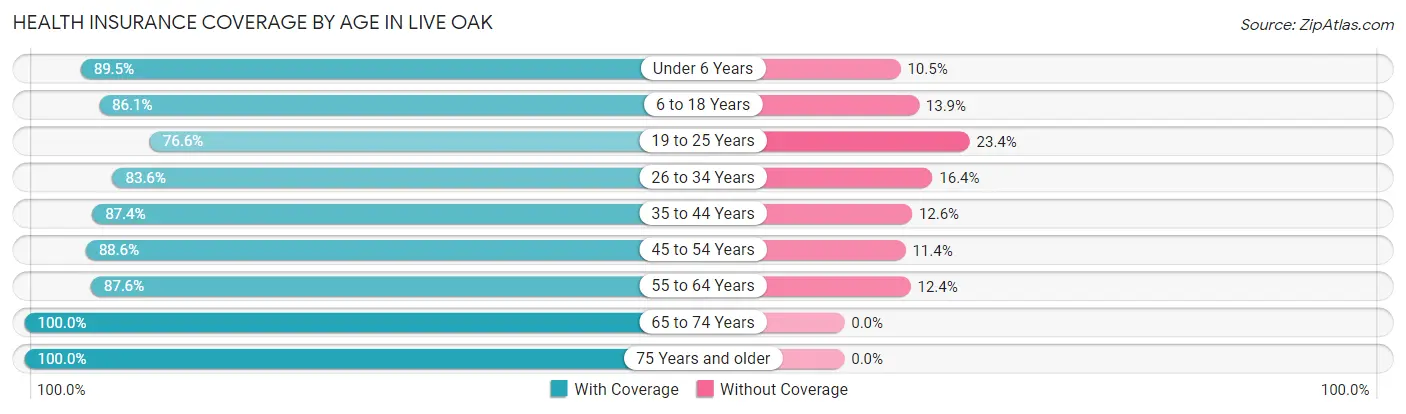
| Age Bracket | With Coverage | Without Coverage |
| Under 6 Years | 1,367 (89.5%) | 160 (10.5%) |
| 6 to 18 Years | 1,901 (86.1%) | 307 (13.9%) |
| 19 to 25 Years | 1,331 (76.6%) | 406 (23.4%) |
| 26 to 34 Years | 2,097 (83.6%) | 412 (16.4%) |
| 35 to 44 Years | 1,890 (87.4%) | 273 (12.6%) |
| 45 to 54 Years | 1,599 (88.6%) | 206 (11.4%) |
| 55 to 64 Years | 1,617 (87.6%) | 228 (12.4%) |
| 65 to 74 Years | 972 (100.0%) | 0 (0.0%) |
| 75 Years and older | 774 (100.0%) | 0 (0.0%) |
| Total | 13,548 (87.2%) | 1,992 (12.8%) |
Health Insurance Coverage by Citizenship Status in Live Oak
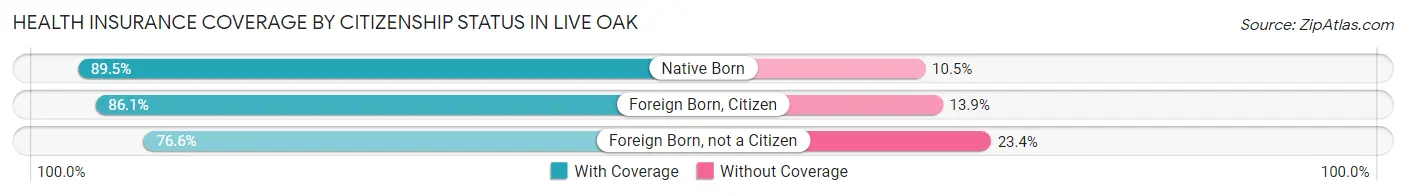
| Citizenship Status | With Coverage | Without Coverage |
| Native Born | 1,367 (89.5%) | 160 (10.5%) |
| Foreign Born, Citizen | 1,901 (86.1%) | 307 (13.9%) |
| Foreign Born, not a Citizen | 1,331 (76.6%) | 406 (23.4%) |
Health Insurance Coverage by Household Income in Live Oak
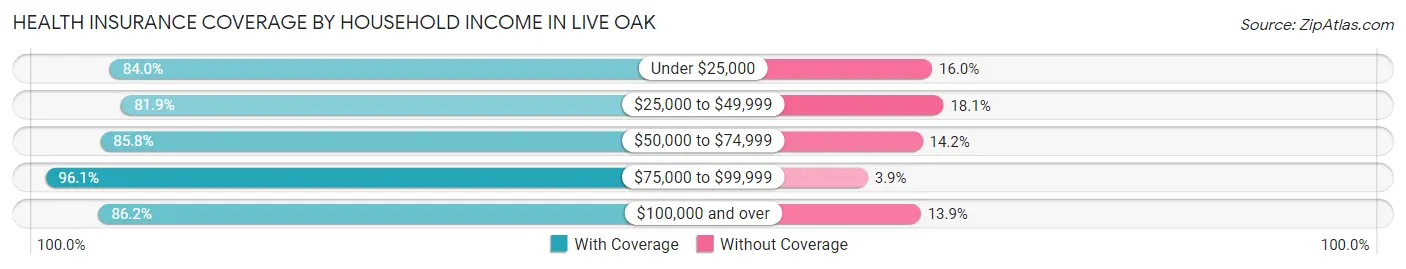
| Household Income | With Coverage | Without Coverage |
| Under $25,000 | 642 (84.0%) | 122 (16.0%) |
| $25,000 to $49,999 | 1,755 (81.9%) | 388 (18.1%) |
| $50,000 to $74,999 | 3,723 (85.8%) | 616 (14.2%) |
| $75,000 to $99,999 | 2,715 (96.1%) | 111 (3.9%) |
| $100,000 and over | 4,697 (86.2%) | 755 (13.9%) |
Public vs Private Health Insurance Coverage by Age in Live Oak
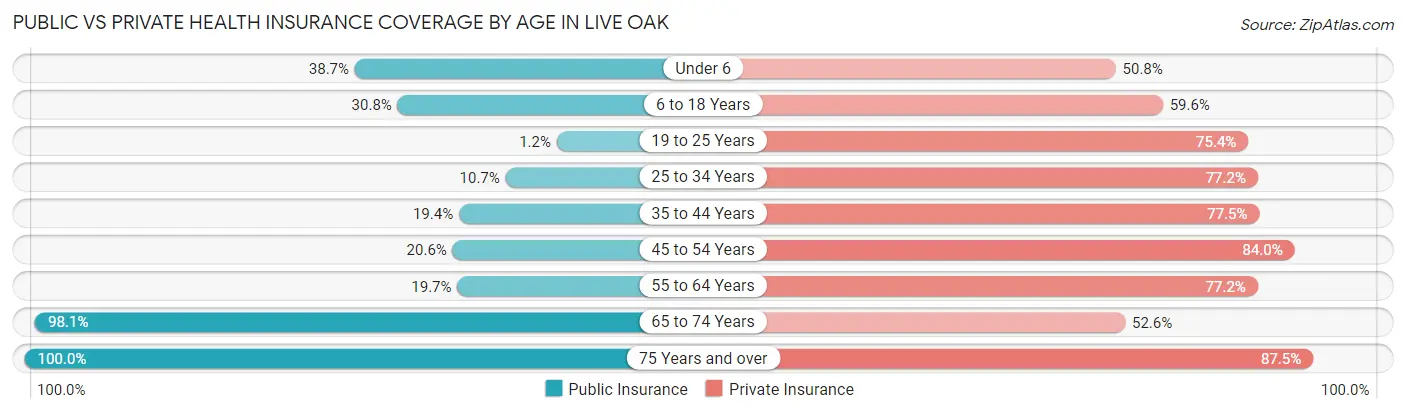
| Age Bracket | Public Insurance | Private Insurance |
| Under 6 | 591 (38.7%) | 776 (50.8%) |
| 6 to 18 Years | 679 (30.7%) | 1,315 (59.6%) |
| 19 to 25 Years | 21 (1.2%) | 1,310 (75.4%) |
| 25 to 34 Years | 269 (10.7%) | 1,937 (77.2%) |
| 35 to 44 Years | 419 (19.4%) | 1,676 (77.5%) |
| 45 to 54 Years | 371 (20.5%) | 1,517 (84.0%) |
| 55 to 64 Years | 363 (19.7%) | 1,424 (77.2%) |
| 65 to 74 Years | 953 (98.1%) | 511 (52.6%) |
| 75 Years and over | 774 (100.0%) | 677 (87.5%) |
| Total | 4,440 (28.6%) | 11,143 (71.7%) |
Disability Status by Sex by Age in Live Oak
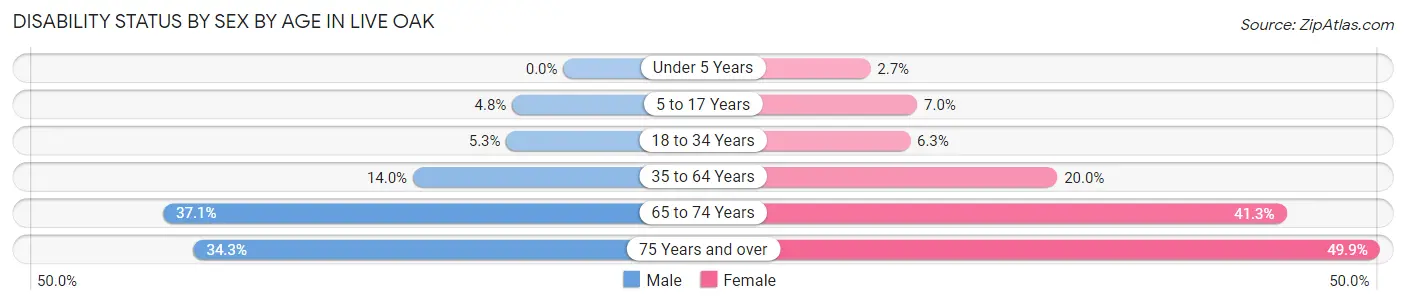
| Age Bracket | Male | Female |
| Under 5 Years | 0 (0.0%) | 23 (2.6%) |
| 5 to 17 Years | 60 (4.8%) | 68 (7.0%) |
| 18 to 34 Years | 114 (5.3%) | 136 (6.3%) |
| 35 to 64 Years | 368 (14.0%) | 635 (20.0%) |
| 65 to 74 Years | 153 (37.1%) | 231 (41.2%) |
| 75 Years and over | 93 (34.3%) | 251 (49.9%) |
Disability Class by Sex by Age in Live Oak
Disability Class: Hearing Difficulty
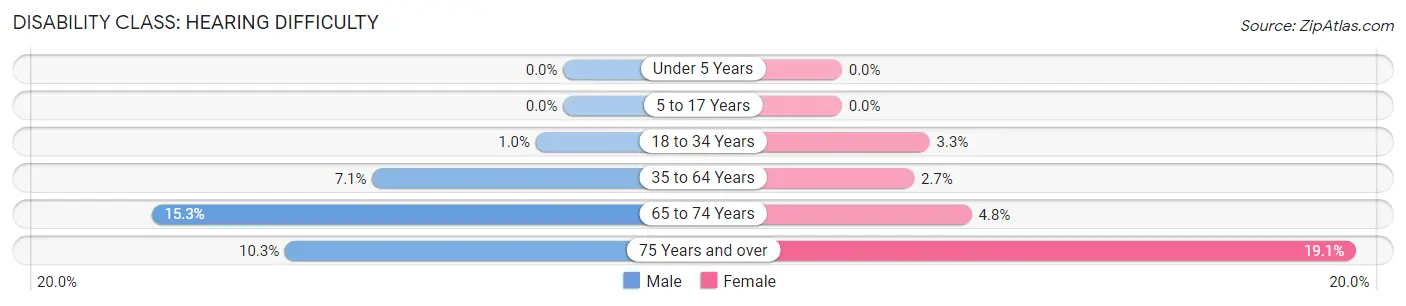
| Age Bracket | Male | Female |
| Under 5 Years | 0 (0.0%) | 0 (0.0%) |
| 5 to 17 Years | 0 (0.0%) | 0 (0.0%) |
| 18 to 34 Years | 22 (1.0%) | 70 (3.3%) |
| 35 to 64 Years | 187 (7.1%) | 85 (2.7%) |
| 65 to 74 Years | 63 (15.3%) | 27 (4.8%) |
| 75 Years and over | 28 (10.3%) | 96 (19.1%) |
Disability Class: Vision Difficulty
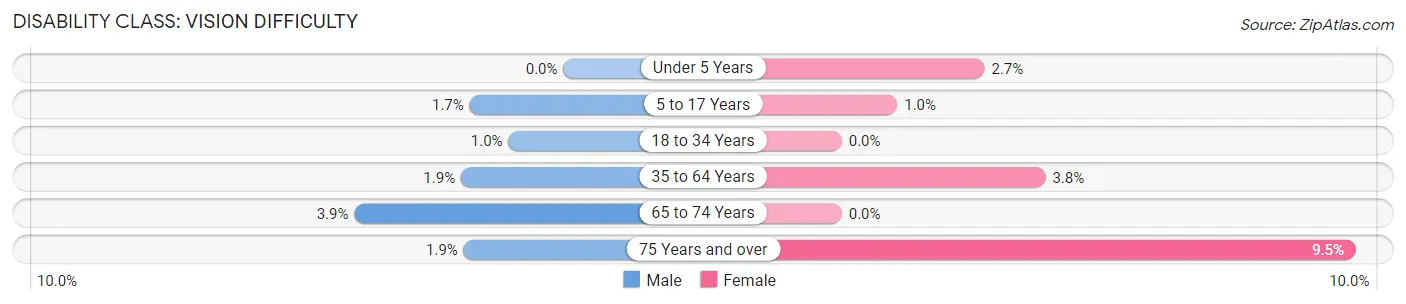
| Age Bracket | Male | Female |
| Under 5 Years | 0 (0.0%) | 23 (2.6%) |
| 5 to 17 Years | 22 (1.7%) | 10 (1.0%) |
| 18 to 34 Years | 22 (1.0%) | 0 (0.0%) |
| 35 to 64 Years | 50 (1.9%) | 120 (3.8%) |
| 65 to 74 Years | 16 (3.9%) | 0 (0.0%) |
| 75 Years and over | 5 (1.8%) | 48 (9.5%) |
Disability Class: Cognitive Difficulty
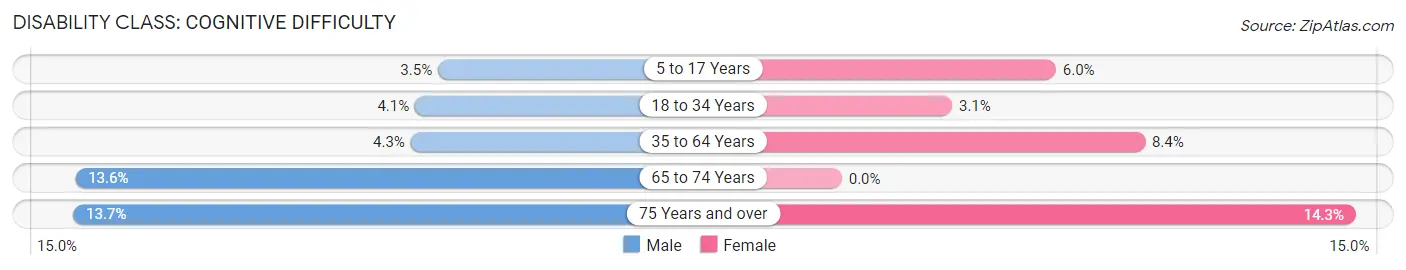
| Age Bracket | Male | Female |
| 5 to 17 Years | 44 (3.5%) | 58 (6.0%) |
| 18 to 34 Years | 89 (4.1%) | 66 (3.1%) |
| 35 to 64 Years | 112 (4.3%) | 268 (8.4%) |
| 65 to 74 Years | 56 (13.6%) | 0 (0.0%) |
| 75 Years and over | 37 (13.7%) | 72 (14.3%) |
Disability Class: Ambulatory Difficulty
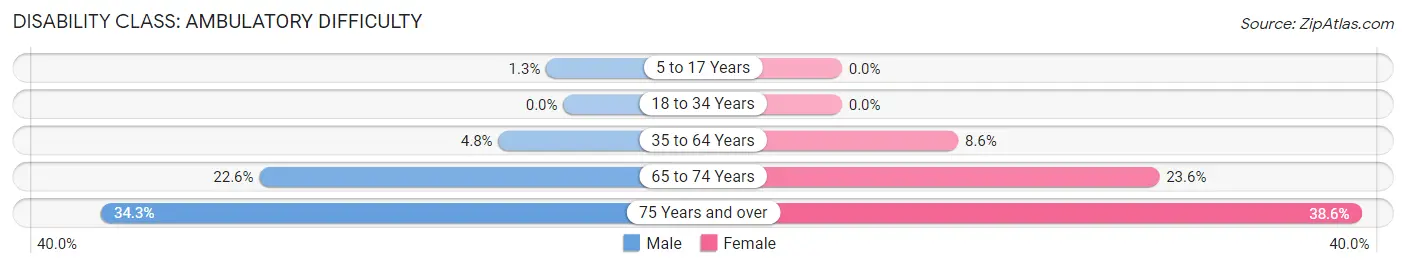
| Age Bracket | Male | Female |
| 5 to 17 Years | 16 (1.3%) | 0 (0.0%) |
| 18 to 34 Years | 0 (0.0%) | 0 (0.0%) |
| 35 to 64 Years | 127 (4.8%) | 274 (8.6%) |
| 65 to 74 Years | 93 (22.6%) | 132 (23.6%) |
| 75 Years and over | 93 (34.3%) | 194 (38.6%) |
Disability Class: Self-Care Difficulty
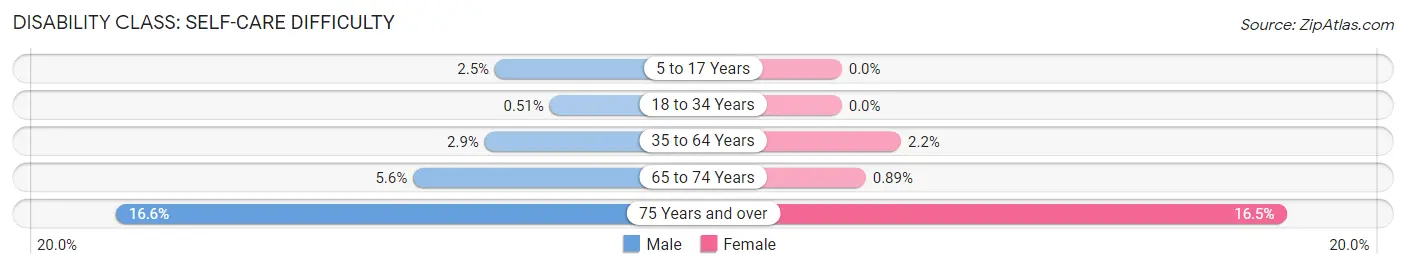
| Age Bracket | Male | Female |
| 5 to 17 Years | 32 (2.5%) | 0 (0.0%) |
| 18 to 34 Years | 11 (0.5%) | 0 (0.0%) |
| 35 to 64 Years | 77 (2.9%) | 70 (2.2%) |
| 65 to 74 Years | 23 (5.6%) | 5 (0.9%) |
| 75 Years and over | 45 (16.6%) | 83 (16.5%) |
Technology Access in Live Oak
Computing Device Access in Live Oak
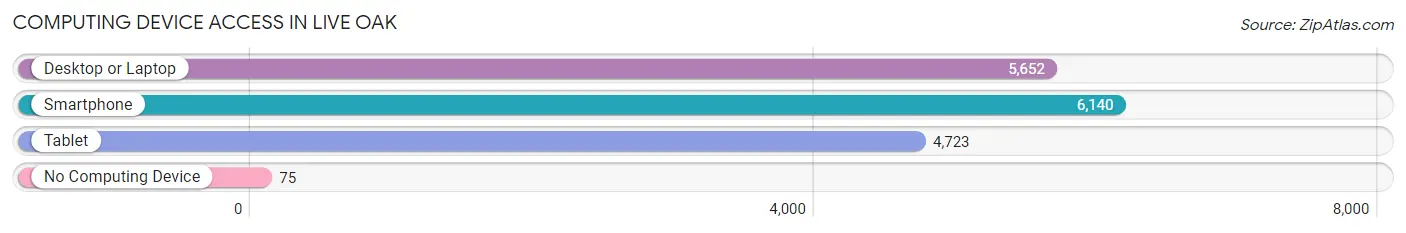
| Device Type | # Households | % Households |
| Desktop or Laptop | 5,652 | 87.3% |
| Smartphone | 6,140 | 94.8% |
| Tablet | 4,723 | 72.9% |
| No Computing Device | 75 | 1.2% |
| Total | 6,476 | 100.0% |
Internet Access in Live Oak
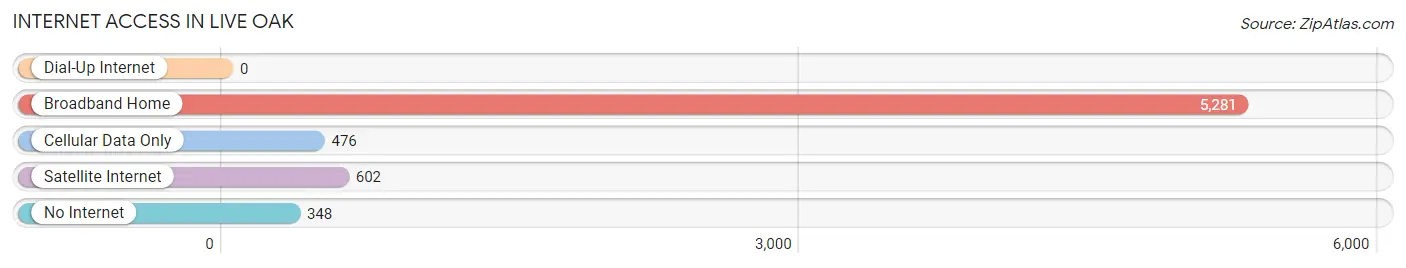
| Internet Type | # Households | % Households |
| Dial-Up Internet | 0 | 0.0% |
| Broadband Home | 5,281 | 81.6% |
| Cellular Data Only | 476 | 7.3% |
| Satellite Internet | 602 | 9.3% |
| No Internet | 348 | 5.4% |
| Total | 6,476 | 100.0% |
Live Oak Summary
History
The city of Live Oak, Texas is located in Bexar County, just north of San Antonio. It is a small city with a population of just over 8,000 people. The city was founded in 1854 by a group of German immigrants who were looking for a place to settle and start a new life. The city was named after the live oak trees that were abundant in the area.
The city of Live Oak has a rich history that dates back to the early 1800s. The area was originally inhabited by Native American tribes, including the Coahuiltecan, Lipan Apache, and Comanche. The first European settlers arrived in the area in the late 1700s, and the city was officially founded in 1854.
The city of Live Oak has seen many changes over the years. In the late 1800s, the city was a bustling center of commerce and industry, with several cotton gins, a sawmill, and a brick factory. The city also had a thriving agricultural industry, with several farms and ranches in the area.
In the early 1900s, the city began to experience a decline in population and economic activity. This was due in part to the Great Depression and the Dust Bowl, which caused many people to leave the area in search of better opportunities elsewhere.
In the late 1900s, the city began to experience a resurgence in population and economic activity. This was due in part to the growth of San Antonio, which is located just a few miles away. The city has also seen an increase in tourism, with many people visiting the area to take advantage of the city’s natural beauty and recreational opportunities.
Geography
Live Oak is located in Bexar County, Texas, just north of San Antonio. The city is situated on the banks of the San Antonio River, and is surrounded by rolling hills and lush vegetation. The city has a total area of 4.3 square miles, with 0.2 square miles of water.
The climate in Live Oak is classified as humid subtropical, with hot summers and mild winters. The average temperature in the summer is around 90 degrees Fahrenheit, and the average temperature in the winter is around 60 degrees Fahrenheit. The city receives an average of 33 inches of rain per year.
Economy
The economy of Live Oak is largely based on tourism and retail. The city is home to several tourist attractions, including the San Antonio River Walk, the Alamo, and the San Antonio Zoo. The city also has several shopping centers and retail stores, as well as a variety of restaurants and bars.
The city is also home to several manufacturing and industrial businesses, including a steel mill, a paper mill, and a chemical plant. The city also has a thriving agricultural industry, with several farms and ranches in the area.
Demographics
As of the 2010 census, the population of Live Oak was 8,092. The racial makeup of the city was 79.3% White, 8.2% African American, 0.4% Native American, 0.7% Asian, 0.1% Pacific Islander, 8.7% from other races, and 2.6% from two or more races. Hispanic or Latino of any race were 18.3% of the population.
The median household income in Live Oak was $45,945, and the median family income was $50,945. The per capita income for the city was $20,945. About 11.3% of families and 14.2% of the population were below the poverty line, including 19.2% of those under age 18 and 8.2% of those age 65 or over.
Conclusion
Live Oak, Texas is a small city located in Bexar County, just north of San Antonio. The city has a rich history that dates back to the early 1800s, and has seen many changes over the years. The city has a thriving economy based on tourism and retail, as well as several manufacturing and industrial businesses. The population of Live Oak is 8,092, and the median household income is $45,945. The city is a great place to live, work, and visit, and offers a variety of recreational activities and attractions.
Common Questions
What is Per Capita Income in Live Oak?
Per Capita income in Live Oak is $37,561.
What is the Median Family Income in Live Oak?
Median Family Income in Live Oak is $85,250.
What is the Median Household income in Live Oak?
Median Household Income in Live Oak is $74,326.
What is Income or Wage Gap in Live Oak?
Income or Wage Gap in Live Oak is 20.6%.
Women in Live Oak earn 79.4 cents for every dollar earned by a man.
What is Family Income Deficit in Live Oak?
Family Income Deficit in Live Oak is $11,934.
Families that are below poverty line in Live Oak earn $11,934 less on average than the poverty threshold level.
What is Inequality or Gini Index in Live Oak?
Inequality or Gini Index in Live Oak is 0.37.
What is the Total Population of Live Oak?
Total Population of Live Oak is 15,726.
What is the Total Male Population of Live Oak?
Total Male Population of Live Oak is 7,439.
What is the Total Female Population of Live Oak?
Total Female Population of Live Oak is 8,287.
What is the Ratio of Males per 100 Females in Live Oak?
There are 89.77 Males per 100 Females in Live Oak.
What is the Ratio of Females per 100 Males in Live Oak?
There are 111.40 Females per 100 Males in Live Oak.
What is the Median Population Age in Live Oak?
Median Population Age in Live Oak is 33.7 Years.
What is the Average Family Size in Live Oak
Average Family Size in Live Oak is 3.0 People.
What is the Average Household Size in Live Oak
Average Household Size in Live Oak is 2.4 People.
How Large is the Labor Force in Live Oak?
There are 8,615 People in the Labor Forcein in Live Oak.
What is the Percentage of People in the Labor Force in Live Oak?
69.7% of People are in the Labor Force in Live Oak.
What is the Unemployment Rate in Live Oak?
Unemployment Rate in Live Oak is 5.5%.