Buffalo Springs, TX Map & Demographics
Buffalo Springs Map
Buffalo Springs Overview
$45,889
PER CAPITA INCOME
$120,556
AVG FAMILY INCOME
$67,917
AVG HOUSEHOLD INCOME
27.7%
WAGE / INCOME GAP [ % ]
72.3¢/ $1
WAGE / INCOME GAP [ $ ]
0.45
INEQUALITY / GINI INDEX
530
TOTAL POPULATION
286
MALE POPULATION
244
FEMALE POPULATION
117.21
MALES / 100 FEMALES
85.31
FEMALES / 100 MALES
52.1
MEDIAN AGE
2.9
AVG FAMILY SIZE
2.1
AVG HOUSEHOLD SIZE
320
LABOR FORCE [ PEOPLE ]
70.2%
PERCENT IN LABOR FORCE
Buffalo Springs Area Codes
Income in Buffalo Springs
Income Overview in Buffalo Springs
Per Capita Income in Buffalo Springs is $45,889, while median incomes of families and households are $120,556 and $67,917 respectively.
| Characteristic | Number | Measure |
| Per Capita Income | 530 | $45,889 |
| Median Family Income | 138 | $120,556 |
| Mean Family Income | 138 | $141,960 |
| Median Household Income | 249 | $67,917 |
| Mean Household Income | 249 | $98,094 |
| Income Deficit | 138 | $0 |
| Wage / Income Gap (%) | 530 | 27.73% |
| Wage / Income Gap ($) | 530 | 72.27¢ per $1 |
| Gini / Inequality Index | 530 | 0.45 |
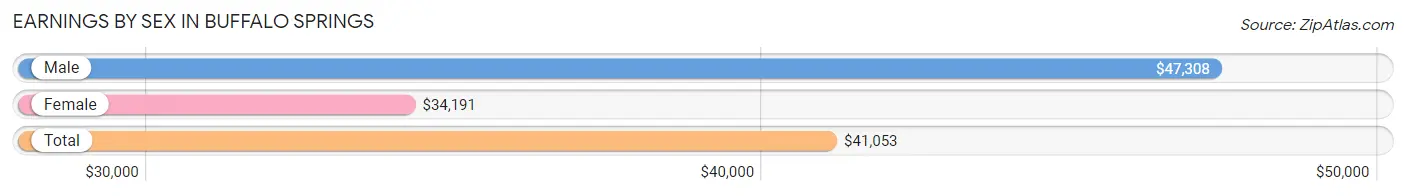
Earnings by Sex in Buffalo Springs
Average Earnings in Buffalo Springs are $41,053, $47,308 for men and $34,191 for women, a difference of 27.7%.
| Sex | Number | Average Earnings |
| Male | 192 (56.8%) | $47,308 |
| Female | 146 (43.2%) | $34,191 |
| Total | 338 (100.0%) | $41,053 |
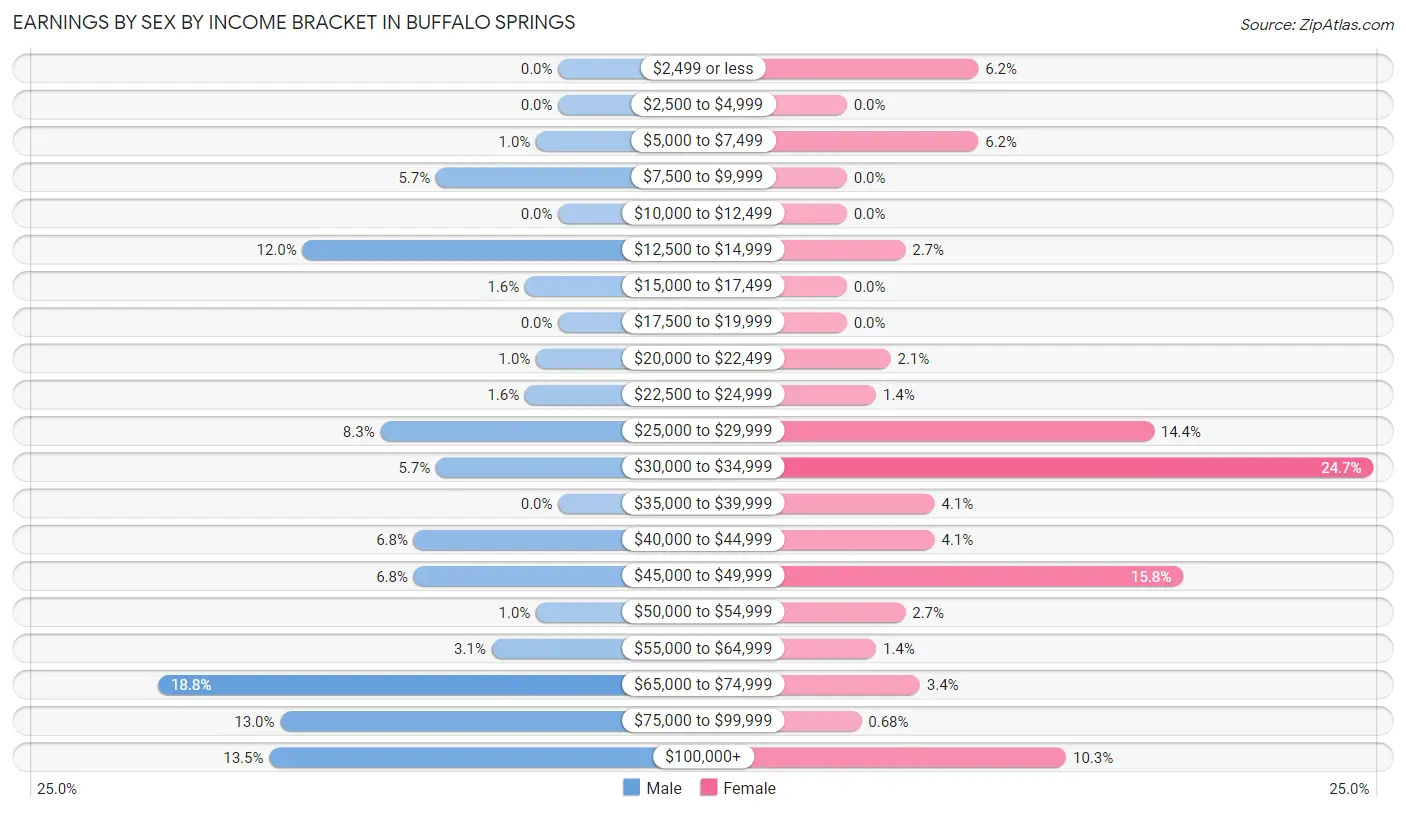
Earnings by Sex by Income Bracket in Buffalo Springs
The most common earnings brackets in Buffalo Springs are $65,000 to $74,999 for men (36 | 18.8%) and $30,000 to $34,999 for women (36 | 24.7%).
| Income | Male | Female |
| $2,499 or less | 0 (0.0%) | 9 (6.2%) |
| $2,500 to $4,999 | 0 (0.0%) | 0 (0.0%) |
| $5,000 to $7,499 | 2 (1.0%) | 9 (6.2%) |
| $7,500 to $9,999 | 11 (5.7%) | 0 (0.0%) |
| $10,000 to $12,499 | 0 (0.0%) | 0 (0.0%) |
| $12,500 to $14,999 | 23 (12.0%) | 4 (2.7%) |
| $15,000 to $17,499 | 3 (1.6%) | 0 (0.0%) |
| $17,500 to $19,999 | 0 (0.0%) | 0 (0.0%) |
| $20,000 to $22,499 | 2 (1.0%) | 3 (2.1%) |
| $22,500 to $24,999 | 3 (1.6%) | 2 (1.4%) |
| $25,000 to $29,999 | 16 (8.3%) | 21 (14.4%) |
| $30,000 to $34,999 | 11 (5.7%) | 36 (24.7%) |
| $35,000 to $39,999 | 0 (0.0%) | 6 (4.1%) |
| $40,000 to $44,999 | 13 (6.8%) | 6 (4.1%) |
| $45,000 to $49,999 | 13 (6.8%) | 23 (15.8%) |
| $50,000 to $54,999 | 2 (1.0%) | 4 (2.7%) |
| $55,000 to $64,999 | 6 (3.1%) | 2 (1.4%) |
| $65,000 to $74,999 | 36 (18.8%) | 5 (3.4%) |
| $75,000 to $99,999 | 25 (13.0%) | 1 (0.7%) |
| $100,000+ | 26 (13.5%) | 15 (10.3%) |
| Total | 192 (100.0%) | 146 (100.0%) |
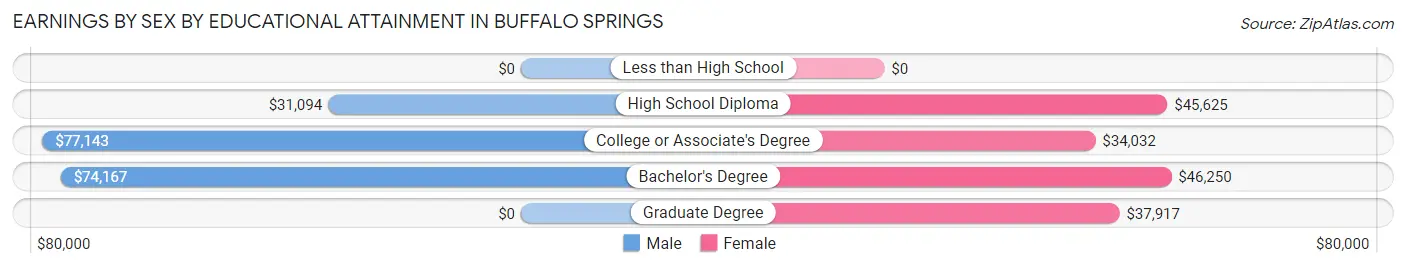
Earnings by Sex by Educational Attainment in Buffalo Springs
Average earnings in Buffalo Springs are $73,229 for men and $34,449 for women, a difference of 53.0%. Men with an educational attainment of college or associate's degree enjoy the highest average annual earnings of $77,143, while those with high school diploma education earn the least with $31,094. Women with an educational attainment of bachelor's degree earn the most with the average annual earnings of $46,250, while those with college or associate's degree education have the smallest earnings of $34,032.
| Educational Attainment | Male Income | Female Income |
| Less than High School | - | - |
| High School Diploma | $31,094 | $45,625 |
| College or Associate's Degree | $77,143 | $34,032 |
| Bachelor's Degree | $74,167 | $46,250 |
| Graduate Degree | - | - |
| Total | $73,229 | $34,449 |
Family Income in Buffalo Springs
Family Income Brackets in Buffalo Springs
According to the Buffalo Springs family income data, there are 62 families falling into the $100,000 to $149,999 income range, which is the most common income bracket and makes up 44.9% of all families.
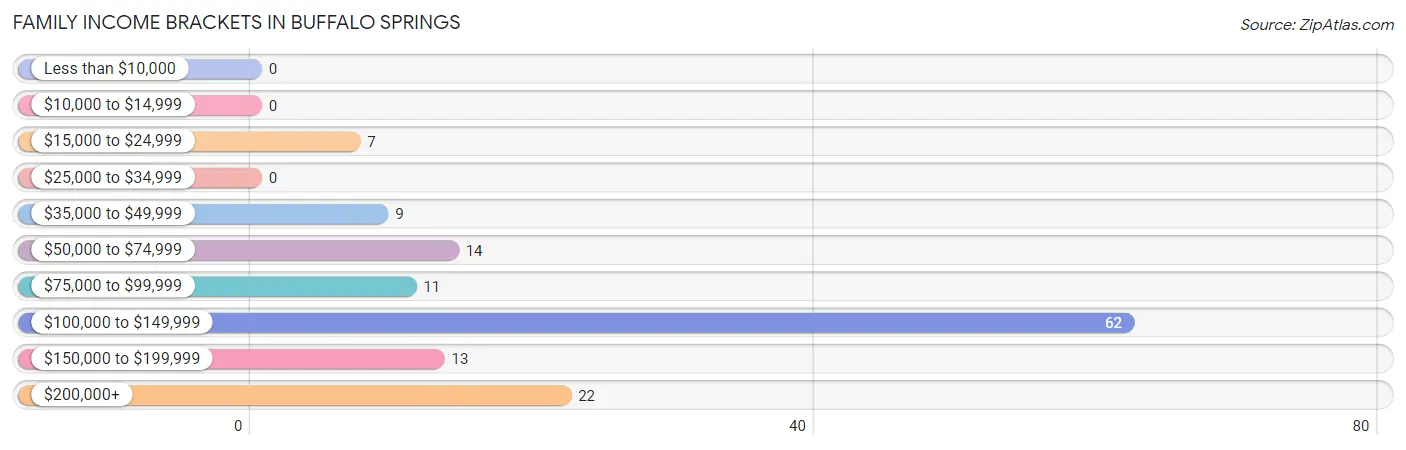
| Income Bracket | # Families | % Families |
| Less than $10,000 | 0 | 0.0% |
| $10,000 to $14,999 | 0 | 0.0% |
| $15,000 to $24,999 | 7 | 5.1% |
| $25,000 to $34,999 | 0 | 0.0% |
| $35,000 to $49,999 | 9 | 6.5% |
| $50,000 to $74,999 | 14 | 10.1% |
| $75,000 to $99,999 | 11 | 8.0% |
| $100,000 to $149,999 | 62 | 44.9% |
| $150,000 to $199,999 | 13 | 9.4% |
| $200,000+ | 22 | 15.9% |
Family Income by Famaliy Size in Buffalo Springs
2-person families (70 | 50.7%) account for the highest median family income in Buffalo Springs with $130,000 per family, while 2-person families (70 | 50.7%) have the highest median income of $65,000 per family member.
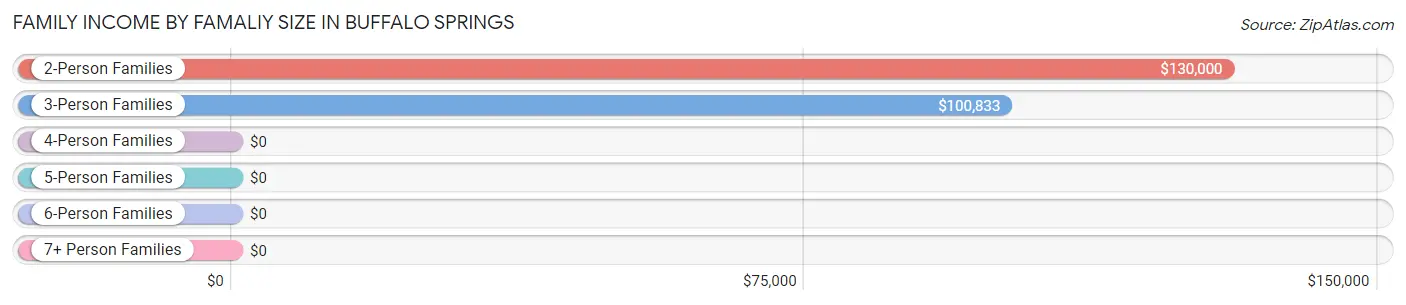
| Income Bracket | # Families | Median Income |
| 2-Person Families | 70 (50.7%) | $130,000 |
| 3-Person Families | 32 (23.2%) | $100,833 |
| 4-Person Families | 0 (0.0%) | $0 |
| 5-Person Families | 36 (26.1%) | $0 |
| 6-Person Families | 0 (0.0%) | $0 |
| 7+ Person Families | 0 (0.0%) | $0 |
| Total | 138 (100.0%) | $120,556 |
Family Income by Number of Earners in Buffalo Springs
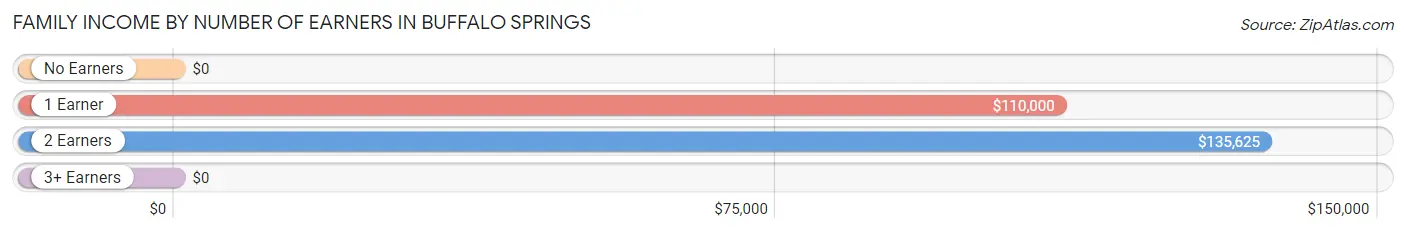
| Number of Earners | # Families | Median Income |
| No Earners | 14 (10.1%) | $0 |
| 1 Earner | 26 (18.8%) | $110,000 |
| 2 Earners | 59 (42.7%) | $135,625 |
| 3+ Earners | 39 (28.3%) | $0 |
| Total | 138 (100.0%) | $120,556 |
Household Income in Buffalo Springs
Household Income Brackets in Buffalo Springs
With 64 households falling in the category, the $100,000 to $149,999 income range is the most frequent in Buffalo Springs, accounting for 25.7% of all households. In contrast, only 2 households (0.8%) fall into the $10,000 to $14,999 income bracket, making it the least populous group.
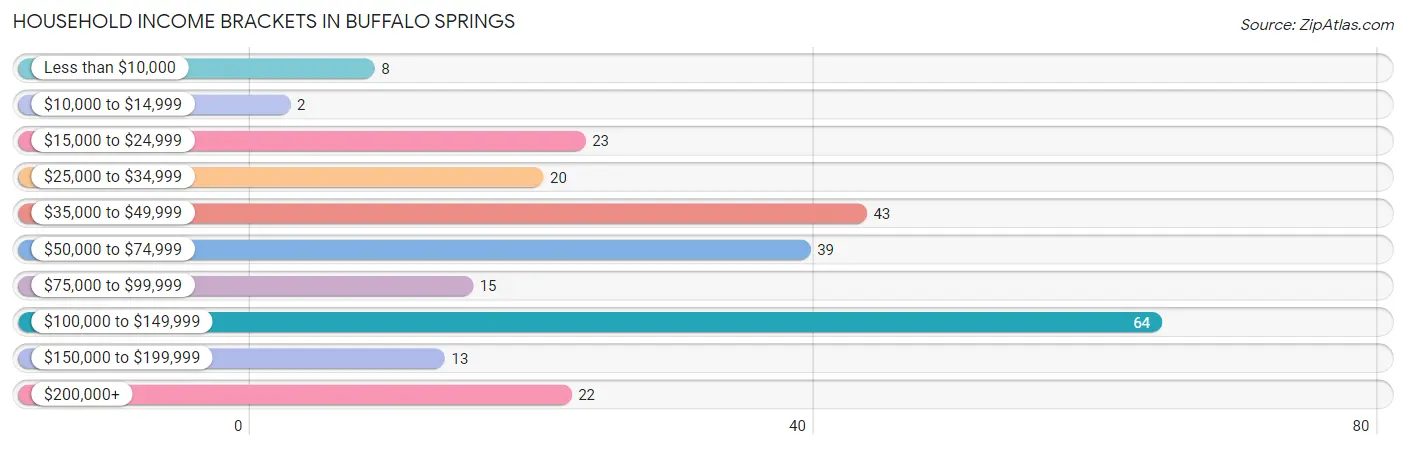
| Income Bracket | # Households | % Households |
| Less than $10,000 | 8 | 3.2% |
| $10,000 to $14,999 | 2 | 0.8% |
| $15,000 to $24,999 | 23 | 9.2% |
| $25,000 to $34,999 | 20 | 8.0% |
| $35,000 to $49,999 | 43 | 17.3% |
| $50,000 to $74,999 | 39 | 15.7% |
| $75,000 to $99,999 | 15 | 6.0% |
| $100,000 to $149,999 | 64 | 25.7% |
| $150,000 to $199,999 | 13 | 5.2% |
| $200,000+ | 22 | 8.8% |
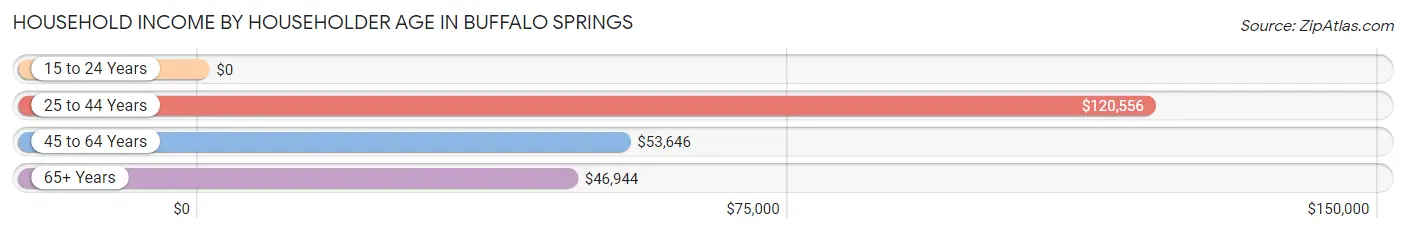
Household Income by Householder Age in Buffalo Springs
The median household income in Buffalo Springs is $67,917, with the highest median household income of $120,556 found in the 25 to 44 years age bracket for the primary householder. A total of 56 households (22.5%) fall into this category.
| Income Bracket | # Households | Median Income |
| 15 to 24 Years | 0 (0.0%) | $0 |
| 25 to 44 Years | 56 (22.5%) | $120,556 |
| 45 to 64 Years | 107 (43.0%) | $53,646 |
| 65+ Years | 86 (34.5%) | $46,944 |
| Total | 249 (100.0%) | $67,917 |
Poverty in Buffalo Springs
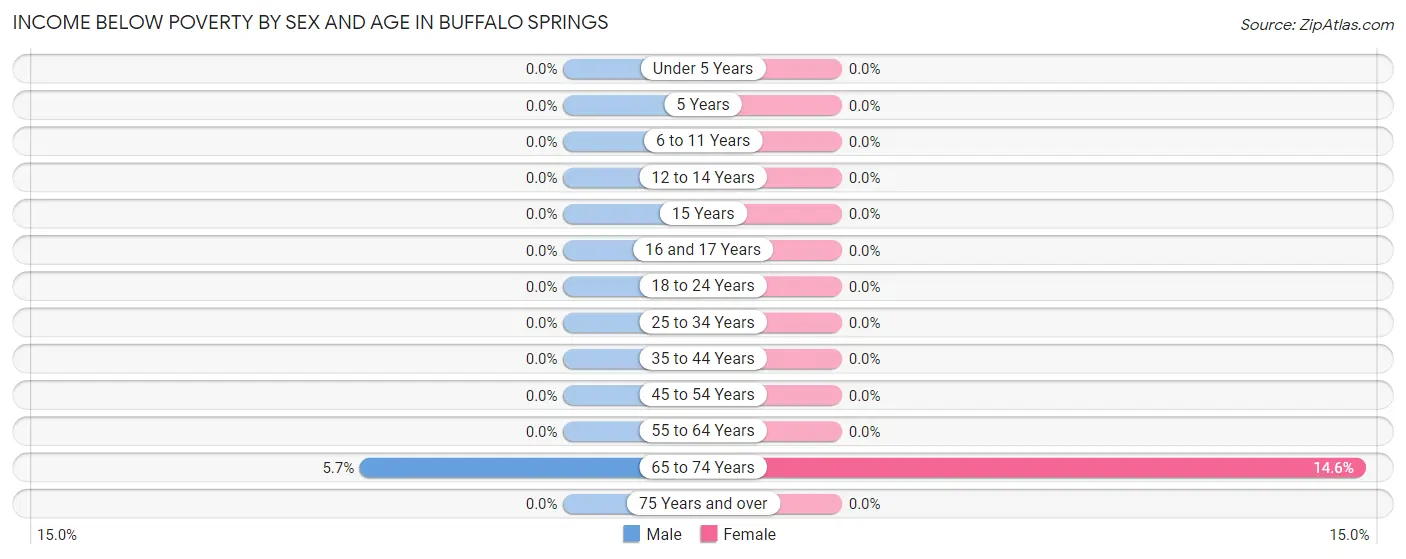
Income Below Poverty by Sex and Age in Buffalo Springs
With 1.1% poverty level for males and 2.9% for females among the residents of Buffalo Springs, 65 to 74 year old males and 65 to 74 year old females are the most vulnerable to poverty, with 3 males (5.7%) and 7 females (14.6%) in their respective age groups living below the poverty level.
| Age Bracket | Male | Female |
| Under 5 Years | 0 (0.0%) | 0 (0.0%) |
| 5 Years | 0 (0.0%) | 0 (0.0%) |
| 6 to 11 Years | 0 (0.0%) | 0 (0.0%) |
| 12 to 14 Years | 0 (0.0%) | 0 (0.0%) |
| 15 Years | 0 (0.0%) | 0 (0.0%) |
| 16 and 17 Years | 0 (0.0%) | 0 (0.0%) |
| 18 to 24 Years | 0 (0.0%) | 0 (0.0%) |
| 25 to 34 Years | 0 (0.0%) | 0 (0.0%) |
| 35 to 44 Years | 0 (0.0%) | 0 (0.0%) |
| 45 to 54 Years | 0 (0.0%) | 0 (0.0%) |
| 55 to 64 Years | 0 (0.0%) | 0 (0.0%) |
| 65 to 74 Years | 3 (5.7%) | 7 (14.6%) |
| 75 Years and over | 0 (0.0%) | 0 (0.0%) |
| Total | 3 (1.1%) | 7 (2.9%) |
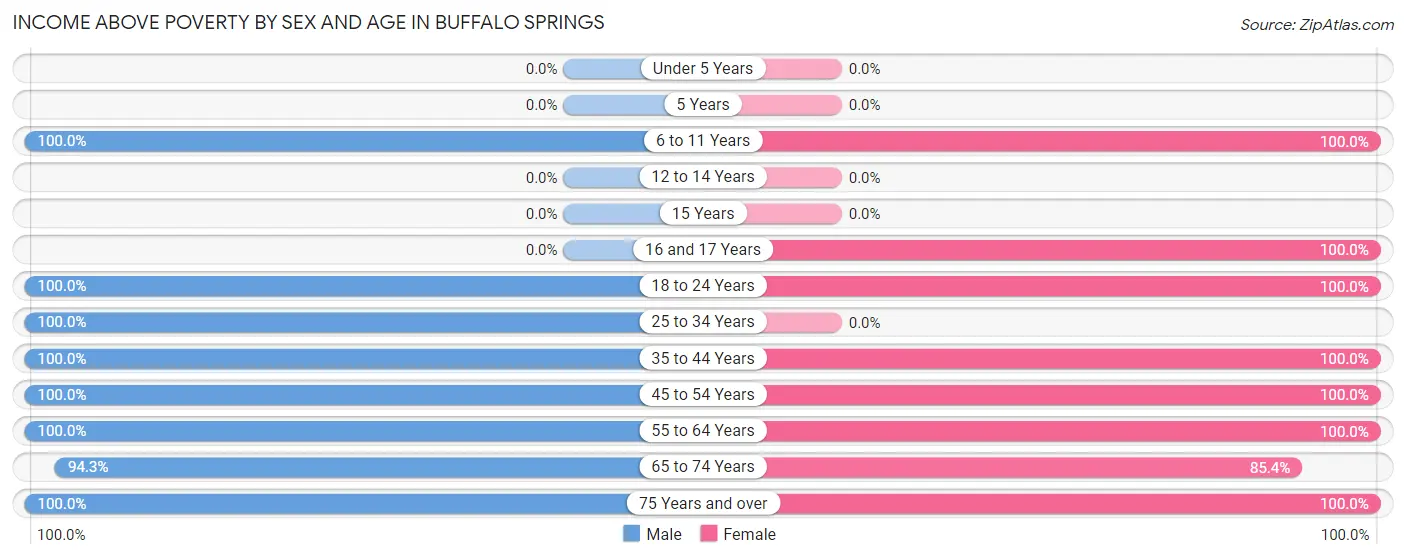
Income Above Poverty by Sex and Age in Buffalo Springs
According to the poverty statistics in Buffalo Springs, males aged 6 to 11 years and females aged 6 to 11 years are the age groups that are most secure financially, with 100.0% of males and 100.0% of females in these age groups living above the poverty line.
| Age Bracket | Male | Female |
| Under 5 Years | 0 (0.0%) | 0 (0.0%) |
| 5 Years | 0 (0.0%) | 0 (0.0%) |
| 6 to 11 Years | 38 (100.0%) | 36 (100.0%) |
| 12 to 14 Years | 0 (0.0%) | 0 (0.0%) |
| 15 Years | 0 (0.0%) | 0 (0.0%) |
| 16 and 17 Years | 0 (0.0%) | 4 (100.0%) |
| 18 to 24 Years | 45 (100.0%) | 15 (100.0%) |
| 25 to 34 Years | 7 (100.0%) | 0 (0.0%) |
| 35 to 44 Years | 60 (100.0%) | 43 (100.0%) |
| 45 to 54 Years | 18 (100.0%) | 32 (100.0%) |
| 55 to 64 Years | 54 (100.0%) | 50 (100.0%) |
| 65 to 74 Years | 50 (94.3%) | 41 (85.4%) |
| 75 Years and over | 11 (100.0%) | 16 (100.0%) |
| Total | 283 (99.0%) | 237 (97.1%) |
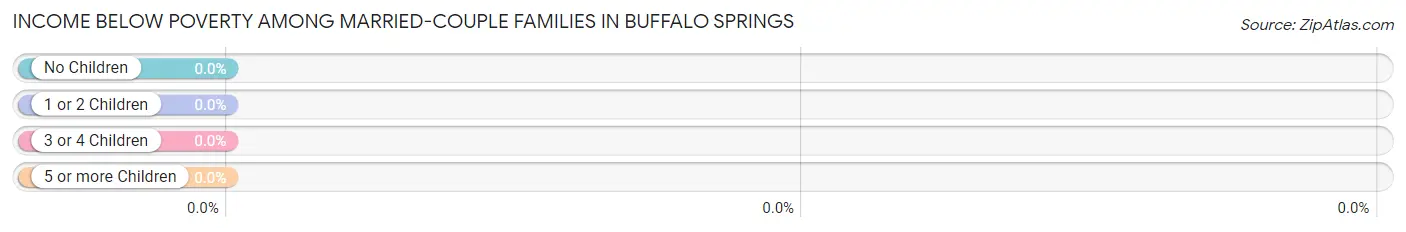
Income Below Poverty Among Married-Couple Families in Buffalo Springs
| Children | Above Poverty | Below Poverty |
| No Children | 90 (100.0%) | 0 (0.0%) |
| 1 or 2 Children | 43 (100.0%) | 0 (0.0%) |
| 3 or 4 Children | 0 (0.0%) | 0 (0.0%) |
| 5 or more Children | 0 (0.0%) | 0 (0.0%) |
| Total | 133 (100.0%) | 0 (0.0%) |
Income Below Poverty Among Single-Parent Households in Buffalo Springs
| Children | Single Father | Single Mother |
| No Children | 0 (0.0%) | 0 (0.0%) |
| 1 or 2 Children | 0 (0.0%) | 0 (0.0%) |
| 3 or 4 Children | 0 (0.0%) | 0 (0.0%) |
| 5 or more Children | 0 (0.0%) | 0 (0.0%) |
| Total | 0 (0.0%) | 0 (0.0%) |
Income Below Poverty Among Married-Couple vs Single-Parent Households in Buffalo Springs
| Children | Married-Couple Families | Single-Parent Households |
| No Children | 0 (0.0%) | 0 (0.0%) |
| 1 or 2 Children | 0 (0.0%) | 0 (0.0%) |
| 3 or 4 Children | 0 (0.0%) | 0 (0.0%) |
| 5 or more Children | 0 (0.0%) | 0 (0.0%) |
| Total | 0 (0.0%) | 0 (0.0%) |
Race in Buffalo Springs
The most populous races in Buffalo Springs are White / Caucasian (485 | 91.5%), Hispanic or Latino (226 | 42.6%), and Two or more Races (26 | 4.9%).
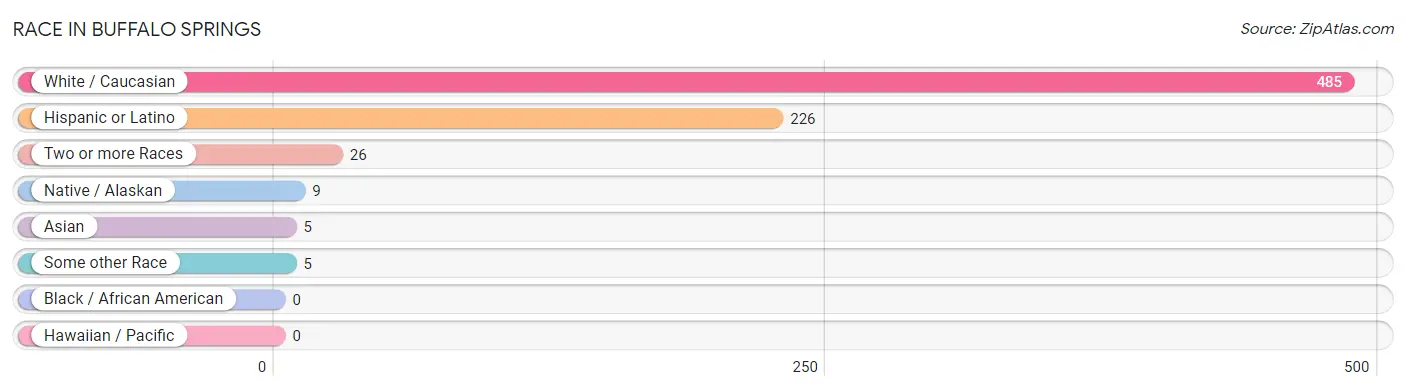
| Race | # Population | % Population |
| Asian | 5 | 0.9% |
| Black / African American | 0 | 0.0% |
| Hawaiian / Pacific | 0 | 0.0% |
| Hispanic or Latino | 226 | 42.6% |
| Native / Alaskan | 9 | 1.7% |
| White / Caucasian | 485 | 91.5% |
| Two or more Races | 26 | 4.9% |
| Some other Race | 5 | 0.9% |
| Total | 530 | 100.0% |
Ancestry in Buffalo Springs
The most populous ancestries reported in Buffalo Springs are Mexican (217 | 40.9%), Irish (78 | 14.7%), German (44 | 8.3%), American (39 | 7.4%), and English (36 | 6.8%), together accounting for 78.1% of all Buffalo Springs residents.
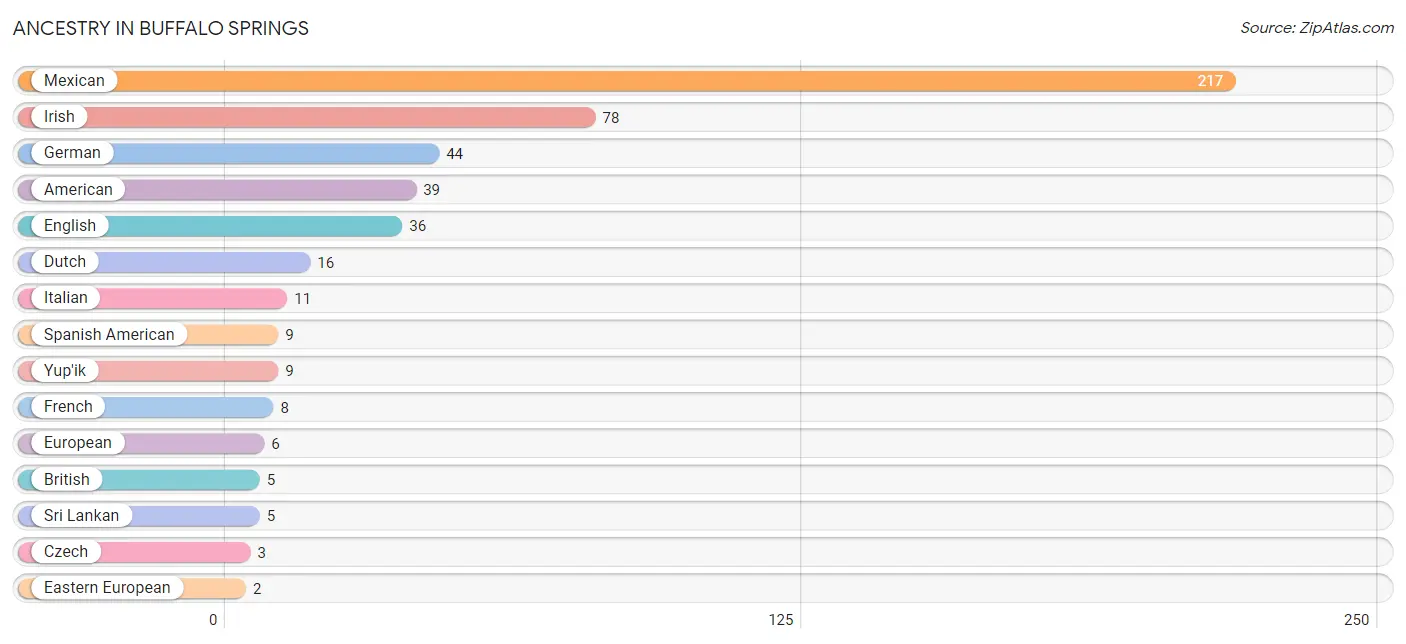
| Ancestry | # Population | % Population |
| American | 39 | 7.4% |
| British | 5 | 0.9% |
| Czech | 3 | 0.6% |
| Dutch | 16 | 3.0% |
| Eastern European | 2 | 0.4% |
| English | 36 | 6.8% |
| European | 6 | 1.1% |
| French | 8 | 1.5% |
| German | 44 | 8.3% |
| Irish | 78 | 14.7% |
| Italian | 11 | 2.1% |
| Mexican | 217 | 40.9% |
| Norwegian | 2 | 0.4% |
| Polish | 2 | 0.4% |
| Scotch-Irish | 2 | 0.4% |
| Spanish American | 9 | 1.7% |
| Sri Lankan | 5 | 0.9% |
| Swedish | 2 | 0.4% |
| Swiss | 2 | 0.4% |
| Yup'ik | 9 | 1.7% | View All 20 Rows |
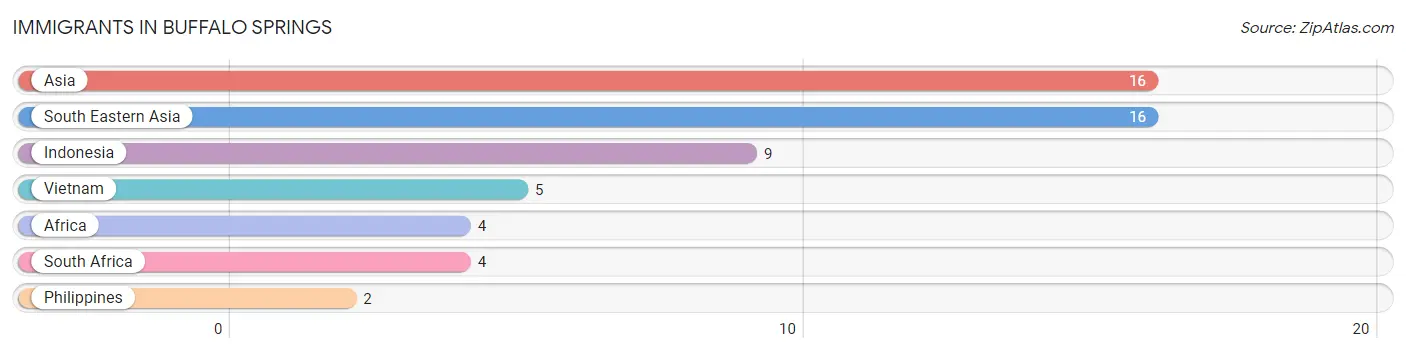
Immigrants in Buffalo Springs
The most numerous immigrant groups reported in Buffalo Springs came from Asia (16 | 3.0%), South Eastern Asia (16 | 3.0%), Indonesia (9 | 1.7%), Vietnam (5 | 0.9%), and Africa (4 | 0.7%), together accounting for 9.4% of all Buffalo Springs residents.
| Immigration Origin | # Population | % Population |
| Africa | 4 | 0.7% |
| Asia | 16 | 3.0% |
| Indonesia | 9 | 1.7% |
| Philippines | 2 | 0.4% |
| South Africa | 4 | 0.7% |
| South Eastern Asia | 16 | 3.0% |
| Vietnam | 5 | 0.9% | View All 7 Rows |
Sex and Age in Buffalo Springs
Sex and Age in Buffalo Springs
The most populous age groups in Buffalo Springs are 35 to 39 Years (42 | 14.7%) for men and 5 to 9 Years (36 | 14.7%) for women.
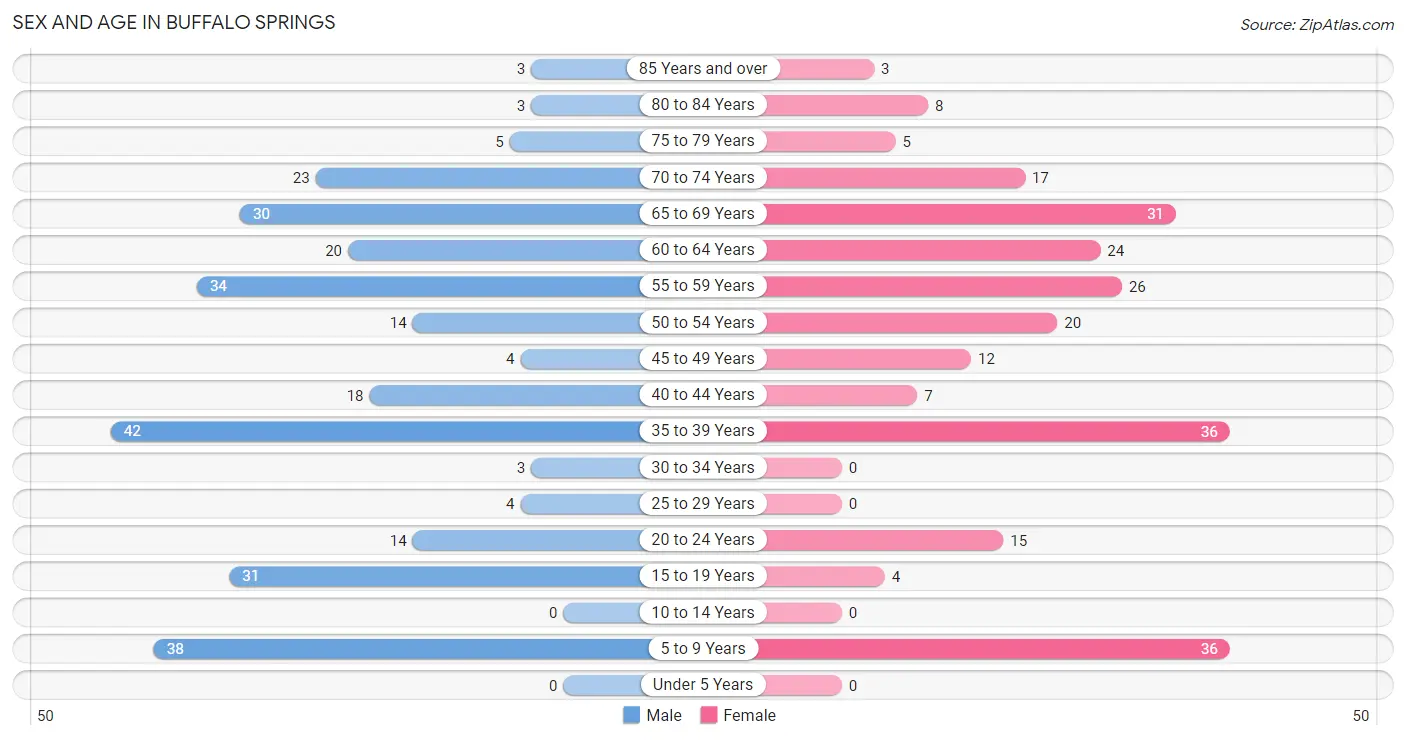
| Age Bracket | Male | Female |
| Under 5 Years | 0 (0.0%) | 0 (0.0%) |
| 5 to 9 Years | 38 (13.3%) | 36 (14.7%) |
| 10 to 14 Years | 0 (0.0%) | 0 (0.0%) |
| 15 to 19 Years | 31 (10.8%) | 4 (1.6%) |
| 20 to 24 Years | 14 (4.9%) | 15 (6.1%) |
| 25 to 29 Years | 4 (1.4%) | 0 (0.0%) |
| 30 to 34 Years | 3 (1.1%) | 0 (0.0%) |
| 35 to 39 Years | 42 (14.7%) | 36 (14.7%) |
| 40 to 44 Years | 18 (6.3%) | 7 (2.9%) |
| 45 to 49 Years | 4 (1.4%) | 12 (4.9%) |
| 50 to 54 Years | 14 (4.9%) | 20 (8.2%) |
| 55 to 59 Years | 34 (11.9%) | 26 (10.7%) |
| 60 to 64 Years | 20 (7.0%) | 24 (9.8%) |
| 65 to 69 Years | 30 (10.5%) | 31 (12.7%) |
| 70 to 74 Years | 23 (8.0%) | 17 (7.0%) |
| 75 to 79 Years | 5 (1.8%) | 5 (2.1%) |
| 80 to 84 Years | 3 (1.1%) | 8 (3.3%) |
| 85 Years and over | 3 (1.1%) | 3 (1.2%) |
| Total | 286 (100.0%) | 244 (100.0%) |
Families and Households in Buffalo Springs
Median Family Size in Buffalo Springs
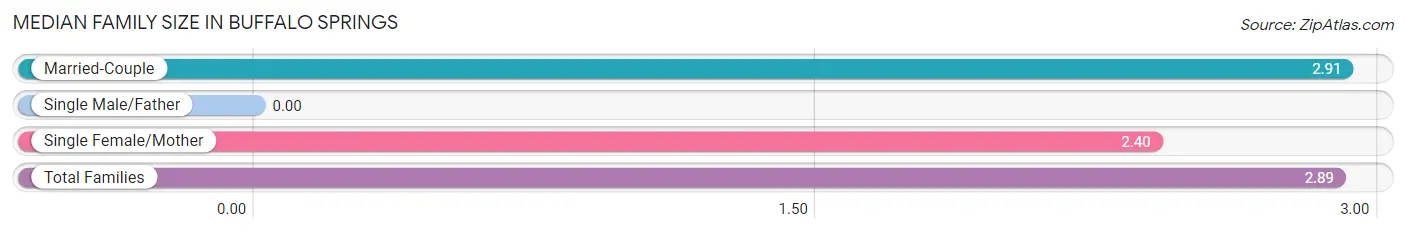
| Family Type | # Families | Family Size |
| Married-Couple | 133 (96.4%) | 2.91 |
| Single Male/Father | 0 (0.0%) | - |
| Single Female/Mother | 5 (3.6%) | 2.40 |
| Total Families | 138 (100.0%) | 2.89 |
Median Household Size in Buffalo Springs
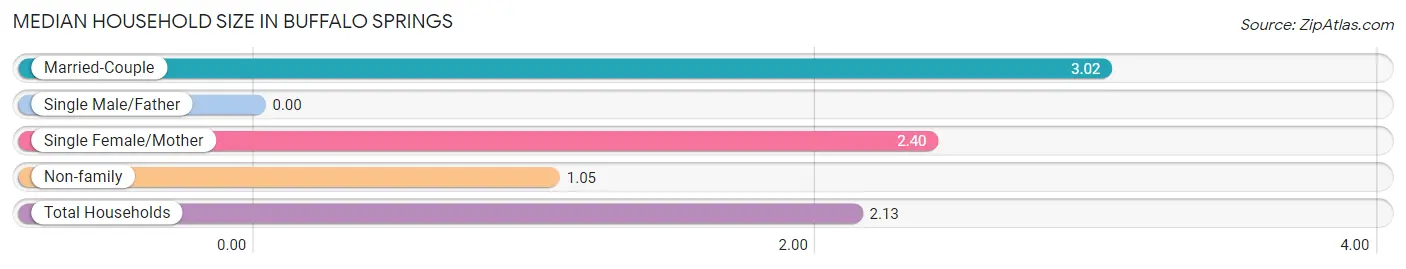
| Household Type | # Households | Household Size |
| Married-Couple | 133 (53.4%) | 3.02 |
| Single Male/Father | 0 (0.0%) | - |
| Single Female/Mother | 5 (2.0%) | 2.40 |
| Non-family | 111 (44.6%) | 1.05 |
| Total Households | 249 (100.0%) | 2.13 |
Household Size by Marriage Status in Buffalo Springs
Out of a total of 249 households in Buffalo Springs, 138 (55.4%) are family households, while 111 (44.6%) are nonfamily households. The most numerous type of family households are 2-person households, comprising 70, and the most common type of nonfamily households are 1-person households, comprising 107.
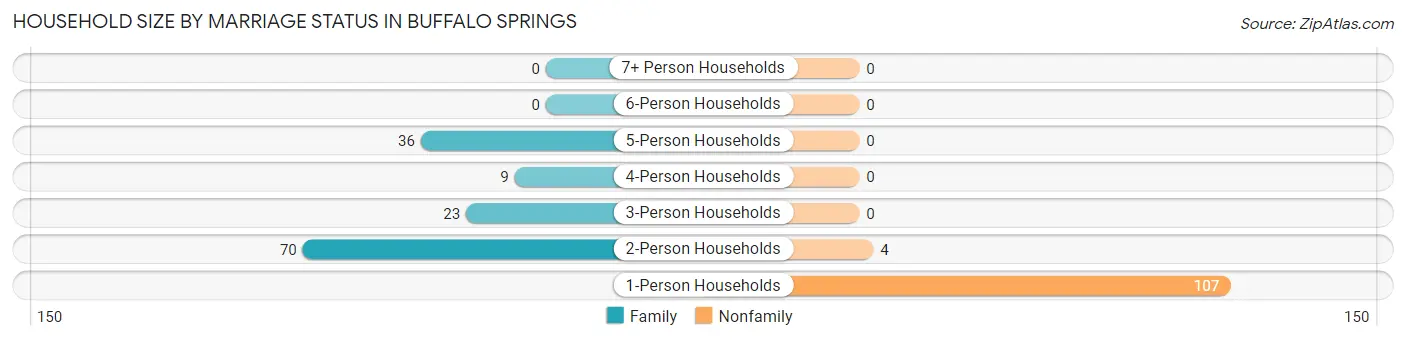
| Household Size | Family Households | Nonfamily Households |
| 1-Person Households | - | 107 (43.0%) |
| 2-Person Households | 70 (28.1%) | 4 (1.6%) |
| 3-Person Households | 23 (9.2%) | 0 (0.0%) |
| 4-Person Households | 9 (3.6%) | 0 (0.0%) |
| 5-Person Households | 36 (14.5%) | 0 (0.0%) |
| 6-Person Households | 0 (0.0%) | 0 (0.0%) |
| 7+ Person Households | 0 (0.0%) | 0 (0.0%) |
| Total | 138 (55.4%) | 111 (44.6%) |
Female Fertility in Buffalo Springs
Fertility by Age in Buffalo Springs
| Age Bracket | Women with Births | Births / 1,000 Women |
| 15 to 19 years | 0 (0.0%) | 0.0 |
| 20 to 34 years | 0 (0.0%) | 0.0 |
| 35 to 50 years | 0 (0.0%) | 0.0 |
| Total | 0 (0.0%) | 0.0 |
Fertility by Age by Marriage Status in Buffalo Springs
| Age Bracket | Married | Unmarried |
| 15 to 19 years | 0 (0.0%) | 0 (0.0%) |
| 20 to 34 years | 0 (0.0%) | 0 (0.0%) |
| 35 to 50 years | 0 (0.0%) | 0 (0.0%) |
| Total | 0 (0.0%) | 0 (0.0%) |
Fertility by Education in Buffalo Springs
| Educational Attainment | Women with Births | Births / 1,000 Women |
| Less than High School | 0 (0.0%) | 0.0 |
| High School Diploma | 0 (0.0%) | 0.0 |
| College or Associate's Degree | 0 (0.0%) | 0.0 |
| Bachelor's Degree | 0 (0.0%) | 0.0 |
| Graduate Degree | 0 (0.0%) | 0.0 |
| Total | 0 (0.0%) | 0.0 |
Fertility by Education by Marriage Status in Buffalo Springs
| Educational Attainment | Married | Unmarried |
| Less than High School | 0 (0.0%) | 0 (0.0%) |
| High School Diploma | 0 (0.0%) | 0 (0.0%) |
| College or Associate's Degree | 0 (0.0%) | 0 (0.0%) |
| Bachelor's Degree | 0 (0.0%) | 0 (0.0%) |
| Graduate Degree | 0 (0.0%) | 0 (0.0%) |
| Total | 0 (0.0%) | 0 (0.0%) |
Employment Characteristics in Buffalo Springs
Employment by Class of Employer in Buffalo Springs
Among the 320 employed individuals in Buffalo Springs, private company employees (204 | 63.7%), self-employed (not incorporated) (60 | 18.8%), and self-employed (incorporated) (30 | 9.4%) make up the most common classes of employment.
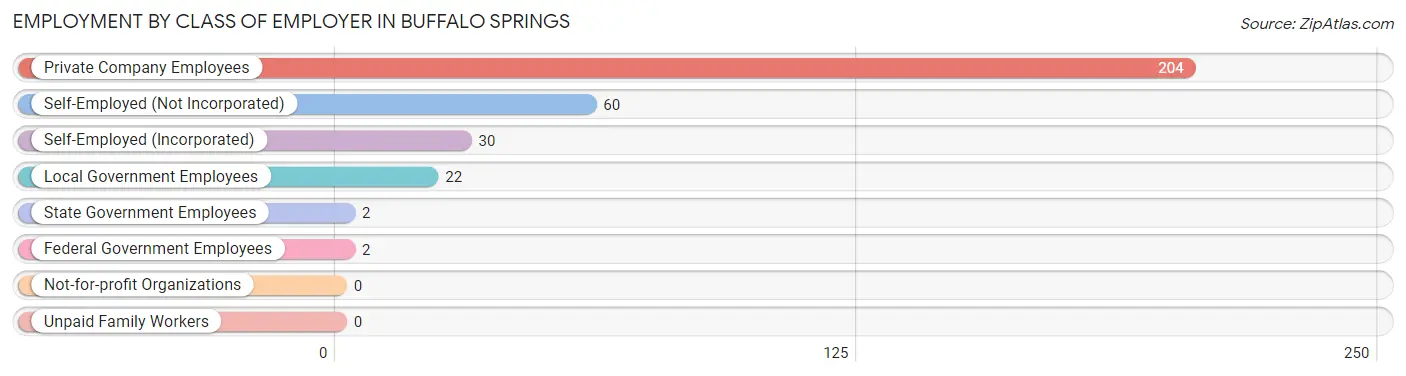
| Employer Class | # Employees | % Employees |
| Private Company Employees | 204 | 63.7% |
| Self-Employed (Incorporated) | 30 | 9.4% |
| Self-Employed (Not Incorporated) | 60 | 18.8% |
| Not-for-profit Organizations | 0 | 0.0% |
| Local Government Employees | 22 | 6.9% |
| State Government Employees | 2 | 0.6% |
| Federal Government Employees | 2 | 0.6% |
| Unpaid Family Workers | 0 | 0.0% |
| Total | 320 | 100.0% |
Employment Status by Age in Buffalo Springs
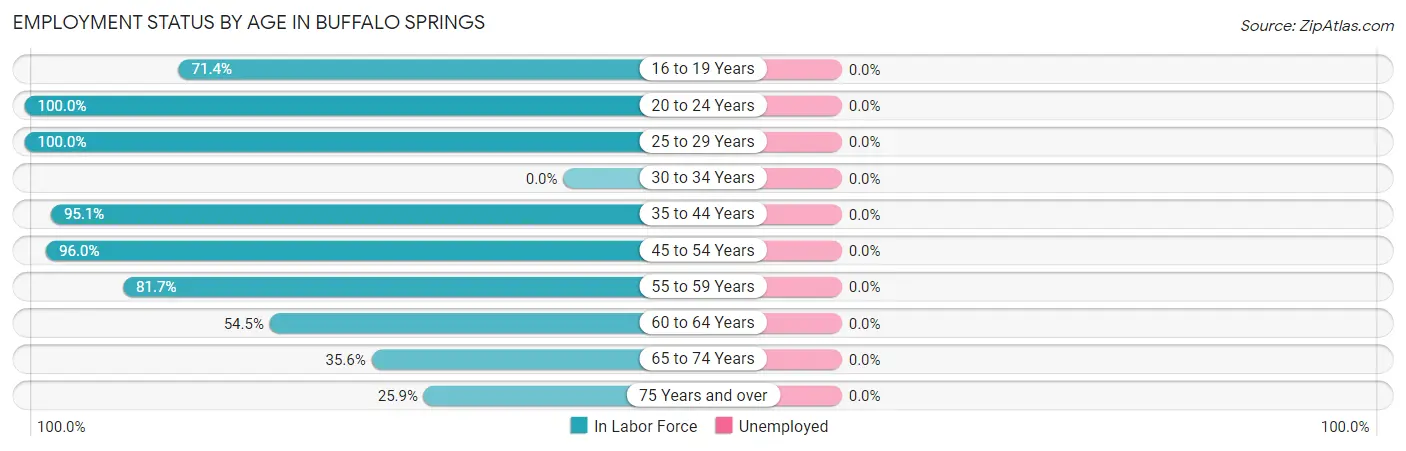
| Age Bracket | In Labor Force | Unemployed |
| 16 to 19 Years | 25 (71.4%) | 0 (0.0%) |
| 20 to 24 Years | 29 (100.0%) | 0 (0.0%) |
| 25 to 29 Years | 4 (100.0%) | 0 (0.0%) |
| 30 to 34 Years | 0 (0.0%) | 0 (0.0%) |
| 35 to 44 Years | 98 (95.1%) | 0 (0.0%) |
| 45 to 54 Years | 48 (96.0%) | 0 (0.0%) |
| 55 to 59 Years | 49 (81.7%) | 0 (0.0%) |
| 60 to 64 Years | 24 (54.5%) | 0 (0.0%) |
| 65 to 74 Years | 36 (35.6%) | 0 (0.0%) |
| 75 Years and over | 7 (25.9%) | 0 (0.0%) |
| Total | 320 (70.2%) | 0 (0.0%) |
Employment Status by Educational Attainment in Buffalo Springs
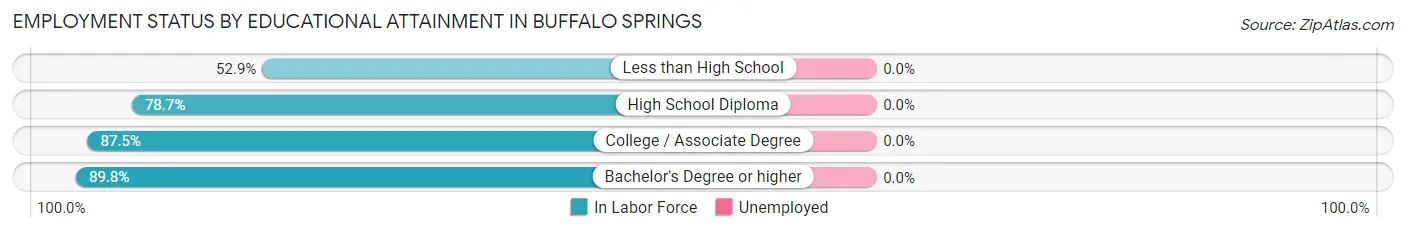
| Educational Attainment | In Labor Force | Unemployed |
| Less than High School | 9 (52.9%) | 0 (0.0%) |
| High School Diploma | 37 (78.7%) | 0 (0.0%) |
| College / Associate Degree | 98 (87.5%) | 0 (0.0%) |
| Bachelor's Degree or higher | 79 (89.8%) | 0 (0.0%) |
| Total | 223 (84.5%) | 0 (0.0%) |
Employment Occupations by Sex in Buffalo Springs
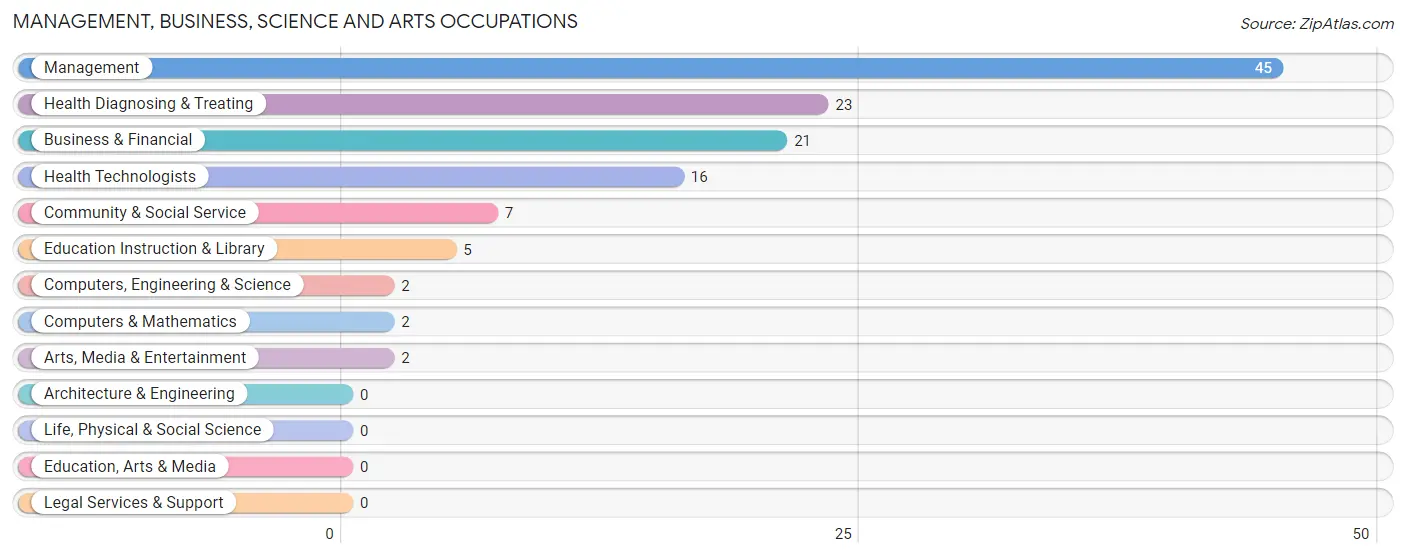
Management, Business, Science and Arts Occupations
The most common Management, Business, Science and Arts occupations in Buffalo Springs are Management (45 | 14.1%), Health Diagnosing & Treating (23 | 7.2%), Business & Financial (21 | 6.6%), Health Technologists (16 | 5.0%), and Community & Social Service (7 | 2.2%).
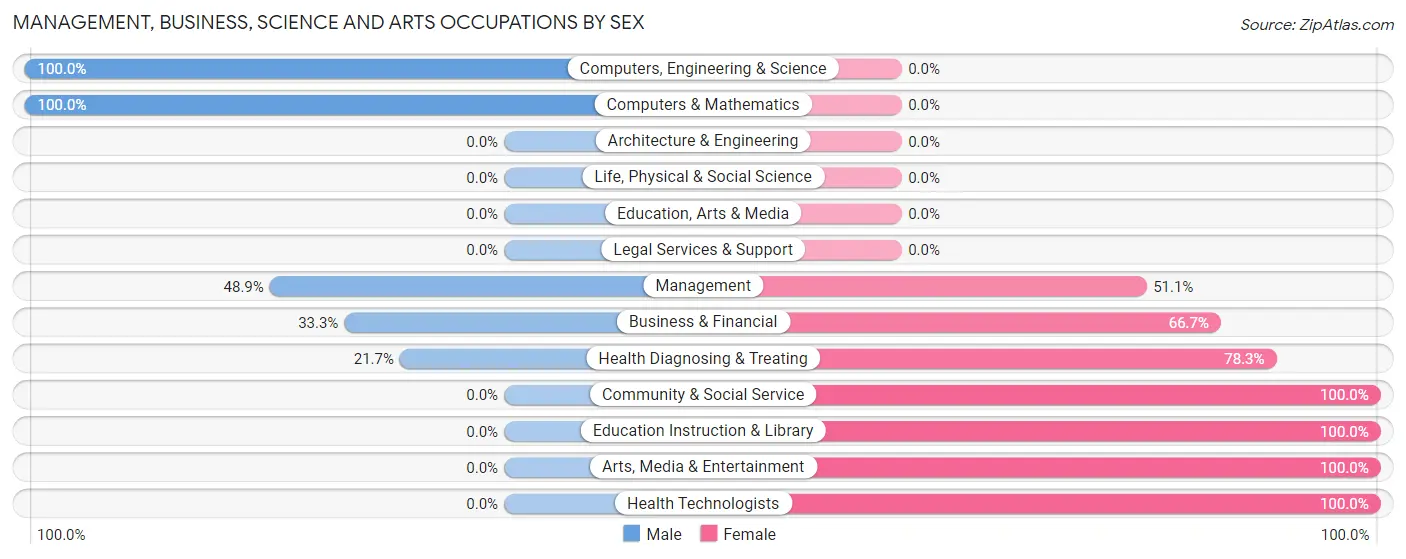
Management, Business, Science and Arts Occupations by Sex
Within the Management, Business, Science and Arts occupations in Buffalo Springs, the most male-oriented occupations are Computers, Engineering & Science (100.0%), Computers & Mathematics (100.0%), and Management (48.9%), while the most female-oriented occupations are Community & Social Service (100.0%), Education Instruction & Library (100.0%), and Arts, Media & Entertainment (100.0%).
| Occupation | Male | Female |
| Management | 22 (48.9%) | 23 (51.1%) |
| Business & Financial | 7 (33.3%) | 14 (66.7%) |
| Computers, Engineering & Science | 2 (100.0%) | 0 (0.0%) |
| Computers & Mathematics | 2 (100.0%) | 0 (0.0%) |
| Architecture & Engineering | 0 (0.0%) | 0 (0.0%) |
| Life, Physical & Social Science | 0 (0.0%) | 0 (0.0%) |
| Community & Social Service | 0 (0.0%) | 7 (100.0%) |
| Education, Arts & Media | 0 (0.0%) | 0 (0.0%) |
| Legal Services & Support | 0 (0.0%) | 0 (0.0%) |
| Education Instruction & Library | 0 (0.0%) | 5 (100.0%) |
| Arts, Media & Entertainment | 0 (0.0%) | 2 (100.0%) |
| Health Diagnosing & Treating | 5 (21.7%) | 18 (78.3%) |
| Health Technologists | 0 (0.0%) | 16 (100.0%) |
| Total (Category) | 36 (36.7%) | 62 (63.3%) |
| Total (Overall) | 180 (56.2%) | 140 (43.8%) |
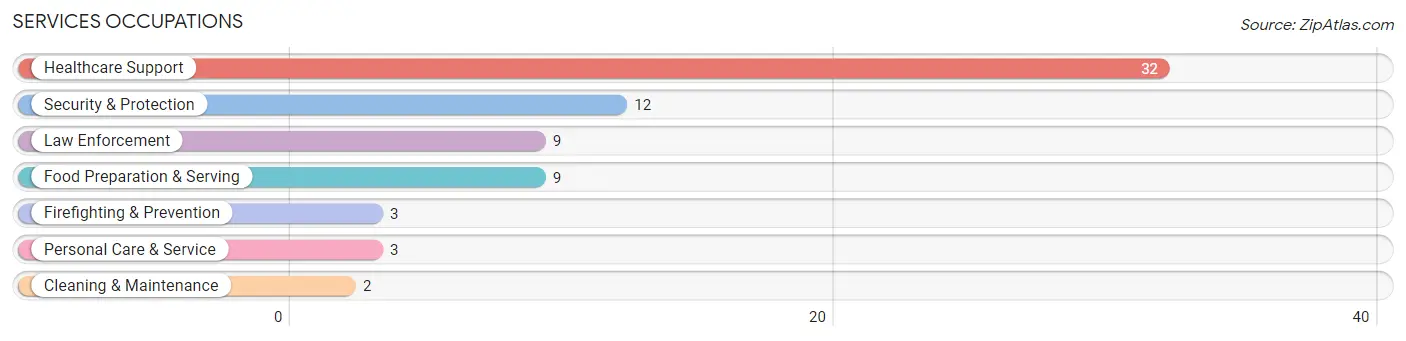
Services Occupations
The most common Services occupations in Buffalo Springs are Healthcare Support (32 | 10.0%), Security & Protection (12 | 3.7%), Law Enforcement (9 | 2.8%), Food Preparation & Serving (9 | 2.8%), and Firefighting & Prevention (3 | 0.9%).
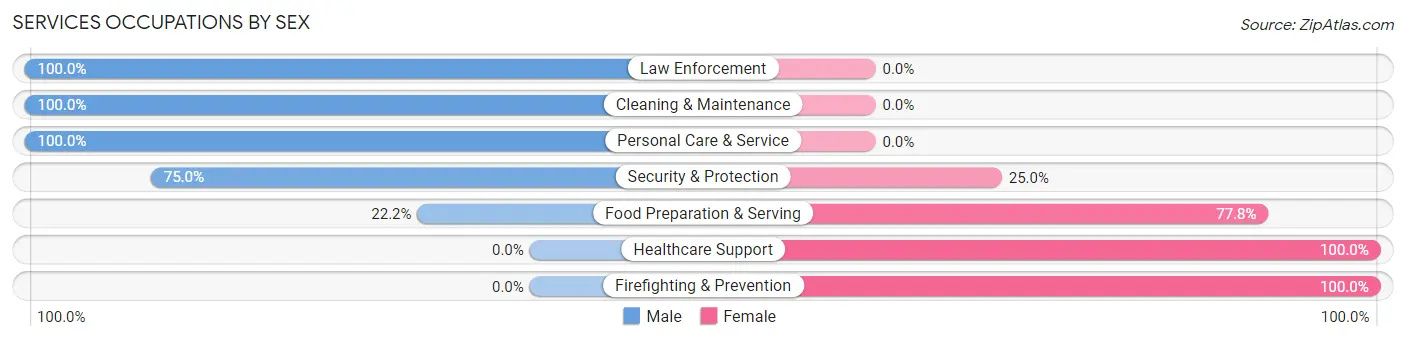
Services Occupations by Sex
Within the Services occupations in Buffalo Springs, the most male-oriented occupations are Law Enforcement (100.0%), Cleaning & Maintenance (100.0%), and Personal Care & Service (100.0%), while the most female-oriented occupations are Healthcare Support (100.0%), Firefighting & Prevention (100.0%), and Food Preparation & Serving (77.8%).
| Occupation | Male | Female |
| Healthcare Support | 0 (0.0%) | 32 (100.0%) |
| Security & Protection | 9 (75.0%) | 3 (25.0%) |
| Firefighting & Prevention | 0 (0.0%) | 3 (100.0%) |
| Law Enforcement | 9 (100.0%) | 0 (0.0%) |
| Food Preparation & Serving | 2 (22.2%) | 7 (77.8%) |
| Cleaning & Maintenance | 2 (100.0%) | 0 (0.0%) |
| Personal Care & Service | 3 (100.0%) | 0 (0.0%) |
| Total (Category) | 16 (27.6%) | 42 (72.4%) |
| Total (Overall) | 180 (56.2%) | 140 (43.8%) |
Sales and Office Occupations
The most common Sales and Office occupations in Buffalo Springs are Sales & Related (64 | 20.0%), and Office & Administration (26 | 8.1%).

Sales and Office Occupations by Sex

| Occupation | Male | Female |
| Sales & Related | 59 (92.2%) | 5 (7.8%) |
| Office & Administration | 0 (0.0%) | 26 (100.0%) |
| Total (Category) | 59 (65.6%) | 31 (34.4%) |
| Total (Overall) | 180 (56.2%) | 140 (43.8%) |
Natural Resources, Construction and Maintenance Occupations
The most common Natural Resources, Construction and Maintenance occupations in Buffalo Springs are Installation, Maintenance & Repair (23 | 7.2%), and Construction & Extraction (11 | 3.4%).
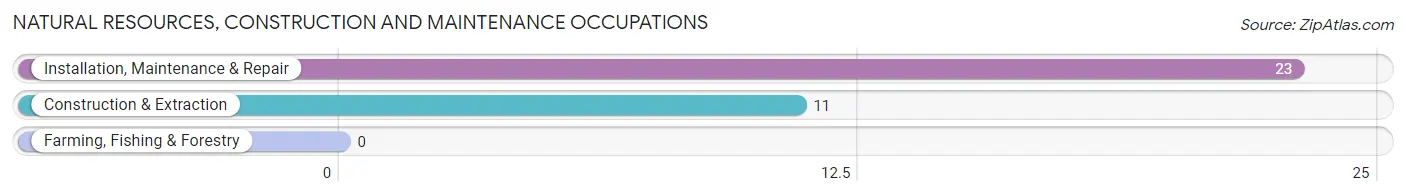
Natural Resources, Construction and Maintenance Occupations by Sex
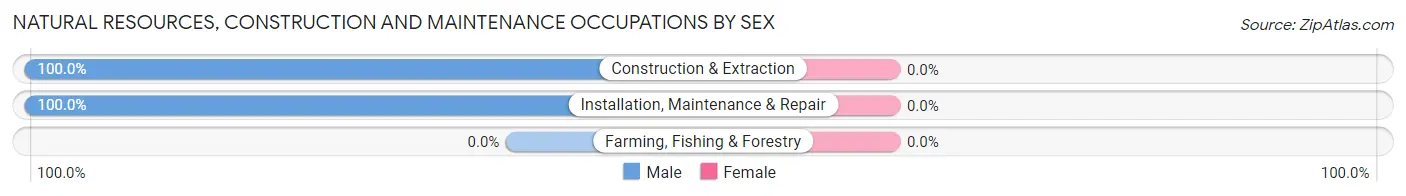
| Occupation | Male | Female |
| Farming, Fishing & Forestry | 0 (0.0%) | 0 (0.0%) |
| Construction & Extraction | 11 (100.0%) | 0 (0.0%) |
| Installation, Maintenance & Repair | 23 (100.0%) | 0 (0.0%) |
| Total (Category) | 34 (100.0%) | 0 (0.0%) |
| Total (Overall) | 180 (56.2%) | 140 (43.8%) |
Production, Transportation and Moving Occupations
The most common Production, Transportation and Moving occupations in Buffalo Springs are Material Moving (23 | 7.2%), Transportation (12 | 3.7%), and Production (5 | 1.6%).
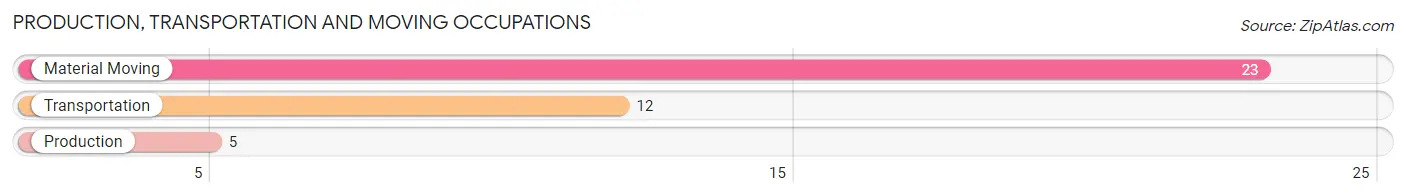
Production, Transportation and Moving Occupations by Sex
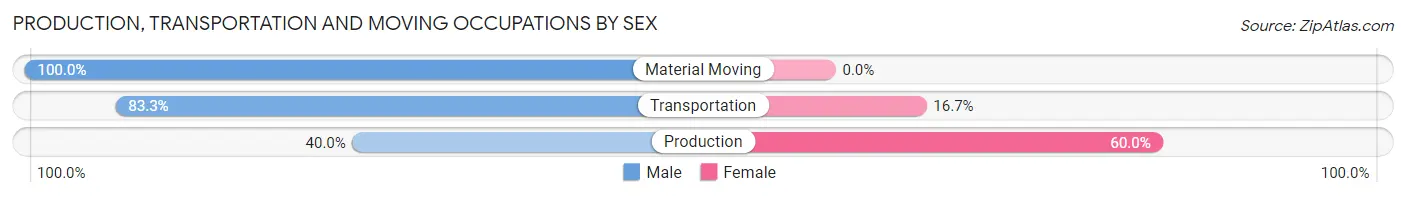
| Occupation | Male | Female |
| Production | 2 (40.0%) | 3 (60.0%) |
| Transportation | 10 (83.3%) | 2 (16.7%) |
| Material Moving | 23 (100.0%) | 0 (0.0%) |
| Total (Category) | 35 (87.5%) | 5 (12.5%) |
| Total (Overall) | 180 (56.2%) | 140 (43.8%) |
Employment Industries by Sex in Buffalo Springs
Employment Industries in Buffalo Springs
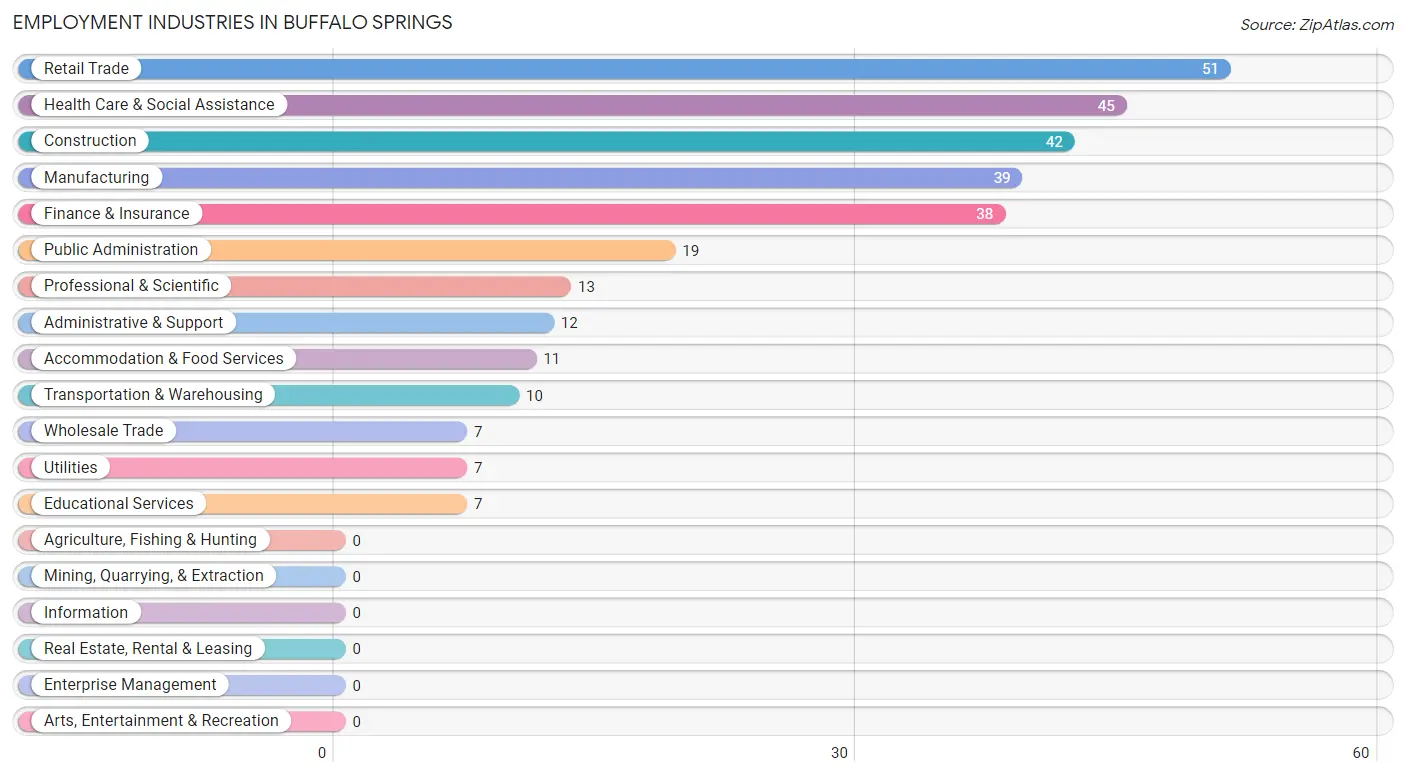
The major employment industries in Buffalo Springs include Retail Trade (51 | 15.9%), Health Care & Social Assistance (45 | 14.1%), Construction (42 | 13.1%), Manufacturing (39 | 12.2%), and Finance & Insurance (38 | 11.9%).
Employment Industries by Sex in Buffalo Springs
The Buffalo Springs industries that see more men than women are Transportation & Warehousing (100.0%), Finance & Insurance (94.7%), and Construction (90.5%), whereas the industries that tend to have a higher number of women are Wholesale Trade (100.0%), Utilities (100.0%), and Educational Services (100.0%).
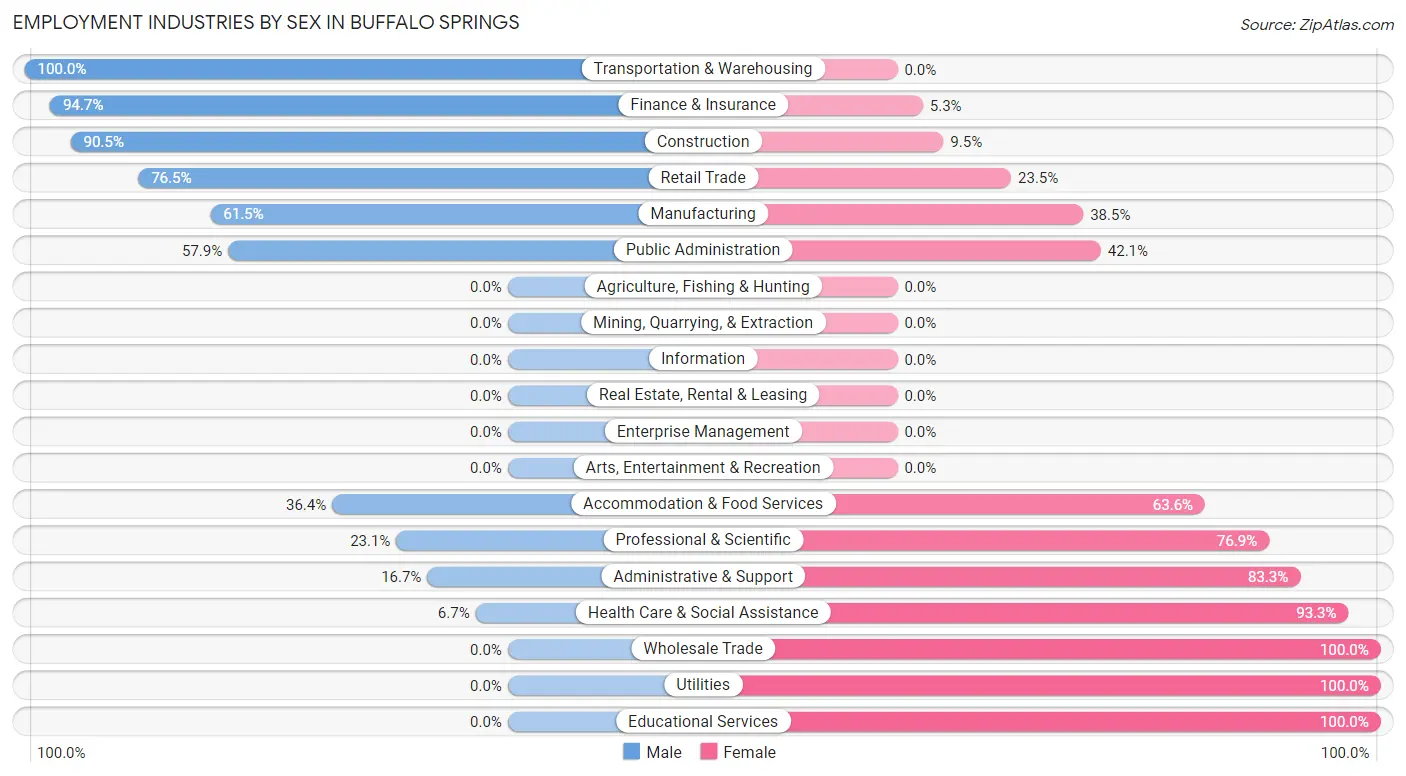
| Industry | Male | Female |
| Agriculture, Fishing & Hunting | 0 (0.0%) | 0 (0.0%) |
| Mining, Quarrying, & Extraction | 0 (0.0%) | 0 (0.0%) |
| Construction | 38 (90.5%) | 4 (9.5%) |
| Manufacturing | 24 (61.5%) | 15 (38.5%) |
| Wholesale Trade | 0 (0.0%) | 7 (100.0%) |
| Retail Trade | 39 (76.5%) | 12 (23.5%) |
| Transportation & Warehousing | 10 (100.0%) | 0 (0.0%) |
| Utilities | 0 (0.0%) | 7 (100.0%) |
| Information | 0 (0.0%) | 0 (0.0%) |
| Finance & Insurance | 36 (94.7%) | 2 (5.3%) |
| Real Estate, Rental & Leasing | 0 (0.0%) | 0 (0.0%) |
| Professional & Scientific | 3 (23.1%) | 10 (76.9%) |
| Enterprise Management | 0 (0.0%) | 0 (0.0%) |
| Administrative & Support | 2 (16.7%) | 10 (83.3%) |
| Educational Services | 0 (0.0%) | 7 (100.0%) |
| Health Care & Social Assistance | 3 (6.7%) | 42 (93.3%) |
| Arts, Entertainment & Recreation | 0 (0.0%) | 0 (0.0%) |
| Accommodation & Food Services | 4 (36.4%) | 7 (63.6%) |
| Public Administration | 11 (57.9%) | 8 (42.1%) |
| Total | 180 (56.2%) | 140 (43.8%) |
Education in Buffalo Springs
School Enrollment in Buffalo Springs
The most common levels of schooling among the 112 students in Buffalo Springs are elementary school (36 | 32.1%), kindergarten (28 | 25.0%), and high school (27 | 24.1%).
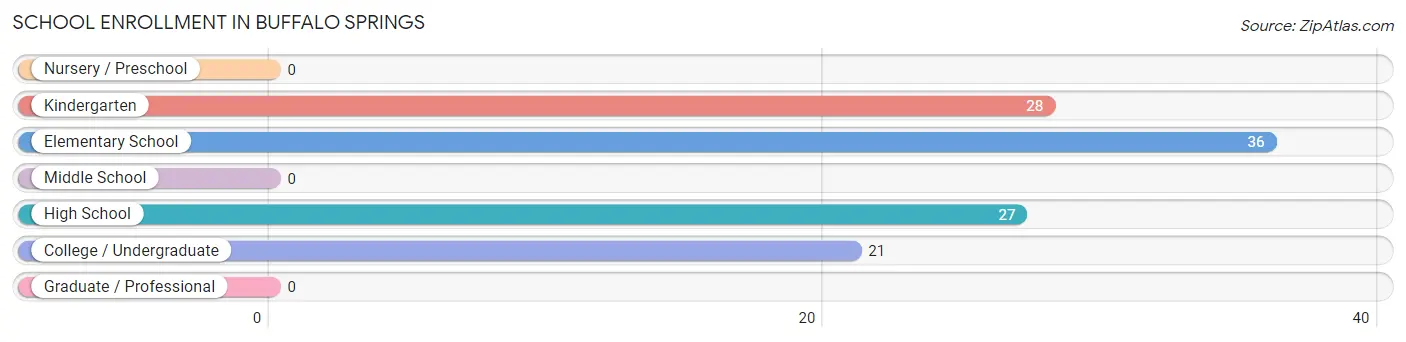
| School Level | # Students | % Students |
| Nursery / Preschool | 0 | 0.0% |
| Kindergarten | 28 | 25.0% |
| Elementary School | 36 | 32.1% |
| Middle School | 0 | 0.0% |
| High School | 27 | 24.1% |
| College / Undergraduate | 21 | 18.8% |
| Graduate / Professional | 0 | 0.0% |
| Total | 112 | 100.0% |
School Enrollment by Age by Funding Source in Buffalo Springs
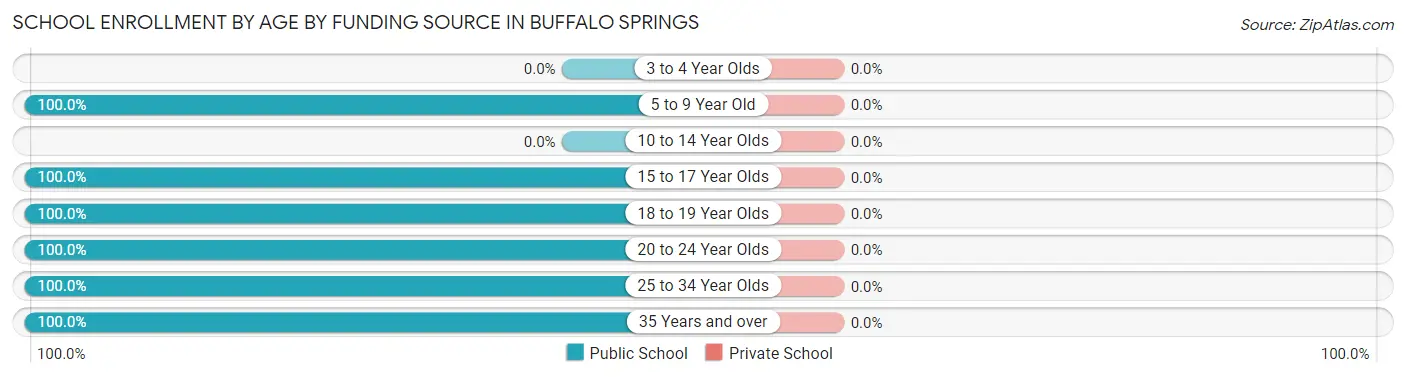
| Age Bracket | Public School | Private School |
| 3 to 4 Year Olds | 0 (0.0%) | 0 (0.0%) |
| 5 to 9 Year Old | 64 (100.0%) | 0 (0.0%) |
| 10 to 14 Year Olds | 0 (0.0%) | 0 (0.0%) |
| 15 to 17 Year Olds | 4 (100.0%) | 0 (0.0%) |
| 18 to 19 Year Olds | 25 (100.0%) | 0 (0.0%) |
| 20 to 24 Year Olds | 9 (100.0%) | 0 (0.0%) |
| 25 to 34 Year Olds | 3 (100.0%) | 0 (0.0%) |
| 35 Years and over | 7 (100.0%) | 0 (0.0%) |
| Total | 112 (100.0%) | 0 (0.0%) |
Educational Attainment by Field of Study in Buffalo Springs
Business (49 | 42.6%), education (14 | 12.2%), arts & humanities (12 | 10.4%), bio, nature & agricultural (11 | 9.6%), and social sciences (7 | 6.1%) are the most common fields of study among 115 individuals in Buffalo Springs who have obtained a bachelor's degree or higher.
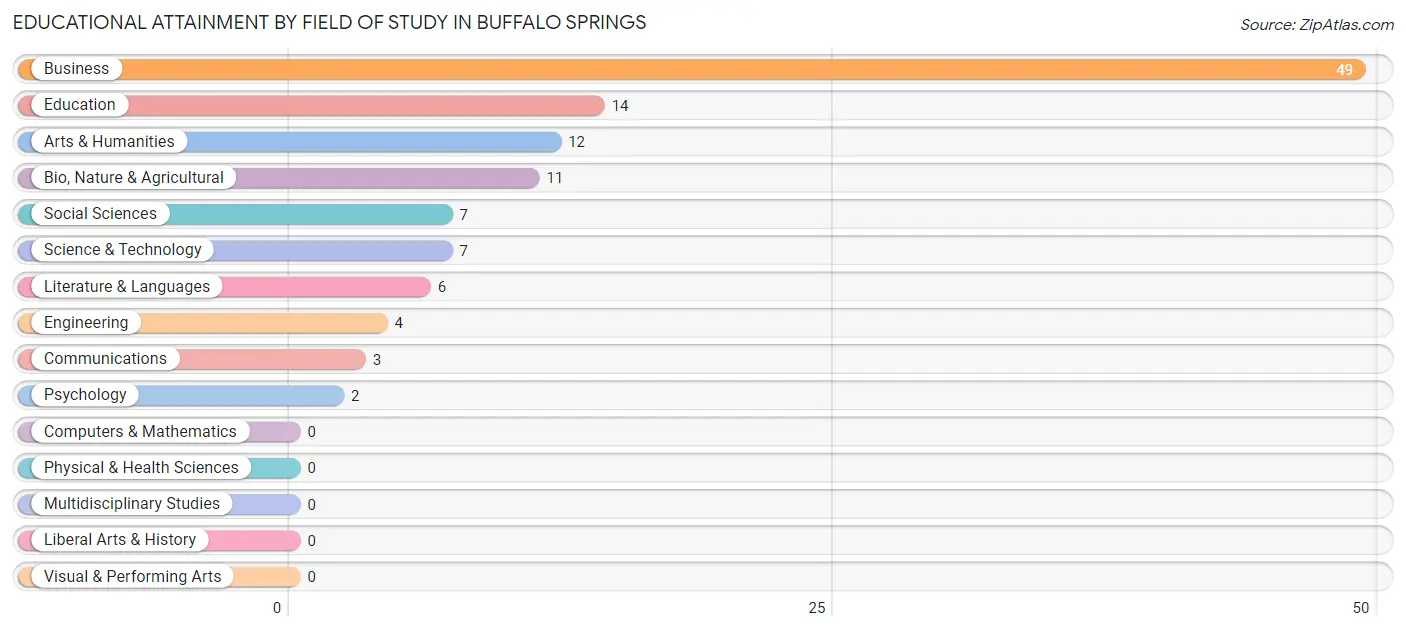
| Field of Study | # Graduates | % Graduates |
| Computers & Mathematics | 0 | 0.0% |
| Bio, Nature & Agricultural | 11 | 9.6% |
| Physical & Health Sciences | 0 | 0.0% |
| Psychology | 2 | 1.7% |
| Social Sciences | 7 | 6.1% |
| Engineering | 4 | 3.5% |
| Multidisciplinary Studies | 0 | 0.0% |
| Science & Technology | 7 | 6.1% |
| Business | 49 | 42.6% |
| Education | 14 | 12.2% |
| Literature & Languages | 6 | 5.2% |
| Liberal Arts & History | 0 | 0.0% |
| Visual & Performing Arts | 0 | 0.0% |
| Communications | 3 | 2.6% |
| Arts & Humanities | 12 | 10.4% |
| Total | 115 | 100.0% |
Transportation & Commute in Buffalo Springs
Vehicle Availability by Sex in Buffalo Springs
The most prevalent vehicle ownership categories in Buffalo Springs are males with 4 vehicles (82, accounting for 45.6%) and females with 4 vehicles (41, making up 58.6%).
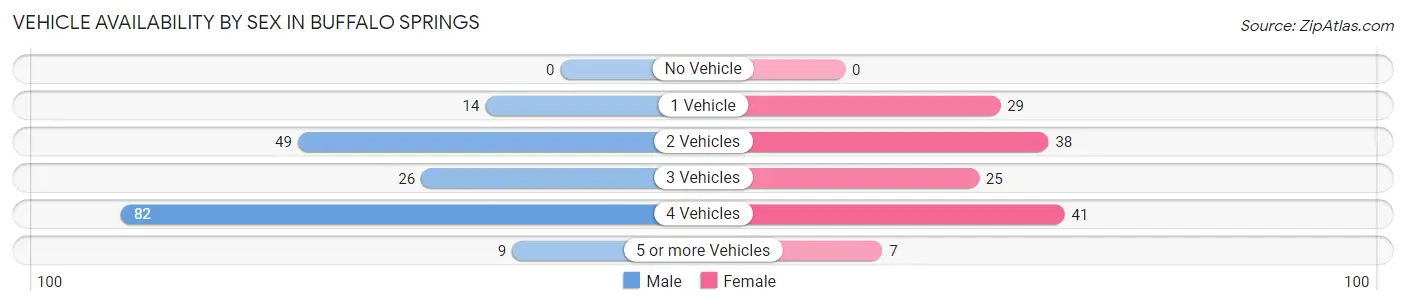
| Vehicles Available | Male | Female |
| No Vehicle | 0 (0.0%) | 0 (0.0%) |
| 1 Vehicle | 14 (7.8%) | 29 (20.7%) |
| 2 Vehicles | 49 (27.2%) | 38 (27.1%) |
| 3 Vehicles | 26 (14.4%) | 25 (17.9%) |
| 4 Vehicles | 82 (45.6%) | 41 (29.3%) |
| 5 or more Vehicles | 9 (5.0%) | 7 (5.0%) |
| Total | 180 (100.0%) | 140 (100.0%) |
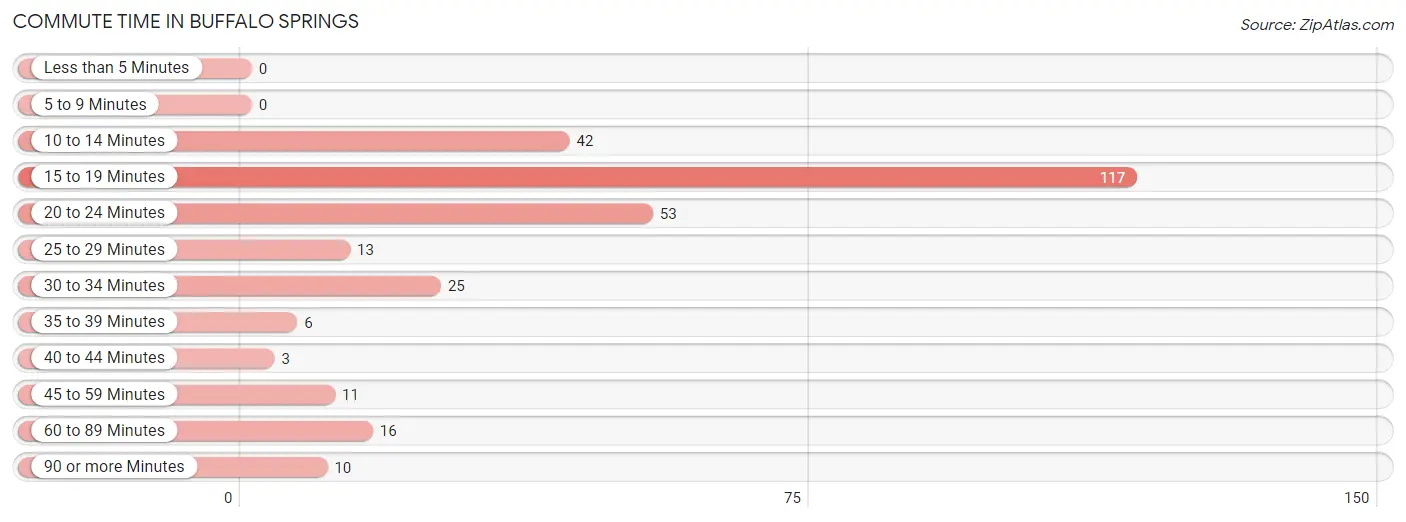
Commute Time in Buffalo Springs
The most frequently occuring commute durations in Buffalo Springs are 15 to 19 minutes (117 commuters, 39.5%), 20 to 24 minutes (53 commuters, 17.9%), and 10 to 14 minutes (42 commuters, 14.2%).
| Commute Time | # Commuters | % Commuters |
| Less than 5 Minutes | 0 | 0.0% |
| 5 to 9 Minutes | 0 | 0.0% |
| 10 to 14 Minutes | 42 | 14.2% |
| 15 to 19 Minutes | 117 | 39.5% |
| 20 to 24 Minutes | 53 | 17.9% |
| 25 to 29 Minutes | 13 | 4.4% |
| 30 to 34 Minutes | 25 | 8.5% |
| 35 to 39 Minutes | 6 | 2.0% |
| 40 to 44 Minutes | 3 | 1.0% |
| 45 to 59 Minutes | 11 | 3.7% |
| 60 to 89 Minutes | 16 | 5.4% |
| 90 or more Minutes | 10 | 3.4% |
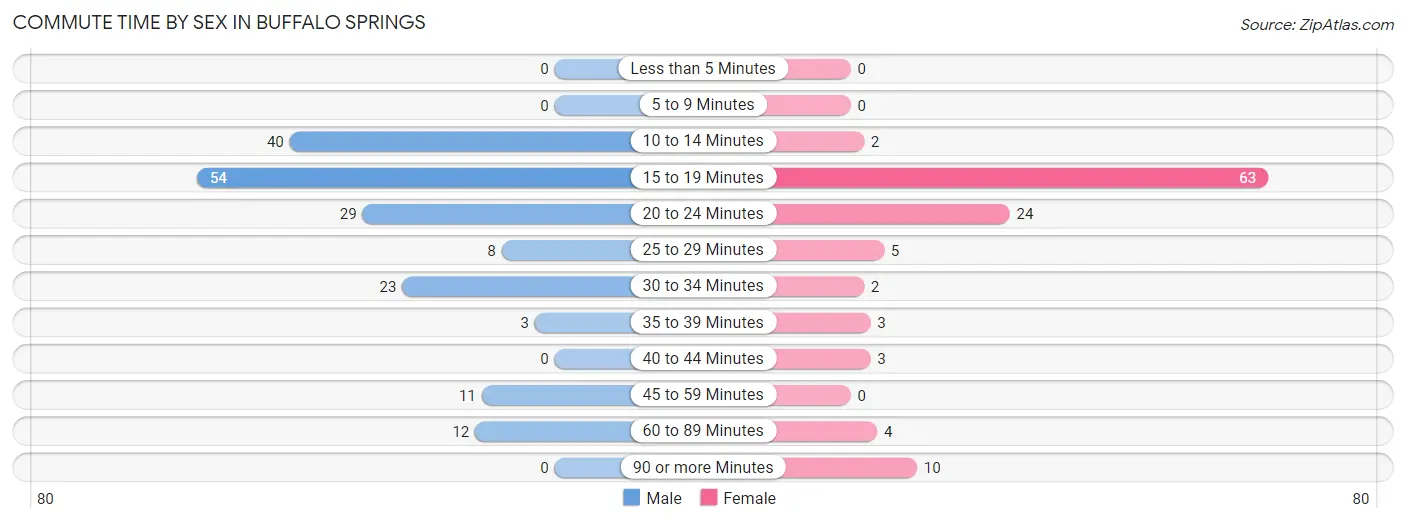
Commute Time by Sex in Buffalo Springs
The most common commute times in Buffalo Springs are 15 to 19 minutes (54 commuters, 30.0%) for males and 15 to 19 minutes (63 commuters, 54.3%) for females.
| Commute Time | Male | Female |
| Less than 5 Minutes | 0 (0.0%) | 0 (0.0%) |
| 5 to 9 Minutes | 0 (0.0%) | 0 (0.0%) |
| 10 to 14 Minutes | 40 (22.2%) | 2 (1.7%) |
| 15 to 19 Minutes | 54 (30.0%) | 63 (54.3%) |
| 20 to 24 Minutes | 29 (16.1%) | 24 (20.7%) |
| 25 to 29 Minutes | 8 (4.4%) | 5 (4.3%) |
| 30 to 34 Minutes | 23 (12.8%) | 2 (1.7%) |
| 35 to 39 Minutes | 3 (1.7%) | 3 (2.6%) |
| 40 to 44 Minutes | 0 (0.0%) | 3 (2.6%) |
| 45 to 59 Minutes | 11 (6.1%) | 0 (0.0%) |
| 60 to 89 Minutes | 12 (6.7%) | 4 (3.5%) |
| 90 or more Minutes | 0 (0.0%) | 10 (8.6%) |
Time of Departure to Work by Sex in Buffalo Springs
The most frequent times of departure to work in Buffalo Springs are 10:00 AM to 10:59 AM (36, 20.0%) for males and 8:00 AM to 8:29 AM (46, 39.7%) for females.
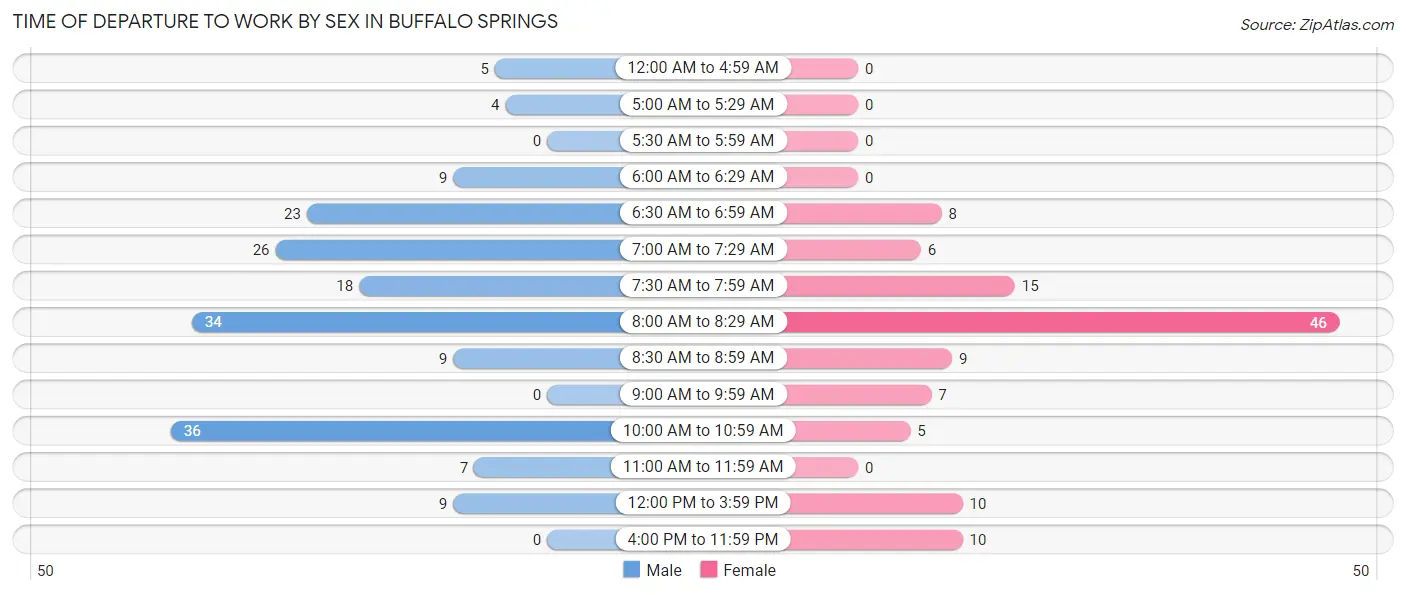
| Time of Departure | Male | Female |
| 12:00 AM to 4:59 AM | 5 (2.8%) | 0 (0.0%) |
| 5:00 AM to 5:29 AM | 4 (2.2%) | 0 (0.0%) |
| 5:30 AM to 5:59 AM | 0 (0.0%) | 0 (0.0%) |
| 6:00 AM to 6:29 AM | 9 (5.0%) | 0 (0.0%) |
| 6:30 AM to 6:59 AM | 23 (12.8%) | 8 (6.9%) |
| 7:00 AM to 7:29 AM | 26 (14.4%) | 6 (5.2%) |
| 7:30 AM to 7:59 AM | 18 (10.0%) | 15 (12.9%) |
| 8:00 AM to 8:29 AM | 34 (18.9%) | 46 (39.7%) |
| 8:30 AM to 8:59 AM | 9 (5.0%) | 9 (7.8%) |
| 9:00 AM to 9:59 AM | 0 (0.0%) | 7 (6.0%) |
| 10:00 AM to 10:59 AM | 36 (20.0%) | 5 (4.3%) |
| 11:00 AM to 11:59 AM | 7 (3.9%) | 0 (0.0%) |
| 12:00 PM to 3:59 PM | 9 (5.0%) | 10 (8.6%) |
| 4:00 PM to 11:59 PM | 0 (0.0%) | 10 (8.6%) |
| Total | 180 (100.0%) | 116 (100.0%) |
Housing Occupancy in Buffalo Springs
Occupancy by Ownership in Buffalo Springs
Of the total 249 dwellings in Buffalo Springs, owner-occupied units account for 242 (97.2%), while renter-occupied units make up 7 (2.8%).
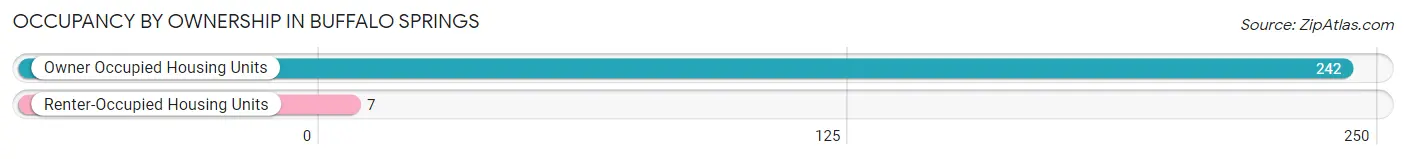
| Occupancy | # Housing Units | % Housing Units |
| Owner Occupied Housing Units | 242 | 97.2% |
| Renter-Occupied Housing Units | 7 | 2.8% |
| Total Occupied Housing Units | 249 | 100.0% |
Occupancy by Household Size in Buffalo Springs
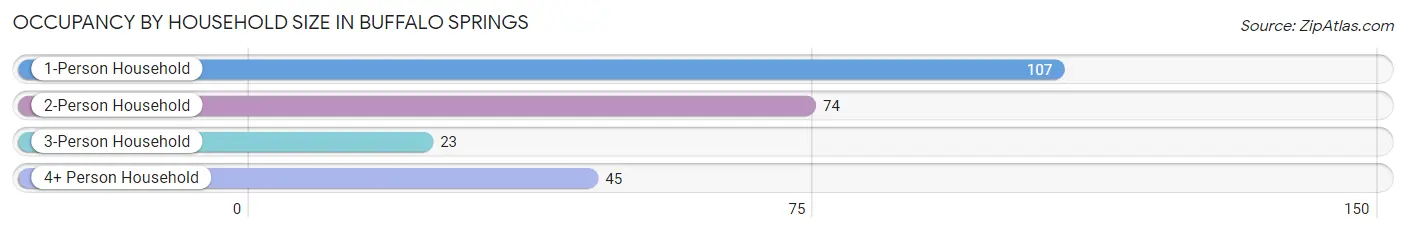
| Household Size | # Housing Units | % Housing Units |
| 1-Person Household | 107 | 43.0% |
| 2-Person Household | 74 | 29.7% |
| 3-Person Household | 23 | 9.2% |
| 4+ Person Household | 45 | 18.1% |
| Total Housing Units | 249 | 100.0% |
Occupancy by Ownership by Household Size in Buffalo Springs
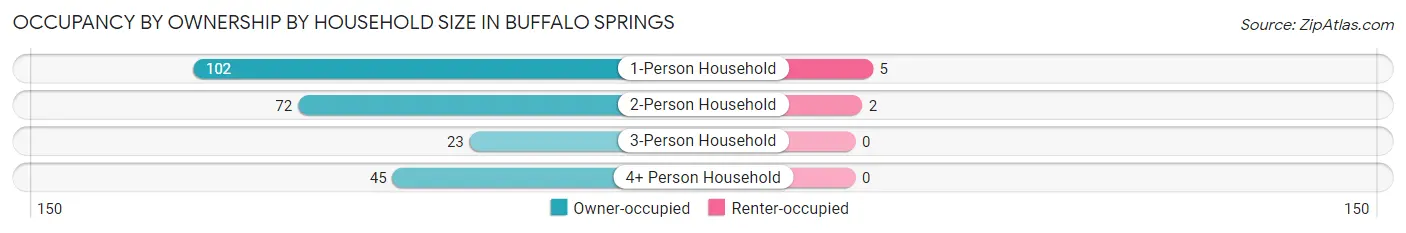
| Household Size | Owner-occupied | Renter-occupied |
| 1-Person Household | 102 (95.3%) | 5 (4.7%) |
| 2-Person Household | 72 (97.3%) | 2 (2.7%) |
| 3-Person Household | 23 (100.0%) | 0 (0.0%) |
| 4+ Person Household | 45 (100.0%) | 0 (0.0%) |
| Total Housing Units | 242 (97.2%) | 7 (2.8%) |
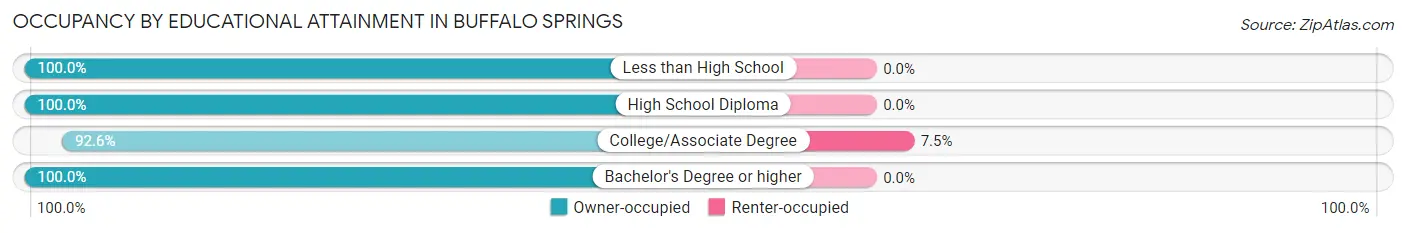
Occupancy by Educational Attainment in Buffalo Springs
| Household Size | Owner-occupied | Renter-occupied |
| Less than High School | 19 (100.0%) | 0 (0.0%) |
| High School Diploma | 61 (100.0%) | 0 (0.0%) |
| College/Associate Degree | 87 (92.5%) | 7 (7.4%) |
| Bachelor's Degree or higher | 75 (100.0%) | 0 (0.0%) |
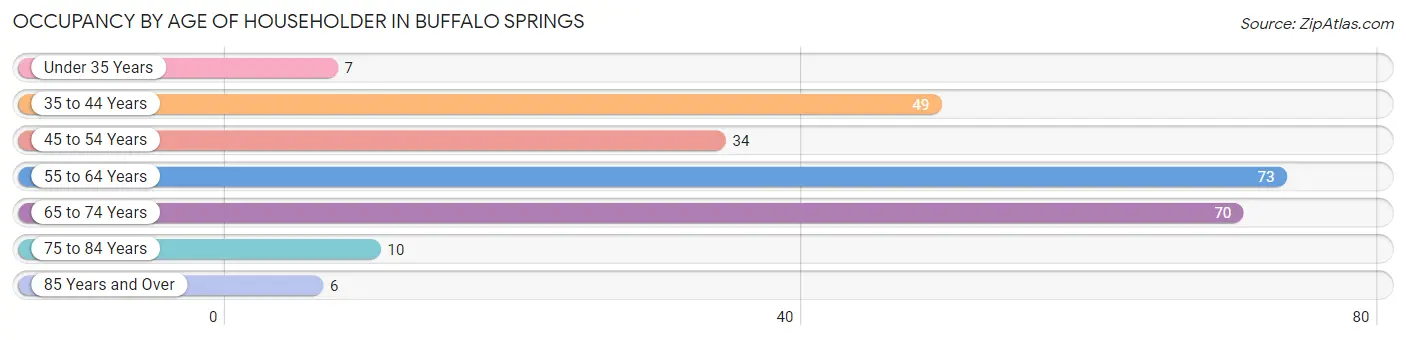
Occupancy by Age of Householder in Buffalo Springs
| Age Bracket | # Households | % Households |
| Under 35 Years | 7 | 2.8% |
| 35 to 44 Years | 49 | 19.7% |
| 45 to 54 Years | 34 | 13.7% |
| 55 to 64 Years | 73 | 29.3% |
| 65 to 74 Years | 70 | 28.1% |
| 75 to 84 Years | 10 | 4.0% |
| 85 Years and Over | 6 | 2.4% |
| Total | 249 | 100.0% |
Housing Finances in Buffalo Springs
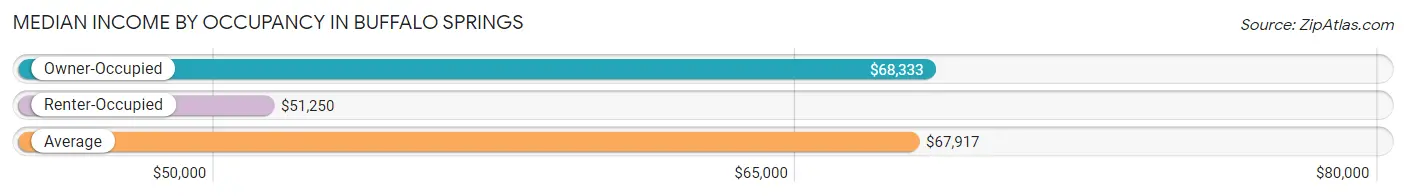
Median Income by Occupancy in Buffalo Springs
| Occupancy Type | # Households | Median Income |
| Owner-Occupied | 242 (97.2%) | $68,333 |
| Renter-Occupied | 7 (2.8%) | $51,250 |
| Average | 249 (100.0%) | $67,917 |
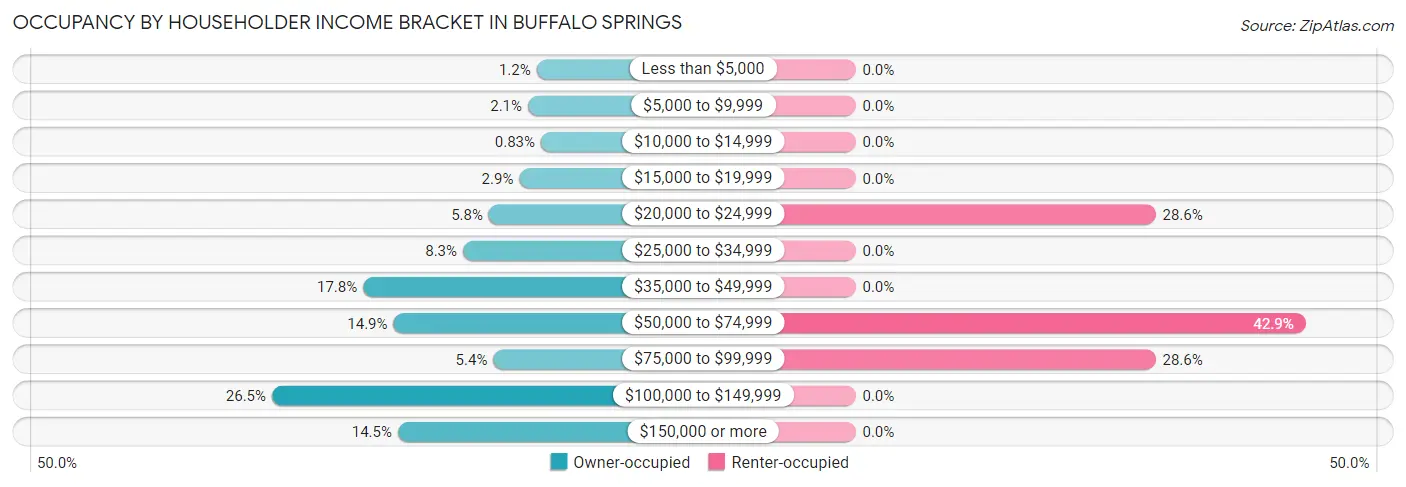
Occupancy by Householder Income Bracket in Buffalo Springs
| Income Bracket | Owner-occupied | Renter-occupied |
| Less than $5,000 | 3 (1.2%) | 0 (0.0%) |
| $5,000 to $9,999 | 5 (2.1%) | 0 (0.0%) |
| $10,000 to $14,999 | 2 (0.8%) | 0 (0.0%) |
| $15,000 to $19,999 | 7 (2.9%) | 0 (0.0%) |
| $20,000 to $24,999 | 14 (5.8%) | 2 (28.6%) |
| $25,000 to $34,999 | 20 (8.3%) | 0 (0.0%) |
| $35,000 to $49,999 | 43 (17.8%) | 0 (0.0%) |
| $50,000 to $74,999 | 36 (14.9%) | 3 (42.9%) |
| $75,000 to $99,999 | 13 (5.4%) | 2 (28.6%) |
| $100,000 to $149,999 | 64 (26.5%) | 0 (0.0%) |
| $150,000 or more | 35 (14.5%) | 0 (0.0%) |
| Total | 242 (100.0%) | 7 (100.0%) |
Monthly Housing Cost Tiers in Buffalo Springs
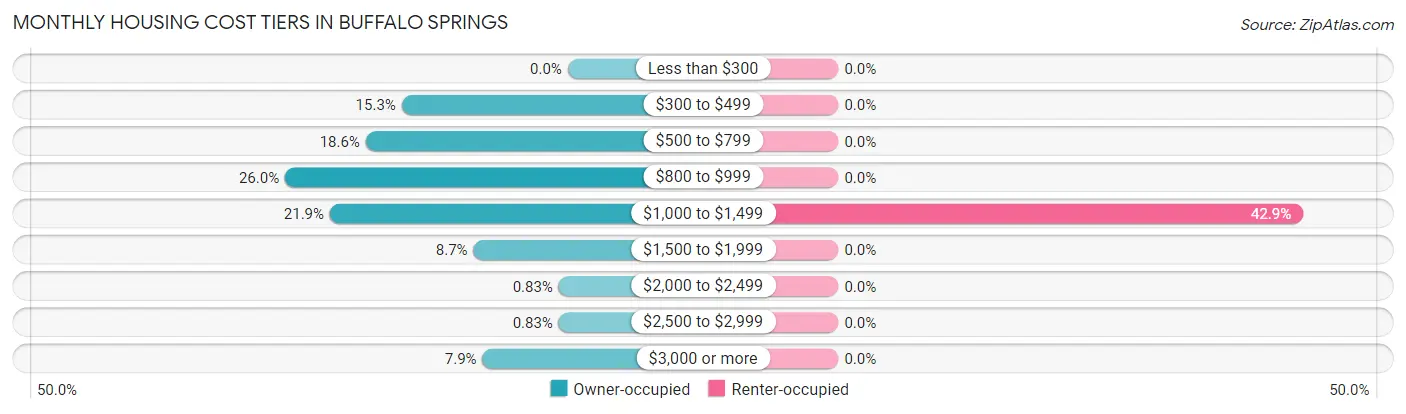
| Monthly Cost | Owner-occupied | Renter-occupied |
| Less than $300 | 0 (0.0%) | 0 (0.0%) |
| $300 to $499 | 37 (15.3%) | 0 (0.0%) |
| $500 to $799 | 45 (18.6%) | 0 (0.0%) |
| $800 to $999 | 63 (26.0%) | 0 (0.0%) |
| $1,000 to $1,499 | 53 (21.9%) | 3 (42.9%) |
| $1,500 to $1,999 | 21 (8.7%) | 0 (0.0%) |
| $2,000 to $2,499 | 2 (0.8%) | 0 (0.0%) |
| $2,500 to $2,999 | 2 (0.8%) | 0 (0.0%) |
| $3,000 or more | 19 (7.9%) | 0 (0.0%) |
| Total | 242 (100.0%) | 7 (100.0%) |
Physical Housing Characteristics in Buffalo Springs
Housing Structures in Buffalo Springs
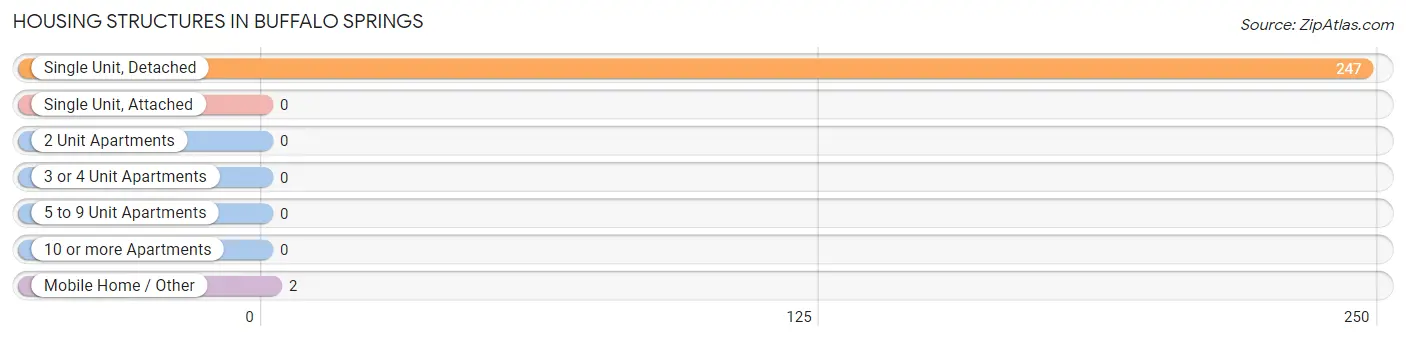
| Structure Type | # Housing Units | % Housing Units |
| Single Unit, Detached | 247 | 99.2% |
| Single Unit, Attached | 0 | 0.0% |
| 2 Unit Apartments | 0 | 0.0% |
| 3 or 4 Unit Apartments | 0 | 0.0% |
| 5 to 9 Unit Apartments | 0 | 0.0% |
| 10 or more Apartments | 0 | 0.0% |
| Mobile Home / Other | 2 | 0.8% |
| Total | 249 | 100.0% |
Housing Structures by Occupancy in Buffalo Springs
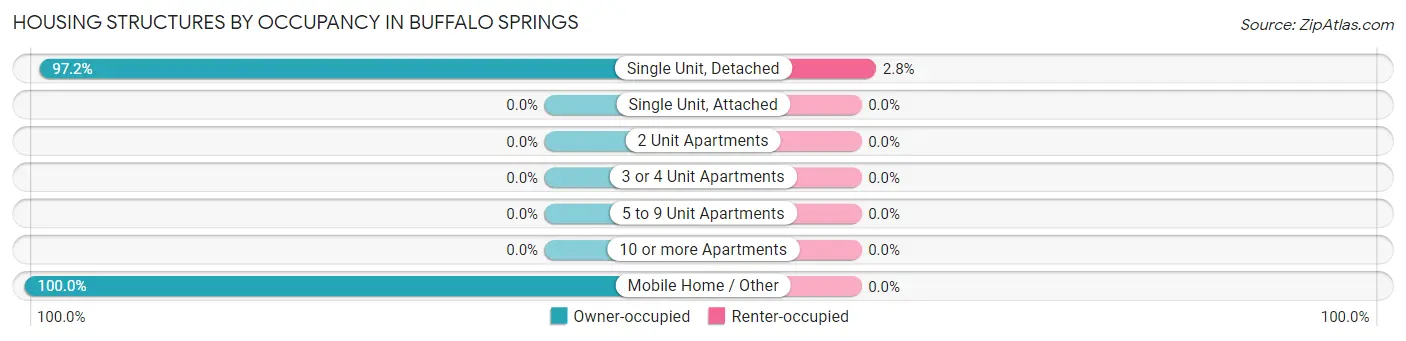
| Structure Type | Owner-occupied | Renter-occupied |
| Single Unit, Detached | 240 (97.2%) | 7 (2.8%) |
| Single Unit, Attached | 0 (0.0%) | 0 (0.0%) |
| 2 Unit Apartments | 0 (0.0%) | 0 (0.0%) |
| 3 or 4 Unit Apartments | 0 (0.0%) | 0 (0.0%) |
| 5 to 9 Unit Apartments | 0 (0.0%) | 0 (0.0%) |
| 10 or more Apartments | 0 (0.0%) | 0 (0.0%) |
| Mobile Home / Other | 2 (100.0%) | 0 (0.0%) |
| Total | 242 (97.2%) | 7 (2.8%) |
Housing Structures by Number of Rooms in Buffalo Springs
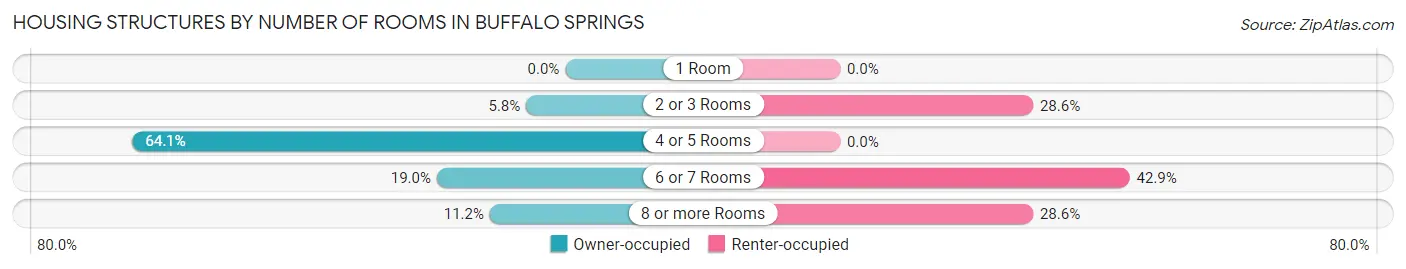
| Number of Rooms | Owner-occupied | Renter-occupied |
| 1 Room | 0 (0.0%) | 0 (0.0%) |
| 2 or 3 Rooms | 14 (5.8%) | 2 (28.6%) |
| 4 or 5 Rooms | 155 (64.0%) | 0 (0.0%) |
| 6 or 7 Rooms | 46 (19.0%) | 3 (42.9%) |
| 8 or more Rooms | 27 (11.2%) | 2 (28.6%) |
| Total | 242 (100.0%) | 7 (100.0%) |
Housing Structure by Heating Type in Buffalo Springs
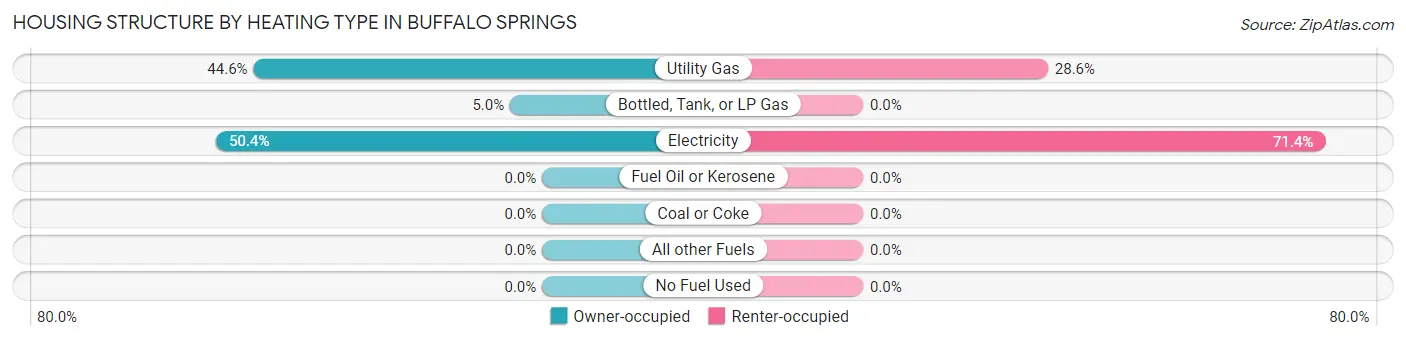
| Heating Type | Owner-occupied | Renter-occupied |
| Utility Gas | 108 (44.6%) | 2 (28.6%) |
| Bottled, Tank, or LP Gas | 12 (5.0%) | 0 (0.0%) |
| Electricity | 122 (50.4%) | 5 (71.4%) |
| Fuel Oil or Kerosene | 0 (0.0%) | 0 (0.0%) |
| Coal or Coke | 0 (0.0%) | 0 (0.0%) |
| All other Fuels | 0 (0.0%) | 0 (0.0%) |
| No Fuel Used | 0 (0.0%) | 0 (0.0%) |
| Total | 242 (100.0%) | 7 (100.0%) |
Household Vehicle Usage in Buffalo Springs
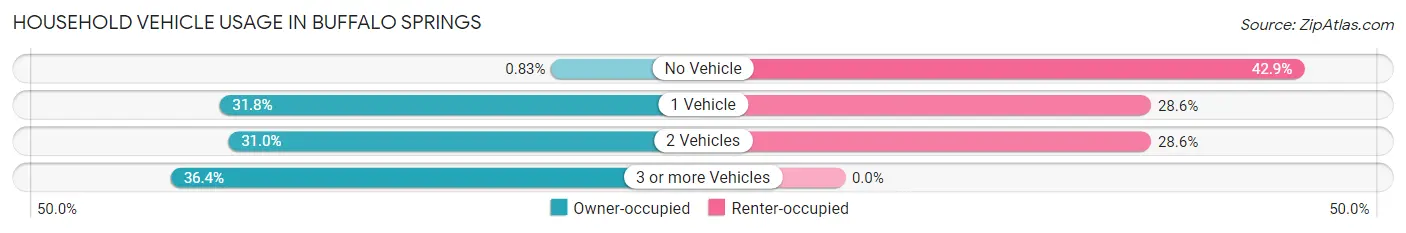
| Vehicles per Household | Owner-occupied | Renter-occupied |
| No Vehicle | 2 (0.8%) | 3 (42.9%) |
| 1 Vehicle | 77 (31.8%) | 2 (28.6%) |
| 2 Vehicles | 75 (31.0%) | 2 (28.6%) |
| 3 or more Vehicles | 88 (36.4%) | 0 (0.0%) |
| Total | 242 (100.0%) | 7 (100.0%) |
Real Estate & Mortgages in Buffalo Springs
Real Estate and Mortgage Overview in Buffalo Springs
| Characteristic | Without Mortgage | With Mortgage |
| Housing Units | 109 | 133 |
| Median Property Value | $152,900 | $228,700 |
| Median Household Income | $52,656 | $24 |
| Monthly Housing Costs | $621 | $19 |
| Real Estate Taxes | $2,259 | $0 |
Property Value by Mortgage Status in Buffalo Springs
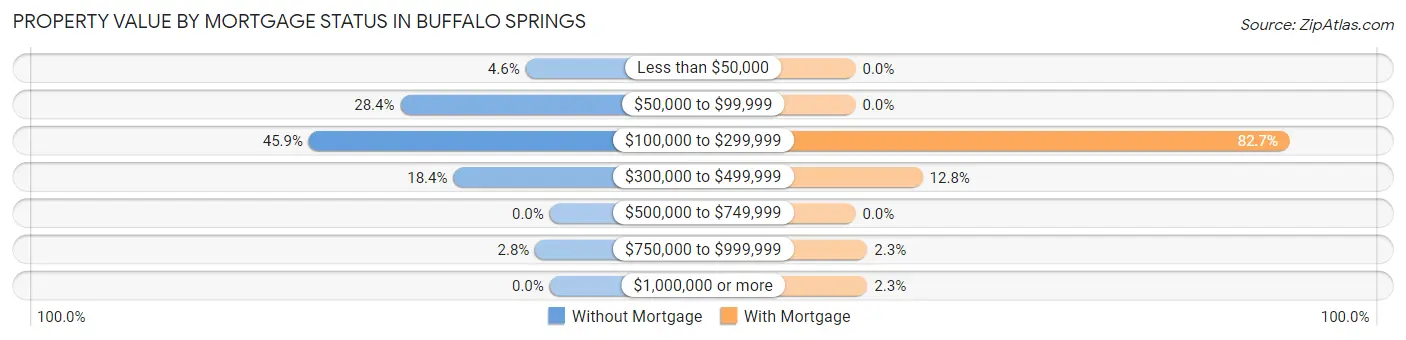
| Property Value | Without Mortgage | With Mortgage |
| Less than $50,000 | 5 (4.6%) | 0 (0.0%) |
| $50,000 to $99,999 | 31 (28.4%) | 0 (0.0%) |
| $100,000 to $299,999 | 50 (45.9%) | 110 (82.7%) |
| $300,000 to $499,999 | 20 (18.3%) | 17 (12.8%) |
| $500,000 to $749,999 | 0 (0.0%) | 0 (0.0%) |
| $750,000 to $999,999 | 3 (2.8%) | 3 (2.3%) |
| $1,000,000 or more | 0 (0.0%) | 3 (2.3%) |
| Total | 109 (100.0%) | 133 (100.0%) |
Household Income by Mortgage Status in Buffalo Springs
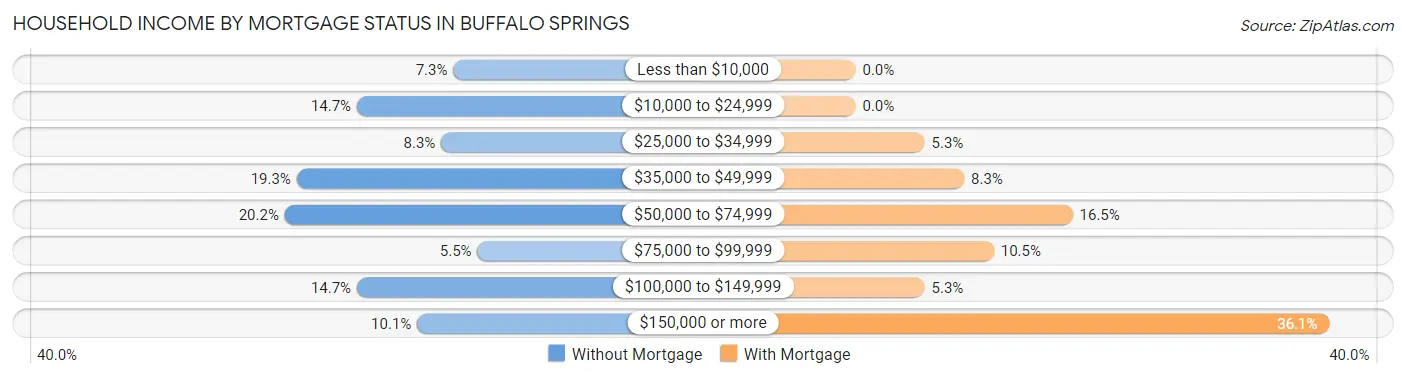
| Household Income | Without Mortgage | With Mortgage |
| Less than $10,000 | 8 (7.3%) | 0 (0.0%) |
| $10,000 to $24,999 | 16 (14.7%) | 0 (0.0%) |
| $25,000 to $34,999 | 9 (8.3%) | 7 (5.3%) |
| $35,000 to $49,999 | 21 (19.3%) | 11 (8.3%) |
| $50,000 to $74,999 | 22 (20.2%) | 22 (16.5%) |
| $75,000 to $99,999 | 6 (5.5%) | 14 (10.5%) |
| $100,000 to $149,999 | 16 (14.7%) | 7 (5.3%) |
| $150,000 or more | 11 (10.1%) | 48 (36.1%) |
| Total | 109 (100.0%) | 133 (100.0%) |
Property Value to Household Income Ratio in Buffalo Springs
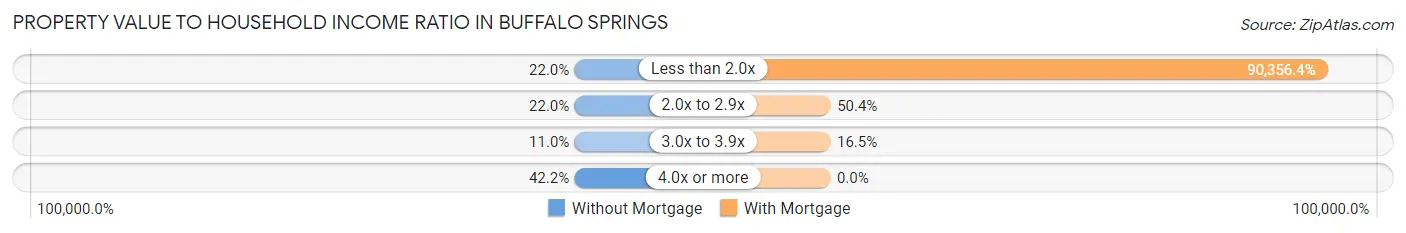
| Value-to-Income Ratio | Without Mortgage | With Mortgage |
| Less than 2.0x | 24 (22.0%) | 120,174 (90,356.4%) |
| 2.0x to 2.9x | 24 (22.0%) | 67 (50.4%) |
| 3.0x to 3.9x | 12 (11.0%) | 22 (16.5%) |
| 4.0x or more | 46 (42.2%) | 0 (0.0%) |
| Total | 109 (100.0%) | 133 (100.0%) |
Real Estate Taxes by Mortgage Status in Buffalo Springs
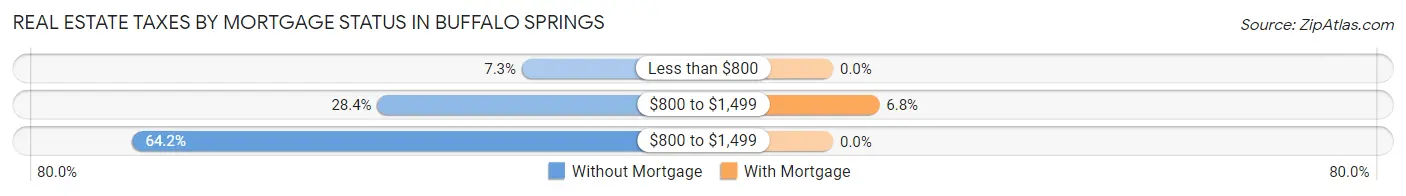
| Property Taxes | Without Mortgage | With Mortgage |
| Less than $800 | 8 (7.3%) | 0 (0.0%) |
| $800 to $1,499 | 31 (28.4%) | 9 (6.8%) |
| $800 to $1,499 | 70 (64.2%) | 0 (0.0%) |
| Total | 109 (100.0%) | 133 (100.0%) |
Health & Disability in Buffalo Springs
Health Insurance Coverage by Age in Buffalo Springs
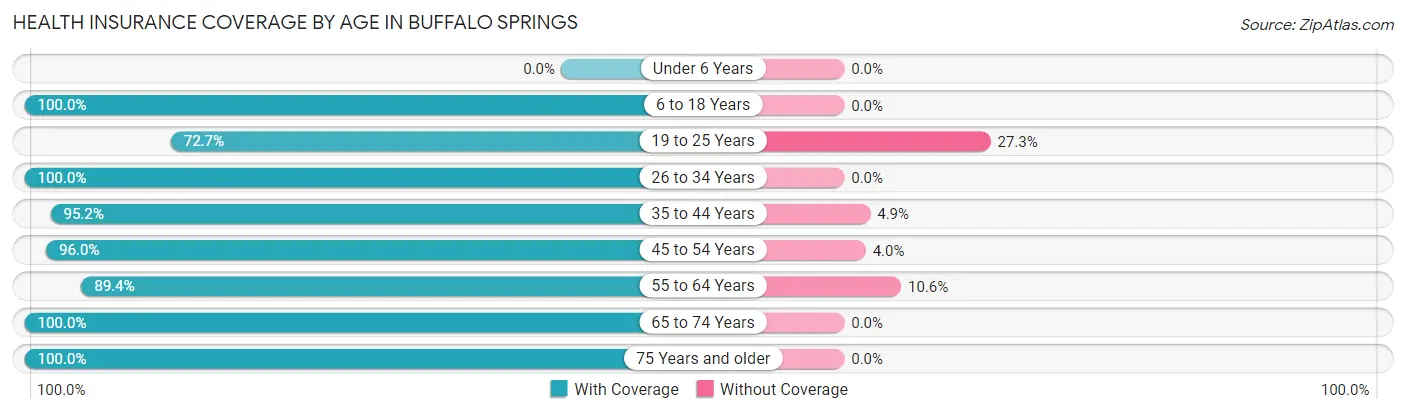
| Age Bracket | With Coverage | Without Coverage |
| Under 6 Years | 0 (0.0%) | 0 (0.0%) |
| 6 to 18 Years | 109 (100.0%) | 0 (0.0%) |
| 19 to 25 Years | 24 (72.7%) | 9 (27.3%) |
| 26 to 34 Years | 3 (100.0%) | 0 (0.0%) |
| 35 to 44 Years | 98 (95.2%) | 5 (4.9%) |
| 45 to 54 Years | 48 (96.0%) | 2 (4.0%) |
| 55 to 64 Years | 93 (89.4%) | 11 (10.6%) |
| 65 to 74 Years | 101 (100.0%) | 0 (0.0%) |
| 75 Years and older | 27 (100.0%) | 0 (0.0%) |
| Total | 503 (94.9%) | 27 (5.1%) |
Health Insurance Coverage by Citizenship Status in Buffalo Springs
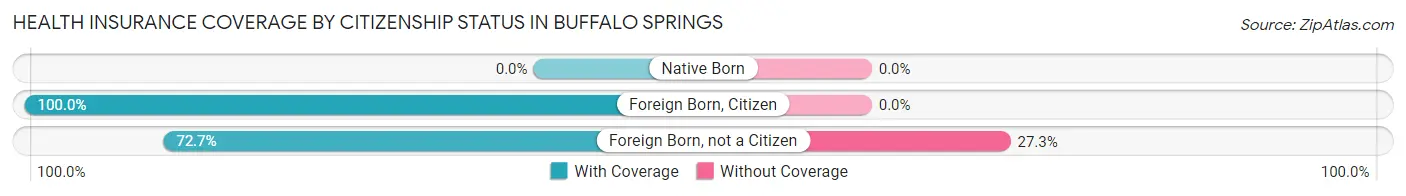
| Citizenship Status | With Coverage | Without Coverage |
| Native Born | 0 (0.0%) | 0 (0.0%) |
| Foreign Born, Citizen | 109 (100.0%) | 0 (0.0%) |
| Foreign Born, not a Citizen | 24 (72.7%) | 9 (27.3%) |
Health Insurance Coverage by Household Income in Buffalo Springs
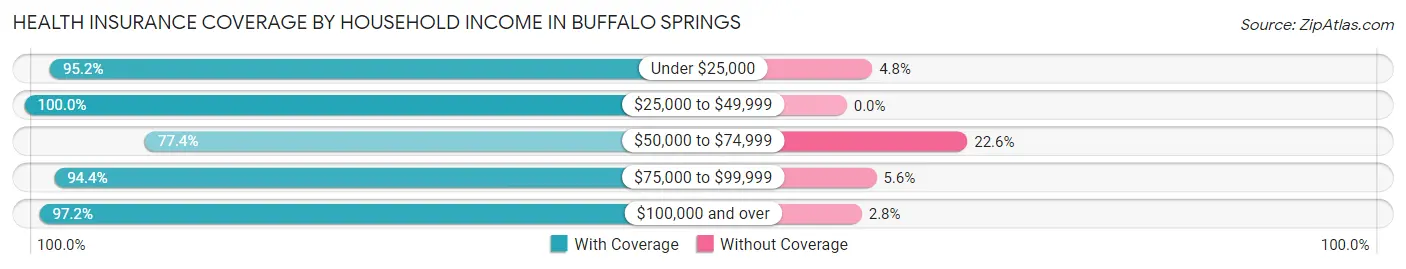
| Household Income | With Coverage | Without Coverage |
| Under $25,000 | 40 (95.2%) | 2 (4.8%) |
| $25,000 to $49,999 | 70 (100.0%) | 0 (0.0%) |
| $50,000 to $74,999 | 48 (77.4%) | 14 (22.6%) |
| $75,000 to $99,999 | 34 (94.4%) | 2 (5.6%) |
| $100,000 and over | 311 (97.2%) | 9 (2.8%) |
Public vs Private Health Insurance Coverage by Age in Buffalo Springs
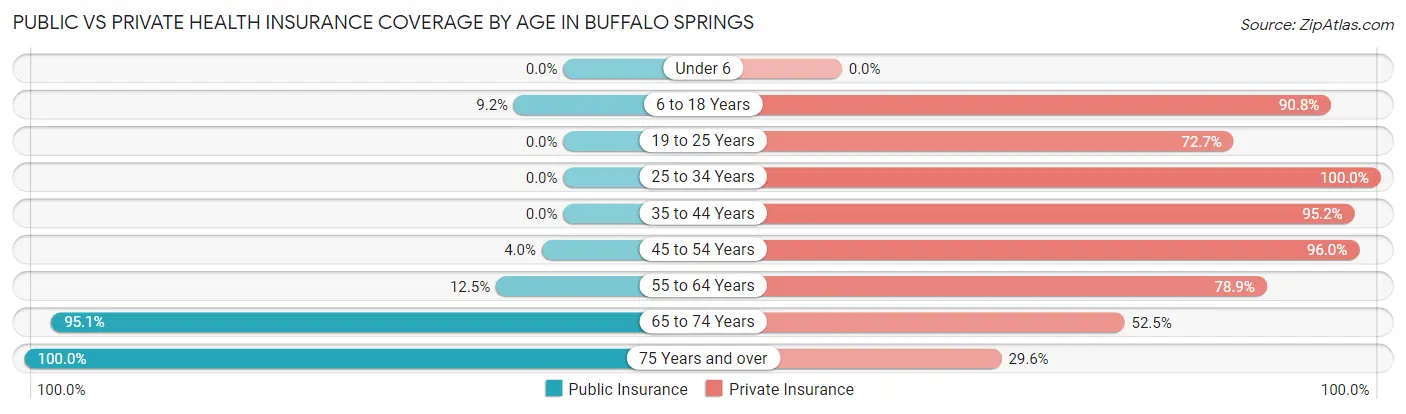
| Age Bracket | Public Insurance | Private Insurance |
| Under 6 | 0 (0.0%) | 0 (0.0%) |
| 6 to 18 Years | 10 (9.2%) | 99 (90.8%) |
| 19 to 25 Years | 0 (0.0%) | 24 (72.7%) |
| 25 to 34 Years | 0 (0.0%) | 3 (100.0%) |
| 35 to 44 Years | 0 (0.0%) | 98 (95.2%) |
| 45 to 54 Years | 2 (4.0%) | 48 (96.0%) |
| 55 to 64 Years | 13 (12.5%) | 82 (78.8%) |
| 65 to 74 Years | 96 (95.1%) | 53 (52.5%) |
| 75 Years and over | 27 (100.0%) | 8 (29.6%) |
| Total | 148 (27.9%) | 415 (78.3%) |
Disability Status by Sex by Age in Buffalo Springs
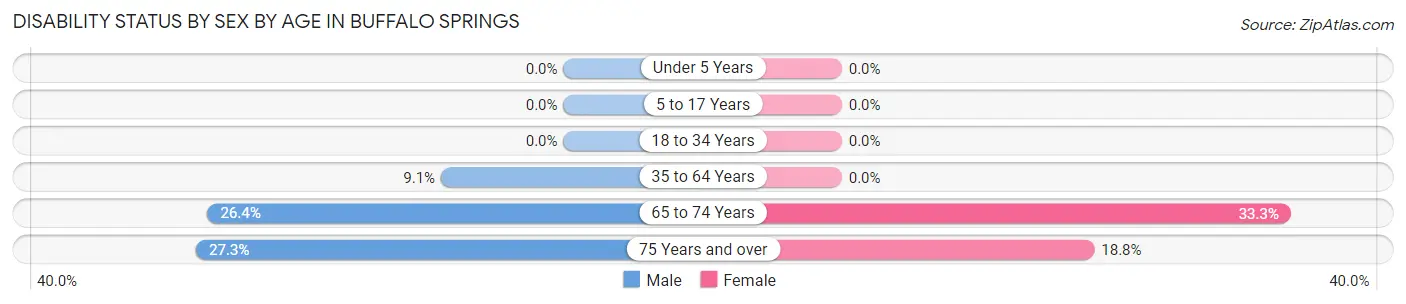
| Age Bracket | Male | Female |
| Under 5 Years | 0 (0.0%) | 0 (0.0%) |
| 5 to 17 Years | 0 (0.0%) | 0 (0.0%) |
| 18 to 34 Years | 0 (0.0%) | 0 (0.0%) |
| 35 to 64 Years | 12 (9.1%) | 0 (0.0%) |
| 65 to 74 Years | 14 (26.4%) | 16 (33.3%) |
| 75 Years and over | 3 (27.3%) | 3 (18.8%) |
Disability Class by Sex by Age in Buffalo Springs
Disability Class: Hearing Difficulty
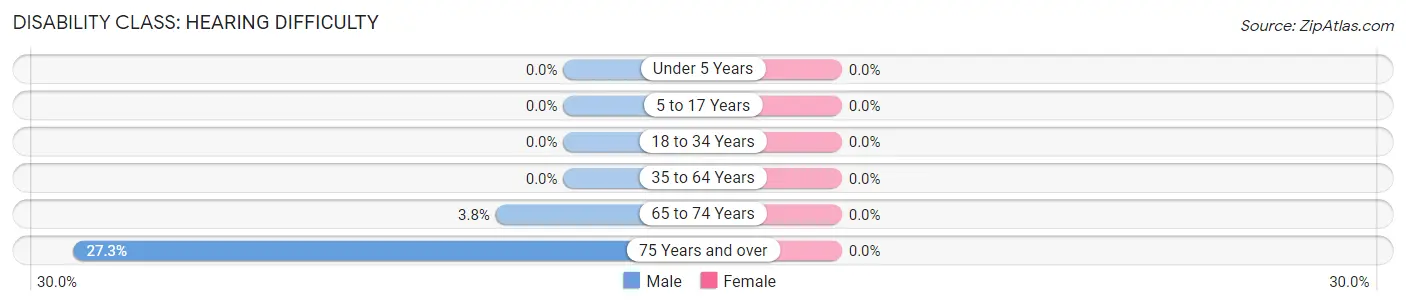
| Age Bracket | Male | Female |
| Under 5 Years | 0 (0.0%) | 0 (0.0%) |
| 5 to 17 Years | 0 (0.0%) | 0 (0.0%) |
| 18 to 34 Years | 0 (0.0%) | 0 (0.0%) |
| 35 to 64 Years | 0 (0.0%) | 0 (0.0%) |
| 65 to 74 Years | 2 (3.8%) | 0 (0.0%) |
| 75 Years and over | 3 (27.3%) | 0 (0.0%) |
Disability Class: Vision Difficulty
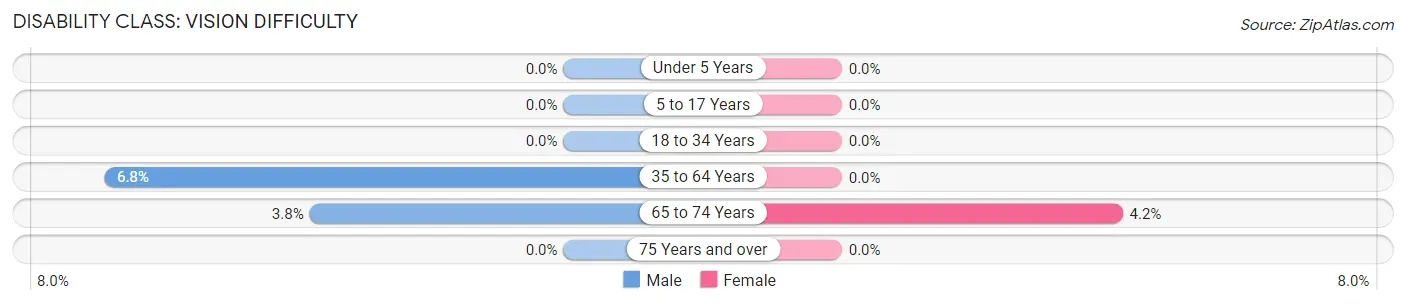
| Age Bracket | Male | Female |
| Under 5 Years | 0 (0.0%) | 0 (0.0%) |
| 5 to 17 Years | 0 (0.0%) | 0 (0.0%) |
| 18 to 34 Years | 0 (0.0%) | 0 (0.0%) |
| 35 to 64 Years | 9 (6.8%) | 0 (0.0%) |
| 65 to 74 Years | 2 (3.8%) | 2 (4.2%) |
| 75 Years and over | 0 (0.0%) | 0 (0.0%) |
Disability Class: Cognitive Difficulty
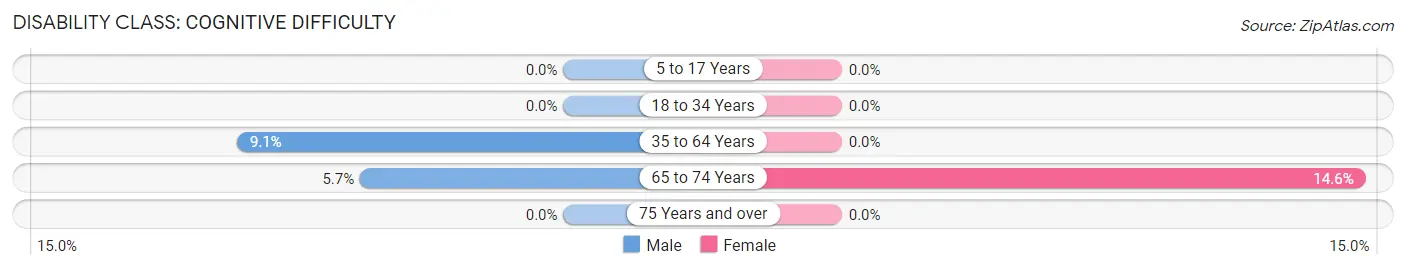
| Age Bracket | Male | Female |
| 5 to 17 Years | 0 (0.0%) | 0 (0.0%) |
| 18 to 34 Years | 0 (0.0%) | 0 (0.0%) |
| 35 to 64 Years | 12 (9.1%) | 0 (0.0%) |
| 65 to 74 Years | 3 (5.7%) | 7 (14.6%) |
| 75 Years and over | 0 (0.0%) | 0 (0.0%) |
Disability Class: Ambulatory Difficulty
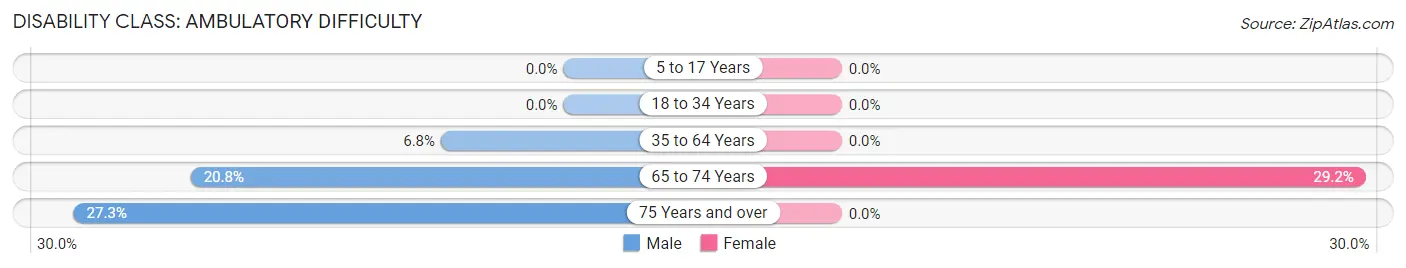
| Age Bracket | Male | Female |
| 5 to 17 Years | 0 (0.0%) | 0 (0.0%) |
| 18 to 34 Years | 0 (0.0%) | 0 (0.0%) |
| 35 to 64 Years | 9 (6.8%) | 0 (0.0%) |
| 65 to 74 Years | 11 (20.7%) | 14 (29.2%) |
| 75 Years and over | 3 (27.3%) | 0 (0.0%) |
Disability Class: Self-Care Difficulty
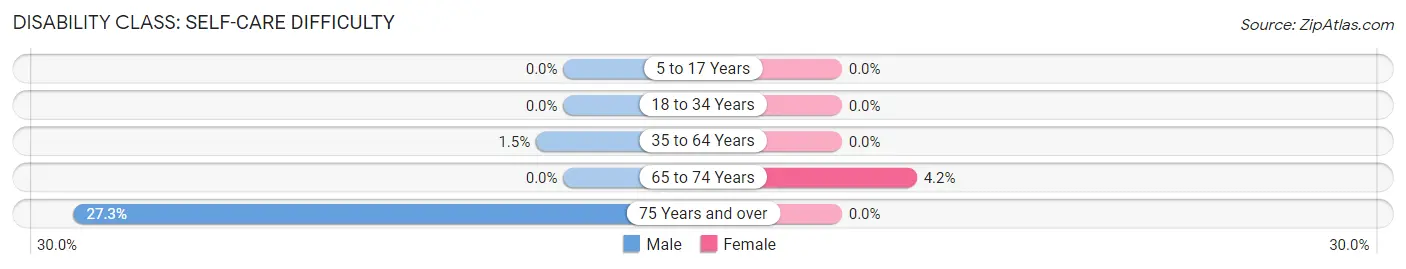
| Age Bracket | Male | Female |
| 5 to 17 Years | 0 (0.0%) | 0 (0.0%) |
| 18 to 34 Years | 0 (0.0%) | 0 (0.0%) |
| 35 to 64 Years | 2 (1.5%) | 0 (0.0%) |
| 65 to 74 Years | 0 (0.0%) | 2 (4.2%) |
| 75 Years and over | 3 (27.3%) | 0 (0.0%) |
Technology Access in Buffalo Springs
Computing Device Access in Buffalo Springs
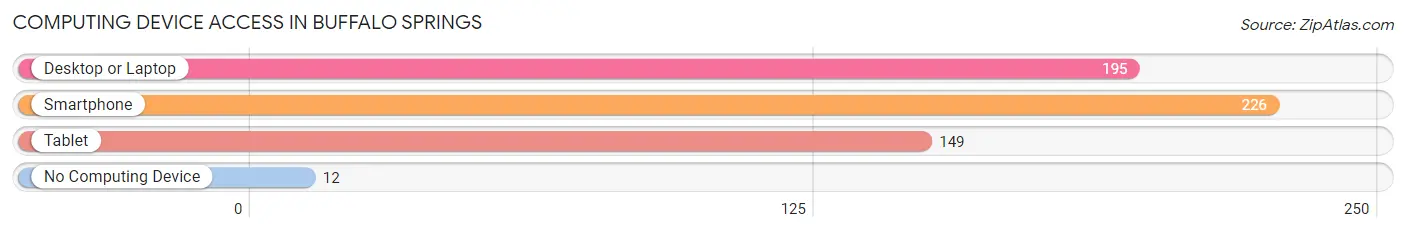
| Device Type | # Households | % Households |
| Desktop or Laptop | 195 | 78.3% |
| Smartphone | 226 | 90.8% |
| Tablet | 149 | 59.8% |
| No Computing Device | 12 | 4.8% |
| Total | 249 | 100.0% |
Internet Access in Buffalo Springs
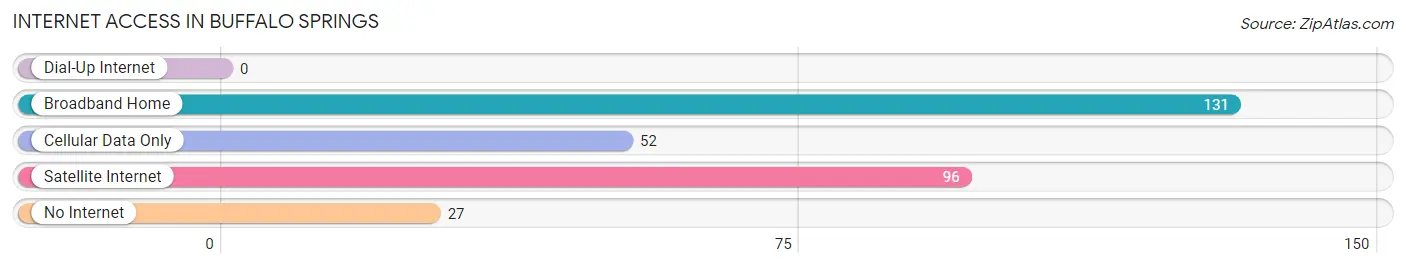
| Internet Type | # Households | % Households |
| Dial-Up Internet | 0 | 0.0% |
| Broadband Home | 131 | 52.6% |
| Cellular Data Only | 52 | 20.9% |
| Satellite Internet | 96 | 38.6% |
| No Internet | 27 | 10.8% |
| Total | 249 | 100.0% |
Buffalo Springs Summary
Buffalo Springs is a small town located in Lubbock County, Texas. It is situated on the eastern edge of the Llano Estacado, a large plateau that stretches across the Texas Panhandle. The town was founded in 1891 by ranchers and farmers who were attracted to the area by its abundant natural resources. The town was named after a nearby spring-fed lake, which was a popular watering hole for buffalo and other wildlife.
Geography
Buffalo Springs is located in the South Plains region of Texas, approximately 20 miles east of Lubbock. The town is situated on the eastern edge of the Llano Estacado, a large plateau that stretches across the Texas Panhandle. The town is surrounded by flat, open plains, with the nearest hills located several miles to the west. The climate in the area is semi-arid, with hot summers and mild winters. The average annual precipitation is approximately 18 inches.
Economy
The economy of Buffalo Springs is largely based on agriculture. The town is home to several large farms and ranches, which produce a variety of crops, including cotton, corn, wheat, and sorghum. The town is also home to several small businesses, including a feed store, a hardware store, and a grocery store.
Demographics
As of the 2010 census, the population of Buffalo Springs was 1,092. The racial makeup of the town was 94.3% White, 0.7% African American, 0.3% Native American, 0.2% Asian, and 4.5% from other races. The median household income was $37,500, and the median family income was $45,000. The per capita income was $17,000.
History
Buffalo Springs was founded in 1891 by ranchers and farmers who were attracted to the area by its abundant natural resources. The town was named after a nearby spring-fed lake, which was a popular watering hole for buffalo and other wildlife. The town grew slowly over the next several decades, and by the 1930s it had become a thriving agricultural community.
In the 1950s, the town began to experience a period of rapid growth, as new businesses and industries moved into the area. The town was incorporated in 1959, and by the 1970s it had become a popular tourist destination, with several hotels, restaurants, and other attractions.
Today, Buffalo Springs is a small, rural town with a population of just over 1,000. The town is home to several small businesses, including a feed store, a hardware store, and a grocery store. The town is also home to several large farms and ranches, which produce a variety of crops, including cotton, corn, wheat, and sorghum.
Common Questions
What is Per Capita Income in Buffalo Springs?
Per Capita income in Buffalo Springs is $45,889.
What is the Median Family Income in Buffalo Springs?
Median Family Income in Buffalo Springs is $120,556.
What is the Median Household income in Buffalo Springs?
Median Household Income in Buffalo Springs is $67,917.
What is Income or Wage Gap in Buffalo Springs?
Income or Wage Gap in Buffalo Springs is 27.7%.
Women in Buffalo Springs earn 72.3 cents for every dollar earned by a man.
What is Inequality or Gini Index in Buffalo Springs?
Inequality or Gini Index in Buffalo Springs is 0.45.
What is the Total Population of Buffalo Springs?
Total Population of Buffalo Springs is 530.
What is the Total Male Population of Buffalo Springs?
Total Male Population of Buffalo Springs is 286.
What is the Total Female Population of Buffalo Springs?
Total Female Population of Buffalo Springs is 244.
What is the Ratio of Males per 100 Females in Buffalo Springs?
There are 117.21 Males per 100 Females in Buffalo Springs.
What is the Ratio of Females per 100 Males in Buffalo Springs?
There are 85.31 Females per 100 Males in Buffalo Springs.
What is the Median Population Age in Buffalo Springs?
Median Population Age in Buffalo Springs is 52.1 Years.
What is the Average Family Size in Buffalo Springs
Average Family Size in Buffalo Springs is 2.9 People.
What is the Average Household Size in Buffalo Springs
Average Household Size in Buffalo Springs is 2.1 People.
How Large is the Labor Force in Buffalo Springs?
There are 320 People in the Labor Forcein in Buffalo Springs.
What is the Percentage of People in the Labor Force in Buffalo Springs?
70.2% of People are in the Labor Force in Buffalo Springs.