Chula Vista CDP Cameron County, TX Map & Demographics
Chula Vista CDP Cameron County Overview
$11,626
PER CAPITA INCOME
0.07
INEQUALITY / GINI INDEX
121
TOTAL POPULATION
43
MALE POPULATION
78
FEMALE POPULATION
55.13
MALES / 100 FEMALES
181.40
FEMALES / 100 MALES
48.2
MEDIAN AGE
3.0
AVG FAMILY SIZE
3.0
AVG HOUSEHOLD SIZE
43
LABOR FORCE [ PEOPLE ]
51.2%
PERCENT IN LABOR FORCE
Income in Chula Vista CDP Cameron County
Income Overview in Chula Vista CDP Cameron County
| Characteristic | Number | Measure |
| Per Capita Income | 121 | $11,626 |
| Median Family Income | 41 | $0 |
| Mean Family Income | 41 | $0 |
| Median Household Income | 41 | $0 |
| Mean Household Income | 41 | $0 |
| Income Deficit | 41 | $0 |
| Wage / Income Gap (%) | 121 | 0.00% |
| Wage / Income Gap ($) | 121 | 100.00¢ per $1 |
| Gini / Inequality Index | 121 | 0.07 |
Earnings by Sex in Chula Vista CDP Cameron County
| Sex | Number | Average Earnings |
| Male | 34 (79.1%) | $0 |
| Female | 9 (20.9%) | $0 |
| Total | 43 (100.0%) | $0 |
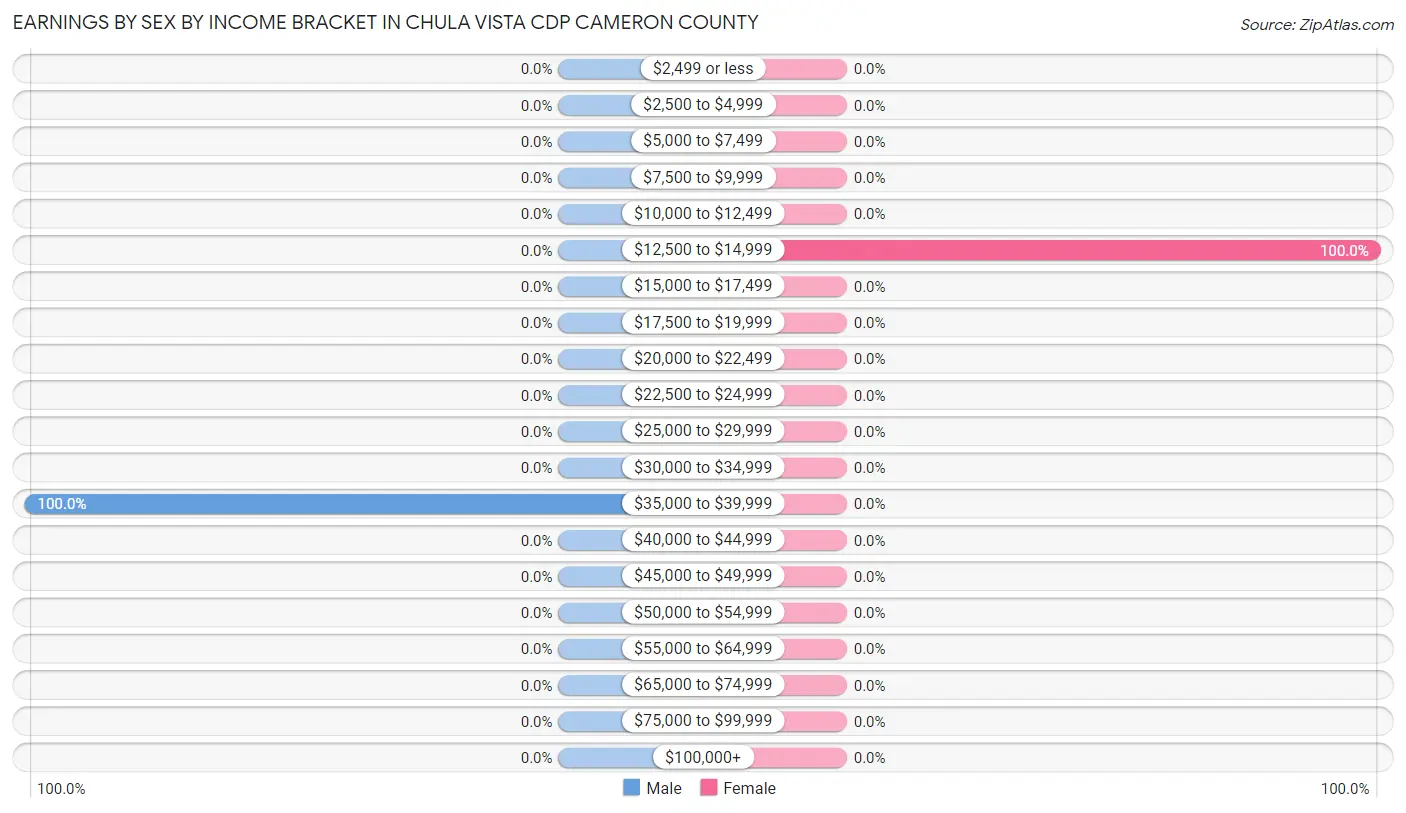
Earnings by Sex by Income Bracket in Chula Vista CDP Cameron County
The most common earnings brackets in Chula Vista CDP Cameron County are $35,000 to $39,999 for men (34 | 100.0%) and $12,500 to $14,999 for women (9 | 100.0%).
| Income | Male | Female |
| $2,499 or less | 0 (0.0%) | 0 (0.0%) |
| $2,500 to $4,999 | 0 (0.0%) | 0 (0.0%) |
| $5,000 to $7,499 | 0 (0.0%) | 0 (0.0%) |
| $7,500 to $9,999 | 0 (0.0%) | 0 (0.0%) |
| $10,000 to $12,499 | 0 (0.0%) | 0 (0.0%) |
| $12,500 to $14,999 | 0 (0.0%) | 9 (100.0%) |
| $15,000 to $17,499 | 0 (0.0%) | 0 (0.0%) |
| $17,500 to $19,999 | 0 (0.0%) | 0 (0.0%) |
| $20,000 to $22,499 | 0 (0.0%) | 0 (0.0%) |
| $22,500 to $24,999 | 0 (0.0%) | 0 (0.0%) |
| $25,000 to $29,999 | 0 (0.0%) | 0 (0.0%) |
| $30,000 to $34,999 | 0 (0.0%) | 0 (0.0%) |
| $35,000 to $39,999 | 34 (100.0%) | 0 (0.0%) |
| $40,000 to $44,999 | 0 (0.0%) | 0 (0.0%) |
| $45,000 to $49,999 | 0 (0.0%) | 0 (0.0%) |
| $50,000 to $54,999 | 0 (0.0%) | 0 (0.0%) |
| $55,000 to $64,999 | 0 (0.0%) | 0 (0.0%) |
| $65,000 to $74,999 | 0 (0.0%) | 0 (0.0%) |
| $75,000 to $99,999 | 0 (0.0%) | 0 (0.0%) |
| $100,000+ | 0 (0.0%) | 0 (0.0%) |
| Total | 34 (100.0%) | 9 (100.0%) |
Earnings by Sex by Educational Attainment in Chula Vista CDP Cameron County
| Educational Attainment | Male Income | Female Income |
| Less than High School | - | - |
| High School Diploma | - | - |
| College or Associate's Degree | - | - |
| Bachelor's Degree | - | - |
| Graduate Degree | - | - |
| Total | - | - |
Family Income in Chula Vista CDP Cameron County
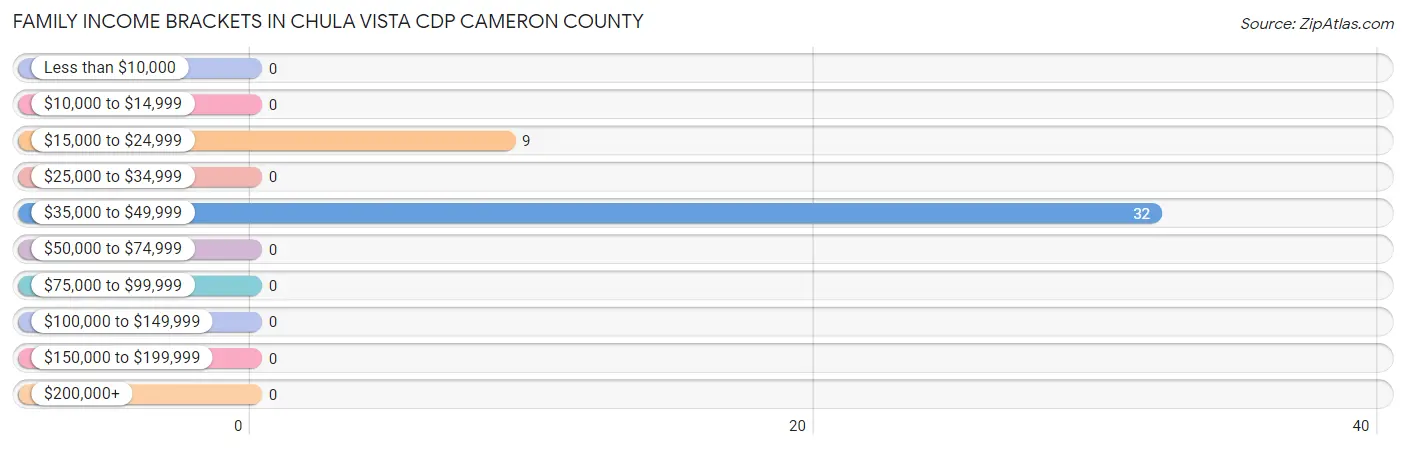
Family Income Brackets in Chula Vista CDP Cameron County
According to the Chula Vista CDP Cameron County family income data, there are 32 families falling into the $35,000 to $49,999 income range, which is the most common income bracket and makes up 78.0% of all families.
| Income Bracket | # Families | % Families |
| Less than $10,000 | 0 | 0.0% |
| $10,000 to $14,999 | 0 | 0.0% |
| $15,000 to $24,999 | 9 | 22.0% |
| $25,000 to $34,999 | 0 | 0.0% |
| $35,000 to $49,999 | 32 | 78.0% |
| $50,000 to $74,999 | 0 | 0.0% |
| $75,000 to $99,999 | 0 | 0.0% |
| $100,000 to $149,999 | 0 | 0.0% |
| $150,000 to $199,999 | 0 | 0.0% |
| $200,000+ | 0 | 0.0% |
Family Income by Famaliy Size in Chula Vista CDP Cameron County
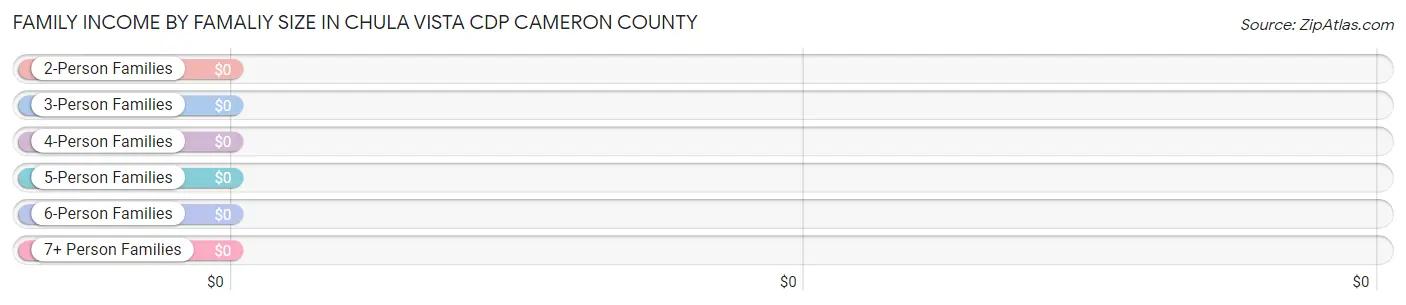
| Income Bracket | # Families | Median Income |
| 2-Person Families | 32 (78.0%) | $0 |
| 3-Person Families | 0 (0.0%) | $0 |
| 4-Person Families | 0 (0.0%) | $0 |
| 5-Person Families | 0 (0.0%) | $0 |
| 6-Person Families | 9 (22.0%) | $0 |
| 7+ Person Families | 0 (0.0%) | $0 |
| Total | 41 (100.0%) | $0 |
Family Income by Number of Earners in Chula Vista CDP Cameron County
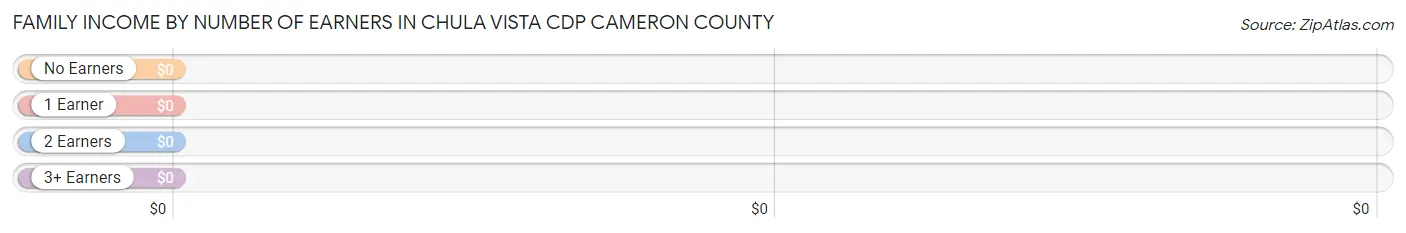
| Number of Earners | # Families | Median Income |
| No Earners | 0 (0.0%) | $0 |
| 1 Earner | 41 (100.0%) | $0 |
| 2 Earners | 0 (0.0%) | $0 |
| 3+ Earners | 0 (0.0%) | $0 |
| Total | 41 (100.0%) | $0 |
Household Income in Chula Vista CDP Cameron County
Household Income Brackets in Chula Vista CDP Cameron County
With 32 households falling in the category, the $35,000 to $49,999 income range is the most frequent in Chula Vista CDP Cameron County, accounting for 78.0% of all households.
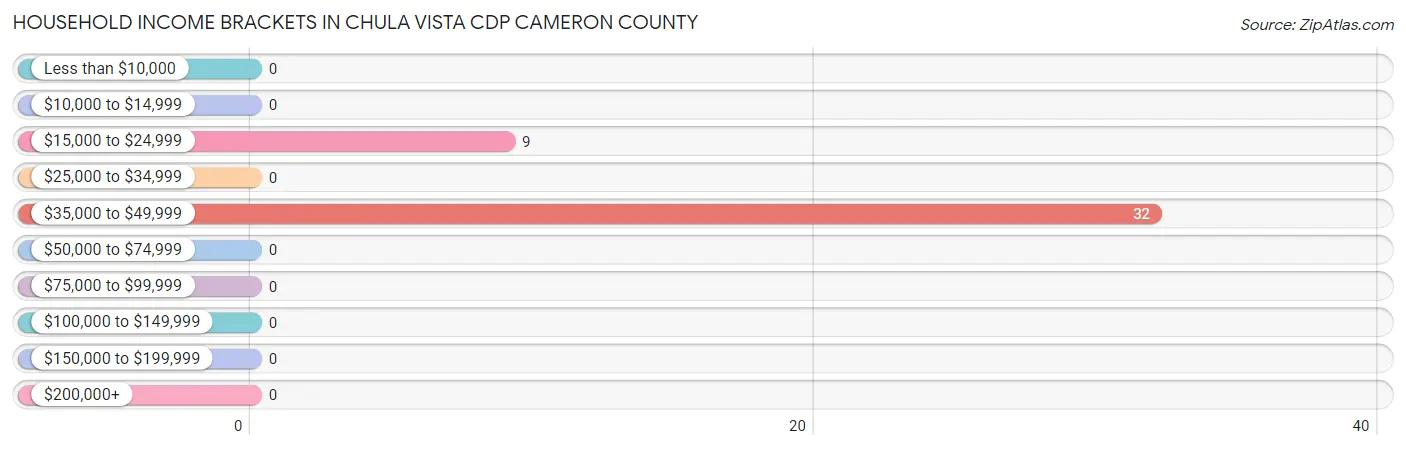
| Income Bracket | # Households | % Households |
| Less than $10,000 | 0 | 0.0% |
| $10,000 to $14,999 | 0 | 0.0% |
| $15,000 to $24,999 | 9 | 22.0% |
| $25,000 to $34,999 | 0 | 0.0% |
| $35,000 to $49,999 | 32 | 78.0% |
| $50,000 to $74,999 | 0 | 0.0% |
| $75,000 to $99,999 | 0 | 0.0% |
| $100,000 to $149,999 | 0 | 0.0% |
| $150,000 to $199,999 | 0 | 0.0% |
| $200,000+ | 0 | 0.0% |
Household Income by Householder Age in Chula Vista CDP Cameron County
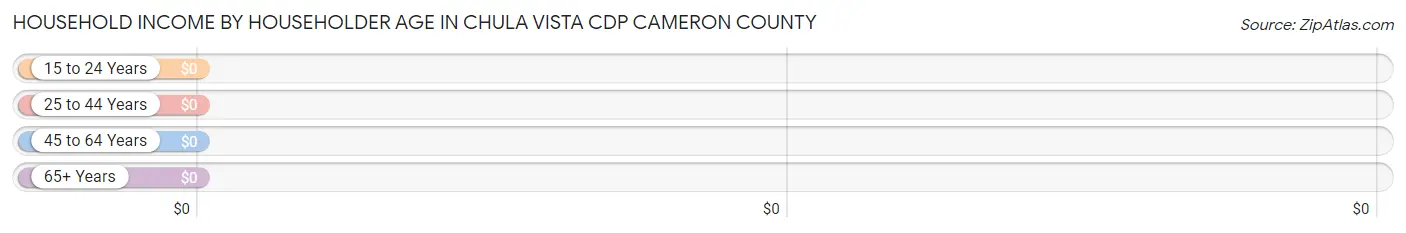
| Income Bracket | # Households | Median Income |
| 15 to 24 Years | 0 (0.0%) | $0 |
| 25 to 44 Years | 9 (22.0%) | $0 |
| 45 to 64 Years | 32 (78.0%) | $0 |
| 65+ Years | 0 (0.0%) | $0 |
| Total | 41 (100.0%) | $0 |
Poverty in Chula Vista CDP Cameron County
Income Below Poverty by Sex and Age in Chula Vista CDP Cameron County
With 20.9% poverty level for males and 59.0% for females among the residents of Chula Vista CDP Cameron County, 12 to 14 year old males and 12 to 14 year old females are the most vulnerable to poverty, with 9 males (100.0%) and 28 females (100.0%) in their respective age groups living below the poverty level.
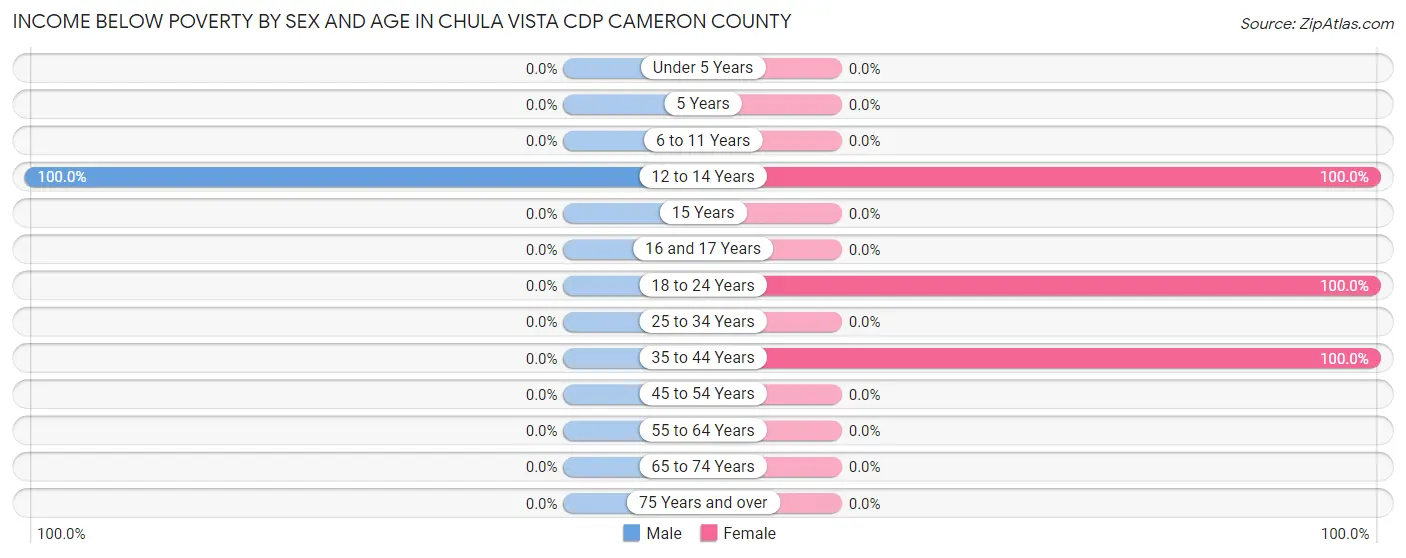
| Age Bracket | Male | Female |
| Under 5 Years | 0 (0.0%) | 0 (0.0%) |
| 5 Years | 0 (0.0%) | 0 (0.0%) |
| 6 to 11 Years | 0 (0.0%) | 0 (0.0%) |
| 12 to 14 Years | 9 (100.0%) | 28 (100.0%) |
| 15 Years | 0 (0.0%) | 0 (0.0%) |
| 16 and 17 Years | 0 (0.0%) | 0 (0.0%) |
| 18 to 24 Years | 0 (0.0%) | 9 (100.0%) |
| 25 to 34 Years | 0 (0.0%) | 0 (0.0%) |
| 35 to 44 Years | 0 (0.0%) | 9 (100.0%) |
| 45 to 54 Years | 0 (0.0%) | 0 (0.0%) |
| 55 to 64 Years | 0 (0.0%) | 0 (0.0%) |
| 65 to 74 Years | 0 (0.0%) | 0 (0.0%) |
| 75 Years and over | 0 (0.0%) | 0 (0.0%) |
| Total | 9 (20.9%) | 46 (59.0%) |
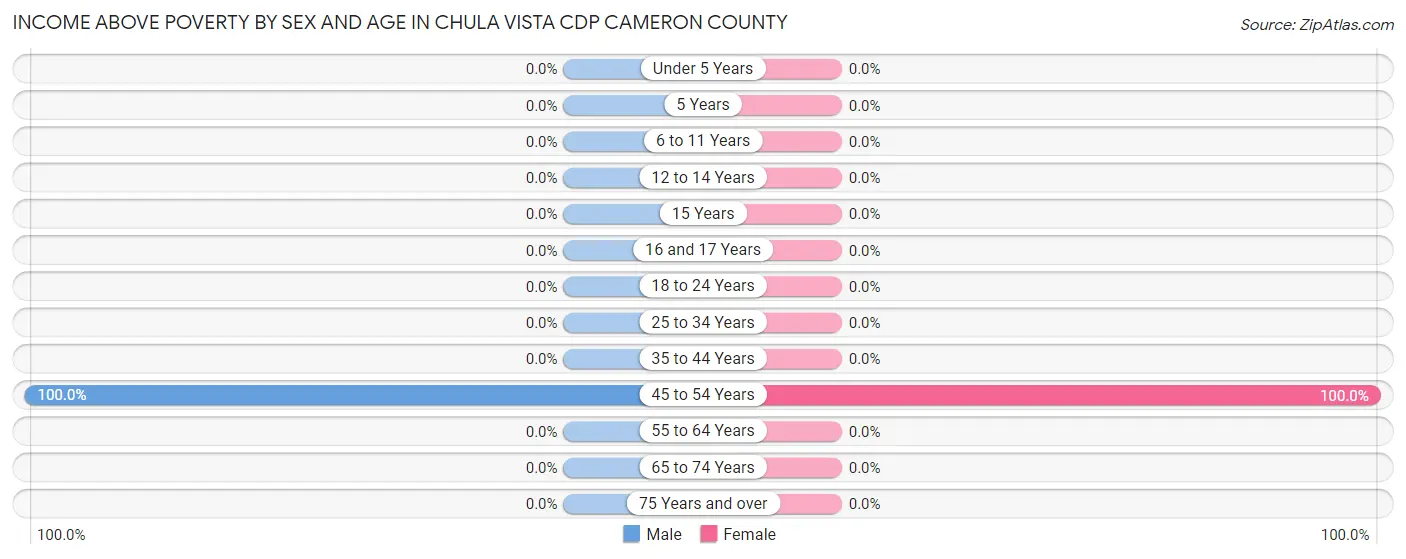
Income Above Poverty by Sex and Age in Chula Vista CDP Cameron County
According to the poverty statistics in Chula Vista CDP Cameron County, males aged 45 to 54 years and females aged 45 to 54 years are the age groups that are most secure financially, with 100.0% of males and 100.0% of females in these age groups living above the poverty line.
| Age Bracket | Male | Female |
| Under 5 Years | 0 (0.0%) | 0 (0.0%) |
| 5 Years | 0 (0.0%) | 0 (0.0%) |
| 6 to 11 Years | 0 (0.0%) | 0 (0.0%) |
| 12 to 14 Years | 0 (0.0%) | 0 (0.0%) |
| 15 Years | 0 (0.0%) | 0 (0.0%) |
| 16 and 17 Years | 0 (0.0%) | 0 (0.0%) |
| 18 to 24 Years | 0 (0.0%) | 0 (0.0%) |
| 25 to 34 Years | 0 (0.0%) | 0 (0.0%) |
| 35 to 44 Years | 0 (0.0%) | 0 (0.0%) |
| 45 to 54 Years | 34 (100.0%) | 32 (100.0%) |
| 55 to 64 Years | 0 (0.0%) | 0 (0.0%) |
| 65 to 74 Years | 0 (0.0%) | 0 (0.0%) |
| 75 Years and over | 0 (0.0%) | 0 (0.0%) |
| Total | 34 (79.1%) | 32 (41.0%) |
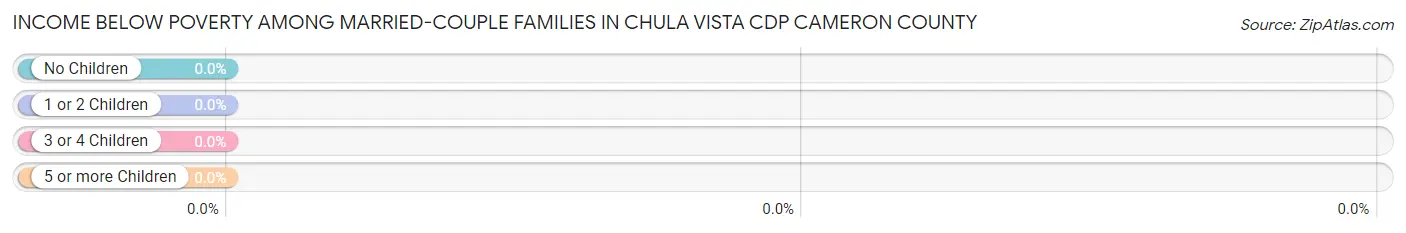
Income Below Poverty Among Married-Couple Families in Chula Vista CDP Cameron County
| Children | Above Poverty | Below Poverty |
| No Children | 32 (100.0%) | 0 (0.0%) |
| 1 or 2 Children | 0 (0.0%) | 0 (0.0%) |
| 3 or 4 Children | 0 (0.0%) | 0 (0.0%) |
| 5 or more Children | 0 (0.0%) | 0 (0.0%) |
| Total | 32 (100.0%) | 0 (0.0%) |
Income Below Poverty Among Single-Parent Households in Chula Vista CDP Cameron County
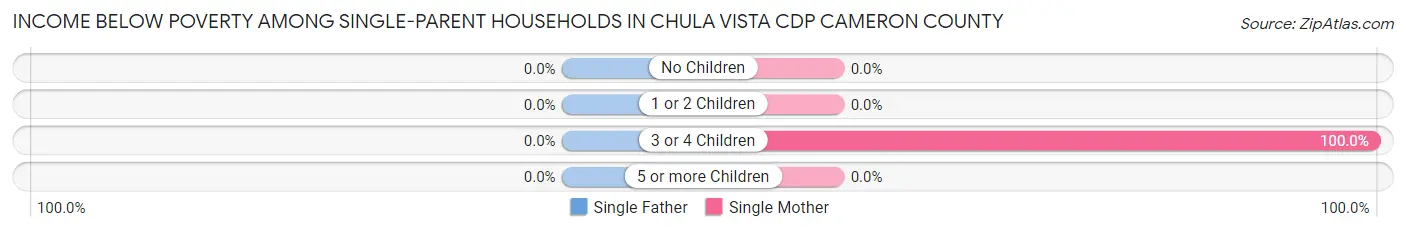
| Children | Single Father | Single Mother |
| No Children | 0 (0.0%) | 0 (0.0%) |
| 1 or 2 Children | 0 (0.0%) | 0 (0.0%) |
| 3 or 4 Children | 0 (0.0%) | 9 (100.0%) |
| 5 or more Children | 0 (0.0%) | 0 (0.0%) |
| Total | 0 (0.0%) | 9 (100.0%) |
Income Below Poverty Among Married-Couple vs Single-Parent Households in Chula Vista CDP Cameron County
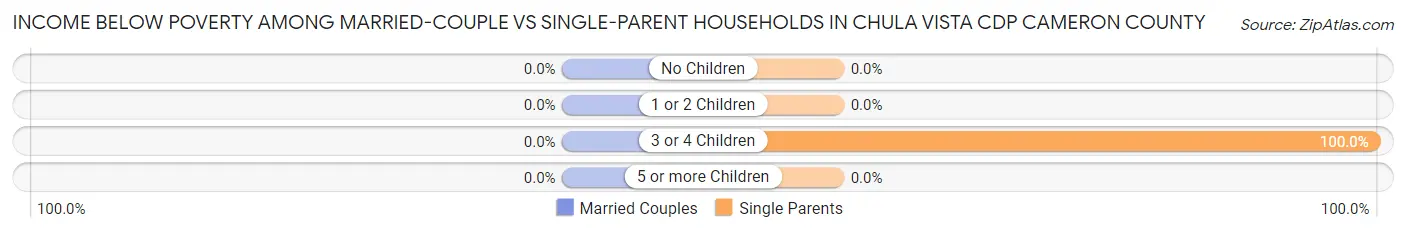
| Children | Married-Couple Families | Single-Parent Households |
| No Children | 0 (0.0%) | 0 (0.0%) |
| 1 or 2 Children | 0 (0.0%) | 0 (0.0%) |
| 3 or 4 Children | 0 (0.0%) | 9 (100.0%) |
| 5 or more Children | 0 (0.0%) | 0 (0.0%) |
| Total | 0 (0.0%) | 9 (100.0%) |
Race in Chula Vista CDP Cameron County
The most populous races in Chula Vista CDP Cameron County are White / Caucasian (121 | 100.0%), and Hispanic or Latino (113 | 93.4%).
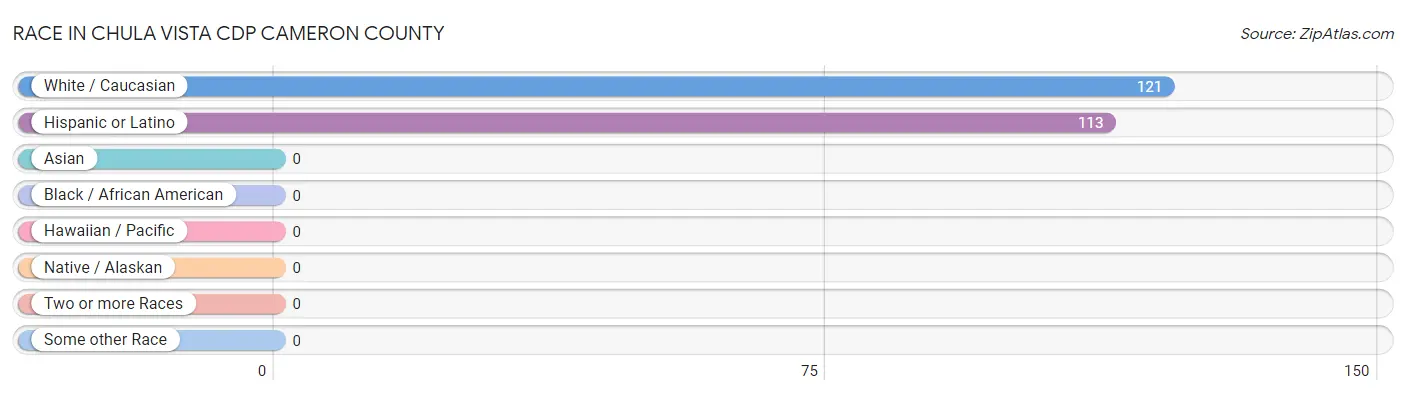
| Race | # Population | % Population |
| Asian | 0 | 0.0% |
| Black / African American | 0 | 0.0% |
| Hawaiian / Pacific | 0 | 0.0% |
| Hispanic or Latino | 113 | 93.4% |
| Native / Alaskan | 0 | 0.0% |
| White / Caucasian | 121 | 100.0% |
| Two or more Races | 0 | 0.0% |
| Some other Race | 0 | 0.0% |
| Total | 121 | 100.0% |
Ancestry in Chula Vista CDP Cameron County
The most populous ancestries reported in Chula Vista CDP Cameron County are Mexican (113 | 93.4%), and American (46 | 38.0%), together accounting for 131.4% of all Chula Vista CDP Cameron County residents.
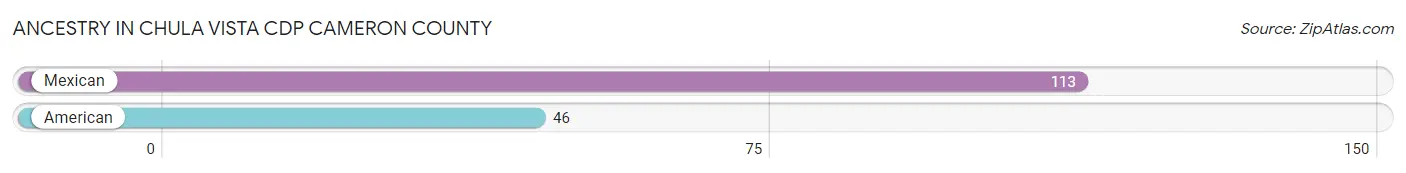
| Ancestry | # Population | % Population |
| American | 46 | 38.0% |
| Mexican | 113 | 93.4% | View All 2 Rows |
Immigrants in Chula Vista CDP Cameron County
The most numerous immigrant groups reported in Chula Vista CDP Cameron County came from Central America (66 | 54.5%), Latin America (66 | 54.5%), and Mexico (66 | 54.5%), together accounting for 163.6% of all Chula Vista CDP Cameron County residents.
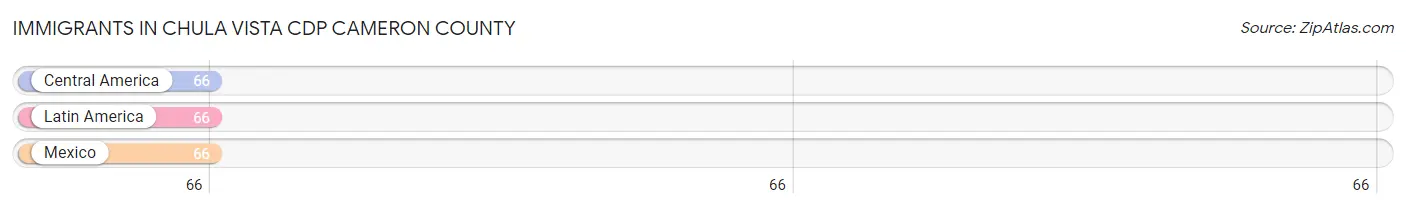
| Immigration Origin | # Population | % Population |
| Central America | 66 | 54.5% |
| Latin America | 66 | 54.5% |
| Mexico | 66 | 54.5% | View All 3 Rows |
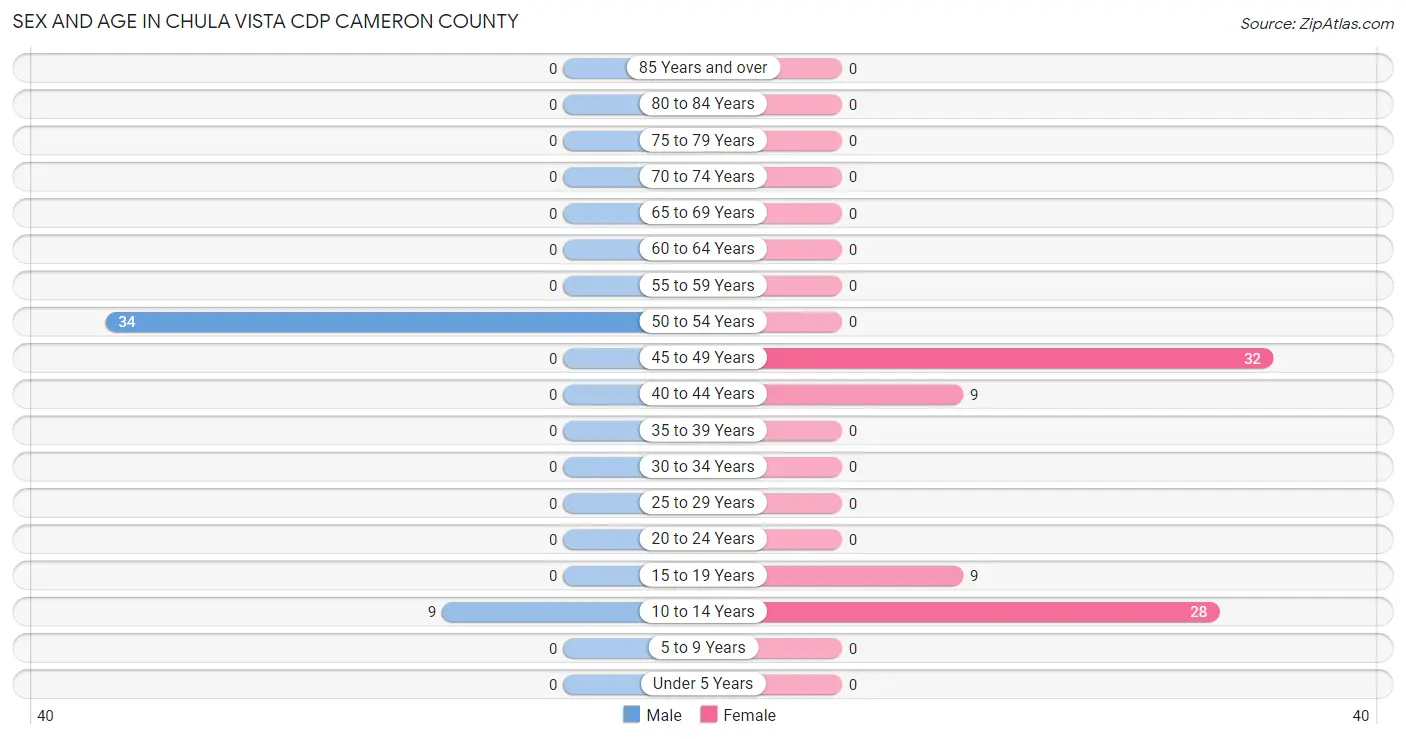
Sex and Age in Chula Vista CDP Cameron County
Sex and Age in Chula Vista CDP Cameron County
The most populous age groups in Chula Vista CDP Cameron County are 50 to 54 Years (34 | 79.1%) for men and 45 to 49 Years (32 | 41.0%) for women.
| Age Bracket | Male | Female |
| Under 5 Years | 0 (0.0%) | 0 (0.0%) |
| 5 to 9 Years | 0 (0.0%) | 0 (0.0%) |
| 10 to 14 Years | 9 (20.9%) | 28 (35.9%) |
| 15 to 19 Years | 0 (0.0%) | 9 (11.5%) |
| 20 to 24 Years | 0 (0.0%) | 0 (0.0%) |
| 25 to 29 Years | 0 (0.0%) | 0 (0.0%) |
| 30 to 34 Years | 0 (0.0%) | 0 (0.0%) |
| 35 to 39 Years | 0 (0.0%) | 0 (0.0%) |
| 40 to 44 Years | 0 (0.0%) | 9 (11.5%) |
| 45 to 49 Years | 0 (0.0%) | 32 (41.0%) |
| 50 to 54 Years | 34 (79.1%) | 0 (0.0%) |
| 55 to 59 Years | 0 (0.0%) | 0 (0.0%) |
| 60 to 64 Years | 0 (0.0%) | 0 (0.0%) |
| 65 to 69 Years | 0 (0.0%) | 0 (0.0%) |
| 70 to 74 Years | 0 (0.0%) | 0 (0.0%) |
| 75 to 79 Years | 0 (0.0%) | 0 (0.0%) |
| 80 to 84 Years | 0 (0.0%) | 0 (0.0%) |
| 85 Years and over | 0 (0.0%) | 0 (0.0%) |
| Total | 43 (100.0%) | 78 (100.0%) |
Families and Households in Chula Vista CDP Cameron County
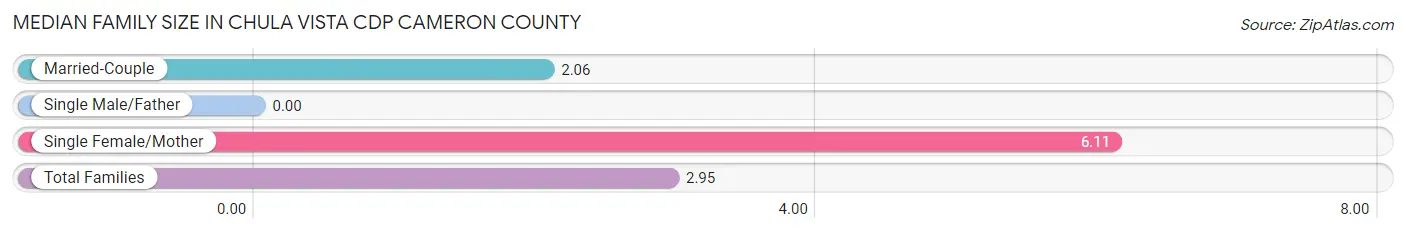
Median Family Size in Chula Vista CDP Cameron County
| Family Type | # Families | Family Size |
| Married-Couple | 32 (78.0%) | 2.06 |
| Single Male/Father | 0 (0.0%) | - |
| Single Female/Mother | 9 (22.0%) | 6.11 |
| Total Families | 41 (100.0%) | 2.95 |
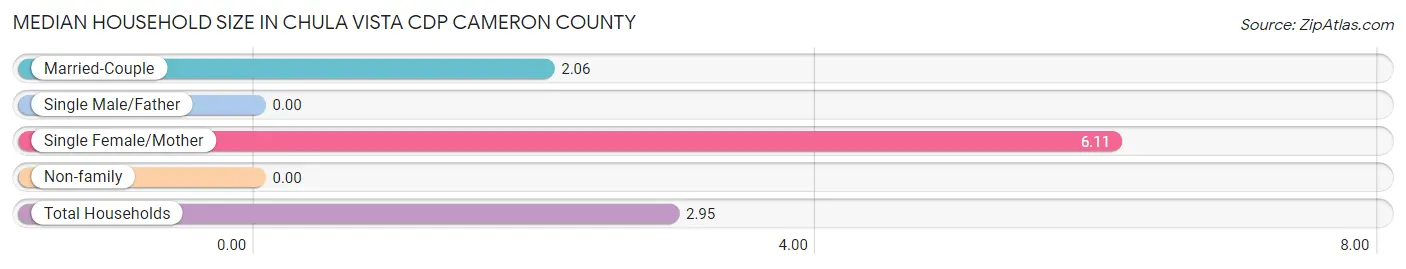
Median Household Size in Chula Vista CDP Cameron County
| Household Type | # Households | Household Size |
| Married-Couple | 32 (78.0%) | 2.06 |
| Single Male/Father | 0 (0.0%) | - |
| Single Female/Mother | 9 (22.0%) | 6.11 |
| Non-family | 0 (0.0%) | - |
| Total Households | 41 (100.0%) | 2.95 |
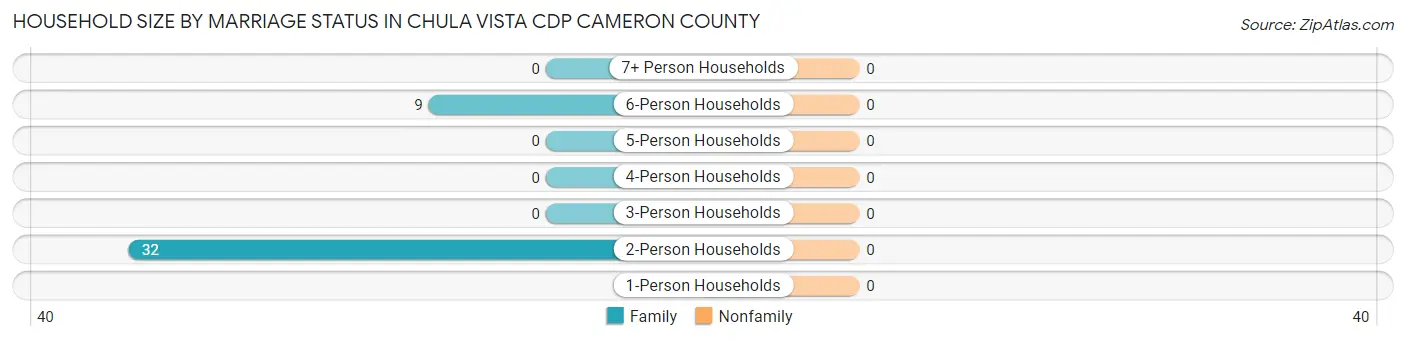
Household Size by Marriage Status in Chula Vista CDP Cameron County
| Household Size | Family Households | Nonfamily Households |
| 1-Person Households | - | 0 (0.0%) |
| 2-Person Households | 32 (78.0%) | 0 (0.0%) |
| 3-Person Households | 0 (0.0%) | 0 (0.0%) |
| 4-Person Households | 0 (0.0%) | 0 (0.0%) |
| 5-Person Households | 0 (0.0%) | 0 (0.0%) |
| 6-Person Households | 9 (22.0%) | 0 (0.0%) |
| 7+ Person Households | 0 (0.0%) | 0 (0.0%) |
| Total | 41 (100.0%) | 0 (0.0%) |
Female Fertility in Chula Vista CDP Cameron County
Fertility by Age in Chula Vista CDP Cameron County
| Age Bracket | Women with Births | Births / 1,000 Women |
| 15 to 19 years | 0 (0.0%) | 0.0 |
| 20 to 34 years | 0 (0.0%) | 0.0 |
| 35 to 50 years | 0 (0.0%) | 0.0 |
| Total | 0 (0.0%) | 0.0 |
Fertility by Age by Marriage Status in Chula Vista CDP Cameron County
| Age Bracket | Married | Unmarried |
| 15 to 19 years | 0 (0.0%) | 0 (0.0%) |
| 20 to 34 years | 0 (0.0%) | 0 (0.0%) |
| 35 to 50 years | 0 (0.0%) | 0 (0.0%) |
| Total | 0 (0.0%) | 0 (0.0%) |
Fertility by Education in Chula Vista CDP Cameron County
| Educational Attainment | Women with Births | Births / 1,000 Women |
| Less than High School | 0 (0.0%) | 0.0 |
| High School Diploma | 0 (0.0%) | 0.0 |
| College or Associate's Degree | 0 (0.0%) | 0.0 |
| Bachelor's Degree | 0 (0.0%) | 0.0 |
| Graduate Degree | 0 (0.0%) | 0.0 |
| Total | 0 (0.0%) | 0.0 |
Fertility by Education by Marriage Status in Chula Vista CDP Cameron County
| Educational Attainment | Married | Unmarried |
| Less than High School | 0 (0.0%) | 0 (0.0%) |
| High School Diploma | 0 (0.0%) | 0 (0.0%) |
| College or Associate's Degree | 0 (0.0%) | 0 (0.0%) |
| Bachelor's Degree | 0 (0.0%) | 0 (0.0%) |
| Graduate Degree | 0 (0.0%) | 0 (0.0%) |
| Total | 0 (0.0%) | 0 (0.0%) |
Employment Characteristics in Chula Vista CDP Cameron County
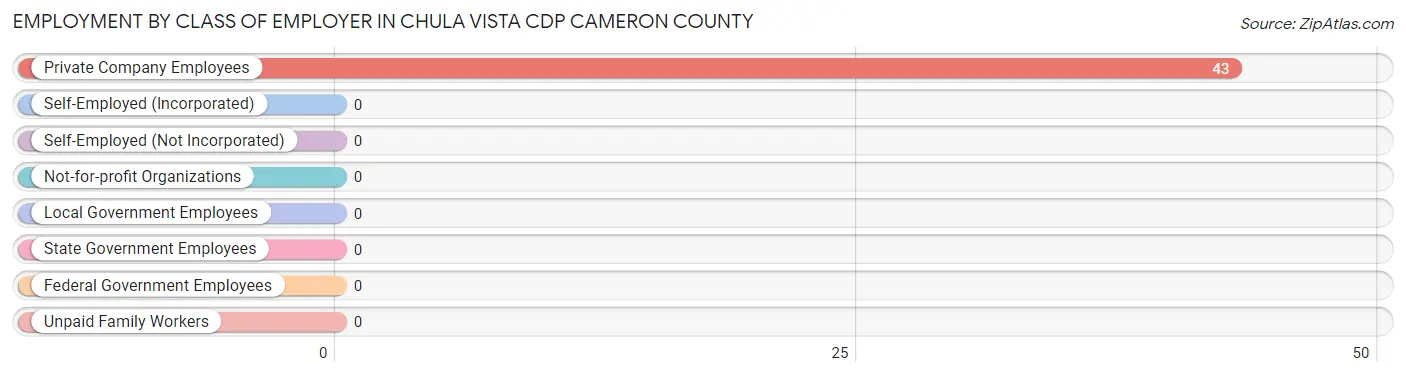
Employment by Class of Employer in Chula Vista CDP Cameron County
Among the 43 employed individuals in Chula Vista CDP Cameron County, , and private company employees (43 | 100.0%) make up the most common classes of employment.
| Employer Class | # Employees | % Employees |
| Private Company Employees | 43 | 100.0% |
| Self-Employed (Incorporated) | 0 | 0.0% |
| Self-Employed (Not Incorporated) | 0 | 0.0% |
| Not-for-profit Organizations | 0 | 0.0% |
| Local Government Employees | 0 | 0.0% |
| State Government Employees | 0 | 0.0% |
| Federal Government Employees | 0 | 0.0% |
| Unpaid Family Workers | 0 | 0.0% |
| Total | 43 | 100.0% |
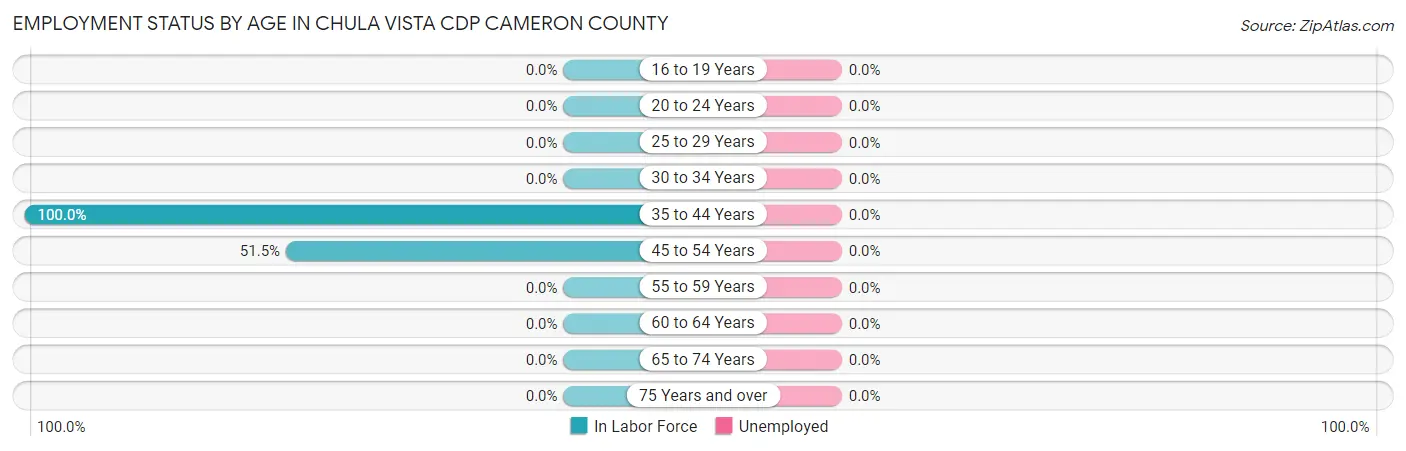
Employment Status by Age in Chula Vista CDP Cameron County
| Age Bracket | In Labor Force | Unemployed |
| 16 to 19 Years | 0 (0.0%) | 0 (0.0%) |
| 20 to 24 Years | 0 (0.0%) | 0 (0.0%) |
| 25 to 29 Years | 0 (0.0%) | 0 (0.0%) |
| 30 to 34 Years | 0 (0.0%) | 0 (0.0%) |
| 35 to 44 Years | 9 (100.0%) | 0 (0.0%) |
| 45 to 54 Years | 34 (51.5%) | 0 (0.0%) |
| 55 to 59 Years | 0 (0.0%) | 0 (0.0%) |
| 60 to 64 Years | 0 (0.0%) | 0 (0.0%) |
| 65 to 74 Years | 0 (0.0%) | 0 (0.0%) |
| 75 Years and over | 0 (0.0%) | 0 (0.0%) |
| Total | 43 (51.2%) | 0 (0.0%) |
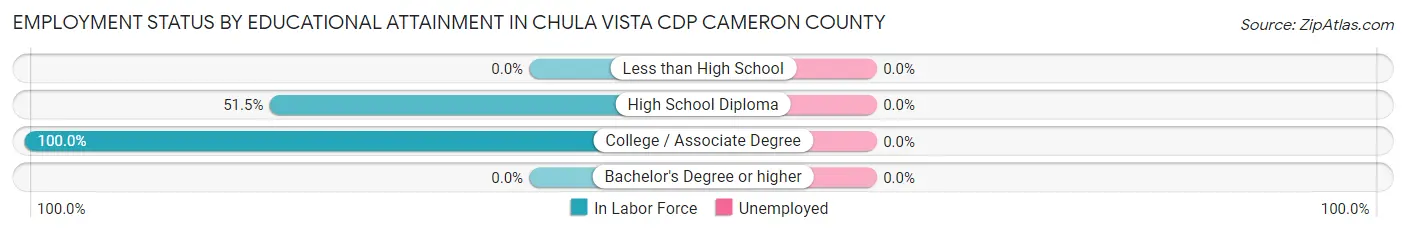
Employment Status by Educational Attainment in Chula Vista CDP Cameron County
| Educational Attainment | In Labor Force | Unemployed |
| Less than High School | 0 (0.0%) | 0 (0.0%) |
| High School Diploma | 34 (51.5%) | 0 (0.0%) |
| College / Associate Degree | 9 (100.0%) | 0 (0.0%) |
| Bachelor's Degree or higher | 0 (0.0%) | 0 (0.0%) |
| Total | 43 (57.3%) | 0 (0.0%) |
Employment Occupations by Sex in Chula Vista CDP Cameron County
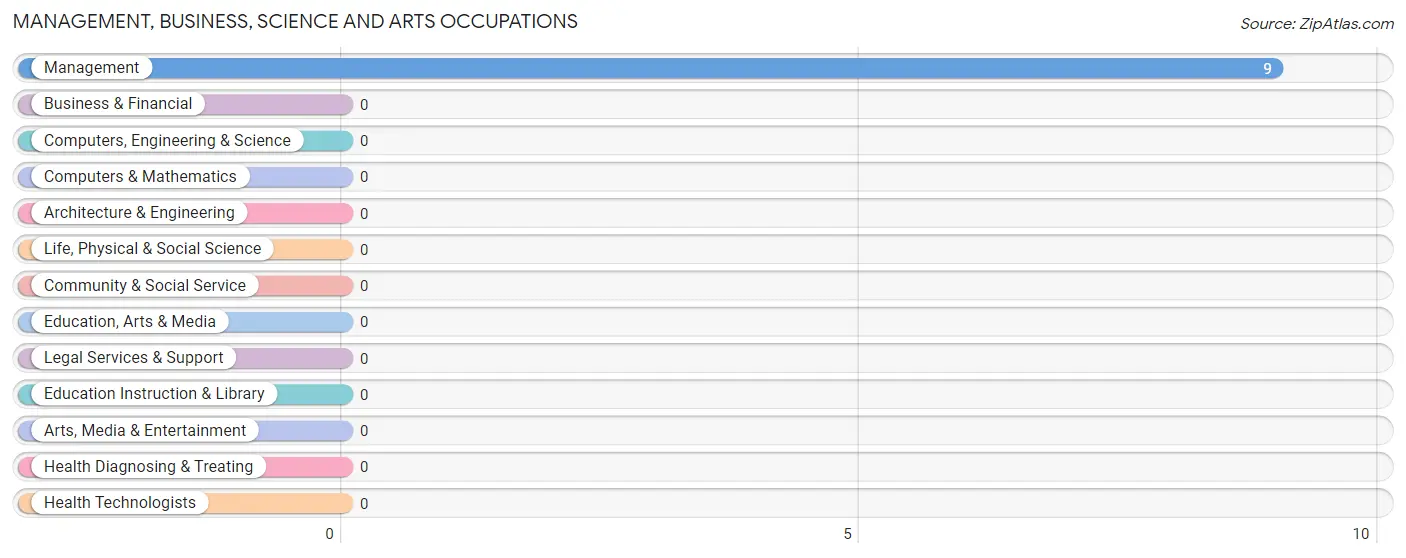
Management, Business, Science and Arts Occupations
The most common Management, Business, Science and Arts occupations in Chula Vista CDP Cameron County are , and Management (9 | 20.9%).
Management, Business, Science and Arts Occupations by Sex
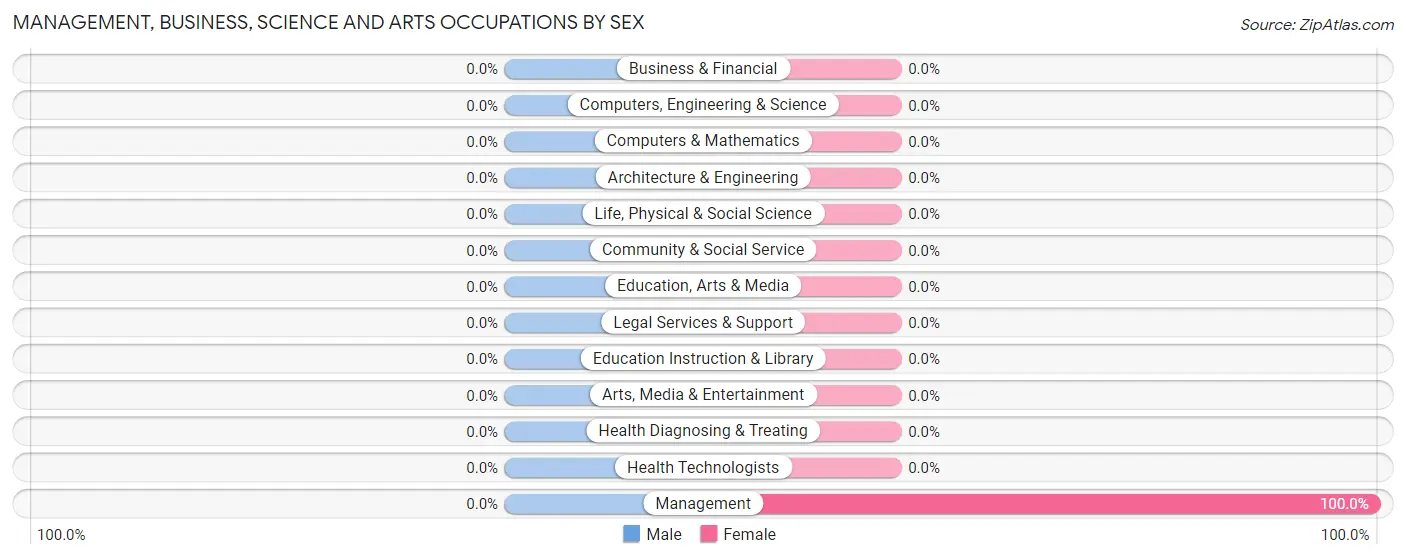
| Occupation | Male | Female |
| Management | 0 (0.0%) | 9 (100.0%) |
| Business & Financial | 0 (0.0%) | 0 (0.0%) |
| Computers, Engineering & Science | 0 (0.0%) | 0 (0.0%) |
| Computers & Mathematics | 0 (0.0%) | 0 (0.0%) |
| Architecture & Engineering | 0 (0.0%) | 0 (0.0%) |
| Life, Physical & Social Science | 0 (0.0%) | 0 (0.0%) |
| Community & Social Service | 0 (0.0%) | 0 (0.0%) |
| Education, Arts & Media | 0 (0.0%) | 0 (0.0%) |
| Legal Services & Support | 0 (0.0%) | 0 (0.0%) |
| Education Instruction & Library | 0 (0.0%) | 0 (0.0%) |
| Arts, Media & Entertainment | 0 (0.0%) | 0 (0.0%) |
| Health Diagnosing & Treating | 0 (0.0%) | 0 (0.0%) |
| Health Technologists | 0 (0.0%) | 0 (0.0%) |
| Total (Category) | 0 (0.0%) | 9 (100.0%) |
| Total (Overall) | 34 (79.1%) | 9 (20.9%) |
Services Occupations
Services Occupations by Sex
| Occupation | Male | Female |
| Healthcare Support | 0 (0.0%) | 0 (0.0%) |
| Security & Protection | 0 (0.0%) | 0 (0.0%) |
| Firefighting & Prevention | 0 (0.0%) | 0 (0.0%) |
| Law Enforcement | 0 (0.0%) | 0 (0.0%) |
| Food Preparation & Serving | 0 (0.0%) | 0 (0.0%) |
| Cleaning & Maintenance | 0 (0.0%) | 0 (0.0%) |
| Personal Care & Service | 0 (0.0%) | 0 (0.0%) |
| Total (Category) | 0 (0.0%) | 0 (0.0%) |
| Total (Overall) | 34 (79.1%) | 9 (20.9%) |
Sales and Office Occupations
Sales and Office Occupations by Sex
| Occupation | Male | Female |
| Sales & Related | 0 (0.0%) | 0 (0.0%) |
| Office & Administration | 0 (0.0%) | 0 (0.0%) |
| Total (Category) | 0 (0.0%) | 0 (0.0%) |
| Total (Overall) | 34 (79.1%) | 9 (20.9%) |
Natural Resources, Construction and Maintenance Occupations
The most common Natural Resources, Construction and Maintenance occupations in Chula Vista CDP Cameron County are , and Construction & Extraction (34 | 79.1%).
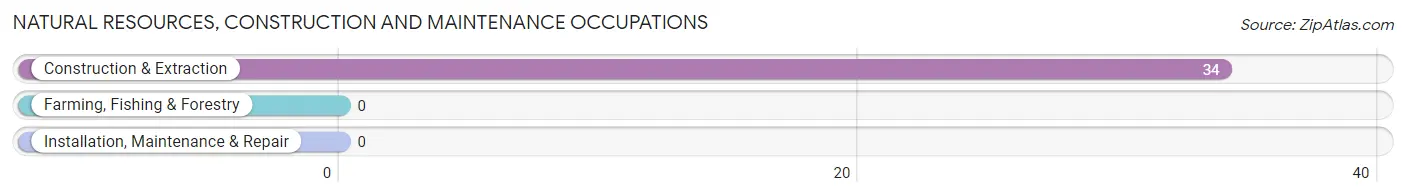
Natural Resources, Construction and Maintenance Occupations by Sex
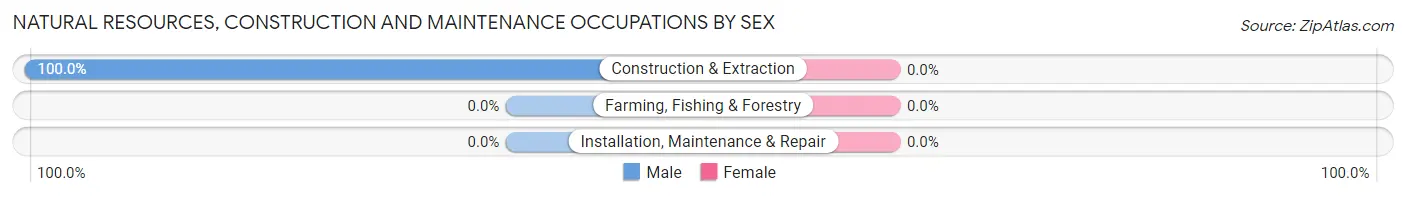
| Occupation | Male | Female |
| Farming, Fishing & Forestry | 0 (0.0%) | 0 (0.0%) |
| Construction & Extraction | 34 (100.0%) | 0 (0.0%) |
| Installation, Maintenance & Repair | 0 (0.0%) | 0 (0.0%) |
| Total (Category) | 34 (100.0%) | 0 (0.0%) |
| Total (Overall) | 34 (79.1%) | 9 (20.9%) |
Production, Transportation and Moving Occupations
Production, Transportation and Moving Occupations by Sex
| Occupation | Male | Female |
| Production | 0 (0.0%) | 0 (0.0%) |
| Transportation | 0 (0.0%) | 0 (0.0%) |
| Material Moving | 0 (0.0%) | 0 (0.0%) |
| Total (Category) | 0 (0.0%) | 0 (0.0%) |
| Total (Overall) | 34 (79.1%) | 9 (20.9%) |
Employment Industries by Sex in Chula Vista CDP Cameron County
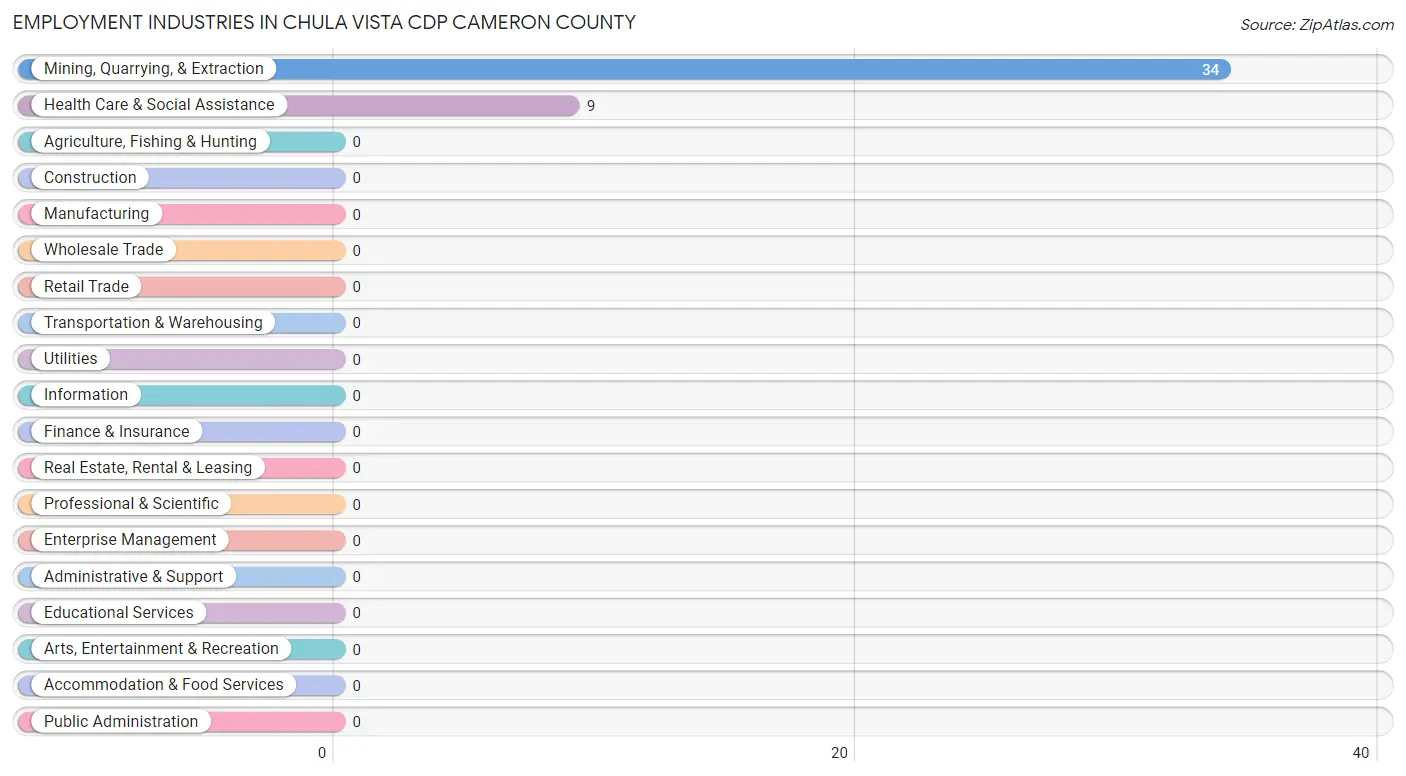
Employment Industries in Chula Vista CDP Cameron County
The major employment industries in Chula Vista CDP Cameron County include Mining, Quarrying, & Extraction (34 | 79.1%), and Health Care & Social Assistance (9 | 20.9%).
Employment Industries by Sex in Chula Vista CDP Cameron County
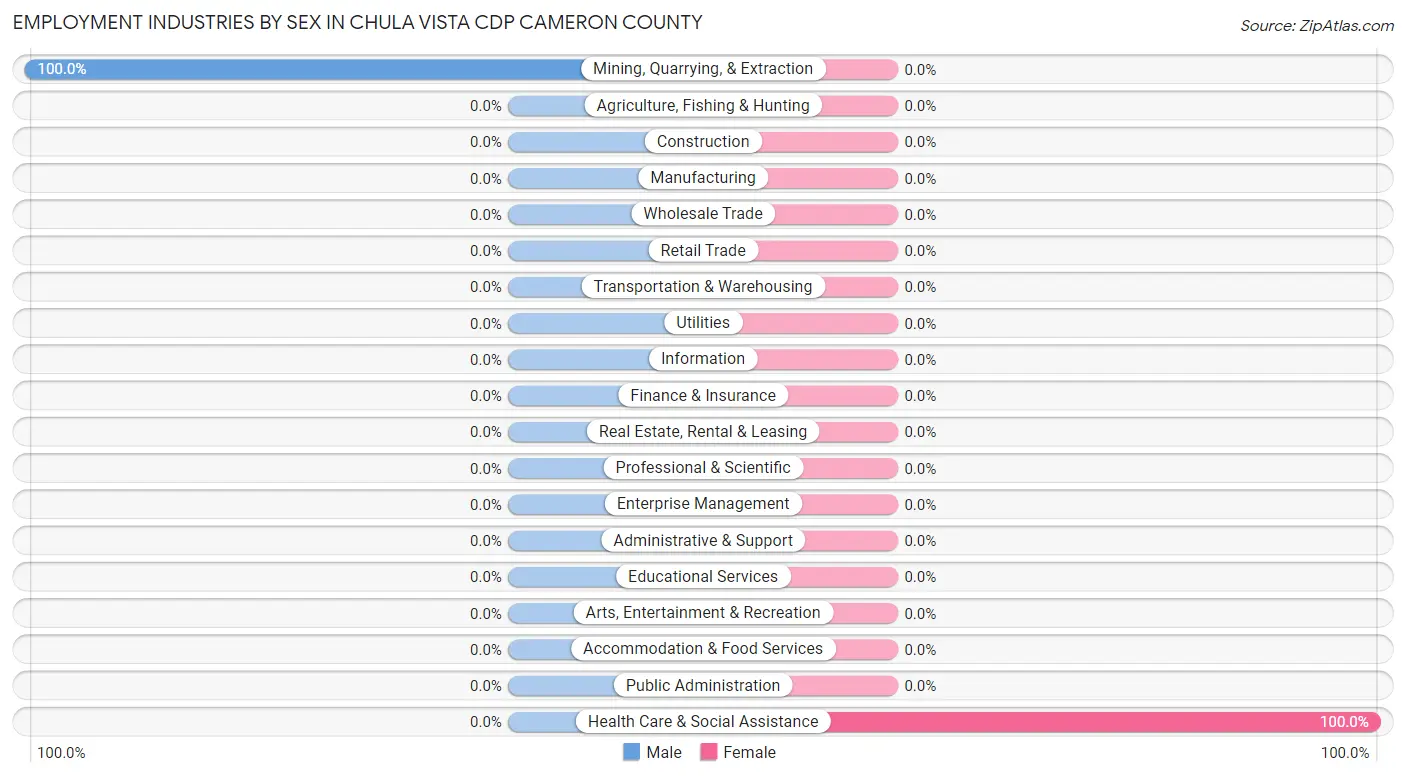
| Industry | Male | Female |
| Agriculture, Fishing & Hunting | 0 (0.0%) | 0 (0.0%) |
| Mining, Quarrying, & Extraction | 34 (100.0%) | 0 (0.0%) |
| Construction | 0 (0.0%) | 0 (0.0%) |
| Manufacturing | 0 (0.0%) | 0 (0.0%) |
| Wholesale Trade | 0 (0.0%) | 0 (0.0%) |
| Retail Trade | 0 (0.0%) | 0 (0.0%) |
| Transportation & Warehousing | 0 (0.0%) | 0 (0.0%) |
| Utilities | 0 (0.0%) | 0 (0.0%) |
| Information | 0 (0.0%) | 0 (0.0%) |
| Finance & Insurance | 0 (0.0%) | 0 (0.0%) |
| Real Estate, Rental & Leasing | 0 (0.0%) | 0 (0.0%) |
| Professional & Scientific | 0 (0.0%) | 0 (0.0%) |
| Enterprise Management | 0 (0.0%) | 0 (0.0%) |
| Administrative & Support | 0 (0.0%) | 0 (0.0%) |
| Educational Services | 0 (0.0%) | 0 (0.0%) |
| Health Care & Social Assistance | 0 (0.0%) | 9 (100.0%) |
| Arts, Entertainment & Recreation | 0 (0.0%) | 0 (0.0%) |
| Accommodation & Food Services | 0 (0.0%) | 0 (0.0%) |
| Public Administration | 0 (0.0%) | 0 (0.0%) |
| Total | 34 (79.1%) | 9 (20.9%) |
Education in Chula Vista CDP Cameron County
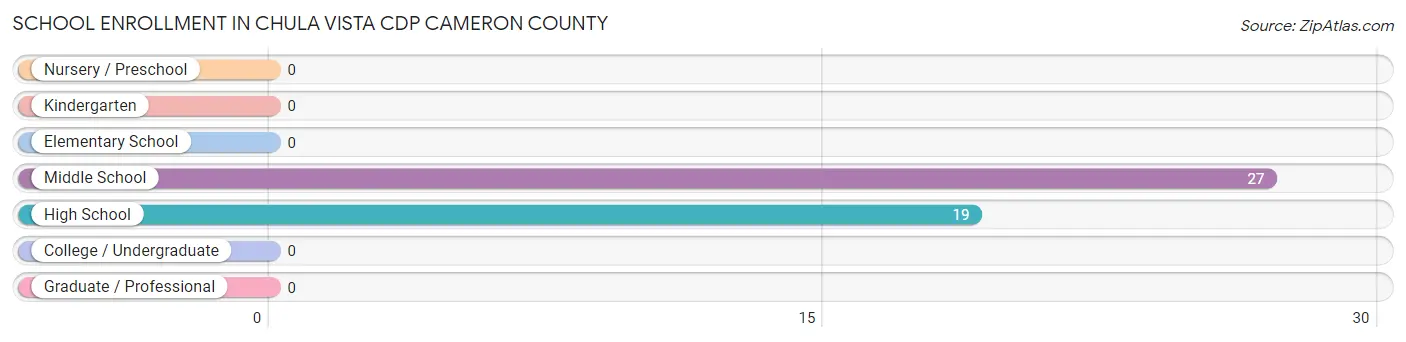
School Enrollment in Chula Vista CDP Cameron County
The most common levels of schooling among the 46 students in Chula Vista CDP Cameron County are middle school (27 | 58.7%), and high school (19 | 41.3%).
| School Level | # Students | % Students |
| Nursery / Preschool | 0 | 0.0% |
| Kindergarten | 0 | 0.0% |
| Elementary School | 0 | 0.0% |
| Middle School | 27 | 58.7% |
| High School | 19 | 41.3% |
| College / Undergraduate | 0 | 0.0% |
| Graduate / Professional | 0 | 0.0% |
| Total | 46 | 100.0% |
School Enrollment by Age by Funding Source in Chula Vista CDP Cameron County
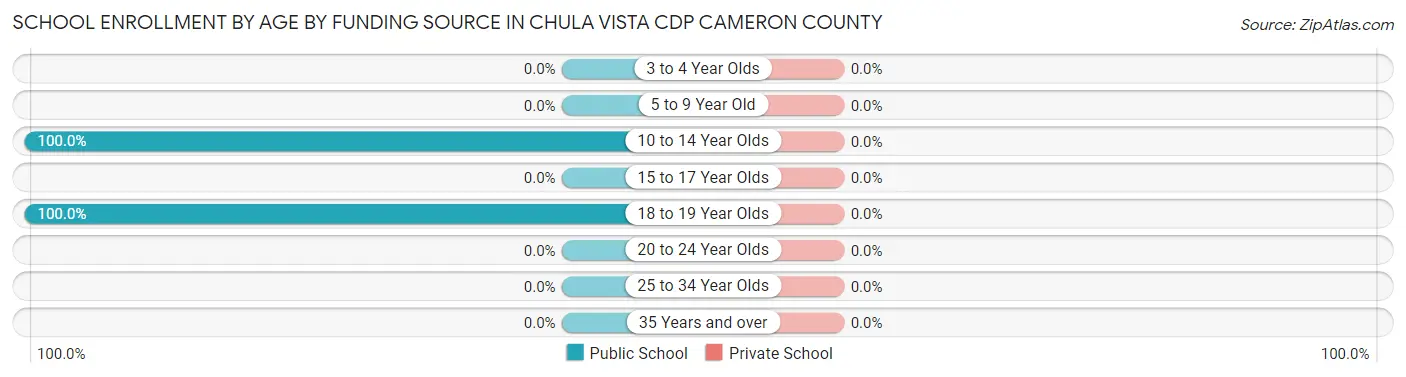
| Age Bracket | Public School | Private School |
| 3 to 4 Year Olds | 0 (0.0%) | 0 (0.0%) |
| 5 to 9 Year Old | 0 (0.0%) | 0 (0.0%) |
| 10 to 14 Year Olds | 37 (100.0%) | 0 (0.0%) |
| 15 to 17 Year Olds | 0 (0.0%) | 0 (0.0%) |
| 18 to 19 Year Olds | 9 (100.0%) | 0 (0.0%) |
| 20 to 24 Year Olds | 0 (0.0%) | 0 (0.0%) |
| 25 to 34 Year Olds | 0 (0.0%) | 0 (0.0%) |
| 35 Years and over | 0 (0.0%) | 0 (0.0%) |
| Total | 46 (100.0%) | 0 (0.0%) |
Educational Attainment by Field of Study in Chula Vista CDP Cameron County
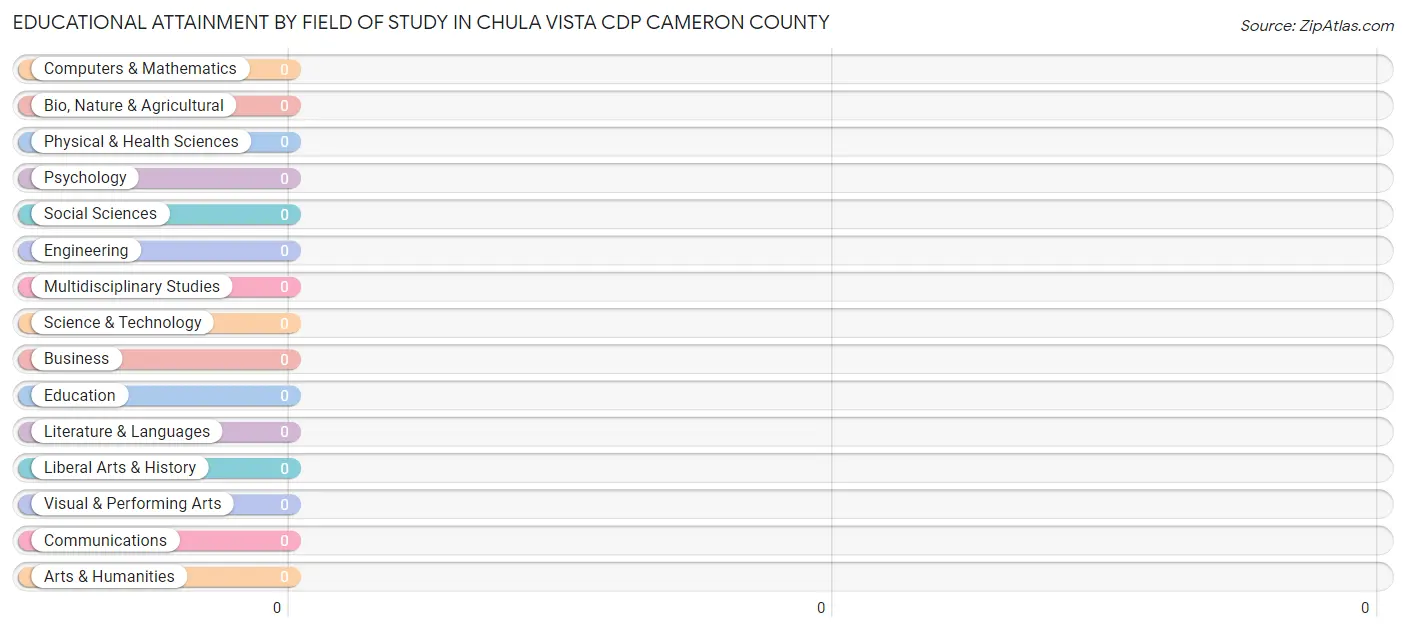
| Field of Study | # Graduates | % Graduates |
| Computers & Mathematics | 0 | 0.0% |
| Bio, Nature & Agricultural | 0 | 0.0% |
| Physical & Health Sciences | 0 | 0.0% |
| Psychology | 0 | 0.0% |
| Social Sciences | 0 | 0.0% |
| Engineering | 0 | 0.0% |
| Multidisciplinary Studies | 0 | 0.0% |
| Science & Technology | 0 | 0.0% |
| Business | 0 | 0.0% |
| Education | 0 | 0.0% |
| Literature & Languages | 0 | 0.0% |
| Liberal Arts & History | 0 | 0.0% |
| Visual & Performing Arts | 0 | 0.0% |
| Communications | 0 | 0.0% |
| Arts & Humanities | 0 | 0.0% |
| Total | 0 | 0.0% |
Transportation & Commute in Chula Vista CDP Cameron County
Vehicle Availability by Sex in Chula Vista CDP Cameron County
The most prevalent vehicle ownership categories in Chula Vista CDP Cameron County are males with 1 vehicle (34, accounting for 100.0%) and females with 1 vehicle (0, making up 377.8%).
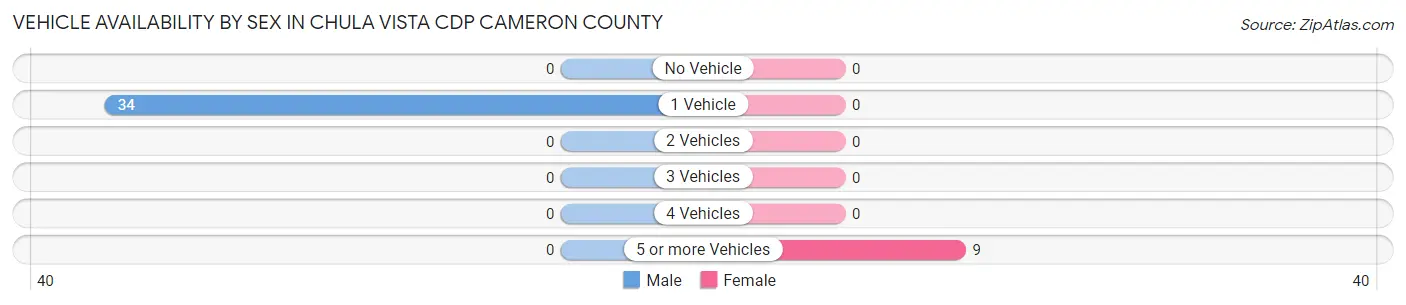
| Vehicles Available | Male | Female |
| No Vehicle | 0 (0.0%) | 0 (0.0%) |
| 1 Vehicle | 34 (100.0%) | 0 (0.0%) |
| 2 Vehicles | 0 (0.0%) | 0 (0.0%) |
| 3 Vehicles | 0 (0.0%) | 0 (0.0%) |
| 4 Vehicles | 0 (0.0%) | 0 (0.0%) |
| 5 or more Vehicles | 0 (0.0%) | 9 (100.0%) |
| Total | 34 (100.0%) | 9 (100.0%) |
Commute Time in Chula Vista CDP Cameron County
The most frequently occuring commute durations in Chula Vista CDP Cameron County are 15 to 19 minutes (34 commuters, 79.1%), 30 to 34 minutes (9 commuters, 20.9%), and less than 5 minutes (0 commuters, 0.0%).
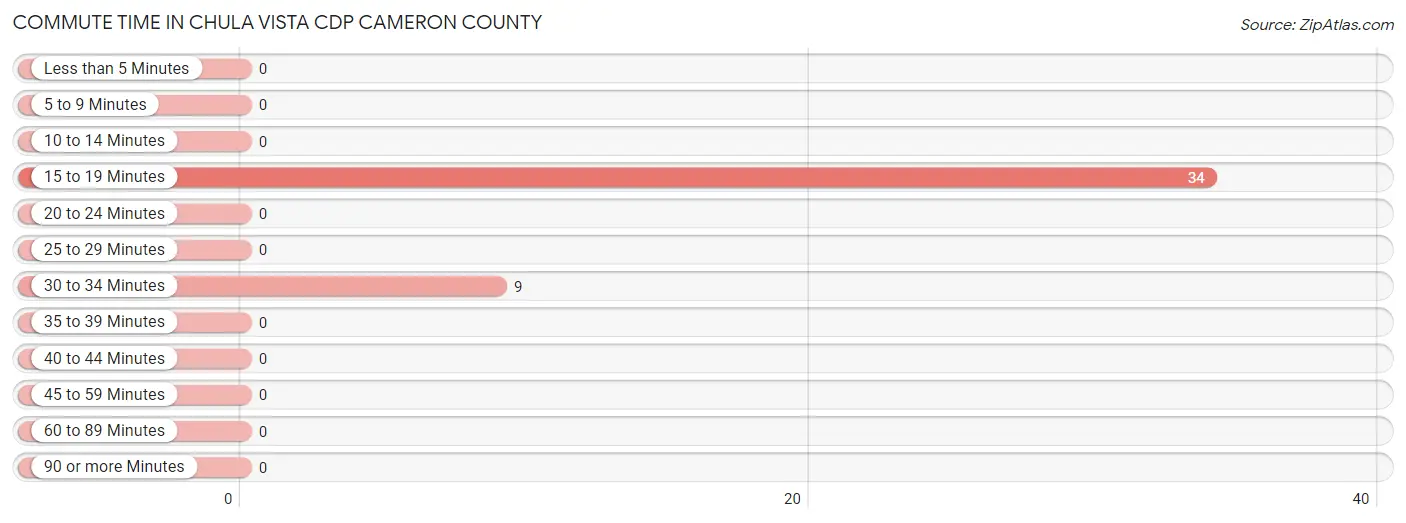
| Commute Time | # Commuters | % Commuters |
| Less than 5 Minutes | 0 | 0.0% |
| 5 to 9 Minutes | 0 | 0.0% |
| 10 to 14 Minutes | 0 | 0.0% |
| 15 to 19 Minutes | 34 | 79.1% |
| 20 to 24 Minutes | 0 | 0.0% |
| 25 to 29 Minutes | 0 | 0.0% |
| 30 to 34 Minutes | 9 | 20.9% |
| 35 to 39 Minutes | 0 | 0.0% |
| 40 to 44 Minutes | 0 | 0.0% |
| 45 to 59 Minutes | 0 | 0.0% |
| 60 to 89 Minutes | 0 | 0.0% |
| 90 or more Minutes | 0 | 0.0% |
Commute Time by Sex in Chula Vista CDP Cameron County
The most common commute times in Chula Vista CDP Cameron County are 15 to 19 minutes (34 commuters, 100.0%) for males and 30 to 34 minutes (9 commuters, 100.0%) for females.
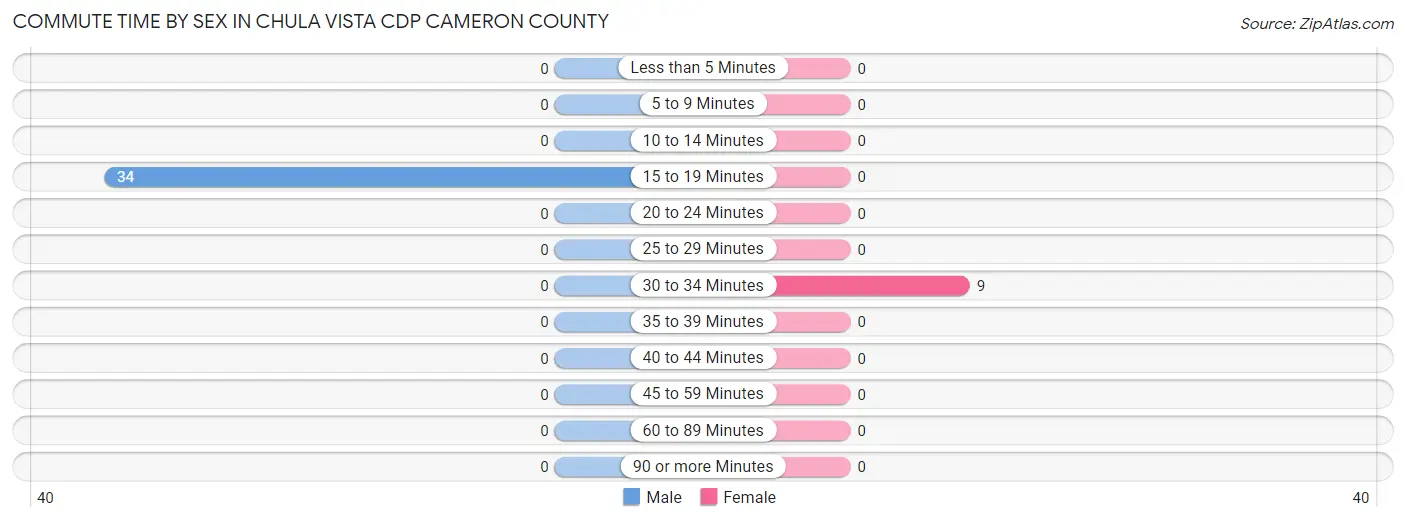
| Commute Time | Male | Female |
| Less than 5 Minutes | 0 (0.0%) | 0 (0.0%) |
| 5 to 9 Minutes | 0 (0.0%) | 0 (0.0%) |
| 10 to 14 Minutes | 0 (0.0%) | 0 (0.0%) |
| 15 to 19 Minutes | 34 (100.0%) | 0 (0.0%) |
| 20 to 24 Minutes | 0 (0.0%) | 0 (0.0%) |
| 25 to 29 Minutes | 0 (0.0%) | 0 (0.0%) |
| 30 to 34 Minutes | 0 (0.0%) | 9 (100.0%) |
| 35 to 39 Minutes | 0 (0.0%) | 0 (0.0%) |
| 40 to 44 Minutes | 0 (0.0%) | 0 (0.0%) |
| 45 to 59 Minutes | 0 (0.0%) | 0 (0.0%) |
| 60 to 89 Minutes | 0 (0.0%) | 0 (0.0%) |
| 90 or more Minutes | 0 (0.0%) | 0 (0.0%) |
Time of Departure to Work by Sex in Chula Vista CDP Cameron County
The most frequent times of departure to work in Chula Vista CDP Cameron County are 7:00 AM to 7:29 AM (34, 100.0%) for males and 7:30 AM to 7:59 AM (9, 100.0%) for females.
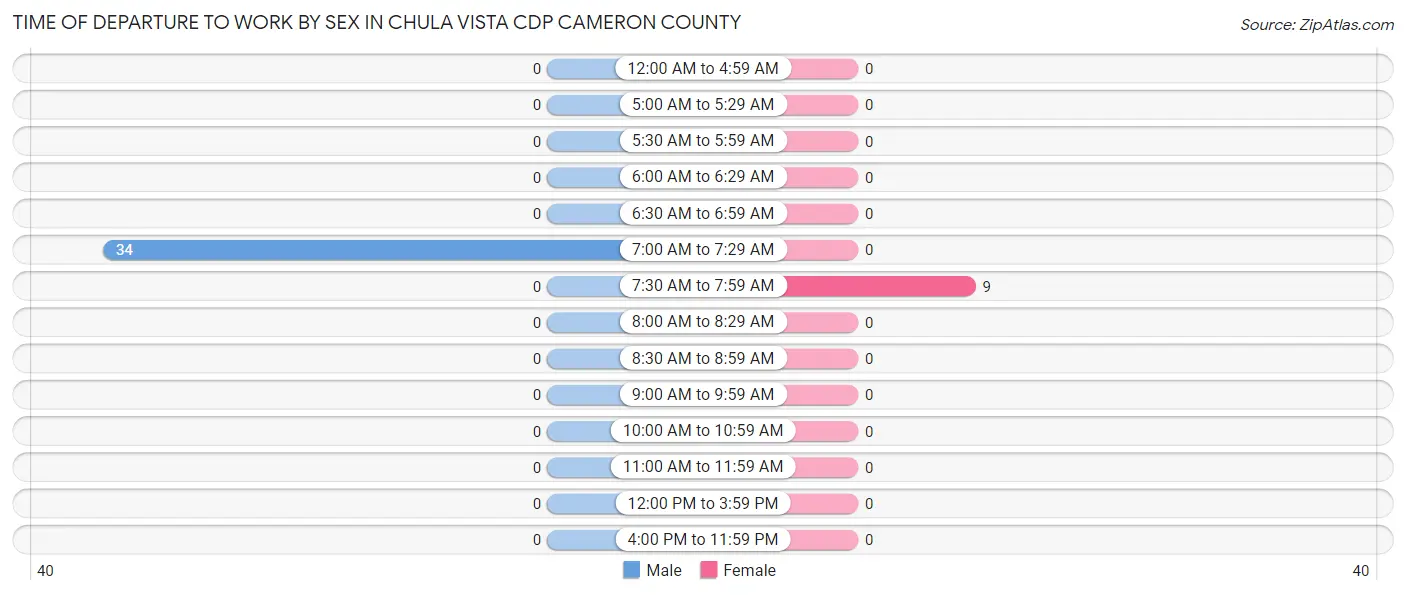
| Time of Departure | Male | Female |
| 12:00 AM to 4:59 AM | 0 (0.0%) | 0 (0.0%) |
| 5:00 AM to 5:29 AM | 0 (0.0%) | 0 (0.0%) |
| 5:30 AM to 5:59 AM | 0 (0.0%) | 0 (0.0%) |
| 6:00 AM to 6:29 AM | 0 (0.0%) | 0 (0.0%) |
| 6:30 AM to 6:59 AM | 0 (0.0%) | 0 (0.0%) |
| 7:00 AM to 7:29 AM | 34 (100.0%) | 0 (0.0%) |
| 7:30 AM to 7:59 AM | 0 (0.0%) | 9 (100.0%) |
| 8:00 AM to 8:29 AM | 0 (0.0%) | 0 (0.0%) |
| 8:30 AM to 8:59 AM | 0 (0.0%) | 0 (0.0%) |
| 9:00 AM to 9:59 AM | 0 (0.0%) | 0 (0.0%) |
| 10:00 AM to 10:59 AM | 0 (0.0%) | 0 (0.0%) |
| 11:00 AM to 11:59 AM | 0 (0.0%) | 0 (0.0%) |
| 12:00 PM to 3:59 PM | 0 (0.0%) | 0 (0.0%) |
| 4:00 PM to 11:59 PM | 0 (0.0%) | 0 (0.0%) |
| Total | 34 (100.0%) | 9 (100.0%) |
Housing Occupancy in Chula Vista CDP Cameron County
Occupancy by Ownership in Chula Vista CDP Cameron County
Of the total 41 dwellings in Chula Vista CDP Cameron County, owner-occupied units account for 9 (22.0%), while renter-occupied units make up 32 (78.0%).
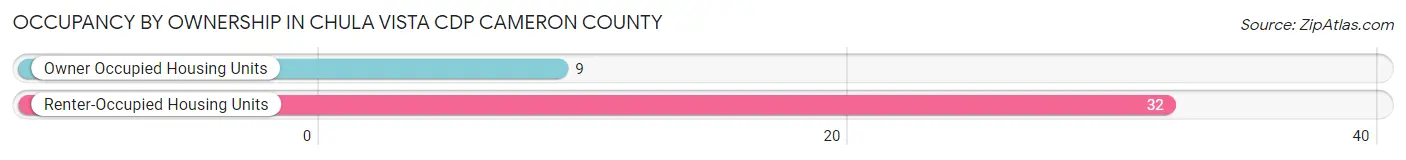
| Occupancy | # Housing Units | % Housing Units |
| Owner Occupied Housing Units | 9 | 22.0% |
| Renter-Occupied Housing Units | 32 | 78.0% |
| Total Occupied Housing Units | 41 | 100.0% |
Occupancy by Household Size in Chula Vista CDP Cameron County
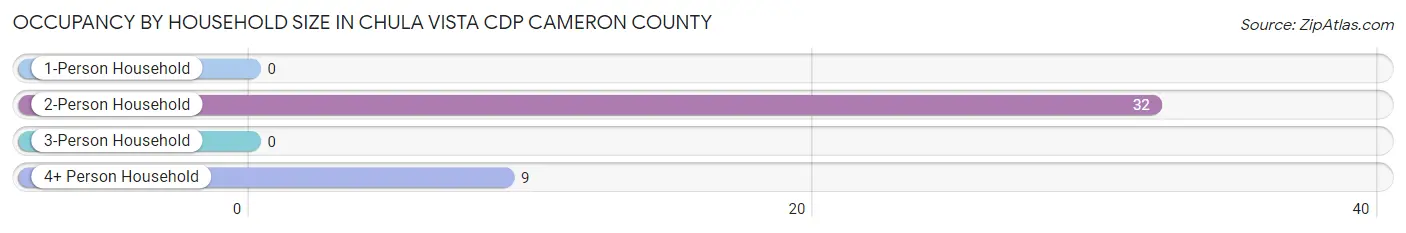
| Household Size | # Housing Units | % Housing Units |
| 1-Person Household | 0 | 0.0% |
| 2-Person Household | 32 | 78.0% |
| 3-Person Household | 0 | 0.0% |
| 4+ Person Household | 9 | 22.0% |
| Total Housing Units | 41 | 100.0% |
Occupancy by Ownership by Household Size in Chula Vista CDP Cameron County
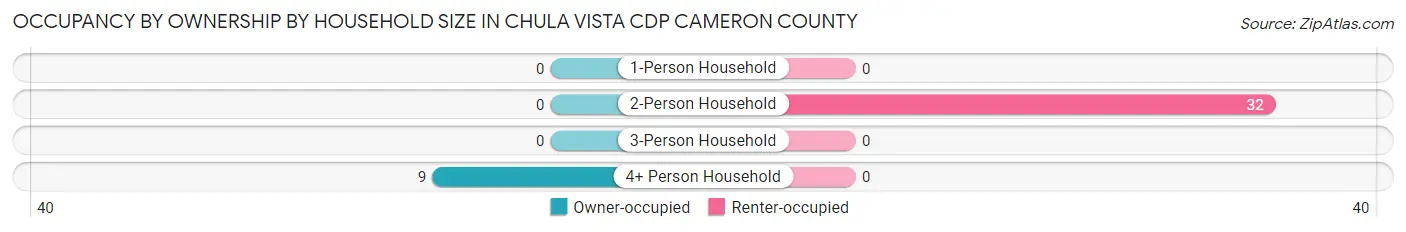
| Household Size | Owner-occupied | Renter-occupied |
| 1-Person Household | 0 (0.0%) | 0 (0.0%) |
| 2-Person Household | 0 (0.0%) | 32 (100.0%) |
| 3-Person Household | 0 (0.0%) | 0 (0.0%) |
| 4+ Person Household | 9 (100.0%) | 0 (0.0%) |
| Total Housing Units | 9 (22.0%) | 32 (78.0%) |
Occupancy by Educational Attainment in Chula Vista CDP Cameron County
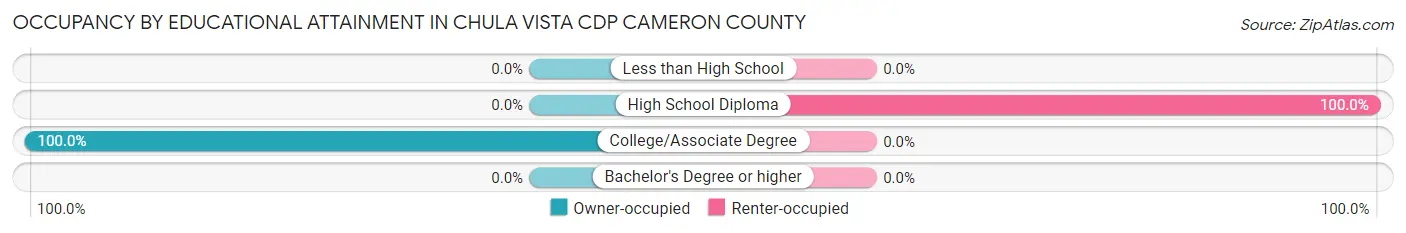
| Household Size | Owner-occupied | Renter-occupied |
| Less than High School | 0 (0.0%) | 0 (0.0%) |
| High School Diploma | 0 (0.0%) | 32 (100.0%) |
| College/Associate Degree | 9 (100.0%) | 0 (0.0%) |
| Bachelor's Degree or higher | 0 (0.0%) | 0 (0.0%) |
Occupancy by Age of Householder in Chula Vista CDP Cameron County
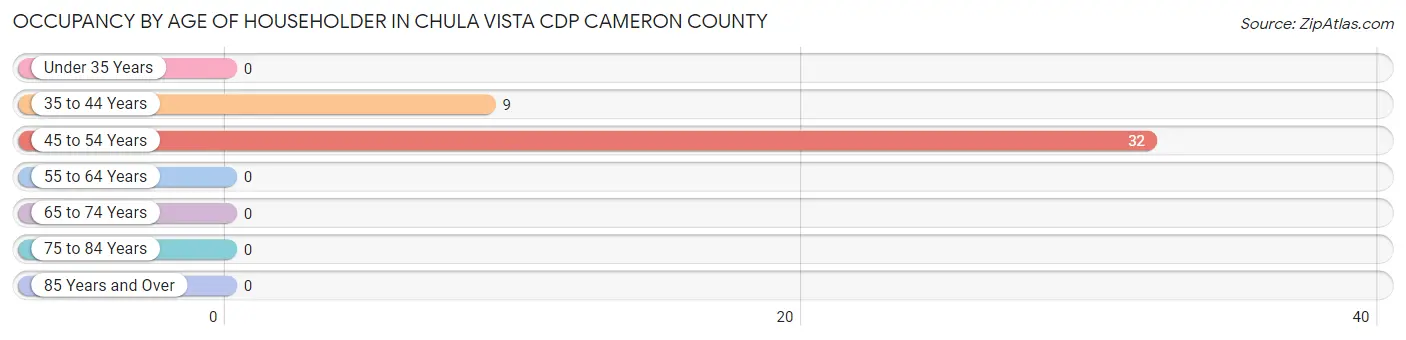
| Age Bracket | # Households | % Households |
| Under 35 Years | 0 | 0.0% |
| 35 to 44 Years | 9 | 22.0% |
| 45 to 54 Years | 32 | 78.0% |
| 55 to 64 Years | 0 | 0.0% |
| 65 to 74 Years | 0 | 0.0% |
| 75 to 84 Years | 0 | 0.0% |
| 85 Years and Over | 0 | 0.0% |
| Total | 41 | 100.0% |
Housing Finances in Chula Vista CDP Cameron County
Median Income by Occupancy in Chula Vista CDP Cameron County
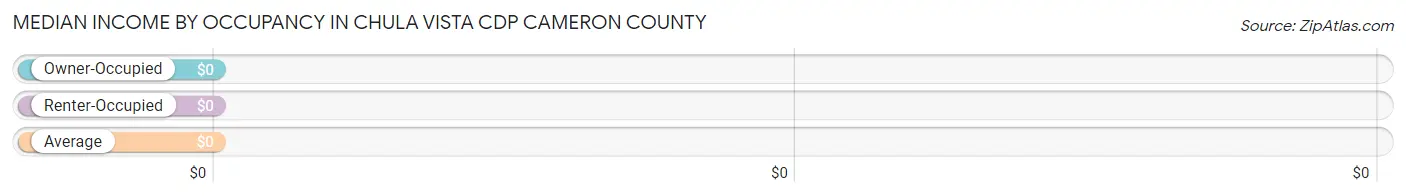
| Occupancy Type | # Households | Median Income |
| Owner-Occupied | 9 (22.0%) | $0 |
| Renter-Occupied | 32 (78.0%) | $0 |
| Average | 41 (100.0%) | $0 |
Occupancy by Householder Income Bracket in Chula Vista CDP Cameron County
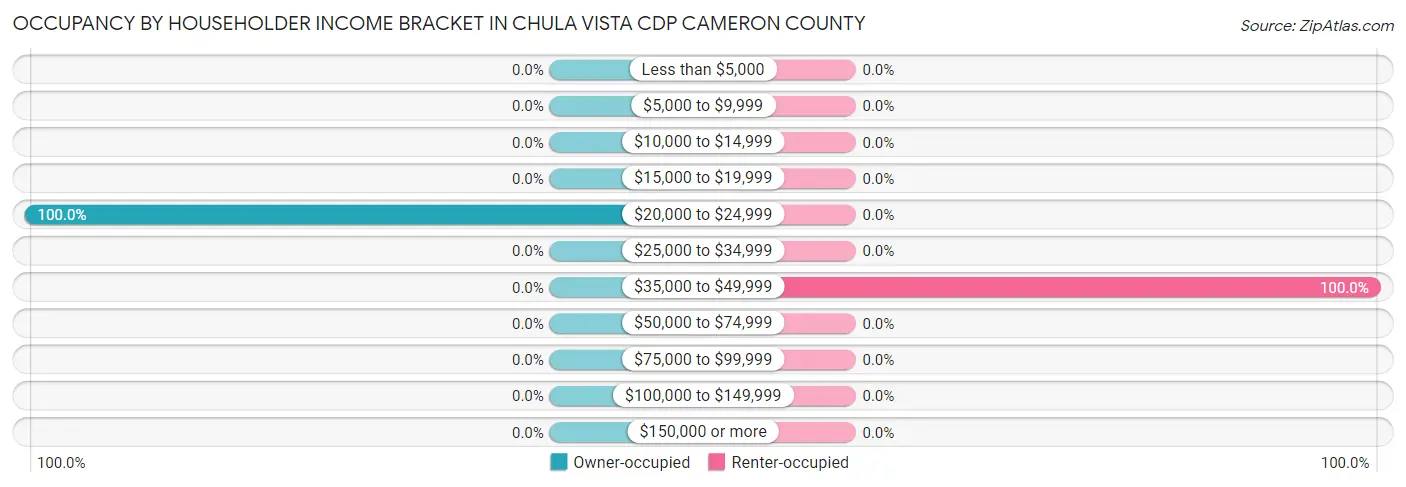
| Income Bracket | Owner-occupied | Renter-occupied |
| Less than $5,000 | 0 (0.0%) | 0 (0.0%) |
| $5,000 to $9,999 | 0 (0.0%) | 0 (0.0%) |
| $10,000 to $14,999 | 0 (0.0%) | 0 (0.0%) |
| $15,000 to $19,999 | 0 (0.0%) | 0 (0.0%) |
| $20,000 to $24,999 | 9 (100.0%) | 0 (0.0%) |
| $25,000 to $34,999 | 0 (0.0%) | 0 (0.0%) |
| $35,000 to $49,999 | 0 (0.0%) | 32 (100.0%) |
| $50,000 to $74,999 | 0 (0.0%) | 0 (0.0%) |
| $75,000 to $99,999 | 0 (0.0%) | 0 (0.0%) |
| $100,000 to $149,999 | 0 (0.0%) | 0 (0.0%) |
| $150,000 or more | 0 (0.0%) | 0 (0.0%) |
| Total | 9 (100.0%) | 32 (100.0%) |
Monthly Housing Cost Tiers in Chula Vista CDP Cameron County
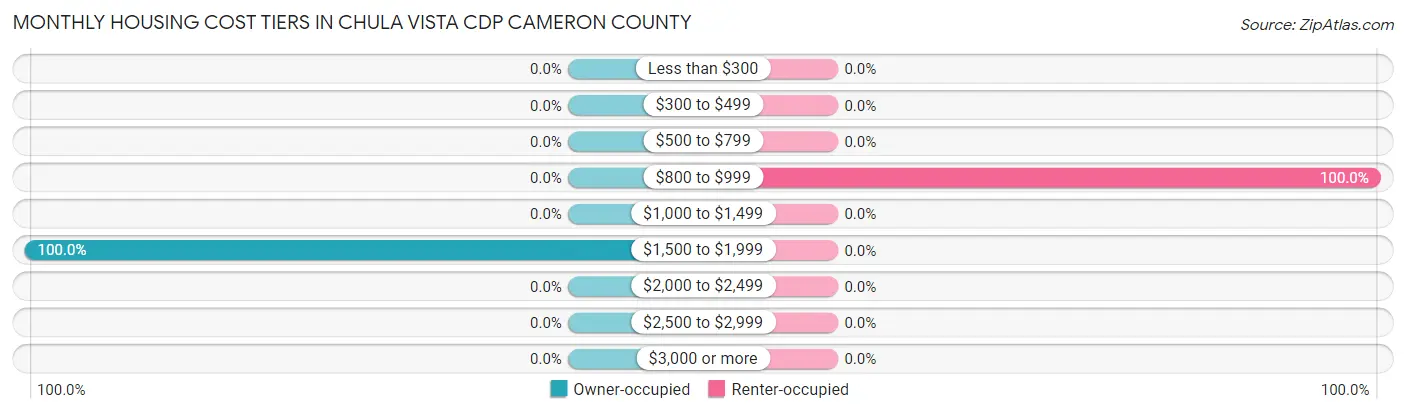
| Monthly Cost | Owner-occupied | Renter-occupied |
| Less than $300 | 0 (0.0%) | 0 (0.0%) |
| $300 to $499 | 0 (0.0%) | 0 (0.0%) |
| $500 to $799 | 0 (0.0%) | 0 (0.0%) |
| $800 to $999 | 0 (0.0%) | 32 (100.0%) |
| $1,000 to $1,499 | 0 (0.0%) | 0 (0.0%) |
| $1,500 to $1,999 | 9 (100.0%) | 0 (0.0%) |
| $2,000 to $2,499 | 0 (0.0%) | 0 (0.0%) |
| $2,500 to $2,999 | 0 (0.0%) | 0 (0.0%) |
| $3,000 or more | 0 (0.0%) | 0 (0.0%) |
| Total | 9 (100.0%) | 32 (100.0%) |
Physical Housing Characteristics in Chula Vista CDP Cameron County
Housing Structures in Chula Vista CDP Cameron County
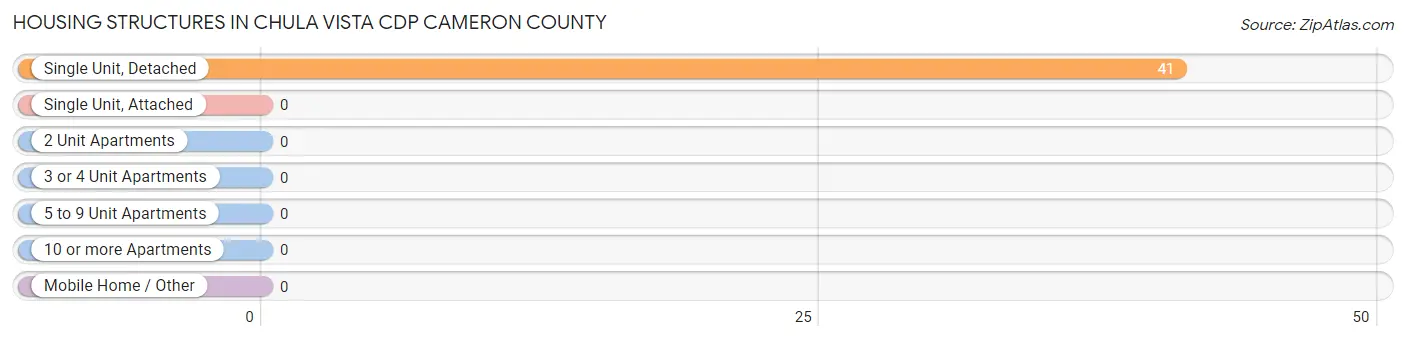
| Structure Type | # Housing Units | % Housing Units |
| Single Unit, Detached | 41 | 100.0% |
| Single Unit, Attached | 0 | 0.0% |
| 2 Unit Apartments | 0 | 0.0% |
| 3 or 4 Unit Apartments | 0 | 0.0% |
| 5 to 9 Unit Apartments | 0 | 0.0% |
| 10 or more Apartments | 0 | 0.0% |
| Mobile Home / Other | 0 | 0.0% |
| Total | 41 | 100.0% |
Housing Structures by Occupancy in Chula Vista CDP Cameron County
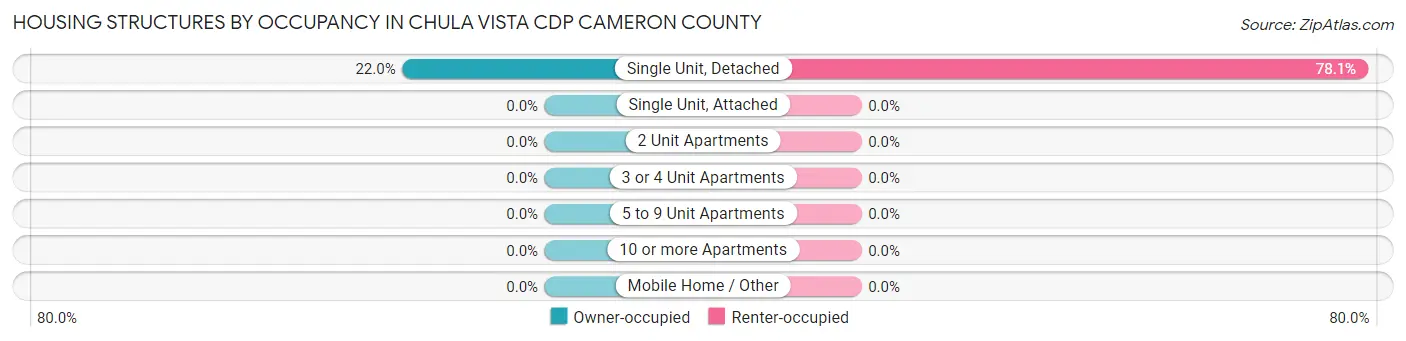
| Structure Type | Owner-occupied | Renter-occupied |
| Single Unit, Detached | 9 (22.0%) | 32 (78.0%) |
| Single Unit, Attached | 0 (0.0%) | 0 (0.0%) |
| 2 Unit Apartments | 0 (0.0%) | 0 (0.0%) |
| 3 or 4 Unit Apartments | 0 (0.0%) | 0 (0.0%) |
| 5 to 9 Unit Apartments | 0 (0.0%) | 0 (0.0%) |
| 10 or more Apartments | 0 (0.0%) | 0 (0.0%) |
| Mobile Home / Other | 0 (0.0%) | 0 (0.0%) |
| Total | 9 (22.0%) | 32 (78.0%) |
Housing Structures by Number of Rooms in Chula Vista CDP Cameron County
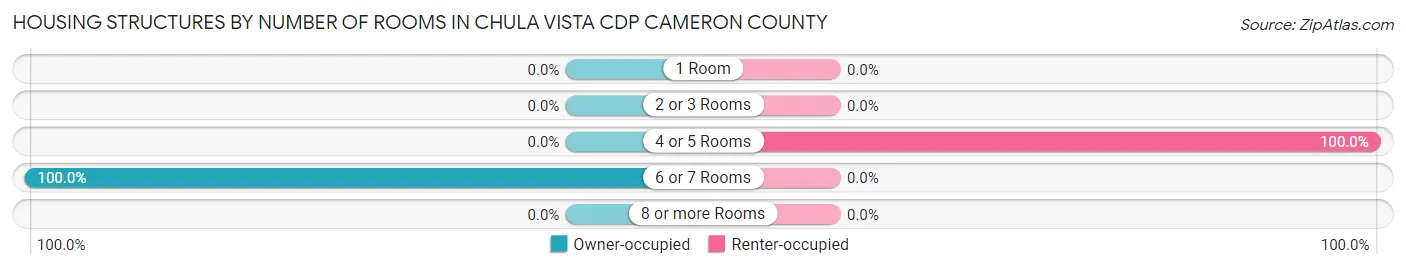
| Number of Rooms | Owner-occupied | Renter-occupied |
| 1 Room | 0 (0.0%) | 0 (0.0%) |
| 2 or 3 Rooms | 0 (0.0%) | 0 (0.0%) |
| 4 or 5 Rooms | 0 (0.0%) | 32 (100.0%) |
| 6 or 7 Rooms | 9 (100.0%) | 0 (0.0%) |
| 8 or more Rooms | 0 (0.0%) | 0 (0.0%) |
| Total | 9 (100.0%) | 32 (100.0%) |
Housing Structure by Heating Type in Chula Vista CDP Cameron County
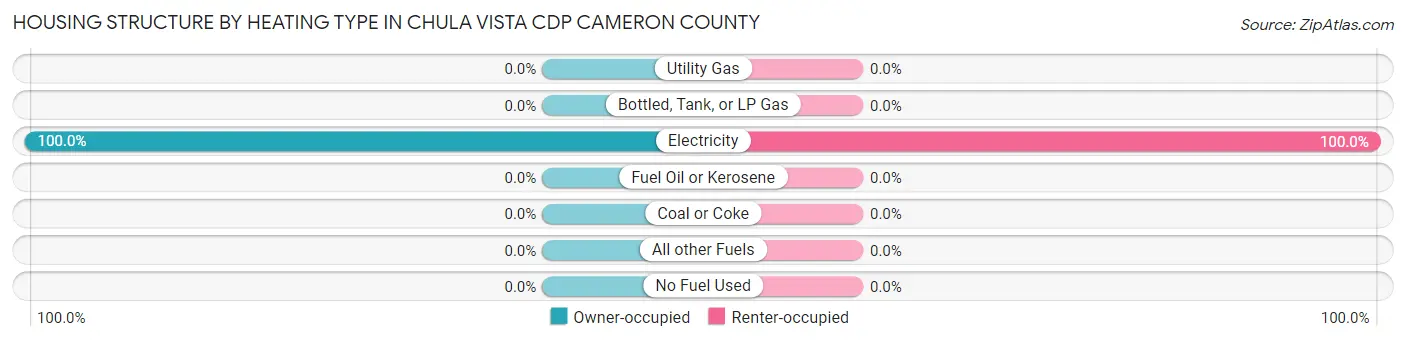
| Heating Type | Owner-occupied | Renter-occupied |
| Utility Gas | 0 (0.0%) | 0 (0.0%) |
| Bottled, Tank, or LP Gas | 0 (0.0%) | 0 (0.0%) |
| Electricity | 9 (100.0%) | 32 (100.0%) |
| Fuel Oil or Kerosene | 0 (0.0%) | 0 (0.0%) |
| Coal or Coke | 0 (0.0%) | 0 (0.0%) |
| All other Fuels | 0 (0.0%) | 0 (0.0%) |
| No Fuel Used | 0 (0.0%) | 0 (0.0%) |
| Total | 9 (100.0%) | 32 (100.0%) |
Household Vehicle Usage in Chula Vista CDP Cameron County
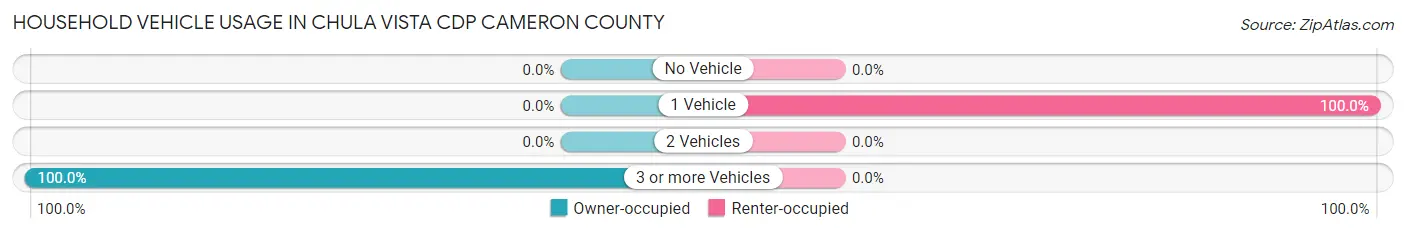
| Vehicles per Household | Owner-occupied | Renter-occupied |
| No Vehicle | 0 (0.0%) | 0 (0.0%) |
| 1 Vehicle | 0 (0.0%) | 32 (100.0%) |
| 2 Vehicles | 0 (0.0%) | 0 (0.0%) |
| 3 or more Vehicles | 9 (100.0%) | 0 (0.0%) |
| Total | 9 (100.0%) | 32 (100.0%) |
Real Estate & Mortgages in Chula Vista CDP Cameron County
Real Estate and Mortgage Overview in Chula Vista CDP Cameron County
| Characteristic | Without Mortgage | With Mortgage |
| Housing Units | 0 | 9 |
| Median Property Value | - | - |
| Median Household Income | - | - |
| Monthly Housing Costs | - | - |
| Real Estate Taxes | - | - |
Property Value by Mortgage Status in Chula Vista CDP Cameron County
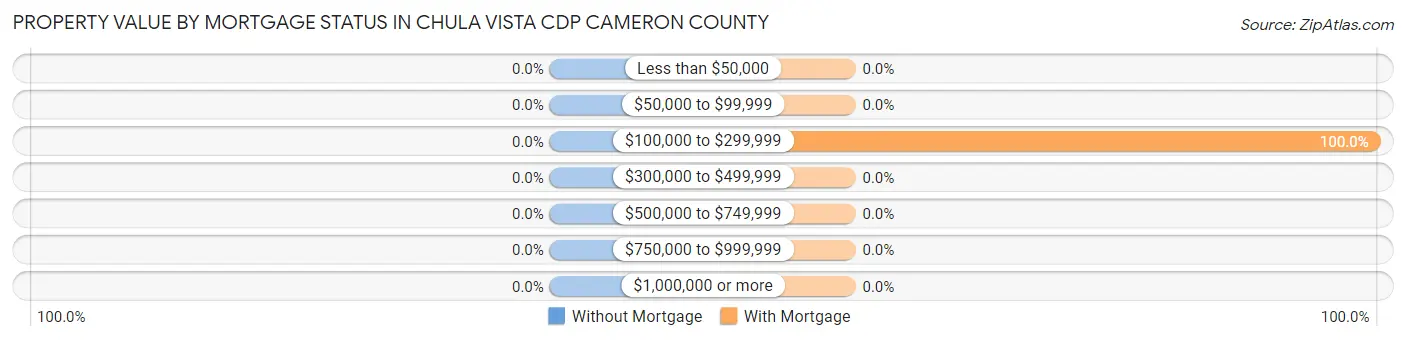
| Property Value | Without Mortgage | With Mortgage |
| Less than $50,000 | 0 (0.0%) | 0 (0.0%) |
| $50,000 to $99,999 | 0 (0.0%) | 0 (0.0%) |
| $100,000 to $299,999 | 0 (0.0%) | 9 (100.0%) |
| $300,000 to $499,999 | 0 (0.0%) | 0 (0.0%) |
| $500,000 to $749,999 | 0 (0.0%) | 0 (0.0%) |
| $750,000 to $999,999 | 0 (0.0%) | 0 (0.0%) |
| $1,000,000 or more | 0 (0.0%) | 0 (0.0%) |
| Total | 0 (0.0%) | 9 (100.0%) |
Household Income by Mortgage Status in Chula Vista CDP Cameron County
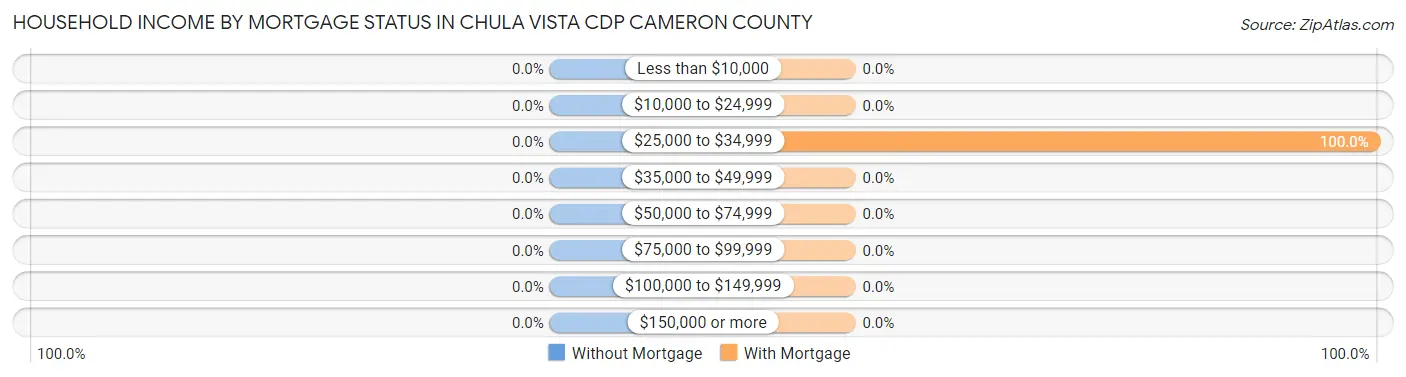
| Household Income | Without Mortgage | With Mortgage |
| Less than $10,000 | 0 (0.0%) | 0 (0.0%) |
| $10,000 to $24,999 | 0 (0.0%) | 0 (0.0%) |
| $25,000 to $34,999 | 0 (0.0%) | 9 (100.0%) |
| $35,000 to $49,999 | 0 (0.0%) | 0 (0.0%) |
| $50,000 to $74,999 | 0 (0.0%) | 0 (0.0%) |
| $75,000 to $99,999 | 0 (0.0%) | 0 (0.0%) |
| $100,000 to $149,999 | 0 (0.0%) | 0 (0.0%) |
| $150,000 or more | 0 (0.0%) | 0 (0.0%) |
| Total | 0 (0.0%) | 9 (100.0%) |
Property Value to Household Income Ratio in Chula Vista CDP Cameron County
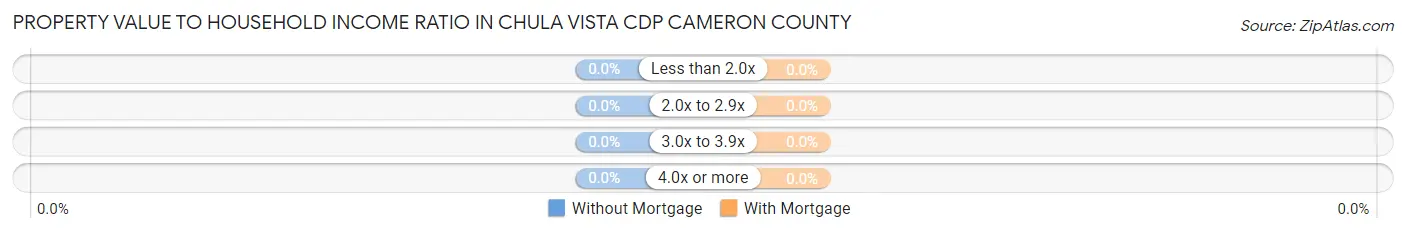
| Value-to-Income Ratio | Without Mortgage | With Mortgage |
| Less than 2.0x | 0 (0.0%) | 0 (0.0%) |
| 2.0x to 2.9x | 0 (0.0%) | 0 (0.0%) |
| 3.0x to 3.9x | 0 (0.0%) | 0 (0.0%) |
| 4.0x or more | 0 (0.0%) | 0 (0.0%) |
| Total | 0 (0.0%) | 9 (100.0%) |
Real Estate Taxes by Mortgage Status in Chula Vista CDP Cameron County
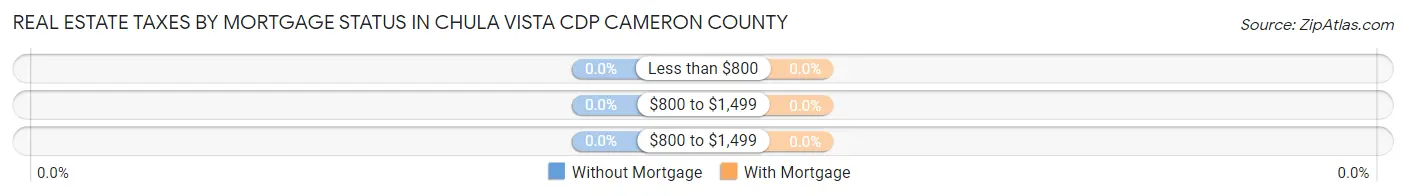
| Property Taxes | Without Mortgage | With Mortgage |
| Less than $800 | 0 (0.0%) | 0 (0.0%) |
| $800 to $1,499 | 0 (0.0%) | 0 (0.0%) |
| $800 to $1,499 | 0 (0.0%) | 0 (0.0%) |
| Total | 0 (0.0%) | 9 (100.0%) |
Health & Disability in Chula Vista CDP Cameron County
Health Insurance Coverage by Age in Chula Vista CDP Cameron County
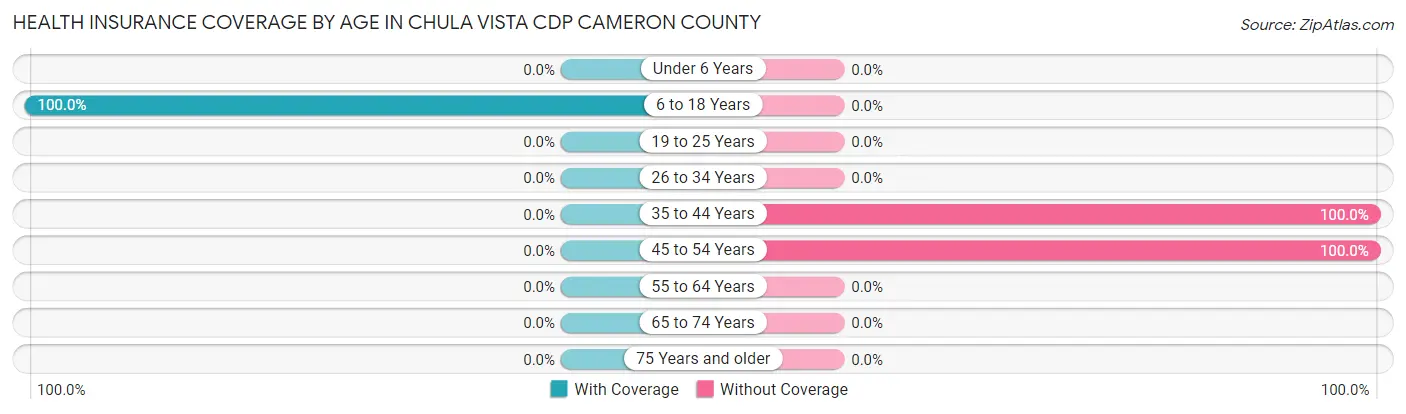
| Age Bracket | With Coverage | Without Coverage |
| Under 6 Years | 0 (0.0%) | 0 (0.0%) |
| 6 to 18 Years | 46 (100.0%) | 0 (0.0%) |
| 19 to 25 Years | 0 (0.0%) | 0 (0.0%) |
| 26 to 34 Years | 0 (0.0%) | 0 (0.0%) |
| 35 to 44 Years | 0 (0.0%) | 9 (100.0%) |
| 45 to 54 Years | 0 (0.0%) | 66 (100.0%) |
| 55 to 64 Years | 0 (0.0%) | 0 (0.0%) |
| 65 to 74 Years | 0 (0.0%) | 0 (0.0%) |
| 75 Years and older | 0 (0.0%) | 0 (0.0%) |
| Total | 46 (38.0%) | 75 (62.0%) |
Health Insurance Coverage by Citizenship Status in Chula Vista CDP Cameron County
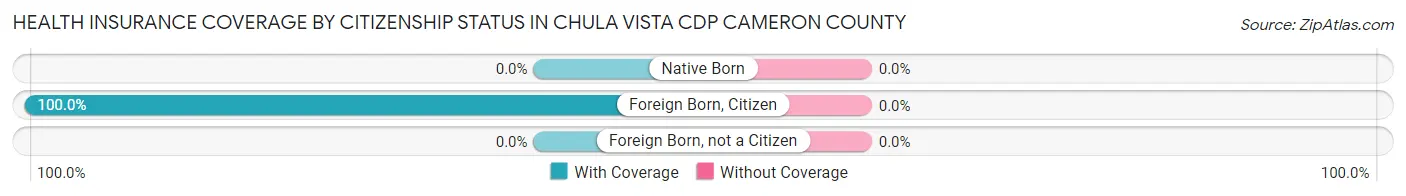
| Citizenship Status | With Coverage | Without Coverage |
| Native Born | 0 (0.0%) | 0 (0.0%) |
| Foreign Born, Citizen | 46 (100.0%) | 0 (0.0%) |
| Foreign Born, not a Citizen | 0 (0.0%) | 0 (0.0%) |
Health Insurance Coverage by Household Income in Chula Vista CDP Cameron County
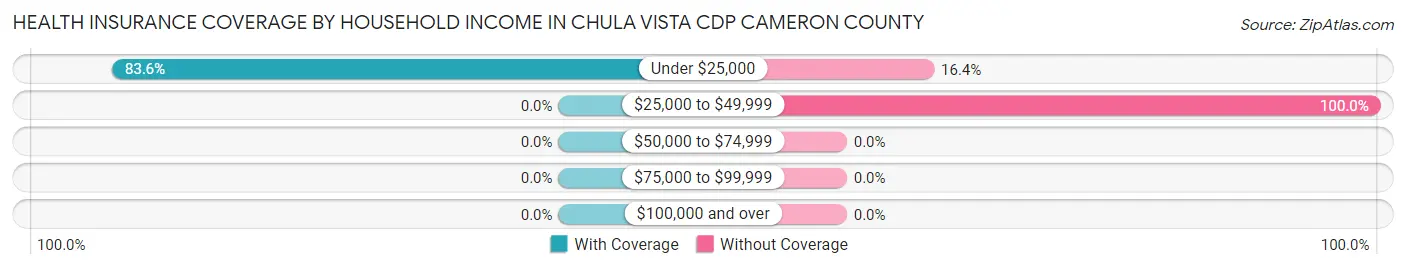
| Household Income | With Coverage | Without Coverage |
| Under $25,000 | 46 (83.6%) | 9 (16.4%) |
| $25,000 to $49,999 | 0 (0.0%) | 66 (100.0%) |
| $50,000 to $74,999 | 0 (0.0%) | 0 (0.0%) |
| $75,000 to $99,999 | 0 (0.0%) | 0 (0.0%) |
| $100,000 and over | 0 (0.0%) | 0 (0.0%) |
Public vs Private Health Insurance Coverage by Age in Chula Vista CDP Cameron County
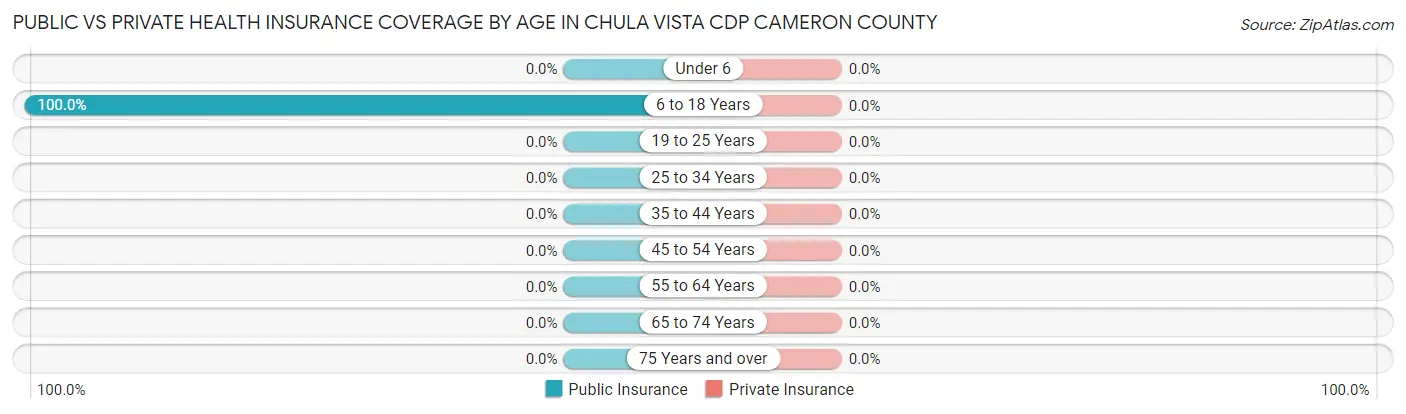
| Age Bracket | Public Insurance | Private Insurance |
| Under 6 | 0 (0.0%) | 0 (0.0%) |
| 6 to 18 Years | 46 (100.0%) | 0 (0.0%) |
| 19 to 25 Years | 0 (0.0%) | 0 (0.0%) |
| 25 to 34 Years | 0 (0.0%) | 0 (0.0%) |
| 35 to 44 Years | 0 (0.0%) | 0 (0.0%) |
| 45 to 54 Years | 0 (0.0%) | 0 (0.0%) |
| 55 to 64 Years | 0 (0.0%) | 0 (0.0%) |
| 65 to 74 Years | 0 (0.0%) | 0 (0.0%) |
| 75 Years and over | 0 (0.0%) | 0 (0.0%) |
| Total | 46 (38.0%) | 0 (0.0%) |
Disability Status by Sex by Age in Chula Vista CDP Cameron County
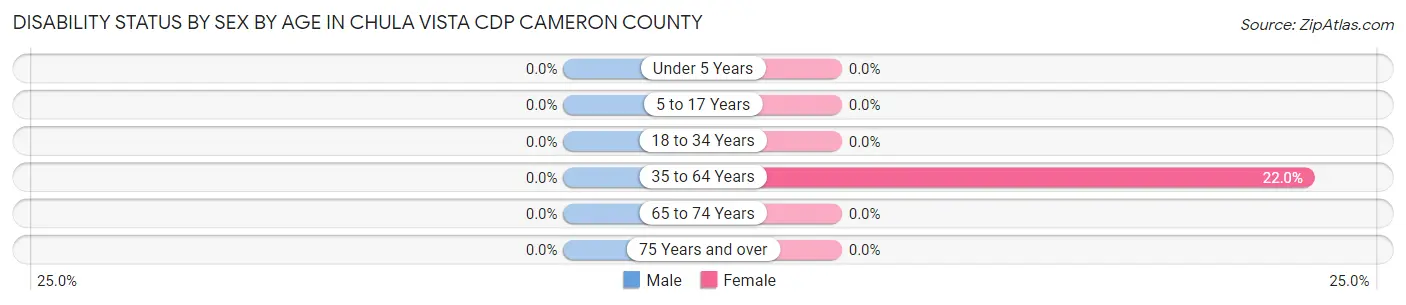
| Age Bracket | Male | Female |
| Under 5 Years | 0 (0.0%) | 0 (0.0%) |
| 5 to 17 Years | 0 (0.0%) | 0 (0.0%) |
| 18 to 34 Years | 0 (0.0%) | 0 (0.0%) |
| 35 to 64 Years | 0 (0.0%) | 9 (22.0%) |
| 65 to 74 Years | 0 (0.0%) | 0 (0.0%) |
| 75 Years and over | 0 (0.0%) | 0 (0.0%) |
Disability Class by Sex by Age in Chula Vista CDP Cameron County
Disability Class: Hearing Difficulty
| Age Bracket | Male | Female |
| Under 5 Years | 0 (0.0%) | 0 (0.0%) |
| 5 to 17 Years | 0 (0.0%) | 0 (0.0%) |
| 18 to 34 Years | 0 (0.0%) | 0 (0.0%) |
| 35 to 64 Years | 0 (0.0%) | 0 (0.0%) |
| 65 to 74 Years | 0 (0.0%) | 0 (0.0%) |
| 75 Years and over | 0 (0.0%) | 0 (0.0%) |
Disability Class: Vision Difficulty
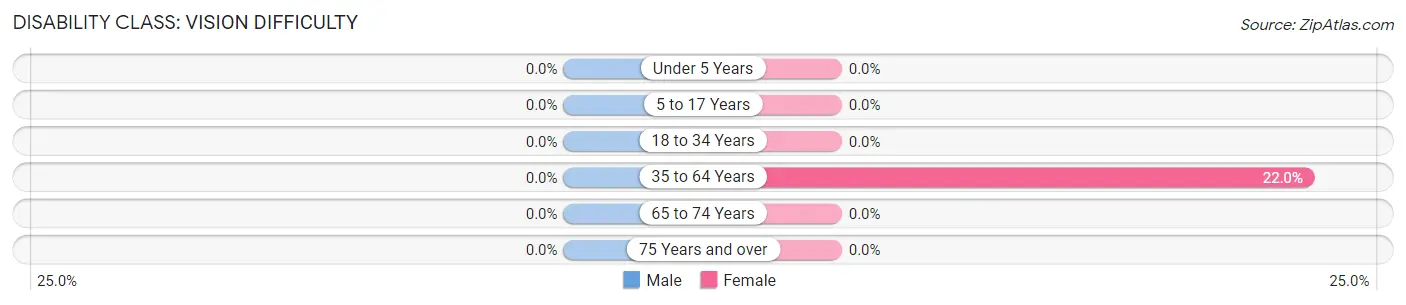
| Age Bracket | Male | Female |
| Under 5 Years | 0 (0.0%) | 0 (0.0%) |
| 5 to 17 Years | 0 (0.0%) | 0 (0.0%) |
| 18 to 34 Years | 0 (0.0%) | 0 (0.0%) |
| 35 to 64 Years | 0 (0.0%) | 9 (22.0%) |
| 65 to 74 Years | 0 (0.0%) | 0 (0.0%) |
| 75 Years and over | 0 (0.0%) | 0 (0.0%) |
Disability Class: Cognitive Difficulty
| Age Bracket | Male | Female |
| 5 to 17 Years | 0 (0.0%) | 0 (0.0%) |
| 18 to 34 Years | 0 (0.0%) | 0 (0.0%) |
| 35 to 64 Years | 0 (0.0%) | 0 (0.0%) |
| 65 to 74 Years | 0 (0.0%) | 0 (0.0%) |
| 75 Years and over | 0 (0.0%) | 0 (0.0%) |
Disability Class: Ambulatory Difficulty
| Age Bracket | Male | Female |
| 5 to 17 Years | 0 (0.0%) | 0 (0.0%) |
| 18 to 34 Years | 0 (0.0%) | 0 (0.0%) |
| 35 to 64 Years | 0 (0.0%) | 0 (0.0%) |
| 65 to 74 Years | 0 (0.0%) | 0 (0.0%) |
| 75 Years and over | 0 (0.0%) | 0 (0.0%) |
Disability Class: Self-Care Difficulty
| Age Bracket | Male | Female |
| 5 to 17 Years | 0 (0.0%) | 0 (0.0%) |
| 18 to 34 Years | 0 (0.0%) | 0 (0.0%) |
| 35 to 64 Years | 0 (0.0%) | 0 (0.0%) |
| 65 to 74 Years | 0 (0.0%) | 0 (0.0%) |
| 75 Years and over | 0 (0.0%) | 0 (0.0%) |
Technology Access in Chula Vista CDP Cameron County
Computing Device Access in Chula Vista CDP Cameron County
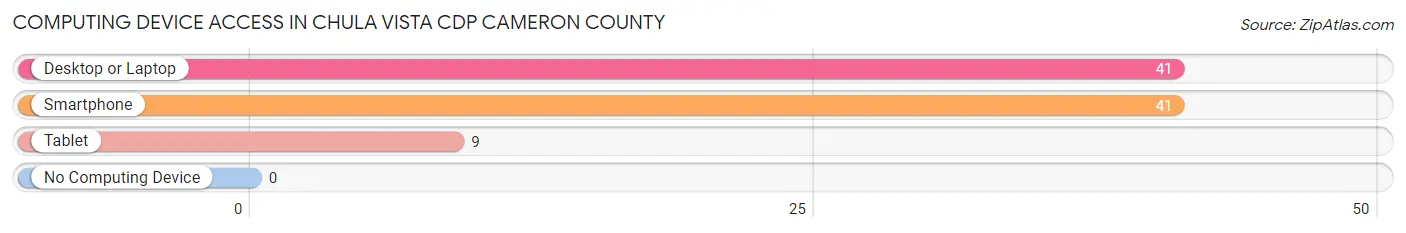
| Device Type | # Households | % Households |
| Desktop or Laptop | 41 | 100.0% |
| Smartphone | 41 | 100.0% |
| Tablet | 9 | 22.0% |
| No Computing Device | 0 | 0.0% |
| Total | 41 | 100.0% |
Internet Access in Chula Vista CDP Cameron County
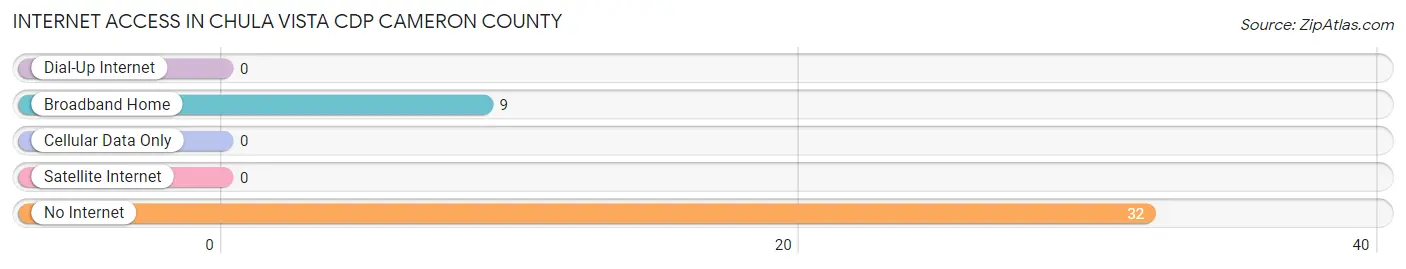
| Internet Type | # Households | % Households |
| Dial-Up Internet | 0 | 0.0% |
| Broadband Home | 9 | 22.0% |
| Cellular Data Only | 0 | 0.0% |
| Satellite Internet | 0 | 0.0% |
| No Internet | 32 | 78.0% |
| Total | 41 | 100.0% |
Chula Vista CDP Cameron County Summary
Chula Vista Cdp is a census-designated place (CDP) located in Cameron County, Texas. It is situated in the Rio Grande Valley, approximately 10 miles east of Brownsville and the Mexican border. The population of Chula Vista Cdp was 2,845 at the 2010 census.
Geography
Chula Vista Cdp is located at 26°10'17" North, 97°27'45" West (26.1714, -97.4625). It has an area of 1.2 square miles, all of which is land.
History
Chula Vista Cdp was founded in the early 1900s by Mexican immigrants who were looking for a place to settle and start a new life. The area was originally known as “Chula Vista”, which translates to “beautiful view” in Spanish. The name was chosen to reflect the stunning views of the Rio Grande Valley.
The area was initially a farming community, with many of the residents growing cotton, corn, and other crops. In the 1950s, the area began to experience rapid growth as more people moved to the area in search of employment opportunities. This growth was further accelerated by the construction of the nearby Port of Brownsville in the 1970s.
Economy
The economy of Chula Vista Cdp is largely based on agriculture and tourism. The area is home to several large farms that produce cotton, corn, and other crops. The area is also a popular tourist destination, with many visitors coming to enjoy the stunning views of the Rio Grande Valley.
In addition to agriculture and tourism, Chula Vista Cdp is home to several small businesses, including restaurants, retail stores, and service providers. The area is also home to several industrial parks, which provide employment opportunities for local residents.
Demographics
As of the 2010 census, the population of Chula Vista Cdp was 2,845. The racial makeup of the area was 79.3% Hispanic or Latino, 19.2% White, 0.7% African American, 0.2% Native American, 0.1% Asian, and 0.5% from other races.
The median household income in Chula Vista Cdp was $25,938, and the median family income was $30,938. The per capita income was $12,938. About 24.3% of families and 28.3% of the population were below the poverty line.
Conclusion
Chula Vista Cdp is a census-designated place located in Cameron County, Texas. It is situated in the Rio Grande Valley, approximately 10 miles east of Brownsville and the Mexican border. The population of Chula Vista Cdp was 2,845 at the 2010 census. The economy of Chula Vista Cdp is largely based on agriculture and tourism, with many of the residents working in the local farms or in the nearby industrial parks. The racial makeup of the area was 79.3% Hispanic or Latino, 19.2% White, 0.7% African American, 0.2% Native American, 0.1% Asian, and 0.5% from other races. The median household income in Chula Vista Cdp was $25,938, and the median family income was $30,938. About 24.3% of families and 28.3% of the population were below the poverty line.
Common Questions
What is Per Capita Income in Chula Vista CDP Cameron County?
Per Capita income in Chula Vista CDP Cameron County is $11,626.
What is Inequality or Gini Index in Chula Vista CDP Cameron County?
Inequality or Gini Index in Chula Vista CDP Cameron County is 0.07.
What is the Total Population of Chula Vista CDP Cameron County?
Total Population of Chula Vista CDP Cameron County is 121.
What is the Total Male Population of Chula Vista CDP Cameron County?
Total Male Population of Chula Vista CDP Cameron County is 43.
What is the Total Female Population of Chula Vista CDP Cameron County?
Total Female Population of Chula Vista CDP Cameron County is 78.
What is the Ratio of Males per 100 Females in Chula Vista CDP Cameron County?
There are 55.13 Males per 100 Females in Chula Vista CDP Cameron County.
What is the Ratio of Females per 100 Males in Chula Vista CDP Cameron County?
There are 181.40 Females per 100 Males in Chula Vista CDP Cameron County.
What is the Median Population Age in Chula Vista CDP Cameron County?
Median Population Age in Chula Vista CDP Cameron County is 48.2 Years.
What is the Average Family Size in Chula Vista CDP Cameron County
Average Family Size in Chula Vista CDP Cameron County is 3.0 People.
What is the Average Household Size in Chula Vista CDP Cameron County
Average Household Size in Chula Vista CDP Cameron County is 3.0 People.
How Large is the Labor Force in Chula Vista CDP Cameron County?
There are 43 People in the Labor Forcein in Chula Vista CDP Cameron County.
What is the Percentage of People in the Labor Force in Chula Vista CDP Cameron County?
51.2% of People are in the Labor Force in Chula Vista CDP Cameron County.